


1. Introduction
Let z be a number represented as an expectation $z\, {\equals}\, {\Bbb E}Z$
. The crude Monte Carlo (CrMC) method for estimating z proceeds by simulating R replications Z
1, … , Z
R
of Z and returning the average
$z\, {\equals}\, {\Bbb E}Z$
. The crude Monte Carlo (CrMC) method for estimating z proceeds by simulating R replications Z
1, … , Z
R
of Z and returning the average $\bar{z}\, {\equals}\, \left( {Z_{1} {\plus} \cdots {\plus}Z_{R} } \right)\,/\,R$
as a point estimate. The uncertainty is reported as an asymptotic confidence interval based on the central limit theorem (CLT); e.g., the two-sided 95% confidence interval is
$\bar{z}\, {\equals}\, \left( {Z_{1} {\plus} \cdots {\plus}Z_{R} } \right)\,/\,R$
as a point estimate. The uncertainty is reported as an asymptotic confidence interval based on the central limit theorem (CLT); e.g., the two-sided 95% confidence interval is $\bar{z}\,\pm\,1.96\,\:s\,/\,R^{{1\,/\,2}} $
where s
2 is the empirical variance of the sample Z
1, … , Z
R
.
$\bar{z}\,\pm\,1.96\,\:s\,/\,R^{{1\,/\,2}} $
where s
2 is the empirical variance of the sample Z
1, … , Z
R
.
The more refined conditional Monte Carlo (CdMC) method uses a piece of information collected in a σ-field ${\cal F}$
and is implemented by performing CrMC with Z replaced by
${\cal F}$
and is implemented by performing CrMC with Z replaced by $Z_{{{\rm Cond}}} \, {\equals}\, {\Bbb E}[Z\:\,\mid\,\:{\cal F}]$
. It is traditionally classified as a variance reduction method but it can also be used for smoothing, though this is much less appreciated.
$Z_{{{\rm Cond}}} \, {\equals}\, {\Bbb E}[Z\:\,\mid\,\:{\cal F}]$
. It is traditionally classified as a variance reduction method but it can also be used for smoothing, though this is much less appreciated.
Both aspects are well illustrated via the problem of estimating ${\Bbb P}\left( {S_{n} \leq x} \right)$
where
${\Bbb P}\left( {S_{n} \leq x} \right)$
where $S_{n} \, {\equals}\, X_{1} {\plus} \cdots {\plus}X_{n} $
is a sum of r.v.’s. The obvious choice for CrMC is
$S_{n} \, {\equals}\, X_{1} {\plus} \cdots {\plus}X_{n} $
is a sum of r.v.’s. The obvious choice for CrMC is $Z\, {\equals}\, Z\left( x \right)\, {\equals}\, {\Bbb I}\left( {S_{n} \leq x} \right)$
. For CdMC, a simple possibility is to take
$Z\, {\equals}\, Z\left( x \right)\, {\equals}\, {\Bbb I}\left( {S_{n} \leq x} \right)$
. For CdMC, a simple possibility is to take ${\cal F}\, {\equals}\, \sigma \left( {X_{1} ,\,\,\ldots\,\,,X_{{n{\minus}1}} } \right)$
. In the case where X
1, X
2, … are i.i.d. with common distribution F one then has
${\cal F}\, {\equals}\, \sigma \left( {X_{1} ,\,\,\ldots\,\,,X_{{n{\minus}1}} } \right)$
. In the case where X
1, X
2, … are i.i.d. with common distribution F one then has
 $$Z_{{{\rm Cond}}} \, {\equals}\, {\Bbb P}\left( {S_{n} \leq x\:\,\mid\,\:X_{1} ,\,\,\ldots\,\,,X_{{n{\minus}1}} } \right)\, {\equals}\, F\left( {x{\minus}S_{{n{\minus}1}} } \right)$$
This estimator has two noteworthy properties:
∙ for a fixed x its variance is smaller than that of ${\Bbb I}\left( {S_{n} \leq x} \right)$
used in the CrMC method; and
${\Bbb I}\left( {S_{n} \leq x} \right)$
used in the CrMC method; and∙ when averaged over the number R of replications, it leads to estimates of
${\Bbb P}\left( {S_{n} \leq x} \right)$
which are smoother as function of x∈(−∞, ∞) than the more traditional empirical c.d.f. of R simulated replicates of S
n
.


This last property is easily understood for a continuous F, where Z Cond(x)=F(x−S n−1) is again continuous and therefore averages are also. In contrast, the empirical c.d.f. always has jumps. It also suggests that f(x−S n−1) may be an interesting candidate for estimating the density f n (x) of S n when F itself admits a density f(x). In fact, density estimation is a delicate topic where traditional methods such as kernel smoothing or finite differences often involve tedious and ad hoc tuning of parameters like choice of kernel, window size, etc.
The variance reduction property holds in complete generality by the general principle (known as Rao–Blackwellization in statistics) that conditioning reduces variance:
 $${\Bbb V}ar\, Z\, {\equals}\, {\Bbb E}\left[ {{\Bbb V}ar\left[ {Z\:\,\mid\,\:{\cal F}} \right]} \right]{\plus}{\Bbb V}ar\left[ {{\Bbb E}\left[ {Z\:\,\mid\,\:{\cal F}} \right]} \right]\geq {\Bbb V}ar\left[ {{\Bbb E}\left[ {Z\:\,\mid\,\:{\cal F}} \right]} \right]\, {\equals}\, {\Bbb V}ar\,Z_{{{\rm Cond}}} $$
In view of the huge literature on variance reduction, this may appear appealing but it also has some caveats inherent in the choice of ${\cal F}\,\colon\,\,{\Bbb E}\left[ {Z\,\mid\,{\cal F}} \right]$
must be computable and have a variance that is substantially smaller than that of Z. Namely, if CdMC reduces the variance on Z of Z
Cond by a factor of τ<1, the same variance on the average could be obtained by taking 1/τ as many replications in CrMC as in CdMC, see Asmussen & Glynn (Reference Asmussen and Glynn2007: 126). This point is often somewhat swept under the carpet!
${\cal F}\,\colon\,\,{\Bbb E}\left[ {Z\,\mid\,{\cal F}} \right]$
must be computable and have a variance that is substantially smaller than that of Z. Namely, if CdMC reduces the variance on Z of Z
Cond by a factor of τ<1, the same variance on the average could be obtained by taking 1/τ as many replications in CrMC as in CdMC, see Asmussen & Glynn (Reference Asmussen and Glynn2007: 126). This point is often somewhat swept under the carpet!
The present paper discusses such issues related to the CdMC method via the example of inference on the distribution of a sum $S_{n} \, {\equals}\, X_{1} {\plus} \cdots {\plus}X_{n} $
. Here the X
i
are assumed i.i.d. in sections 2–7, but we look into dependence in some detail in section 8, whereas a few comments on different marginals are given in section 9.
$S_{n} \, {\equals}\, X_{1} {\plus} \cdots {\plus}X_{n} $
. Here the X
i
are assumed i.i.d. in sections 2–7, but we look into dependence in some detail in section 8, whereas a few comments on different marginals are given in section 9.
The motivation comes, to a large extent, from problems in insurance and finance such as assessing the form of the density of the loss distribution, estimating the tail of the aggregated claims in insurance, calculating the Value-at-Risk (VaR) or expected shortfall of a portfolio, etc. In many such cases, the tail of the distribution of S
n
is of particular interest, with the relevant tail probabilities being of order 10−2–10−4 (but note that in other application areas, the relevant order is much lower, say 10−8–10−12 in telecommunications). By “tail” we are not just thinking of the right tail, i.e., ${\Bbb P}\left( {S_{n} \,\gt\,x} \right)$
for large x, which is relevant for the aggregated claims and portfolios with short positions. Also the left tail
${\Bbb P}\left( {S_{n} \,\gt\,x} \right)$
for large x, which is relevant for the aggregated claims and portfolios with short positions. Also the left tail ${\Bbb P}\left( {S_{n} \leq x} \right)$
for small x comes up in a natural way, in particular for portfolios with long positions, but has received much less attention until the recent studies by Asmussen et al. (Reference Asmussen, Jensen and Rojas-Nandayapa2016) and Gulisashvili & Tankov (Reference Gulisashvili and Tankov2016).
${\Bbb P}\left( {S_{n} \leq x} \right)$
for small x comes up in a natural way, in particular for portfolios with long positions, but has received much less attention until the recent studies by Asmussen et al. (Reference Asmussen, Jensen and Rojas-Nandayapa2016) and Gulisashvili & Tankov (Reference Gulisashvili and Tankov2016).
The most noted use of CdMC in the insurance/finance/rare-event area appears to be the algorithm of Asmussen & Kroese (Reference Asmussen and Kroese2006) for calculating the right tail of a heavy-tailed sum. A main application is ruin probabilities. We give references and put this in perspective to the more general problems of the present paper in section 4. Otherwise, the use of CdMC in insurance and finance seem to be remarkably few compared to other MC-based tools such as importance sampling (IS), stratification, simulation-based estimation of sensitivities (Greeks), just to name a few (see Glasserman, Reference Glasserman2004, for these and other examples). Some exceptions are Fu et al. (Reference Fu, Hong and Hu2009) who study an CdMC estimator of a sensitivity of a quantile (not the quantile itself!) with respect to a model parameter, and Chu & Nakayama (Reference Chu and Nakayama2012) who give a detailed mathematical derivation of the CLT for quantiles estimated in a CdMC set-up, based on methodology from Bahadur (Reference Bahadur1966) and Ghosh (Reference Ghosh1971) (see also Nakayama, Reference Nakayama2014).
1.1. Conventions
Throughout the paper, Φ(x) denotes the standard normal c.d.f., $\bar{\Phi }(x)\, {\equals}\, 1{\minus}\Phi (x)$
its tail and
$\bar{\Phi }(x)\, {\equals}\, 1{\minus}\Phi (x)$
its tail and $\varphi (x)\, {\equals}\, {\rm e}^{{{\minus}x^{2} \,/\,2}} \,/\,\sqrt {2\pi } $
the standard normal p.d.f. For the γ(α, λ) distribution, α is the shape parameter and λ the rate so that the density is x
α−1 λ
α
e−λx
/Γ(α).
$\varphi (x)\, {\equals}\, {\rm e}^{{{\minus}x^{2} \,/\,2}} \,/\,\sqrt {2\pi } $
the standard normal p.d.f. For the γ(α, λ) distribution, α is the shape parameter and λ the rate so that the density is x
α−1 λ
α
e−λx
/Γ(α).
Because of the financial relevance, an example that will be used frequently used is X to be Lognormal(0, 1), i.e., the summands in S n to be of the form X=e V with V Normal(0, 1), and n=10. Note that the mean of V is just a scaling factor and hence unimportant. In contrast, the variance (and the value of n) matters quite of lot for the shape of the distribution of S n , but to be definite, we took it to be one. We refer to this set of parameters as our recurrent example, and many other examples are taken as smaller or larger modifications.
2. Density Estimation
If F has a density f, then S n has density f n given as an integral over a hyperplane:
 $$f_{n} \left( x \right)\, {\equals}\, f^{{{\asterisk}n}} \left( x \right)\, {\equals}\, \mathop{\int}_{x_{1} {\plus} \cdots {\plus}x_{n} \, {\equals}\, x} {f\left( {x_{1} } \right)\, \cdots \,f\left( {x_{n} } \right)\,dx_{1} \, \cdots \,dx_{n} } $$
Such convolution integrals can only be evaluated numerically for rather small n, and we shall here consider the estimator f(x−S
n−1) of f
n
(x). Because of the analogy with (1.1), it seems reasonable to classify this estimator within the CdMC area, but it should be noted that there is no apparent natural unbiased estimator Z of f
n
(x) for which ${\Bbb E}\left[ {Z\:\,\mid\,\:X_{1} ,\,\,\ldots\,\,,X_{{n{\minus}1}} } \right]\, {\equals}\, f\left( {x{\minus}S_{n} _{{{\minus}{\rm }1}} } \right)$
. Of course, intuitively
${\Bbb E}\left[ {Z\:\,\mid\,\:X_{1} ,\,\,\ldots\,\,,X_{{n{\minus}1}} } \right]\, {\equals}\, f\left( {x{\minus}S_{n} _{{{\minus}{\rm }1}} } \right)$
. Of course, intuitively
 $${\Bbb P}\left( {S_{n} \in{\rm d}x\,\mid\,\:X_{1} ,\,\,\ldots\,\,,X_{{n{\minus}1}} } \right)\, {\equals}\, f\left( {x{\minus}S_{{n{\minus}1}} } \right)$$
but ${\Bbb I}\left( {S_{n} \in{\rm d}x} \right)$
is not a well-defined r.v.! Nevertheless:
${\Bbb I}\left( {S_{n} \in{\rm d}x} \right)$
is not a well-defined r.v.! Nevertheless:
Proposition 2.1 The estimator f(x−S n−1) of f n (x) is unbiased.
Proof:
 $${\Bbb E}f\left( {x{\minus}S_{{n{\minus}1}} } \right)\, {\equals}\, {\int} {f_{{n{\minus}1}} \left( y \right)f\left( {x{\minus}y} \right)\,dy\, {\equals}\, f_{n} \left( x \right)} $$
□
$${\Bbb E}f\left( {x{\minus}S_{{n{\minus}1}} } \right)\, {\equals}\, {\int} {f_{{n{\minus}1}} \left( y \right)f\left( {x{\minus}y} \right)\,dy\, {\equals}\, f_{n} \left( x \right)} $$
□
Unbiasedness is in fact quite a virtue in itself, since the more traditional kernel and finite difference estimators are not so! It also implies consistency, i.e. that the average over R replications converges to the correct value f n (x) as R→∞.
Because of the lack of an obvious CrMC comparison, we shall not go into detailed properties of ${\Bbb V}ar\left[ {f\left( {x{\minus}S_{{n{\minus}1}} } \right)} \right]$
; one expects such a study to be quite similar to the one in section 3 dealing with
${\Bbb V}ar\left[ {f\left( {x{\minus}S_{{n{\minus}1}} } \right)} \right]$
; one expects such a study to be quite similar to the one in section 3 dealing with ${\Bbb V}ar\left[ {F\left( {x{\minus}S_{{n{\minus}1}} } \right)} \right]$
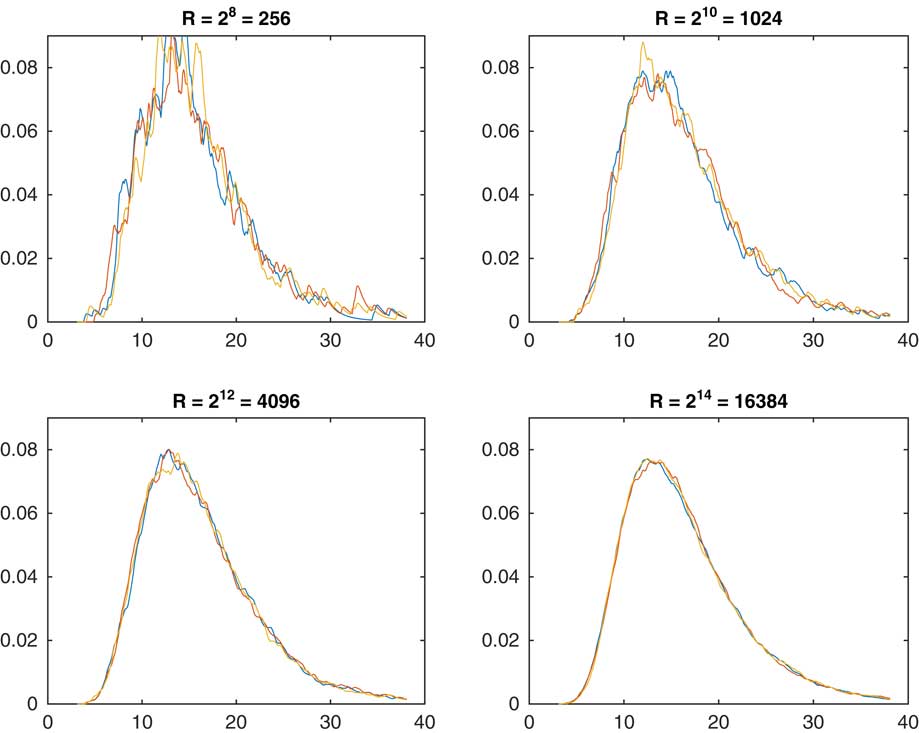
. Instead, we shall give some numerical examples. Figure 1 illustrates the influence on the R of replications. For each of the four values R=28, 210, 212, 214 we performed three sets of simulation, to assess the degree of randomness inherent in R being finite. Obviously, R=214≈ 16,000 is almost perfect but the user may go for a substantially smaller value depending on how much the random variation and the smoothness is a concern.
${\Bbb V}ar\left[ {F\left( {x{\minus}S_{{n{\minus}1}} } \right)} \right]$
. Instead, we shall give some numerical examples. Figure 1 illustrates the influence on the R of replications. For each of the four values R=28, 210, 212, 214 we performed three sets of simulation, to assess the degree of randomness inherent in R being finite. Obviously, R=214≈ 16,000 is almost perfect but the user may go for a substantially smaller value depending on how much the random variation and the smoothness is a concern.
Estimated density of S n as function of R.
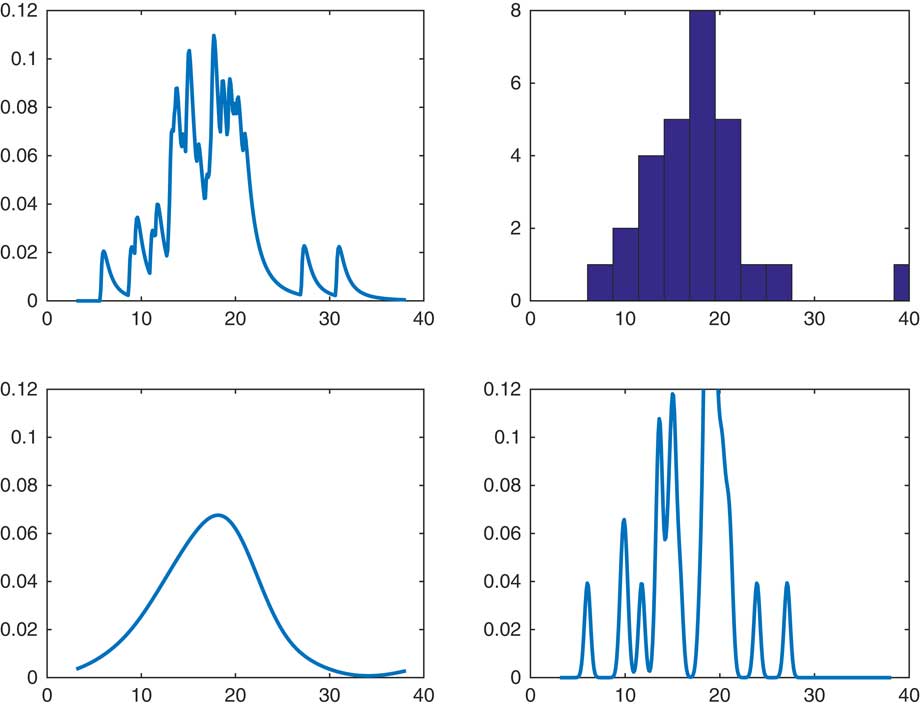
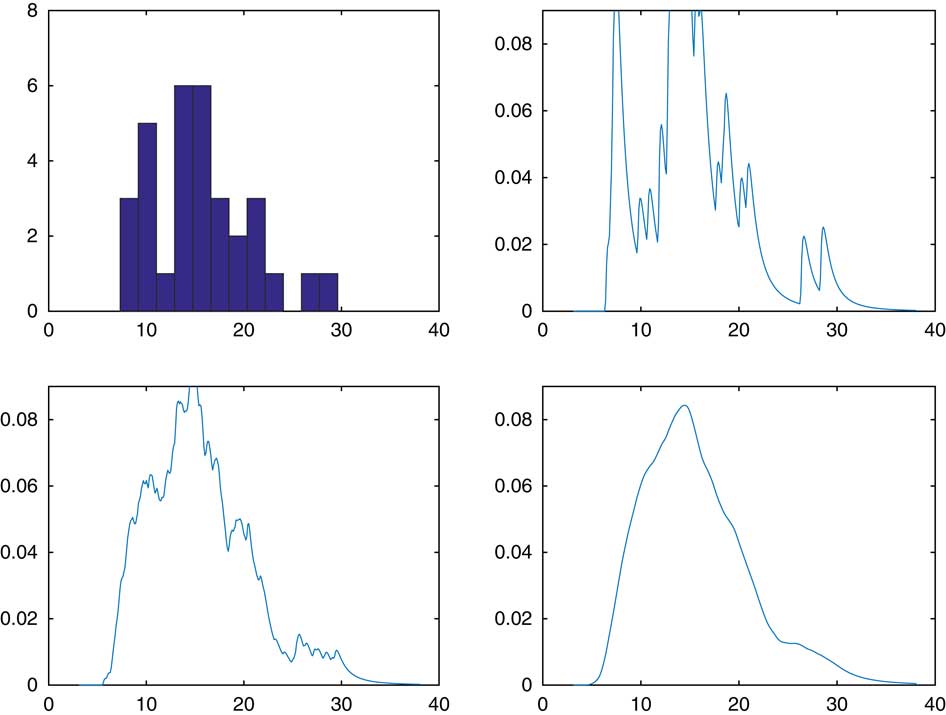
A reasonable question is the comparison of CdMC and a kernel estimate of the form k(x−S n ) for small or moderate R. In Figure 2, we considered our recurrent example of sum of lognormals, but took R=32 for both of the estimators f(x−S n−1) and k(x−S n ), with k chosen as the Normal(0, σ 2) density. The upper right panel is a histogram of the 32 simulated values of S n and the upper left the CdMC estimator. The two lower panels are the kernel estimates, with an extreme high value σ 2=102 to the left and an extreme low σ 2=10−2 to the right. A high value will produce oversmoothed estimates and a low undersmoothed ones with a marked effect of single observations. However, for R as small as 32 it is hard to assess what is a reasonable value of σ 2. In fairness, we also admit that the single observation effect is clearly visible for the CdMC estimator and that it leads to estimates which are undersmoothed. By this we mean more precisely that if f is in C p for some p=0, 1, … , then f n (x) is in C np but f(x−S n−1) only in C p . In contrast, a normal kernel estimate is in C ∞.
Comparison with kernel smoothing.
The first example of CdMC density estimation we know of is in Asmussen & Glynn (Reference Asmussen and Glynn2007: 146), but in view of the simplicity of the idea, there may well have been earlier instances. We return to some further aspects of the methodology in section 7. For somewhat different uses of conditioning for smoothing, see L’Ecuyer & Perron (Reference L’Ecuyer and Perron1994), Fu & Hu (Reference Fu and Hu1997) and L’Ecuyer & Lemieux (Reference L’Ecuyer and Lemieux2000), aections 10.1–10.2.
3. Variance Reduction for the c.d.f.
CdMC always gives variance reduction. But as argued, it needs to be substantial for the procedure to be worthwhile. Further in many applications the right and/or left tail is of particular interest, so one may pay particular attention to the behaviour there.
Remark 3.1
That CdMC gives variance reduction in the tails can be seen intuitively by the following direct argument without reference to Rao–Blackwellization. The CrMC, respectively, the CdMC, estimators of $\overline{F} _{n} \left( x \right)$
are
$\overline{F} _{n} \left( x \right)$
are ${\Bbb I}\left( {S_{n} \,\gt\,x} \right)$
and
${\Bbb I}\left( {S_{n} \,\gt\,x} \right)$
and $\overline{F} \left( {x{\minus}S_{{n{\minus}1}} } \right)$
, with second moments
$\overline{F} \left( {x{\minus}S_{{n{\minus}1}} } \right)$
, with second moments
 $${\Bbb E}{\Bbb I}\left( {S_{n} \,\gt\,x} \right)^{2} \, {\equals}\, {\Bbb E}{\Bbb I}\left( {S_{n} \,\gt\,x} \right)\, {\equals}\, {\int}_{{\minus}\infty}^\infty {f_{{n{\minus}1}} \left( y \right)\overline{F} \left( {x{\minus}y} \right)\,dy} $$
 $$\qquad \qquad \qquad \mathop{\, {\equals}\, }\limits^{{X\geq 0}} \;{\Bbb P}\left( {S_{{n{\minus}1}} \,\gt\,x} \right){\plus}{\int}_0^x {f_{{n{\minus}1}} \left( y \right)\overline{F} \left( {x{\minus}y} \right)\,dy} $$
 $${\Bbb E}\overline{F} \left( {x{\minus}S_{{n{\minus}1}} } \right)^{2} \, {\equals}\, {\int}_{{\minus}\infty}^\infty {f_{{n{\minus}1}} \left( y \right)\overline{F} \left( {x{\minus}y} \right)^{2} \,dy} $$
 $$\qquad \qquad \qquad \qquad \qquad \qquad \mathop{\, {\equals}\, }\limits^{{X\geq 0}} \;{\Bbb P}\left( {S_{{n{\minus}1}} \,\gt\,x} \right){\plus}{\int}_0^x {f_{{n{\minus}1}} \left( y \right)\overline{F} \left( {x{\minus}y} \right)^{2} \,dy} $$
In the right tail (say), these second moments can be interpreted as the tails of the r.v.’s S
n−1+X, S
n−1+X
* where X, X
* are independent of S
n−1 and have tails $\overline{F} $
and
$\overline{F} $
and $\overline{F} ^{2} $
. Since
$\overline{F} ^{2} $
. Since $\overline{F} ^{2} \left( x \right)$
is of smaller order than
$\overline{F} ^{2} \left( x \right)$
is of smaller order than $\overline{F} \left( x \right)$
in the right tail, the tail of S
n−1+X
* should be of smaller order than that of S
n−1+X, implying the same ordering of the second moments. However, as n becomes large one also expects the tail of S
n−1 to more and more dominate the tails of X, X
* so that the difference should be less and less marked. The analysis to follow will confirm these guesses.
$\overline{F} \left( x \right)$
in the right tail, the tail of S
n−1+X
* should be of smaller order than that of S
n−1+X, implying the same ordering of the second moments. However, as n becomes large one also expects the tail of S
n−1 to more and more dominate the tails of X, X
* so that the difference should be less and less marked. The analysis to follow will confirm these guesses.
A measure of performance which we consider is the ratio r n (x) of the CdMC variance to the CrMC variance:
 $$r_{n} \left( x \right)\, {\equals}\, {{{\Bbb V}ar\left[ {\overline{F} \left( {x{\minus}S_{{n{\minus}1}} } \right)} \right]} \over {F_{n} \left( x \right)\overline{F} _{n} \left( x \right)}}\, {\equals}\, {{{\Bbb V}ar\left[ {F\left( {x{\minus}S_{{n{\minus}1}} } \right)} \right]} \over {F_{n} \left( x \right)\overline{F} _{n} \left( x \right)}}$$
(note that the two alternative expressions reflect that the variance reduction, is the same whether CdMC is performed for F itself or the tail
 $$\overline{F} $$
).
$$\overline{F} $$
).
To provide some initial insight, we examine in Figure 3, r
n
(x
n, z
) as function of z where x
n, z
is the z-quantile of S
n
. In Figure 3(a), the underlying F is Pareto with tail $\overline{F} \left( x \right)\, {\equals}\, 1\,/\,\left( {1{\plus}x} \right)^{{3\,/\,2}} $
and in Figure 3(b), it is standard normal. Both figures consider the cases of a sum of n=2, 5 or 10 terms and use R=250,000 replications of the vector Y
1, … , Y
n−1 (variances are more difficult to estimate than means, therefore the high value of R). The dotted line for AK (the Asmussen-Kroese estimator, see section 4) may be ignored for the moment. The argument z on the horizontal axis is in log10-scale, and x
n, z
was taken as the exact value for the normal case and the CdMC estimate for the Pareto case.
$\overline{F} \left( x \right)\, {\equals}\, 1\,/\,\left( {1{\plus}x} \right)^{{3\,/\,2}} $
and in Figure 3(b), it is standard normal. Both figures consider the cases of a sum of n=2, 5 or 10 terms and use R=250,000 replications of the vector Y
1, … , Y
n−1 (variances are more difficult to estimate than means, therefore the high value of R). The dotted line for AK (the Asmussen-Kroese estimator, see section 4) may be ignored for the moment. The argument z on the horizontal axis is in log10-scale, and x
n, z
was taken as the exact value for the normal case and the CdMC estimate for the Pareto case.
The ratio r n (z) in (3.5), with F Pareto in (a) and normal in (b).
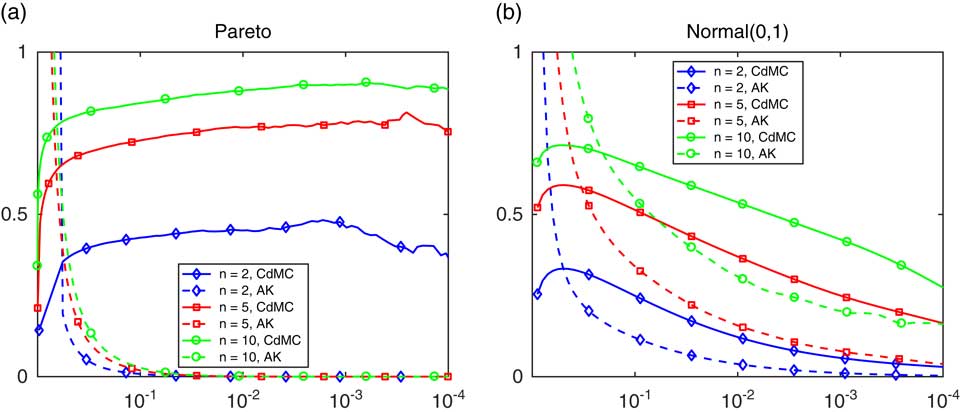
For the Pareto case in Figure 3(a), it seems that the variance reduction is decreasing in both x and n, yet in fact it is only substantial in the left tail. For the normal case, note that there should be symmetry around x=0, corresponding to z(x)=1/2 with base-10 logarithm −0.30. This is confirmed by the figure (though the feature is of course somewhat disguised by the logarithmic scale). In contrast to the Pareto case, it seems that the variance reduction is very big in the right (and therefore also left) tail but also that it decreases as n increases.
We proceed to a number of theoretical results supporting these empirical findings. They all use formulas (3.3) and (3.4) for the second moments of the CdMC estimators. For the exponential distribution, the calculations are particularly simple:
Example 3.2
Assume $\overline{F} \left( x \right)\, {\equals}\, {\rm e}^{{{\minus}x}} $
, n=2. Then
$\overline{F} \left( x \right)\, {\equals}\, {\rm e}^{{{\minus}x}} $
, n=2. Then ${\Bbb P}\left( {X_{1} {\plus}X_{2} \,\gt\,x} \right)\, {\equals}\, x{\rm e}^{{{\minus}x}} {\plus}{\rm e}^{{{\minus}x}} $
and (5) takes the form
${\Bbb P}\left( {X_{1} {\plus}X_{2} \,\gt\,x} \right)\, {\equals}\, x{\rm e}^{{{\minus}x}} {\plus}{\rm e}^{{{\minus}x}} $
and (5) takes the form
 $$\overline{F} \left( x \right){\plus}{\int}_0^x {{\rm e}^{{{\minus}y}} {\rm e}^{{{\minus}2(x{\minus}y)}} \,dy} \, {\equals}\, {\rm e}^{{{\minus}x}} {\plus}{\rm e}^{{{\minus}2x}} \left( {{\rm e}^{x} {\minus}1} \right)\, {\equals}\, 2{\rm e}^{{{\minus}x}} {\minus}{\rm e}^{{{\minus}2x}} $$
and so for the right tail:
 $$r_{2} \left( x \right)\, {\equals}\, {{2{\rm e}^{{{\minus}x}} {\minus}{\rm e}^{{{\minus}2x}} {\minus}\left( {x{\rm e}^{{{\minus}x}} {\plus}{\rm e}^{{{\minus}x}} } \right)^{2} } \over {\left( {x{\rm e}^{{{\minus}x}} {\plus}{\rm e}^{{{\minus}x}} } \right)\left( {1{\minus}x{\rm e}^{{{\minus}x}} {\minus}{\rm e}^{{{\minus}x}} } \right)}}$$
For x→∞, this gives
 $$r_{2} \left( x \right)\, {\equals}\, {{2{\rm e}^{{{\minus}x}} {\plus}{\rm o}\left( {{\rm e}^{{{\minus}x}} } \right)} \over {x{\rm e}^{{{\minus}x}} {\plus}{\rm o}\left( {x{\rm e}^{{{\minus}x}} } \right)}}\, {\equals}\, {2 \over x}\left( {1{\plus}{\rm o}(1)} \right)\to0$$
In the left tail x→0, Taylor expansion give that up to the third-order term
 $$2{\rm e}^{{{\minus}x}} {\minus}{\rm e}^{{{\minus}2x}} \,\sim\,1{\minus}x^{2} {\plus}x^{3} ,\;x{\rm e}^{{{\minus}x}} {\plus}{\rm e}^{{{\minus}x}} \, {\equals}\, 1{\minus}x^{2} \,/\,2{\plus}x^{3} \,/\,3\:$$
and so
 $$ \eqalignno{ r_{2} \left( x \right) & \,\sim\,{{1{\minus}x^{2} {\plus}x^{3} {\minus}\left( {1{\minus}x^{2} \,/\,2{\plus}x^{3} \,/\,3} \right)^{2} } \over {\left( {1{\minus}x^{2} {\plus}x^{3} } \right)\left( {x^{2} \,/\,2{\minus}x^{3} \,/\,6} \right)}} \cr & \,\sim\,\;{{1{\minus}x^{2} {\plus}x^{3} {\minus}\left( {1{\minus}x^{2} {\plus}2x^{3} \,/\,3} \right)} \over {x^{2} \,/\,2}}\, {\equals}\, {{2x} \over 3}\,\to\,0 $$
The relation r n (x)→0 in the left tail (i.e. as x→0) in the exponential example is in fact essentially a consequence of the support being bounded to the left:
Proposition 3.3
Assume X>0 and that the density f(x) satisfies $f\left( x \right)\,\sim\,cx^{p} $
as x→0 for some c>0 and some p> −1. Then
$f\left( x \right)\,\sim\,cx^{p} $
as x→0 for some c>0 and some p> −1. Then $r_{n} \left( x \right)\,\sim\,dx^{{p{\plus}1}} $
as x→0 for some 0<d=d(n)<∞.
$r_{n} \left( x \right)\,\sim\,dx^{{p{\plus}1}} $
as x→0 for some 0<d=d(n)<∞.
The following result explains the right tail behaviour in the Pareto example and shows that this extends to other standard heavy-tailed distributions like the lognormal or Weibull with decreasing failure rate (for subexponential distributions, see, e.g. Embrechts et al., Reference Embrechts, Klüppelberg and Mikosch1997):
Proposition 3.4 Assume X>0 is subexponential. Then r n (x)→1−1/n as x→∞.
For light tails, Example 3.2 features a different behaviour in the right tail, namely r n (x)→0. Here is one more such light-tailed example:
Proposition 3.5 If X is standard normal, then r n (x)→0 as x→∞. More precisely,
 $$r_{n} \left( x \right)\,\sim\,{1 \over x}\sqrt {{{2n{\minus}1} \over {n\pi }}} {\rm e}^{{{\minus}x^{2} \,/\,[2n(2n{\minus}1)]}} $$
The proofs of Propositions 3.3–3.5 are in the Appendix.
To formulate a result of type r
n
(x)→0 as x→∞ in a sufficiently broad class of light-tailed F encounters the difficulty that the general results giving the asymptotics of ${\Bbb P}\left( {S_{n} \,\gt\,x} \right)$
as x→∞ with n fixed are somewhat involved (the standard light-tailed asymptotics is for
${\Bbb P}\left( {S_{n} \,\gt\,x} \right)$
as x→∞ with n fixed are somewhat involved (the standard light-tailed asymptotics is for ${\Bbb P}\left( {S_{n} \,\gt\,bn} \right)$
as n→∞ with b fixed, cf. e.g. Jensen, Reference Jensen1995). It is possible to obtain more general versions of Example 3.2 for close-to-exponential tails by using results of Cline (Reference Cline1986) and of Proposition 3.5 for thinner tails by involving Balkema et al. (Reference Balkema, Klüppelberg and Resnick1993). However, the adaptation of Balkema et al. (Reference Balkema, Klüppelberg and Resnick1993) is rather technical and can be found in Asmussen et al. (Reference Asmussen, Hashorva, Laub and Taimre2017).
${\Bbb P}\left( {S_{n} \,\gt\,bn} \right)$
as n→∞ with b fixed, cf. e.g. Jensen, Reference Jensen1995). It is possible to obtain more general versions of Example 3.2 for close-to-exponential tails by using results of Cline (Reference Cline1986) and of Proposition 3.5 for thinner tails by involving Balkema et al. (Reference Balkema, Klüppelberg and Resnick1993). However, the adaptation of Balkema et al. (Reference Balkema, Klüppelberg and Resnick1993) is rather technical and can be found in Asmussen et al. (Reference Asmussen, Hashorva, Laub and Taimre2017).
One may note that the variance reduction is so moderate in the range of z considered in Figure 3(b) that CdMC may hardly be worthwhile for light tails except for possibly very small n. If variance reduction is a major concern, the obvious alternative is to use the standard IS algorithm which uses exponential change of measure (ECM). The r.v.’s X
1, … , X
n
are here generated from the exponentially twisted distribution with density $f_{\theta } \left( x \right){\rm \, {\equals}\, e}^{{\theta x}} f(x)\,/\,{\Bbb E}{\rm e}^{{\theta X}} $
, where θ should be chosen such that
$f_{\theta } \left( x \right){\rm \, {\equals}\, e}^{{\theta x}} f(x)\,/\,{\Bbb E}{\rm e}^{{\theta X}} $
, where θ should be chosen such that ${\Bbb E}_{\theta } S_{n} \, {\equals}\, x$
. The estimator of
${\Bbb E}_{\theta } S_{n} \, {\equals}\, x$
. The estimator of ${\Bbb P}\left( {S_{n} \,\gt\,x} \right)$
is
${\Bbb P}\left( {S_{n} \,\gt\,x} \right)$
is
 $${\rm e}^{{{\minus}\theta S_{n} }} \left[ {{\Bbb E}{\rm e}^{{\theta X}} } \right]^{n} {\Bbb I}\left( {S_{n} \,\gt\,x} \right)\:$$
see Asmussen & Glynn (Reference Asmussen and Glynn2007: 167–169) for more detail. Further variance reduction would be obtained by applying CdMC to (3.6) as implemented in the following example.
Example 3.6
To illustrate the potential of the IS-ECM algorithm, we consider the sum of n=10 r.v.’s which are γ(3,1) at the z=0.95, 0.99 quantiles x
z
. The exponentially twisted distribution is γ(3, 1−θ) and
 $${\Bbb E}_{\theta } S_{n} \, {\equals}\, x$$
means 3/(1−θ)=x, i.e. θ=1−3/(x/n). With R=100,000 replications, we obtained the values of r
n
(x) at the z quantiles for z=0.95, 0.99 given in Table 1. It is seen that IS-ECM indeed performs much better that CdMC, but that CdMC is also moderately useful for providing some further variance reduction.◊
$${\Bbb E}_{\theta } S_{n} \, {\equals}\, x$$
means 3/(1−θ)=x, i.e. θ=1−3/(x/n). With R=100,000 replications, we obtained the values of r
n
(x) at the z quantiles for z=0.95, 0.99 given in Table 1. It is seen that IS-ECM indeed performs much better that CdMC, but that CdMC is also moderately useful for providing some further variance reduction.◊
Variance reduction for sum of 10 gamma r.v.’s.

Note: CdMC, conditional Monte Carlo; IS, importance sampling; ECM, exponential change of measure.
A further financially relevant implementation of the IS-ECM algorithm is in Asmussen et al. (Reference Asmussen, Jensen and Rojas-Nandayapa2016) for lognormal sums. It is unconventional because it deals with the left tail (which is light) rather than the right tail (which is heavy) and because the ECM is not explicit but done in an approximately efficient way. Another IS algorithm for the left lognormal sum tail is in Gulisashvili & Tankov (Reference Gulisashvili and Tankov2016), but the numerical evidence of Asmussen et al. (Reference Asmussen, Jensen and Rojas-Nandayapa2016) makes its efficiency somewhat doubtful.
4. The AK Estimator
The idea underlying the estimator Z
AK(x) of Asmussen & Kroese (Reference Asmussen and Kroese2006) for $z\, {\equals}\, z\left( x \right)\, {\equals}\, {\Bbb P}\left( {S_{n} \,\gt\,x} \right)$
is to combine an exchangeability argument with CdMC. More precisely (for convenience assuming existence of densities to exclude multiple maxima) one has
$z\, {\equals}\, z\left( x \right)\, {\equals}\, {\Bbb P}\left( {S_{n} \,\gt\,x} \right)$
is to combine an exchangeability argument with CdMC. More precisely (for convenience assuming existence of densities to exclude multiple maxima) one has $z\, {\equals}\, n\,{\Bbb P}\left( {S_{n} \,\gt\,x,\:\,M_{n} \, {\equals}\, X_{n} } \right)$
, where
$z\, {\equals}\, n\,{\Bbb P}\left( {S_{n} \,\gt\,x,\:\,M_{n} \, {\equals}\, X_{n} } \right)$
, where $M_{k} \, {\equals}\, {{\rm max}}_{i\leq k} X_{i} $
. Applying CdMC with
$M_{k} \, {\equals}\, {{\rm max}}_{i\leq k} X_{i} $
. Applying CdMC with ${\cal F}\, {\equals}\, \sigma \left( {X_{1} ,\,\,\ldots\,\,,X_{{n{\minus}1}} } \right)$
to this expression the estimator comes out as
${\cal F}\, {\equals}\, \sigma \left( {X_{1} ,\,\,\ldots\,\,,X_{{n{\minus}1}} } \right)$
to this expression the estimator comes out as
 $$Z_{{{\rm AK}}} \left( x \right)\, {\equals}\, n\:\overline{F} \left( {M_{{n{\minus}1}} \vee\left( {x{\minus}S_{{n{\minus}1}} } \right)} \right)$$
There has been a fair amount of follow-up work on Asmussen & Kroese (Reference Asmussen and Kroese2006) and sharpened versions, see in particular Hartinger and & Kortschak (Reference Hartinger and Kortschak2009), Chan & Kroese (Reference Chan and Kroese2011), Asmussen et al. (Reference Asmussen, Blanchet, Juneja and Rojas-Nandayapa2011), Asmussen & Kortschak (Reference Asmussen and Kortschak2012, Reference Asmussen and Kortschak2015), Ghamami & Ross (Reference Ghamami and Ross2012) and Kortschak & Hashorva (Reference Kortschak and Hashorva2013). In summary, the state-of-the-art is that Z
AK not only has bounded relative error (BdRelErr) but in fact vanishing relative error in a wide class of heavy-tailed distributions. Here the relative (squared) error is the traditional measure of efficiency in the rare-event simulation literature, defined as the ratio $r_{n}^{{(2)}} (z)$
(say) between the variance and the square of the probability z in question (note that r
n
(x) is defined similarly in (3.5) but without the square in the denominator). BdRelErr means
$r_{n}^{{(2)}} (z)$
(say) between the variance and the square of the probability z in question (note that r
n
(x) is defined similarly in (3.5) but without the square in the denominator). BdRelErr means ${{\rm lim}\,{\rm sup}}_{z\to0} r_{n}^{{(2)}} (z)\,\lt\,\infty$
and is usually consider the most one can hope for, cf. Asmussen & Glynn (Reference Asmussen and Glynn2007: VI.1). The following sharp version of the efficiency of Z
AK follows, e.g., from Asmussen & Kortschak (Reference Asmussen and Kortschak2012, Reference Asmussen and Kortschak2015).
${{\rm lim}\,{\rm sup}}_{z\to0} r_{n}^{{(2)}} (z)\,\lt\,\infty$
and is usually consider the most one can hope for, cf. Asmussen & Glynn (Reference Asmussen and Glynn2007: VI.1). The following sharp version of the efficiency of Z
AK follows, e.g., from Asmussen & Kortschak (Reference Asmussen and Kortschak2012, Reference Asmussen and Kortschak2015).
Theorem 4.1 Assume that the distribution of X is either regularly varying, lognormal or Weibull with tail e−xβ , where 0<β<log (3/2)/log 2≈0.585. Then there exists constants γ>0 and c<∞ depending on the distributional parameters such that
 $${\Bbb V}arZ_{{{\rm AK}}} \left( x \right)\;\,\sim\,\;cx^{{{\minus}\gamma }} {\Bbb P}\left( {S_{n} \,\gt\,x} \right)^{2} \quad {\rm as}\ \,x\to\infty$$
The efficiency of the AK estimator for heavy-tailed F is apparent from Figure 3(a), where it outperforms simple CdMC. For light-tailed F it has been noted that Z AK does not achieve BdRelErr, and presumably this is the reason it seems to have been discarded in this setting. For similar reasons as in section 3, we shall not go into a general treatment of the efficiency of the AK estimator for light-tailed F, but only present the results for two basic examples when n=2.
Example 4.2 Assume n=2, f(x)=e−x . Then M n−1=X n−1=X 1 and M n−1>x−X n−1 precisely when X 1>x/2. This gives
 $$\eqalignno{ {1 \over 4}{\Bbb E}Z_{{{\rm AK}}} \left( x \right)^{2} & \, {\equals}\, {\int}_0^{x\,/\,2} {{\rm e}^{{{\minus}2(x{\minus}y)}} {\rm e}^{{{\minus}y}} \:dy} {\plus}{\int}_{x\,/\,2}^\infty {{\rm e}^{{{\minus}2y}} {\rm e}^{{{\minus}y}} \:dy} \cr & \, {\equals}\, {\rm e}^{{{\minus}2x}} \left( {{\rm e}^{{x\,/\,2}} {\minus}1} \right){\plus}\:{1 \over 3}{\rm e}^{{{\minus}3x\,/\,2}} \,\sim\,{4 \over 3}{\rm e}^{{{\minus}3x\,/\,2}} \,,\quad x\to\infty $$
Compared to CrMC, this corresponds to an improvement of the second moment by a factor of order e−x/2/x.
Example 4.3 Let n = 2 and let F be normal(0,1). Calculations presented in the Appendix then give
 $${\Bbb V}arZ_{{{\rm AK}}} \left( x \right)^{2} \,\sim\,{{64} \over {3x^{3} \left( {2\pi } \right)^{{3\,/\,2}} }}{\rm e}^{{{\minus}3x^{2} \,/\,8}} \:,\quad x\to\infty$$
Compared to CrMC, this corresponds to an improvement of the error by a factor of order
 $${\rm e}^{{{\minus}5x^{2} \,/\,8}} $$
.
$${\rm e}^{{{\minus}5x^{2} \,/\,8}} $$
.
As discussed in section 3, the variance reduction obtained via Z AK is reflected in the improved estimates of the VaR. For the expected shortfall, Z AK-based algorithms are discussed in Hartinger & Kortschak (Reference Hartinger and Kortschak2009). They assume VaR α (S n ) to be known, but the discussion of section 5 covers how to give confidence intervals if it is estimated.
Remark 4.4
For rare-event problems similar or related to that of estimating ${\Bbb P}\left( {S_{n} \,\gt\,x} \right)$
, a number of alternative algorithms with similar efficiency as Z
AK have later been developed, see, e.g., Dupuis et al. (Reference Dupuis, Leder and Wang2007), Juneja (Reference Juneja2007) and Blanchet & Glynn (Reference Blanchet and Glynn2008). Some of these have the advantage of a potentially broader applicability, though ZAK remains the one which is most simple.
${\Bbb P}\left( {S_{n} \,\gt\,x} \right)$
, a number of alternative algorithms with similar efficiency as Z
AK have later been developed, see, e.g., Dupuis et al. (Reference Dupuis, Leder and Wang2007), Juneja (Reference Juneja2007) and Blanchet & Glynn (Reference Blanchet and Glynn2008). Some of these have the advantage of a potentially broader applicability, though ZAK remains the one which is most simple.
5. VaR
The VaR VaR
α
(S
n
) of S
n
at level α is intuitively defined as the number such that the probability of a loss larger than VaR
α
(S
n
) is 1−α. Depending on whether small or large values of S
n
mean a loss, there are two forms used, the actuarial VaR
α
(S
n
) defined as the α-quantile q
α, n
and the financial VaR
α
(S
n
) defined as −q
1−α, n
. Typical values of α are 0.95 and 0.99 but smaller values occur in Basel II for certain types of business lines. We use here the actuarial definition and assume F to be continuous to avoid technicalities associated with ${\Bbb P}(S_{n} \, {\equals}\, VaR_{\alpha } (S_{n} ))\,\gt\,0$
. Also, since α, n are fixed, we write just q=q
α, n
.
${\Bbb P}(S_{n} \, {\equals}\, VaR_{\alpha } (S_{n} ))\,\gt\,0$
. Also, since α, n are fixed, we write just q=q
α, n
.
The CrMC estimate uses R simulated values $S_{n}^{{(1)}} ,\,\,\ldots\,\,,S_{n}^{{(R)}} $
and is taken as the α-quantile
$S_{n}^{{(1)}} ,\,\,\ldots\,\,,S_{n}^{{(R)}} $
and is taken as the α-quantile $\widehat{q}_{{{\rm Cr}}} \, {\equals}\, \widehat{F}_{{n\,;\,R}}^{{{\quad \minus}1}} \left( \alpha \right)$
of the empirical c.d.f.
$\widehat{q}_{{{\rm Cr}}} \, {\equals}\, \widehat{F}_{{n\,;\,R}}^{{{\quad \minus}1}} \left( \alpha \right)$
of the empirical c.d.f.
 $$\widehat{F}_{{n\,;\,\,R}} \left( {x\:\,;\,\,S_{n} } \right)\, {\equals}\, {1 \over R}\mathop{\sum}\limits_{r\, {\equals}\, 1}^R {{\Bbb I}\left( {S_{n}^{{(r)}} \leq x} \right)} $$
(we ignore here and in the following the issues connected with the ambiguity in the choice of $\widehat{F}_{{n\,;\,\,R}}^{\quad {{\minus}1}} \left( \alpha \right)$
connected with the discontinuity of
$\widehat{F}_{{n\,;\,\,R}}^{\quad {{\minus}1}} \left( \alpha \right)$
connected with the discontinuity of $\widehat{F}_{{n\,;\,\,R}} \,;\,$
asymptotically, these play no role). Thus
$\widehat{F}_{{n\,;\,\,R}} \,;\,$
asymptotically, these play no role). Thus $\widehat{q}_{{{\rm Cr}}} $
is more complicated than an average of i.i.d. r.v.’s but nevertheless there is a CLT
$\widehat{q}_{{{\rm Cr}}} $
is more complicated than an average of i.i.d. r.v.’s but nevertheless there is a CLT
 $$\sqrt R \left( {\widehat{q}_{{{\rm Cr}}} {\minus}q} \right)\;\to\;{\cal N}\left( {0,\,\sigma _{{{\rm Cr}}}^{2} } \right)\quad {\rm where}\;\sigma _{{{\rm Cr}}}^{2} \, {\equals}\, {{\alpha \left( {1{\minus}\alpha } \right)} \over {f_{n} \left( q \right)^{2} }}\:$$
see, e.g., Serfling (Reference Serfling1980). Thus confidence intervals require an estimate of f n (q), an issue about which Glynn (Reference Glynn1996) writes that “the major challenge is finding a good way of estimating f n (q), either explicitly or implicitly” (without providing a method for doing this!) and Glasserman et al. (Reference Glasserman, Heidelberger and Shahabuddin2000) that “estimation of f n (q) is difficult and beyond the scope of this paper”.
When confidence bands for the VaR are given, a common practice is therefore to use the bootstrap method. However, in our sum setting, CdMC easily gives f n (q), as outlined in section 2. In addition, the method provides some variance reduction because of its improved estimates of the c.d.f.:
Proposition 5.1
Define $\widehat{q}_{{{\rm Cond}}} $
as the solution of
$\widehat{q}_{{{\rm Cond}}} $
as the solution of
 $$\widehat{F}_{{n\,;\,\,R}}^{{{\rm Cond}}} \left( {\widehat{q}_{{{\rm Cond}}} } \right)\, {\equals}\, \alpha \quad {\rm where}\quad \widehat{F}_{{n\,;\,\,R}}^{{{\rm Cond}}} \left( x \right)\, {\equals}\, {1 \over R}\mathop{\sum}\limits_{r\, {\equals}\, 1}^R {F\left( {x{\minus}S_{{n{\minus}1}}^{{(r)}} } \right)} $$
If F admits a density f that is either monotone or differentiable with f′ bounded, then
 $$\sqrt R \left( {\widehat{q}_{{{\rm Cond}}} {\minus}q} \right)\;\buildrel {\cal D} \over \longrightarrow \;{\cal N}\left( {0,\,\sigma _{{{\rm Cond}}}^{2} } \right)\,{\rm where}\;\sigma _{{{\rm Cond}}}^{2} \, {\equals}\, {{{\Bbb V}ar\left[ {F\left( {q{\minus}S_{{n{\minus}1}} } \right)} \right]} \over {f_{n} \left( q \right)^{2} }}\,\,\lt\,\,\sigma _{{{\rm Cr}}}^{2} \:$$
Proof: An intuitive explanation on how to as here to deal with CLTs for roots of equations is given in Asmussen & Glynn (Reference Asmussen and Glynn2007: III.4). Chu & Nakayama (Reference Chu and Nakayama2012) and Nakayama (Reference Nakayama2014) give rigorous treatments of problems closely related to the present one but the proofs are quite advanced, building on deep results of Bahadur (Reference Bahadur1966) and Ghosh (Reference Ghosh1971). We therefore give a short, elementary and self-contained derivation, even if Proposition 5.1 is a special case of Nakayama (Reference Nakayama2014).
The key step is to show
 $$\widehat{F}_{{n\,;\,\,R}}^{{{\rm Cond}}} \left( {\widehat{q}} \right){\minus}\widehat{F}_{{n\,;\,\,R}}^{{{\rm Cond}}} \left( q \right)\, {\equals}\, \left( {\widehat{q}{\minus}q} \right)f_{n} \left( q \right)\left( {1{\plus}{\rm o}\left( 1 \right)} \right)$$
In fact, $\widehat{F}_{{n\,;\,\,R}}^{{{\rm Cond}}} \left( {\widehat{q}_{{{\rm Cond}}} } \right)\, {\equals}\, \alpha \, {\equals}\, F_{n} \left( q \right)$
then gives
$\widehat{F}_{{n\,;\,\,R}}^{{{\rm Cond}}} \left( {\widehat{q}_{{{\rm Cond}}} } \right)\, {\equals}\, \alpha \, {\equals}\, F_{n} \left( q \right)$
then gives
 $$\eqalignno{ 0 & \, {\equals}\, \widehat{F}_{{n\,;\,\,R}}^{{{\rm Cond}}} \left( {\widehat{q}} \right){\minus}\widehat{F}_{{n\,;\,\,R}}^{{{\rm Cond}}} \left( q \right){\plus}\widehat{F}_{{n\,;\,\,R}}^{{{\rm Cond}}} \left( q \right){\minus}F_{n} \left( q \right) \cr & \, {\equals}\, \left( {\widehat{q}{\minus}q} \right)f_{n} \left( q \right)\left( {1{\plus}{\rm o}\left( 1 \right)} \right){\plus}{{\sqrt {{\Bbb V}ar\left[ {F\left( {q{\minus}S_{{n{\minus}1}} } \right)} \right]} } \over {\sqrt R }}V\left( {1{\plus}{\rm o}\left( 1 \right)} \right) $$
with $V\,\sim\,{\cal N}(0,\,1)$
, from which the desired conclusion follows.
$V\,\sim\,{\cal N}(0,\,1)$
, from which the desired conclusion follows.
For (5.3), note that f
n
is automatically continuous and let ${{\widehat{f}_{{n\,;\,\,R}}^{{{\rm Cond}}} \left( x \right)\, {\equals}\, \mathop{\sum}\nolimits_1^r {f\left( {x{\minus}S_{{n{\minus}1}}^{{(r)}} } \right)} } \mathord{/ {\vphantom {{\widehat{f}_{{n\,;\,\,R}}^{{{\rm Cond}}} \left( x \right)\, {\equals}\, \mathop{\sum}\limits_1^r {f\left( {x{\minus}S_{{n{\minus}1}}^{{(r)}} } \right)} } R}} \right \kern-\nulldelimiterspace} R}$
be the CdMC density estimator. Since
${{\widehat{f}_{{n\,;\,\,R}}^{{{\rm Cond}}} \left( x \right)\, {\equals}\, \mathop{\sum}\nolimits_1^r {f\left( {x{\minus}S_{{n{\minus}1}}^{{(r)}} } \right)} } \mathord{/ {\vphantom {{\widehat{f}_{{n\,;\,\,R}}^{{{\rm Cond}}} \left( x \right)\, {\equals}\, \mathop{\sum}\limits_1^r {f\left( {x{\minus}S_{{n{\minus}1}}^{{(r)}} } \right)} } R}} \right \kern-\nulldelimiterspace} R}$
be the CdMC density estimator. Since $\widehat{F}_{{n\,;\,\,R}}^{{{\rm Cond}}} \left( \cdot \right)$
is differentiable with derivative
$\widehat{F}_{{n\,;\,\,R}}^{{{\rm Cond}}} \left( \cdot \right)$
is differentiable with derivative $\widehat{f}_{{n\,;\,\,R}}^{{{\rm Cond}}} \left( \cdot \right)$
, we get
$\widehat{f}_{{n\,;\,\,R}}^{{{\rm Cond}}} \left( \cdot \right)$
, we get
 $$\widehat{F}_{{n\,;\,\,R}}^{{{\rm Cond}}} \left( {\widehat{q}} \right){\minus}\widehat{F}_{{n\,;\,\,R}}^{{{\rm Cond}}} \left( q \right)\, {\equals}\, \left( {\widehat{q}{\minus}q} \right)\widehat{f}_{{n\,;\,\,R}}^{{{\rm Cond}}} \left( {q^{{\asterisk}} } \right)$$
for some q* between $\widehat{q}$
and q. Assume first f is monotone, say non-increasing. Since
$\widehat{q}$
and q. Assume first f is monotone, say non-increasing. Since $\left| {\widehat{q}{\minus}q} \right|\leq \epsilon $
for all large R, we then also have
$\left| {\widehat{q}{\minus}q} \right|\leq \epsilon $
for all large R, we then also have
 $$\widehat{f}_{{n\,;\,\,R}}^{{{\rm Cond}}} \left( {q{\plus}\epsilon } \right)\leq \widehat{f}_{{n\,;\,\,R}}^{{{\rm Cond}}} \left( {q^{{\asterisk}} } \right)\leq \widehat{f}_{{n\,;\,\,R}}^{{{\rm Cond}}} \left( {q{\minus}\epsilon } \right)$$
for such R, and the consistency of $\widehat{f}_{{n\,;\,\,R}}^{{{\rm Cond}}} \left( \cdot \right)$
then gives
$\widehat{f}_{{n\,;\,\,R}}^{{{\rm Cond}}} \left( \cdot \right)$
then gives $\widehat{f}_{{n\,;\,\,R}}^{{{\rm Cond}}} \left( {q^{{\asterisk}} } \right) \to f_{n} \left( q \right)$
and (5.3). Assume next f is differentiable with sup
$\widehat{f}_{{n\,;\,\,R}}^{{{\rm Cond}}} \left( {q^{{\asterisk}} } \right) \to f_{n} \left( q \right)$
and (5.3). Assume next f is differentiable with sup $\left| {f'} \right|\,\lt\,\infty$
. Arguing as above, we then get
$\left| {f'} \right|\,\lt\,\infty$
. Arguing as above, we then get
 $$\widehat{f}_{{n\,;\,\,R}}^{{{\rm Cond}}} \left( {q^{{\asterisk}} } \right)\, {\equals}\, \widehat{f}_{{n\,;\,\,R}}^{{{\rm Cond}}} \left( q \right){\plus}\left( {q^{{\asterisk}} {\minus}q} \right){1 \over R}\mathop{\sum}\limits_{r\, {\equals}\, 1}^R {f'\left( {q^{{{\asterisk}{\asterisk}}} {\minus}S_{{n{\minus}1}}^{{(r)}} } \right)} \, {\equals}\, \widehat{f}_{{n\,;\,\,R}}^{{{\rm Cond}}} \left( q \right){\plus}\left( {q^{{\asterisk}} {\minus}q} \right){\rm O}\left( 1 \right)$$
for some q** between $\widehat{q}$
and q, which again gives the desired conclusion.□
$\widehat{q}$
and q, which again gives the desired conclusion.□
Remark 5.2
At a first sight, the more obvious way to involve CdMC would have been to give the VaR estimates as the average over R replications of the α-quantile $\widetilde{q}$
in the conditional distribution of S
n
given S
n−1. However, this does not provide the correct answer and in fact introduces a bias that does not disappear for R→∞ as it does for
$\widetilde{q}$
in the conditional distribution of S
n
given S
n−1. However, this does not provide the correct answer and in fact introduces a bias that does not disappear for R→∞ as it does for $\widehat{q}\, {\equals}\, \widehat{F}_{{n\,;\,R}} ^{\quad {{\minus}1}} \left( \alpha \right)$
and
$\widehat{q}\, {\equals}\, \widehat{F}_{{n\,;\,R}} ^{\quad {{\minus}1}} \left( \alpha \right)$
and $\widehat{q}_{{{\rm Cond}}} $
. For a simple example illustrating this, consider the i.i.d. Normal(0, 1)-setting. Here
$\widehat{q}_{{{\rm Cond}}} $
. For a simple example illustrating this, consider the i.i.d. Normal(0, 1)-setting. Here $\widetilde{q}\, {\equals}\, S_{n} _{{{\minus}1}} {\plus}z_{\alpha } $
where z
α
=Φ−1(α) with expectation z
α
but
$\widetilde{q}\, {\equals}\, S_{n} _{{{\minus}1}} {\plus}z_{\alpha } $
where z
α
=Φ−1(α) with expectation z
α
but $\sqrt n z_{\alpha } $
is the correct answer!◊
$\sqrt n z_{\alpha } $
is the correct answer!◊
Example 5.3 As illustration, we used CdMC with R=50,000 replications to compute VaR α (S n ) and the associated confidence interval for the sum of n=5, 10, 25, 50 Lognormal(0, 1) r.v.’s. The results are in Table 2.
Value-at-Risk estimates for lognormal example.

6. Expected Shortfall
An alternative risk measure receiving much current attention is the expected shortfall (also called conditional VaR). For continuous F, this takes the form (cf. McNeil et al., Reference McNeil, Frey and Embrechts2015: 70):
 $${\rm ES_{\ralpha }} \left( {S_{n} } \right)\, {\equals}\, {\Bbb E}\left[ {S_{n} \:\,\mid\,\:S_{n} \geq q} \right]\, {\equals}\, q{\plus}{{m_{n} \left( q \right)} \over {1{\minus}\alpha }}$$
where as above q=VaR α (S n ) and
 $$m_{n} \left( z \right)\, {\equals}\, {\Bbb E}\left[ {S_{n} {\minus}z} \right]^{{\plus}} \, {\equals}\, {\int}_z^\infty {\overline{F} _{n} \left( y \right)\:dy} $$
The obvious CrMC algorithm for estimating ES
α
(S
n
) is to first compute the estimate $\widehat{q}_{{{\rm Cr}}} \, {\equals}\, \widehat{F}_{{n\,;\,\,R}} ^{\quad {{\minus}1}} \left( \alpha \right)$
as above and next either (i) perform a new set of simulations with R
1 replications of
$\widehat{q}_{{{\rm Cr}}} \, {\equals}\, \widehat{F}_{{n\,;\,\,R}} ^{\quad {{\minus}1}} \left( \alpha \right)$
as above and next either (i) perform a new set of simulations with R
1 replications of $Z_{1} \, {\equals}\, \left[ {S_{n} {\minus}\widehat{q}_{{{\rm Cr}}} } \right]^{{\plus}} $
, using the resulting average as estimator of m
n
(q) (consistency holds in the limit R, R
1→∞), or (ii) use the already simulated
$Z_{1} \, {\equals}\, \left[ {S_{n} {\minus}\widehat{q}_{{{\rm Cr}}} } \right]^{{\plus}} $
, using the resulting average as estimator of m
n
(q) (consistency holds in the limit R, R
1→∞), or (ii) use the already simulated $S_{n}^{{(1)}} ,\,\,\ldots\,\,,S_{n}^{{(R)}} $
to estimate m
n
(q) as the corresponding empirical value
$S_{n}^{{(1)}} ,\,\,\ldots\,\,,S_{n}^{{(R)}} $
to estimate m
n
(q) as the corresponding empirical value
 $$\widehat{m}_{{n\,;\,\,R}}^{{{\rm Cr}}} \left( {\widehat{q}_{{{\rm Cr}}} } \right)\, {\equals}\, {1 \over R}\mathop{\sum}\limits_{r\, {\equals}\, 1}^R {\left[ {S_{n}^{{(r)}} {\minus}\widehat{q}_{{{\rm Cr}}} } \right]} ^{{\plus}} $$
We shall not pay further attention to (i), but consider a broader class of estimators than in (ii), covering both CdMC and other examples. The issue is how to provide confidence intervals. This is non-trivial already for the CrMC scheme (ii), and since we are not aware of a sufficiently close general reference we shall give some detail here.
In this broader setting, we assume that the simulation generates an estimate $\widehat{F}_{{n\,;\,\,R}}^{{\asterisk}} \left( x \right)$
of F
n
(x) and an estimate
$\widehat{F}_{{n\,;\,\,R}}^{{\asterisk}} \left( x \right)$
of F
n
(x) and an estimate $\widehat{m}_{{n\,;\,\,R}}^{{\asterisk}} \left( x \right)$
of m
n
(x) in a x-range asymptotically covering q, such that these estimates are connected by
$\widehat{m}_{{n\,;\,\,R}}^{{\asterisk}} \left( x \right)$
of m
n
(x) in a x-range asymptotically covering q, such that these estimates are connected by
 $$\widehat{m}_{{n\,;\,\,R}}^{{\asterisk}} \left( x \right)\, {\equals}\, {\int}_x^\infty {\overline{F} _{{n\,;\,\,R}}^{{\asterisk}} (y)\,dy} $$
where $\overline{F} _{{n\,;\,\,R}}^{{\asterisk}} \left( x \right)\, {\equals}\, 1{\minus}\widehat{F}_{{n\,;\,\,R}}^{{\asterisk}} \left( x \right)$
. Precisely as in (ii), we then compute
$\overline{F} _{{n\,;\,\,R}}^{{\asterisk}} \left( x \right)\, {\equals}\, 1{\minus}\widehat{F}_{{n\,;\,\,R}}^{{\asterisk}} \left( x \right)$
. Precisely as in (ii), we then compute $\widehat{q}_{{\asterisk}} \, {\equals}\, \widehat{F}_{{n\,;\,\,R}}^{{\asterisk}} ^{{{\minus}1}} \left( \alpha \right)$
and estimate e=ES
α
(S
n
) as
$\widehat{q}_{{\asterisk}} \, {\equals}\, \widehat{F}_{{n\,;\,\,R}}^{{\asterisk}} ^{{{\minus}1}} \left( \alpha \right)$
and estimate e=ES
α
(S
n
) as
 $$\widehat{e}_{{\asterisk}} \, {\equals}\, \widehat{q}_{{\asterisk}} {\plus}{{\widehat{m}_{{n\,;\,\,R}}^{{\asterisk}} \left( {\widehat{q}_{{\asterisk}} } \right)} \over {1{\minus}\alpha }}$$
Example 6.1
In many main examples, $\widehat{F}_{{n\,;\,\,R}}^{{\asterisk}} \left( x \right)$
and
$\widehat{F}_{{n\,;\,\,R}}^{{\asterisk}} \left( x \right)$
and $\widehat{m}_{{n\,;\,\,R}}^{{\asterisk}} \left( x \right)$
have the form
$\widehat{m}_{{n\,;\,\,R}}^{{\asterisk}} \left( x \right)$
have the form
 $${1 \over R}\mathop{\sum}\limits_{r\, {\equals}\, 1}^R {\phi _{F} \left( {x,\,{\mib{V}} _{r} } \right)} ,\quad \quad {1 \over R}\mathop{\sum}\limits_{r\, {\equals}\, 1}^R {\phi _{m} } \left( {x,\,{\mib{V}} _{r} } \right)$$
where
V
1, … ,
V
R
are i.i.d. replicates of a random vector
V
simulated from some probability measure $\widetilde{{\Bbb P}}$
and
$\widetilde{{\Bbb P}}$
and $\phi$
F
,
$\phi$
F
, $\phi$
m
are functions satisfying
$\phi$
m
are functions satisfying
 $$\widetilde{{\Bbb E}}\phi _{F} \left( {x,\,{\mib{V}} } \right)\, {\equals}\, F_{n} \left( x \right)\:,\quad \quad \widetilde{{\Bbb E}}\phi _{m} \left( {x,\,{\mib{V}} } \right)\, {\equals}\, m_{n} \left( x \right)$$
The requirement (6.4) then means
 $$\phi _{m} \left( {x,\,{\mib{V}} } \right)\, {\equals}\, {\int}_x^\infty {} \phi _{F} \left( {y,\,{\mib{V}} } \right)\,dy$$
Special cases:
a. CrMC where V=S n ,
$\widetilde{{\Bbb P}}\, {\equals}\, {\Bbb P},\,\phi _{F} (x,\,s)\, {\equals}\, {\Bbb I}(s\leq x)$
,
$\phi$
m
(x, s)=(s−x)+.b. CdMC where V=S n−1,
$\widetilde{{\Bbb P}}\, {\equals}\, {\Bbb P}$
,
$\phi$
F
(x, s)=F(x−s),
$\phi$
m
(x, s)=m(x−s) where m(x)=
$m_{1} (x)\, {\equals}\, {\Bbb E}(X{\minus}x)^{{\plus}} $
(typically explicitly available in contrast to m
n
(x)!).c. IS where V =(S n , L),
$\widetilde{{\Bbb P}}$
is the measure w.r.t. which X
1, … , X
n
are i.i.d. with density
$\widetilde{f}\,\ne\,f,\,L\, {\equals}\, \prod\nolimits_1^n {f\left( {X_{i} } \right)\,/\,\widetilde{f}\left( {X_{i} } \right)} $
is the likelihood ratio and
$\phi _{F} (x,\,s,\,\ell )\, {\equals}\, {\Bbb I}(s\leq x)\ell $
,
$\phi _{m} (x,\,s)\, {\equals}\, (s{\minus}x)^{{\plus}} \ell $
.d. The AK estimator from section 4, leading to V =(M n−1, S n−1),
$\widetilde{{\Bbb P}}\, {\equals}\, {\Bbb P},\,\phi _{F} \left( {x,\,z,\,s} \right)\, {\equals}\, \overline{F} \left( {z\wedge(x{\minus}s)} \right)$
,
$\phi$
m
(x, z, s)=t
AK(z, x−s) where
$t_{{{\rm AK}}} \left( {z,\,x} \right)\, {\equals}\, {\Bbb E}\left[ {\left( {X{\minus}x} \right)^{{\plus}} \,;\,\,X\,\gt\,z} \right].$


The verification of (6.4) is in all cases an easy consequence of the identity $\left( {v{\minus}x} \right)^{{\plus}} \, {\equals}\, {\int}_x^\infty {\Bbb I} \left( {y\leq v} \right)\:\,dy\,;\,$
the most difficult case is (d) where (6.4) follows from
$\left( {v{\minus}x} \right)^{{\plus}} \, {\equals}\, {\int}_x^\infty {\Bbb I} \left( {y\leq v} \right)\:\,dy\,;\,$
the most difficult case is (d) where (6.4) follows from
 $$\eqalignno{ t_{{{\rm AK}}} \left( {z,\,x{\minus}s} \right) & \, {\equals}\, {\Bbb E}\left[ {\left( {X{\plus}s{\minus}x} \right)^{{\plus}} \,;\,\,X\,\gt\,z} \right]\, {\equals}\, {\Bbb E}\left[ {{\int}_{x{\minus}s}^\infty {{\Bbb I}\left( {X\,\gt\,y,\,X\,\gt\,z} \right)\,dy} } \right] $$
 $$\eqalignno{ {\equals}\, {\Bbb E}\left[ {{\int}_x^\infty {\Bbb I}\left( {X\,\gt\,y{\minus}s,\,X\,\gt\,z} \right)\,dy} \right]\, {\equals}\, {\int}_x^\infty {\overline{F} (z\vee\left( {y{\minus}s} \right)\,dy} $$
The IS in (c) can be combined with (b) or (d) in obvious ways. Examples not covered are: (e) regression-adjusted control variates (Asmussen & Glynn, Reference Asmussen and Glynn2007: V.2) where (6.6) fails; (f) level-dependent IS where the measure $\widetilde{{\Bbb P}}$
in (c) depends on x. This may be a quite natural situation, cf. Example 3.6.◊
$\widetilde{{\Bbb P}}$
in (c) depends on x. This may be a quite natural situation, cf. Example 3.6.◊
For asymptotics, we assume that
 $$\widehat{F}_{{n\,;\,\,R}}^{{\asterisk}} \left( x \right)\,\sim\,F_{n} \left( x \right){\minus}Z\left( x \right)\,/\,\sqrt R ,\quad \overline{F} _{{n\,;\,\,R}}^{{\asterisk}} \left( x \right)\,\sim\,\overline{F} _{n} \left( x \right){\plus}Z\left( x \right)\,/\,\sqrt R $$
as R→∞ for a suitable Gaussian process Z. For example, ${\Bbb V}arZ\left( x \right)\, {\equals}\, F_{n} \left( x \right)\overline{F} _{n} \left( x \right)$
for the empirical c.d.f. For other examples, in particular CdMC,
${\Bbb V}arZ\left( x \right)\, {\equals}\, F_{n} \left( x \right)\overline{F} _{n} \left( x \right)$
for the empirical c.d.f. For other examples, in particular CdMC, ${\Bbb V}arZ\left( x \right)$
is typically not explicit but must be estimated from the simulation output and varies from case to case. From section 5, one then expects that
${\Bbb V}arZ\left( x \right)$
is typically not explicit but must be estimated from the simulation output and varies from case to case. From section 5, one then expects that
 $$\sqrt R \:\left( {\widehat{q}_{{\asterisk}} {\minus}q} \right)\;\buildrel {\,{\cal D}\,} \over \longrightarrow \;{\cal N}\left( {0,\,\sigma _{{\asterisk}}^{2} (q)} \right)\quad {\rm where}\;\sigma _{{\asterisk}}^{2} \left( q \right)\, {\equals}\, {{{\Bbb V}arZ\left( q \right)} \over {f\left( q \right)^{2} }}\:$$
as has been verified for CdMC; for IS, see Sun & Hong (Reference Sun and Hong2010) and Hong et al. (Reference Hong, Hu and Liu2014). We shall also need
 $$\sqrt R \:\left( {m_{{n\,;\,\,R}}^{{\asterisk}} \left( x \right){\minus}m_{n} \left( x \right)} \right)\;\buildrel {\,{\cal D}\,} \over \longrightarrow \;{\cal N}\left( {0,\,\sigma _{{\asterisk}}^{2} \left( {m_{n} } \right.\left( x \right)} \right)$$
for some $\sigma _{{\asterisk}}^{2} \left( {m_{n} (x)} \right)$
; this is obvious in the setting of Example 6.1. We then get the following result, which in particular applies to CdMC for an i.i.d. sum:
$\sigma _{{\asterisk}}^{2} \left( {m_{n} (x)} \right)$
; this is obvious in the setting of Example 6.1. We then get the following result, which in particular applies to CdMC for an i.i.d. sum:
Proposition 6.2 Subject to (6.9), it holds that
 $$\sqrt R \left( {\widehat{e}_{{\asterisk}} {\minus}e} \right)\,\buildrel {\cal D} \over \longrightarrow \,{\cal N}\left( {0,\,\sigma _{{\asterisk}}^{2} \left( e \right)} \right)\quad where\,\sigma _{{\asterisk}}^{2} \left( e \right)\, {\equals}\, {{\sigma _{{\asterisk}}^{2} \left( {m_{n} \left( x \right)} \right)} \over {\left( {1{\minus}\alpha } \right)^{2} }}$$
Proof: By (6.4),
 $$\eqalignno{ \widehat{e}_{{\asterisk}} & \, {\equals}\, \widehat{q}_{{\asterisk}} {\plus}{1 \over {1{\minus}\alpha }}{\int}_{\widehat{q}_{{\asterisk}} }^q {\overline{F} _{{n\,;\,\,R}}^{{\asterisk}} \left( x \right)\:dx} {\plus}{1 \over {1{\minus}\alpha }}{\int}_q^\infty {\overline{F} _{{n\,;\,\,R}}^{{\asterisk}} \left( x \right)} dx \cr & \,\approx\,\;\widehat{q}_{{\asterisk}} {\plus}\left( {q{\minus}\widehat{q}_{{\asterisk}} } \right){\plus}{{\widehat{m}_{{n\,;\,\,R}}^{{\asterisk}} \left( q \right)} \over {1{\minus}\alpha }}\, {\equals}\, q{\plus}{{m_{n} \left( q \right)} \over {1{\minus}\alpha }}{\plus}{{\widehat{m}_{{n\,;\,\,R}}^{{\asterisk}} (q){\minus}m_{n} \left( q \right)} \over {1{\minus}\alpha }} \cr & \, \,{\equals}\, e{\plus}{{\widehat{m}_{{n\,;\,\,R}}^{{\asterisk}} \left( q \right){\minus}m_{n} \left( q \right)} \over {1{\minus}\alpha }} $$
Summarising the algorithm for the CdMC case:
1. Simulate
$S_{{n{\minus}1}}^{{(1)}} ,\,\,\ldots\,\,,S_{{n{\minus}1}}^{{(R)}} $
.2. Compute
$\widehat{q}_{{{\rm Cond}}} $
as solution of
${1 \over R}\mathop{\sum}\nolimits_{r\, {\equals}\, 1}^R {\overline{F} \left( {q{\minus}S_{{n{\minus}1}}^{{(r)}} } \right)} \, {\equals}\, 1{\minus}\alpha .$
3. Let
$\widehat{e}_{{{\rm Cond}}} \:\, {\equals}\, \:\widehat{q}_{{{\rm Cond}}} {\plus}{1 \over R}\mathop{\sum}\limits_{r\, {\equals}\, 1}^R {m\left( {\widehat{q}{\minus}S_{{n{\minus}1}}^{{(r)}} } \right)} $
where
$m\left( x \right)\, {\equals}\, {\Bbb E}\left( {X{\minus}x} \right)^{{\plus}} .$
4. Compute the empirical variance s 2 of the
$m\left( {\widehat{q}{\minus}S_{{n{\minus}1}}^{{(r)}} } \right)$
, r=1, … , R.5. Return the 95% confidence interval
$\widehat{e}_{{_{{{\rm Cond}}} }} \,\pm\,1.96\:s\,/\,\sqrt R .$


7. Averaging
The idea of using f(x−S n−1) and F(x−S n−1) as estimators of f n , respectively, F n , has an obvious asymmetry in that X n has a special role among X 1, … , X n by being the one that is not simulated but handled via its conditional expectation given the rest. An obvious idea is therefore to repeat the procedure with X n replace by X k and average over k=1, … , n. This leads to the alternative estimators
 $${1 \over n}\mathop{\sum}\limits_{k\, {\equals}\, 1}^n {f\left( {x{\minus}S_{n} {\plus}X_{k} } \right)} ,\quad {\rm respectively,}\quad {1 \over n}\mathop{\sum}\limits_{k\, {\equals}\, 1}^n {F\left( {x{\minus}S_{n} {\plus}X_{k} } \right)} $$
Figure 4 illustrates the procedure for our recurrent example of estimating the density of the sum of n=10 lognormals.
f(x−S n−1) dotted, (7.1) solid. (a) R=128, (b) R=1,024.
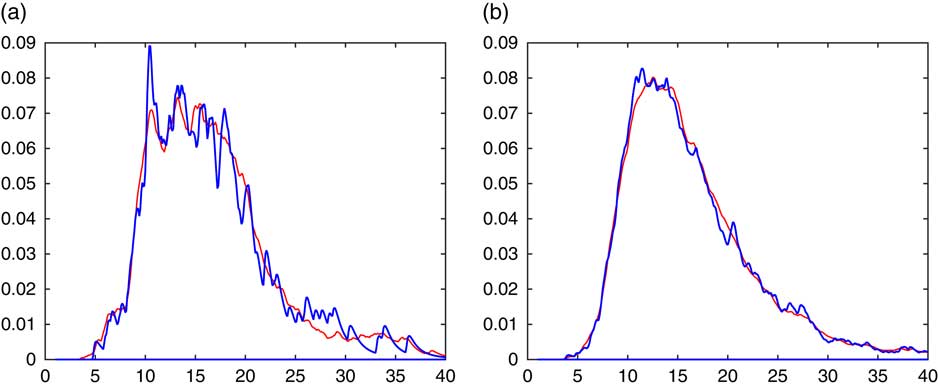
It is seen that the averaging procedure has the obvious advantage of producing a smoother estimate. This may be particularly worthwhile for small sample sizes R, as illustrated in Figure 5. Here R=32, the upper panel gives the histogram of the simulated 32 values of S n and the corresponding simple CdMC estimate, whereas the lower panel has the averaged CdMC estimate (7.1) left. These have been supplemented with the density estimate:
 $${1 \over {n\left( {n{\minus}1} \right)}}\mathop{\sum}\limits_{k\,\ne\,\ell }^n {f^{{{\asterisk}2}} \left( {x{\minus}S_{n} {\plus}X_{k} {\plus}X_{\ell } } \right)} $$
with f *2 evaluated by numerical integration (which is feasible for the sum of just n=2 r.v.’s). The idea comes from observing that the peaks of f are quite visible in the plot using f(x−S n−1), whereas convolution will produce smoother peaks in f *2. The improvement is quite notable. However, we have not pursued this line of thought any further.
R=32. Upper panel simulated data left, f(x−S n−1) right. Lower panel (7.1) left, (7.2) right.
The overall performance of the idea involves two further aspects, computational effort and variance.
To asses the performance in terms of variance, consider estimation of the c.d.f. F and let
 $$\eqalignno{ & \omega ^{2} \, {\equals}\, {\Bbb V}ar\left[ {F\left( {x{\minus}S_{{n{\minus}1}} } \right)} \right]\, {\equals}\, {\Bbb V}ar\left[ {F\left( {x{\minus}S_{n} {\plus}X_{k} } \right)} \right] \cr & \rho \, {\equals}\, {\Bbb C}orr\left( {F\left( {x{\minus}S_{n} {\plus}X_{k} } \right),\;F\left( {x{\minus}S_{n} {\plus}X_{\ell } } \right)} \right),\;k\,\ne\,\ell $$
Then ω 2 is the variance of the simple CdMC estimator, whereas that of the averaged one is ω 2[1/n+(1−1/n)ρ]. Here ρ=0 for n=2, but one expects ρ to increase to 1 as n increases. The implication is that there is some variance reduction, but presumably it is only notable for small n. This is illustrated in Table 3, giving some numbers for the sum of Lognormal(0,1) r.v.’s. Within each column, the first entry vf 1 is the variance reduction factor r n (q α ) for simple CdMC computed at the estimated α-quantile of S n as given by Example 3.6, the second the same for averaged CdMC. For each entry, the two numbers correspond to the two values of α. The last column gives the empirical estimate of the correlation ρ as defined above.
Comparison of simple and averaged conditional Monte Carlo.

When assessing the computational efficiency, it seems reasonable to compare with the alternative of using simple CdMC with a larger R than the one used for averaging. The choice between these two alternatives involves, however, features varying from case to case. Averaging has an advantage if computation of densities is less costly than random variate generation, a disadvantage the other way round. In any case, averaging seems only worthwhile if the number R of replications is rather small.
8. Dependence
The current trend in dependence modelling is to use copulas and we shall here show some implementations of CdMC to this point of view. Among the many references in the area, Whelan (Reference Whelan2004), McNeil (Reference McNeil2006), Cherubini et al. (Reference Cherubini, Luciano and Vecchiato2004), Wu et al. (Reference Wu, Valdez and Sherris2007) and Mai & Scherer (Reference Mai and Scherer2012) are of particular relevance for the following.
In the sum setting, we consider again the same marginal distribution F of X 1, … , X n . Let (U 1, … , U n ) be a random vector distributed according to the copula in question. Then S n can be simulated by taking X i =F −1(U i ), i.e. we can write
 $$S_{n} \, {\equals}\, F^{{{\minus}1}} \left( {U_{1} } \right){\plus} \cdots {\plus}F^{{{\minus}1}} \left( {U_{n} } \right)\:$$
To estimate the c.d.f. or p.d.f. of S
n
we then need the conditional c.d.f. and p.d.f. F
n|1:n−1, f
n|1:n−1 of X
n
given a suitable σ-field ${\cal F}$
w.r.t. which U
1, … , U
n−1 are measurable. Indeed, then
${\cal F}$
w.r.t. which U
1, … , U
n−1 are measurable. Indeed, then
 $$F_{{n\,\mid\,1\,\colon\,n{\minus}1}} \left( {x{\minus}S_{{n{\minus}1}} } \right),\quad \quad {\rm respectively,}\;f_{{n\:\,\mid\,1\,\colon\,n{\minus}1}} \left( {x{\minus}S_{{n{\minus}1}} } \right)$$
are unbiased estimates (which can of course only be used in practice if F n|1:n−1, f n|1:n−1 have accessible expressions).
For a first example where F n|1:n−1, f n|1:n−1 are available, we consider Gaussian copulas. This is the case U i =Φ(Y i ) where Y n =(Y 1 … Y n )Τ is a multivariate normal vector with standard normal marginals and a general correlation matrix C . In block-partitioned notation, we can write
 $${\mib{C}} \, {\equals}\, \left( {\matrix{ {{\mib{C}} _{{n{\minus}1}} } & {{\mib{C}} _{{n{\minus}1,n}} } \cr {{\mib{C}} _{{n,n{\minus}1}} } & 1 \cr } } \right)$$
where
C
n−1 is (n−1)×(n−1),
C
n−1,n
is (n−1)×1 and ${\mib{C}} _{{n,n{\minus}1}} \, {\equals}\, {\mib{C}} _{{n{\minus}1,n}}^{{\rm T}} $
.
${\mib{C}} _{{n,n{\minus}1}} \, {\equals}\, {\mib{C}} _{{n{\minus}1,n}}^{{\rm T}} $
.
Proposition 8.1 Consider the Gaussian copula and define
 $$\eqalignno{ & c_{{n\,\mid\,1\,\colon\,n{\minus}1}} \, {\equals}\, 1{\minus}{\mib{C}} _{{n,n{\minus}1}} {\mib{C}} _{{n{\minus}1}}^{{{\minus}1}} {\mib{C}} _{{n{\minus}1,n}} \cr & \mu _{{n\,\mid\,1\,\colon\,n{\minus}1}} \, {\equals}\, {\mib{C}} _{{n,n{\minus}1}} {\mib{C}} _{{n{\minus}1}}^{{{\minus}1}} \left( {Y_{1} \:\,\ldots\,\:Y_{{n{\minus}1}} } \right)^{{\rm T}} $$
and ${\cal F}\, {\equals}\, \sigma \left( {U_{1} ,\,\,\ldots\,\,,U_{{n{\minus}1}} } \right)\, {\equals}\, \sigma \left( {Y_{1} ,\,\,\ldots\,\,,Y_{{n{\minus}1}} } \right)$
. Then
${\cal F}\, {\equals}\, \sigma \left( {U_{1} ,\,\,\ldots\,\,,U_{{n{\minus}1}} } \right)\, {\equals}\, \sigma \left( {Y_{1} ,\,\,\ldots\,\,,Y_{{n{\minus}1}} } \right)$
. Then
 $$F_{{n\,\mid\,1\,\colon\,n{\minus}1}} \left( y \right)\, {\equals}\, \Phi \left( {\left[ {\Phi ^{{{\minus}1}} \left( {F\left( y \right)} \right){\minus}\mu _{{n\,\mid\,1\,\colon\,n{\minus}1}} } \right]\,/\,\sqrt {c_{{n\,\mid\,1\,\colon\,n{\minus}1}} } } \right)$$
 $$f_{{n\,\mid\,1\,\colon\,n{\minus}1}} \left( y \right)\, {\equals}\, {{\varphi \left( {\left[ {\Phi ^{{{\minus}1}} \left( {F\left( y \right)} \right){\minus}\mu _{{n\,\mid\,1\,\colon\,n{\minus}1}} } \right]\,/\,\sqrt {c_{{n\,\mid\,1\,\colon\,n{\minus}1}} } } \right)} \over {\varphi \left( {\Phi ^{{{\minus}1}} \left( {F\left( y \right)} \right)} \right)\sqrt {c_{{n\,\mid\,1\,\colon\,n{\minus}1}} } }}\,f\left( y \right)$$
Proof: We have
 $$\eqalignno{ F_{{n\,\mid\,1\,\colon\,n{\minus}1}} \left( y \right) & \, {\equals}\, {\Bbb P}\left( {X_{n} \leq y\,\mid\,\:{\cal F}} \right)\, {\equals}\, {\Bbb P}\left( {F^{{{\minus}1}} \left( {\Phi \left( {Y_{n} } \right)} \right)\leq y\,\mid\,\:{\cal F}} \right) \cr & \, {\equals}\, {\Bbb P}\left( {Y_{n} \leq \Phi ^{{{\minus}1}} \left( {F\left( y \right)} \right)\,\mid\,\:{\cal F}} \right) $$
which reduces to (8.3) since the conditional distribution of Y
n
given ${\cal F}$
is normal with mean μ
n|1:n−1 and variance c
n|1:n−1. (8.4) then follows by differentiation.□
${\cal F}$
is normal with mean μ
n|1:n−1 and variance c
n|1:n−1. (8.4) then follows by differentiation.□
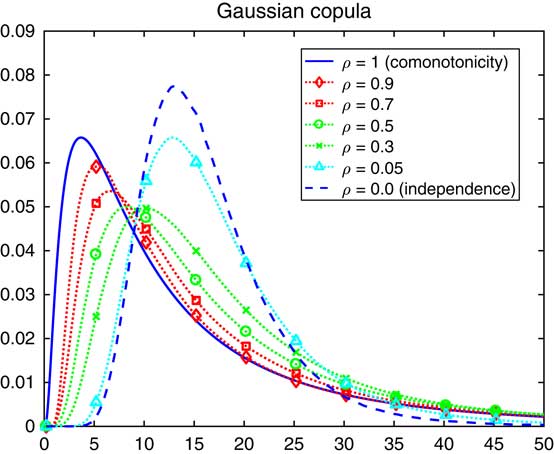
Example 8.2 For the Gaussian copula, the procedure of Proposition 8.1 was implemented for the sum S n of n=10 lognormals, with the estimated densities given in Figure 6. The matrix C is taken as exchangeable, meaning that all off-diagonal elements are the same ρ, and various values of ρ are considered. Similar examples produced with somewhat different methods are in Botev et al. (Reference Botev, Salomone and MacKinlay2017).
Density of a lognormal sum with an exchangeable Gaussian copula.
As second example, we shall consider Archimedean copulas
 $${\Bbb P}\left( {U_{1} \leq u_{1} ,\,\,\ldots\,\,,U_{n} \leq u_{n} } \right)\, {\equals}\, \psi \left( {\phi \left( {u_{1} } \right){\plus} \cdots {\plus}\phi \left( {u_{n} } \right)} \right)$$
where ψ is called the generator and $\phi$
is its functional inverse. Under the additional condition that the r.h.s. of (8.5) defines a copula for any n, it is known that ψ is the Laplace transform
$\phi$
is its functional inverse. Under the additional condition that the r.h.s. of (8.5) defines a copula for any n, it is known that ψ is the Laplace transform $\psi (s)\, {\equals}\, {\Bbb E}{\rm e}^{{{\minus}sZ}} $
of some r.v. Z>0, and we shall consider only that case. A convenient representation is then
$\psi (s)\, {\equals}\, {\Bbb E}{\rm e}^{{{\minus}sZ}} $
of some r.v. Z>0, and we shall consider only that case. A convenient representation is then
 $$\left( {U_{1} ,\,\,\ldots\,\,,U_{n} } \right)\, {\equals}\, \left( {\psi \left( {V_{1} \,/\,Z} \right),\,\,\ldots\,\,,\psi \left( {V_{n} \,/\,Z} \right)} \right)$$
where V 1, … , V n are i.i.d. standard exponential and independent of Z. See, e.g., Marshall & Olkin (Reference Marshall and Olkin1988).
Proposition 8.3
Define ${\cal F}\, {\equals}\, \sigma \left( {V_{1} ,\,...\,,V_{{n{\minus}1}} ,\,Z} \right)$
. Then
${\cal F}\, {\equals}\, \sigma \left( {V_{1} ,\,...\,,V_{{n{\minus}1}} ,\,Z} \right)$
. Then
 $$F_{{n\,\mid\,1\,\colon\,n{\minus}1}} \left( y \right)\, {\equals}\, {\rm exp}\left\{ {{\minus}Z\phi \left( {F\left( y \right)} \right)} \right\}$$
 $$f_{{n\,\mid\,1\,\colon\,n{\minus}1}} \left( y \right)\, {\equals}\, {\minus}Z\phi '\left( {F\left( y \right)} \right)\,{\rm exp}\,\left\{ {{\minus}Z\phi \left( {F\left( y \right)} \right)} \right\}f\left( y \right)$$
For the survival copula (1−ψ(V 1/Z), … , 1−ψ(V n /Z)),
 $$F_{{n\,\mid\,1\,\colon\,n{\minus}1}} \left( y \right)\, {\equals}\, 1{\minus}{\rm exp}\left\{ {{\minus}Z\phi \left( {\overline{F} \left( y \right)} \right)} \right\}$$
 $$f_{{n\,\mid\,1\,\colon\,n{\minus}1}} \left( y \right)\, {\equals}\, {\minus}Z\phi '\left( {\overline{F} \left( y \right)} \right)\,{\rm exp}\,\left\{ {{\minus}Z\phi \left( {\overline{F} \left( y \right)} \right)} \right\}f\left( y \right)$$
Proof: Formulas (8.8), (8.10) follow by straightforward differentiation of (8.7), (8.9) and (8.7) from:
 $$\eqalignno{ F_{{n\,\mid\,1\,\colon\,n{\minus}1}} \left( y \right) & \, {\equals}\, {\Bbb P}\left( {X_{n} \leq y\,\mid\,{\cal F}} \right)\, {\equals}\, {\Bbb P}\left( {F^{{{\minus}1}} \left( {\psi \left( {V_{n} \,/\,Z} \right)} \right)\leq y\,\mid\,\:{\cal F}} \right) \cr & \, {\equals}\, {\Bbb P}\left( {V_{n} \,/\,Z\geq \phi \left( {F\left( y \right)} \right)\,\mid\,\:{\cal F}} \right)\, {\equals}\, {\rm exp}\left\{ {{\minus}Z\phi \left( {F\left( y \right)} \right)} \right\} $$
Similarly for the survival copula:
 $$\eqalignno{ F_{{n\,\mid\,1\,\colon\,n{\minus}1}} \left( y \right) & \, {\equals}\, {\Bbb P}\left( {F^{{{\minus}1}} \left( {1{\minus}\psi \left( {V_{n} \,/\,Z} \right)} \right)\leq y\,\mid\,\:{\cal F}} \right)\, {\equals}\, {\Bbb P}\left( {\psi \left( {V_{n} \,/\,Z} \right)} \right)\geq \overline{F} \left( y \right)\:\,\mid\,\:\left. {\cal F} \right) \cr & \, {\equals}\, {\Bbb P}\left( {V_{n} \,/\,Z\leq \phi \left( {\overline{F} \left( y \right)} \right)\,\mid\,\:{\cal F}} \right)\, {\equals}\, 1{\minus}{\rm exp}\left\{ {{\minus}Z\phi \left( {\overline{F} \left( y \right)} \right)} \right\} \qquad \qquad \qquad \qquad \qquad \qquad \quad \qquad □$$
Some numerical results follow for lognormal sums with the two most common Archimedean copulas, Clayton and Gumbel.
Example 8.4
The Clayton copula corresponds to Z being γ with shape parameter α. Traditionally, the parameter is taken as θ=1/α and the scale (which is unimportant for the copula) chosen such as that ${\Bbb E}Z\, {\equals}\, 1$
. This means that the generator is ψ(t)=1/(1+tθ)1/θ
with inverse
${\Bbb E}Z\, {\equals}\, 1$
. This means that the generator is ψ(t)=1/(1+tθ)1/θ
with inverse $\phi$
(y)=(y
−θ
−1)/θ.
$\phi$
(y)=(y
−θ
−1)/θ.
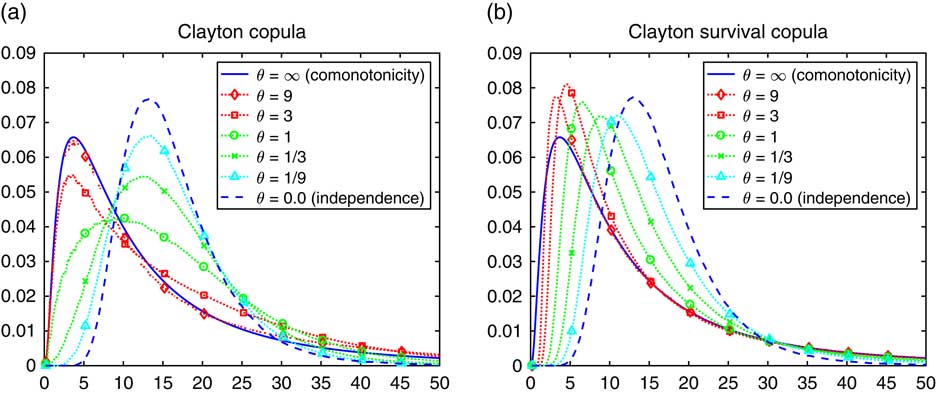
The Clayton copula approaches independence as θ ↓ 0, i.e. α ↑ ∞, and approaches comonotonicity as θ ↑ ∞, i.e. α ↓ 0. The density of the sum S n of n=10 lognormals is in Figure 7(a) for the Clayton copula itself and in Figure 7(b) for the survival copula. The Clayton copula has tail independence in the right tail but tail dependence in the left, implying the opposite behaviour for the survival copula. Therefore, the survival copula may sometimes be the more interesting one for risk management purposes in the Clayton case.
Example 8.5
The Gumbel copula corresponds to Z being strictly α-stable with support (0, ∞). Traditionally, the parameter is taken as θ=1/α and the scale chosen such that the generator is ψ(t)=e−tα
=e−t1/θ
, with inverse $\phi$
(y)=(−log y)
θ
. The Gumbel copula approaches comonotonicity as θ → ∞, i.e. α ↓ 0, whereas independence corresponds to θ=α=1. It has tail dependence in the right tail but tail independence in the left.
$\phi$
(y)=(−log y)
θ
. The Gumbel copula approaches comonotonicity as θ → ∞, i.e. α ↓ 0, whereas independence corresponds to θ=α=1. It has tail dependence in the right tail but tail independence in the left.
Density of lognormal sum with a Clayton copula.
The density of the sum S n of n=10 lognormals is in Figure 8(a) for the Gumbel copula itself and in Figure 8(b) for the survival copula.◊
Remark 8.6
Despite the simplicity of the Marshall-Olkin representation, much of the literature on conditional simulation in the Clayton (and other Archimedean) copulas concentrates on describing the conditional distribution of U
n
given U
1, … , U
n−1, see, e.g. Cherubini et al. (Reference Cherubini, Luciano and Vecchiato2004). Even with this conditioning, we point out that it may be simpler to just consider the conditional distribution of Z given U
1=u
1, … , U
n−1=u
n−1. Namely, given Z=z the r.v. W
i
= $\phi$
(U
i
)=V
i
/z has density
$\phi$
(U
i
)=V
i
/z has density $z{\rm e}^{{{\minus}zw_{i} }} $
so that the conditional density must be proportional to the joint density:
$z{\rm e}^{{{\minus}zw_{i} }} $
so that the conditional density must be proportional to the joint density:
 $$f_{Z} \left( z \right)z{\rm e}^{{{\minus}zw_{1} }} \cdots z{\rm e}^{{{\minus}zw_{{n{\minus}1}} }} \;\propto\;z^{{1\,/\,\theta {\plus}n{\minus}2}} {\rm exp}\left\{ {{\minus}z\left( {1\,/\,\theta {\plus}w_{1} {\plus} \cdots {\plus}w_{{n{\minus}1}} } \right)} \right\}$$
where the last expression uses
 $$Z\,\sim\,\gamma (1\,/\,\theta ,\,1\,/\,\theta )$$
. This gives in particular that for the Clayton copula the conditional distribution of Z given U
1=u
1, … ,U
n−1=u
n−1 is γ(α
n
, λ
n
) where
$$Z\,\sim\,\gamma (1\,/\,\theta ,\,1\,/\,\theta )$$
. This gives in particular that for the Clayton copula the conditional distribution of Z given U
1=u
1, … ,U
n−1=u
n−1 is γ(α
n
, λ
n
) where
 $$\alpha _{n} \, {\equals}\, 1\,/\,\theta {\plus}n{\minus}1\:,\quad \quad \lambda _{n} \, {\equals}\, 1\,/\,\theta {\plus}\phi \left( {u_{1} } \right){\plus} \cdots {\plus}\phi \left( {u_{{n{\minus}1}} } \right) $$
Remark 8.7
Calculation of the VaR follows just the same pattern in the copula context as in the i.i.d. case, cf. the discussion around (5.1). One then needs to replace F with the conditional distribution in (8.2). Also the expected shortfall could be in principle calculated by replacing the ${\Bbb E}\left( {X{\minus}x} \right)^{{\plus}} $
from the i.i.d. case with the similar conditional expectation. However, in examples one encounters the difficulty that the form of (8.2) is not readily amenable to such computations. For example, in the Clayton copula with standard exponential marginals the conditional density is
${\Bbb E}\left( {X{\minus}x} \right)^{{\plus}} $
from the i.i.d. case with the similar conditional expectation. However, in examples one encounters the difficulty that the form of (8.2) is not readily amenable to such computations. For example, in the Clayton copula with standard exponential marginals the conditional density is
 $${Z \over {\left( {1{\minus}{\rm e}^{{{\minus}x}} } \right)^{{\theta {\plus}1}} }}{\rm exp}\left\{ {{\minus}Z\left( {{1 \over {\left( {1{\minus}{\rm e}^{{{\minus}x}} } \right)^{\theta } }}{\minus}1} \right)} \right\}\,{\rm e}^{{{\minus}x}} $$
Density of lognormal sum with a Gumbel copula.
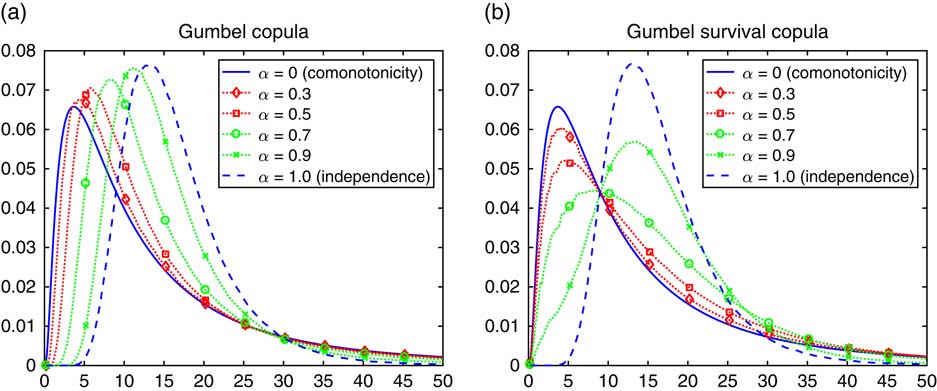
The expressions for say a lognormal marginal F are even less inviting!◊
9. Concluding Remarks
The purpose of the present paper has not been to promote the use of CdMC in all the problems looked into, but rather to present some discussion of both the potential and the limitations of the method. Two aspects were argued from the outset to be potentially attractive, variance reduction and smoothing.
As mentioned in section 4, the traditional measure of efficiency in the rare-event simulation literature is the relative squared error
 $$r_{n}^{{(2)}} (z)$$
, and BdRelErr (BdRelErr is usually consider as the most one can hope for). This and even more is obtained for Z
AK. Simple CdMC for the c.d.f. does not achieve BdRelErr, but nevertheless it was found to be worthwhile at least in the right tail of light-tailed sums and in the left tail when the increments are non-negative. For a quantitative illustration, consider estimating
$$r_{n}^{{(2)}} (z)$$
, and BdRelErr (BdRelErr is usually consider as the most one can hope for). This and even more is obtained for Z
AK. Simple CdMC for the c.d.f. does not achieve BdRelErr, but nevertheless it was found to be worthwhile at least in the right tail of light-tailed sums and in the left tail when the increments are non-negative. For a quantitative illustration, consider estimating ${\Bbb P}(S_{2} \,\gt\,x)$
in the Normal(0, 1) case. The variances of the different estimators were all found to be of the form
${\Bbb P}(S_{2} \,\gt\,x)$
in the Normal(0, 1) case. The variances of the different estimators were all found to be of the form $Cx^{\gamma } {\rm e}^{{{\minus}\beta x^{2} }} $
; note that for
$Cx^{\gamma } {\rm e}^{{{\minus}\beta x^{2} }} $
; note that for ${\Bbb P}(S_{2} \,\gt\,x)$
itself (A.1) gives
${\Bbb P}(S_{2} \,\gt\,x)$
itself (A.1) gives $C\, {\equals}\, 1\,/\,\sqrt \pi $
, γ=−1, β=1/4. A good algorithm thus corresponds to a large value of β and the values found in the respective results are given in Table 4. Note that estimates similar to those of Asmussen & Glynn (Reference Asmussen and Glynn2007: VI.1) show that BdRelErr is in fact obtained by the IS-ECM algorithm sketched at the end of section 3.
$C\, {\equals}\, 1\,/\,\sqrt \pi $
, γ=−1, β=1/4. A good algorithm thus corresponds to a large value of β and the values found in the respective results are given in Table 4. Note that estimates similar to those of Asmussen & Glynn (Reference Asmussen and Glynn2007: VI.1) show that BdRelErr is in fact obtained by the IS-ECM algorithm sketched at the end of section 3.
δ in normal right tail (n=2).

Note: CrMC, crude Monte Carlo; CdMC, conditional Monte Carlo; BdRelErr, bounded relative error.
Also the smoothing performance of CdMC came out favourably in the examples considered. Averaging as in section 7 seemed too often be worthwhile. We found that the ease with which CdMC produces plots of densities even in quite complicated models like the Clayton or Gumbel copulas in Figures 7 and 8 is a quite noteworthy property of the method.
In general, one could argue that when CdMC applies to either variance reduction or density estimation, it is at worst harmless and at best improves upon naive methods without involving more than a minor amount of extra computational effort. Some further comments:
1. When moving away from i.i.d. assumptions, we concentrated on dependence. Different marginals F
1, … , F
n
can, however, also be treated by CdMC. For example, an obvious estimator for ${\Bbb P}(S_{n} \,\gt\,x)$
in this case is
${\Bbb P}(S_{n} \,\gt\,x)$
in this case is
 $${1 \over n}\mathop{\sum}\limits_{i\, {\equals}\, 1}^n {\overline{F} _{i} \left( {x{\minus}S_{n} {\plus}X_{i} } \right)} $$
This generalises in an obvious way to Z AK . For discussion and extensions of these ideas, see, e.g., Chan & Kroese (Reference Chan and Kroese2011) and Kortschak & Harshova (Reference Kortschak and Hashorva2013).
2. The example we have treated is sums but the CdMC method is not restricted to this case. In general, it is of course a necessary condition to have enough structure that conditional distributions are computable in a simple form.
Acknowledgement
The MSc dissertation work of Søren Høg provided a substantial impetus for the present study. The author is grateful to Patrick Laub for patiently looking into a number of Matlab queries. Both referees provided an extremely careful reading of the manuscript which helped remove various small inaccuracies as well as a more important one.
Appendix
A Technical proofs
Proof of Proposition 3.3: Using
 $${\int}_0^x {y^{a} \left( {x{\minus}y} \right)^{b} \,dy\, {\equals}\, B\left( {a{\plus}1,\,b{\plus}1} \right)x^{{a{\plus}b{\plus}1}} } $$
where B(⋅, ⋅) is the Beta function, we get for suitable constants c 1, c 2, … depending on n that
 $$f^{{{\asterisk}2}} \left( x \right)\, {\equals}\, {\int}_0^x {f\left( {x{\minus}y} \right)f\left( y \right)\,dy} \,\,\sim\,\;c_{1}^{2} {\int}_0^x {y^{p} \left( {x{\minus}y} \right)^{p} } \,dy\;\, {\equals}\, \;c_{2} \,x^{{2p{\plus}1}} $$
as x→0 and, by induction:
 $$f^{{{\asterisk}n}} \left( x \right)\,\sim\,c_{3} x^{{np{\plus}n{\minus}1}} ,\quad F^{{{\asterisk}n}} \left( x \right)\, {\equals}\, {\int}_0^x {f^{{{\asterisk}n}} (y)\:dy} \,\sim\,c_{4} x^{{np{\plus}n}} $$
Hence
 $$\eqalignno{ {\Bbb V}ar\left[ {F\left( {x{\minus}S_{{n{\minus}1}} } \right)} \right]\,\sim\, & {\int}_0^x {c_{5} y^{{np{\plus}n{\minus}p{\minus}2}} F\left( {x{\minus}y} \right)^{2} } \,dy{\minus}c_{4}^{2} x^{{2np{\plus}2n}} \cr & \, {\equals}\, {\int}_0^x {c_{6} y^{{np{\plus}n{\minus}p{\minus}2}} } \left( {x{\minus}y} \right)^{{2p{\plus}2}} \:dy{\minus}c_{4}^{2} x^{{2np{\plus}2n}} \cr & \,\sim\,c_{7} x^{{np{\plus}n{\plus}p{\plus}1}} \,, \cr r_{n} \left( x \right) & \,\sim\,{{c_{7} x^{{np{\plus}n{\plus}p{\plus}1}} } \over {c_{4} x^{{np{\plus}n}} \left( {1{\minus}c_{4} x^{{np{\plus}n}} } \right)}}\,\sim\,c_{8} x^{{p{\plus}1}} $$
Proof of Proposition 3.4: Let Z be a r.v. with tail $\overline{F} (x)^{2} $
. By general subexponential theory,
$\overline{F} (x)^{2} $
. By general subexponential theory, ${\Bbb P}\left( {S_{k} \,\gt\,x} \right)\,\sim\,k\overline{F} \left( x \right)$
for any fixed k and
${\Bbb P}\left( {S_{k} \,\gt\,x} \right)\,\sim\,k\overline{F} \left( x \right)$
for any fixed k and ${\Bbb P}\left( {S_{{n{\minus}1}} {\plus}Z\,\gt\,x} \right)\,\sim\,\overline{F} _{{n{\minus}1}} \left( x \right)$
since Z therefore has lighter tail than S
n−1. Hence
${\Bbb P}\left( {S_{{n{\minus}1}} {\plus}Z\,\gt\,x} \right)\,\sim\,\overline{F} _{{n{\minus}1}} \left( x \right)$
since Z therefore has lighter tail than S
n−1. Hence
 $$\eqalignno{ & {\Bbb E}F\left( {x{\minus}S_{{n{\minus}1}} } \right)^{2} \, {\equals}\, \overline{F} _{{n{\minus}1}} \left( x \right){\plus}{\Bbb P}\left( {S_{{n{\minus}1}} {\plus}Z\,\gt\,x,\,S_{{n{\minus}1}} \leq x} \right)\, {\equals}\, \overline{F} _{{n{\minus}1}} \left( x \right){\plus}{\rm o}\left( {\overline{F} \left( x \right)} \right) \cr & {\Bbb V}ar\left[ {F\left( {x{\minus}S_{{n{\minus}1}} } \right)} \right]\, {\equals}\, \overline{F} _{{n{\minus}1}} \left( x \right){\plus}{\rm o}\left( {\overline{F} \left( x \right)} \right){\minus}{\rm O}\left( {\overline{F} \left( x \right)^{2} } \right)\,\sim\,\left( {n{\minus}1} \right)\overline{F} \left( x \right) $$
In the last two proofs, we shall need the Mill’s ratio estimate of the normal tail, stating that if V is standard normal, then
 $${\Bbb P}\left( {\sigma V\,\gt\,x} \right)\;\left\{ {\matrix{ {\:\leq \;{\sigma \over {x\sqrt {2\pi } }}{\rm e}^{{{\minus}x^{2} \,/\,2\sigma ^{2} }} } & {{\rm for}\ \,x\,\gt\,0} \cr {\:\,\sim\,\;{\sigma \over {x\sqrt {2\pi } }}{\rm e}^{{{\minus}x^{2} \,/\,2\sigma ^{2} }} } & {{\rm as}\ \,x\to\infty} \cr } } \right.$$
A slightly more general version, proved in the same way via L’Hospital, is
 $${\int}_{bx}^\infty {{1 \over {\left( {y{\plus}cx} \right)^{k} }}{\rm e}^{{{\minus}ay^{2} \,/\,2}} \:{\rm d}y} \;\,\sim\,\;{1 \over {ab\left( {b{\plus}c} \right)^{k} x^{{k{\plus}1}} }}{\rm e}^{{{\minus}ab^{2} x^{2} \,/\,2}} $$
Proof of Proposition 3.5: We have
 $${\Bbb E}\overline{F} \left( {x{\minus}s_{{n{\minus}1}} } \right)^{2} \, {\equals}\, {\int}_{{\minus}\infty}^\infty {\overline{\Phi } \left( {x{\minus}y} \right)^{2} {1 \over {\left( {2\pi \left( {n{\minus}1} \right)} \right)^{{1\,/\,2}} }}{\rm e}^{{{\minus}y^{2} \,/\,2(n{\minus}1)}} \,dy} $$
Let $\overline{H} \left( x \right)\, {\equals}\, {\Bbb P}\left( {V_{{n{\minus}1}} {\plus}V_{{1\,/\,2}} \,\gt\,x} \right)$
where V
n−1, V
1/2 are independent mean zero normals with variances n−1 and 1/2, and note that
$\overline{H} \left( x \right)\, {\equals}\, {\Bbb P}\left( {V_{{n{\minus}1}} {\plus}V_{{1\,/\,2}} \,\gt\,x} \right)$
where V
n−1, V
1/2 are independent mean zero normals with variances n−1 and 1/2, and note that
 $${\Bbb P}\left( {V_{{n{\minus}1}} \,\gt\,x{\minus}A} \right)\, {\equals}\, {\rm o}\left( {\overline{H} \left( x \right)} \right)$$
according to (A.1). The y>x−A part of the integral in (A.3) is bounded by (A.4). Noting that
 $${{\overline{\Phi } \left( x \right)^{2} } \over {{\Bbb P}\left( {V_{{1\,/\,2}} \,\gt\,x} \right)}}\;\,\sim\,\;{{{\rm e}^{{{\minus}x^{2} }} \,/\,x^{2} 2\pi } \over {1\,/\,2 \cdot {\rm e}^{{{\minus}x^{2} }} \,/\,x\sqrt {2\pi } }}\, {\equals}\, {1 \over x}\sqrt {2\,/\,\pi } $$
the y≤x−A part asymptotically becomes
 $$\eqalignno{ {}{{}\int _{{\minus}\infty}^{x{\minus}A} {{{\sqrt {2\,/\,\pi } } \over {x{\minus}y}}{\Bbb P}\left( {V_{{1\,/\,2}} \,\gt\,x{\minus}y} \right){1 \over {\left( {2\pi (n{\minus}1)} \right)^{{1\,/\,2}} }}{\rm e}^{{{\minus}y^{2} \,/\,2(n{\minus}1)}} \:dy} } \cr {\,\sim\,{1 \over x}\sqrt {2\,/\,\pi } \ \:{\Bbb P}\left( {V_{{n{\minus}1}} {\plus}V_{{1\,/\,2}} \,\gt\,x,\,V_{{n{\minus}1}} \leq x{\minus}A} \right)} \cr {\, {\equals}\, {1 \over x}\sqrt {2\,/\,\pi } \ \:\overline{H} \left( x \right)\:{\minus}{\rm o}\left( {\overline{H} \left( x \right)} \right)\qquad \qquad } \cr } $$
Thus
 $$\eqalignno{ r_{n} \left( x \right) & \,\sim\,\,{{\overline{H} \left( x \right)\sqrt {2\,/\,\pi } \,/\,x} \over {{\Bbb P}\left( {S_{n} \,\gt\,x} \right)}}\;\,\sim\,\,{{\sqrt {n{\minus}1\,/\,2} \:{\rm e}^{{{\minus}x^{2} \,/\,(2n{\minus}1)}} \,/\,\sqrt {2\pi } \sqrt {2\,/\,\pi } \,/\,x} \over {\sqrt n \:{\rm e}^{{{\minus}x^{2} \,/\,2n}} \,/\,x\sqrt {2\pi } }} \cr & \qquad {1 \over x}\sqrt {{{2n{\minus}1} \over {n\pi }}} {\rm e}^{{{\minus}x^{2} \,/\,[2n(2n{\minus}1)]}} $$
where we used (A.1) two times with σ 2=n−1/2, respectively, σ 2=n.□
Proof of (4.2): In the same way as in Example 4.2, max(M
n−1, x−S
n−1)=max(X
1, x−X
1) splits up into X
1≤x/2 and X
1>x/2 parts. Using (A.3) to estimate
 $$\overline{\Phi } (y)$$
, the X
1>x/2 part of
$$\overline{\Phi } (y)$$
, the X
1>x/2 part of ${\Bbb E}Z_{{{\rm A}K}}^{2} (x)$
becomes
${\Bbb E}Z_{{{\rm A}K}}^{2} (x)$
becomes
 $${4 \over {\sqrt {2\pi } }}{\int}_{x\,/\,2}^\infty {\overline{\Phi } \left( y \right)^{2} {\rm e}^{{{\minus}y^{2} \,/\,2}} \:dy} \,\,\sim\,\;{4 \over {\left( {2\pi } \right)^{{3\,/\,2}} }}{\int}_{x\,/\,2}^\infty {{1 \over {y^{2} }}{\rm e}^{{{\minus}3y^{2} \,/\,2}} \,dy} \;\,\sim\,\;{{32} \over {3x^{3} \left( {2\pi } \right)^{{3\,/\,2}} }}{\rm e}^{{{\minus}3x^{2} \,/\,8}} \:dy$$
The X≤x/2 part is
 $$\eqalignno{ {4 \over {\sqrt {2\pi } }} & {\int}_{{\minus}\infty}^{x\,/\,2} {\overline{\Phi } \left( {x{\minus}y} \right)^{2} {\rm e}^{{{\minus}y^{2} \,/\,2}} \:dy} \, {\equals}\, {4 \over {\sqrt {2\pi } }}{\int}_{x\,/\,2}^\infty {\overline{\Phi } \left( y \right)^{2} {\rm e}^{{{\minus}(x{\minus}y)^{2} \,/\,2}} \:dy} \cr & \,\sim\,\;{4 \over {\left( {2\pi } \right)^{{3\,/\,2}} }}{\int}_{x\,/\,2}^\infty {{1 \over {y^{2} }}{\rm e}^{{{\minus}y^{2} {\minus}(x{\minus}y)^{2} \,/\,2}} \,dy} \, {\equals}\, {4 \over {\left( {2\pi } \right)^{{3\,/\,2}} }}{\rm e}^{{{\minus}x^{2} \,/\,3}} {\int}_{x\,/\,2}^\infty {{1 \over {y^{2} }}{\rm e}^{{{\minus}3(y{\minus}x\,/\,3)^{2} \,/\,2}} \,dy} \cr & \, {\equals}\, {4 \over {\left( {2\pi } \right)^{{3\,/\,2}} }}{\rm e}^{{{\minus}x^{2} \,/\,3}} {\int}_{x\,/\,6}^\infty {{1 \over {(y{\plus}x\,/\,3)^{2} }}{\rm e}^{{{\minus}3y^{2} \,/\,2}} \,dy} \cr & \, {\equals}\, {4 \over {\left( {2\pi } \right)^{{3\,/\,2}} }}{\rm e}^{{{\minus}x^{2} \,/\,3}} {1 \over {3 \cdot 1\,/\,6 \cdot \left( {1\,/\,2} \right)^{2} x^{3} }}{\rm e}^{{{\minus}3(x\,/\,6)^{2} }} \, {\equals}\, {{32} \over {3x^{3} \left( {2\pi } \right)^{{3\,/\,2}} }}{\rm e}^{{{\minus}3x^{2} \,/\,8}} $$
Adding up, the results follows.□



