


1. Introduction
The International Labour Organization (ILO, 2019) projects that global warming will reduce hours worked by 2.2 per cent, equivalent to the loss of 80 million full-time jobs globally, by 2030. However, empirical evidence on the effects of rising temperatures on time use remains limited, especially in developing countries (Dell et al., Reference Dell, Jones and Olken2014; Burke et al., Reference Burke, Craxton, Kolstad, Onda, Allcott, Baker, Barrage, Carson, Gillingham, Graff-Zivin and Greenstone2016; Jack, Reference Jack2017; Connolly, Reference Connolly2018). Understanding this labour-temperature relationship is particularly important for developing countries, as they concentrate 80 per cent of the world’s labour force (Behrman, Reference Behrman, Ashenfelter and Card1999), they are located in tropical areas where temperature variation due to climate change is relatively more pronounced (Aragón et al., Reference Aragón, Oteiza and Rud2021), they are expected to face higher associated costs of climate change (Dell et al., Reference Dell, Jones and Olken2014; Jessoe et al., Reference Jessoe, Manning and Taylor2016), and they have a high incidence of asset-poor households with limited access to adaptation strategies or the ability to engage in avoidance behaviour (Jessoe et al., Reference Jessoe, Manning and Taylor2016).
This paper examines the impact of temperature changes on hours worked using data from Peru, emphasising the importance of labour market segmentation in assessing the effects of climate change on labour outcomes. We contribute new evidence on how temperature shocks influence work time in a middle-income country and explore intertemporal labour substitution as a potential adaptation mechanism. Peru offers an ideal setting for this analysis, given its high vulnerability to climate change and pronounced labour market segmentation — characteristics it shares with many other low- and middle-income countries.
This paper combines longitudinal microdata on workers from household surveys with meteorological reanalysis data for Peru from 2007 to 2015. We exploit quasi-random year-to-year variation in temperature within residential localities to estimate whether individuals work more or fewer hours per week in warmer years. While this empirical approach helps minimise concerns about omitted variable bias (Deschênes and Greenstone, Reference Deschênes and Greenstone2007), we also control for rainfall, relative humidity, and daylight hours — factors that are correlated with temperature and may independently influence working hours.
The empirical analysis yields three main findings. First, we find that high temperatures have a negative effect on overall working hours. On average, individuals reduce their weekly work time by 0.63 hours (approximately 40 minutes) for each additional day with temperatures exceeding 27°C, relative to days within the human thermal comfort zone (i.e., between 18–21°C), under average relative humidity conditions of approximately 76 per cent. This effect is more pronounced among informal workers, for whom the reduction reaches up to 52 minutes. Although a decrease of 0.63 hours represents a relatively modest decrease of 1.45 per cent in the average number of hours worked per week, the cumulative impact across millions of workers leads to significant aggregate economic losses, amounting to approximately 0.6 per cent of the national GDP.
Second, the negative effect of high temperatures on work time is driven by informal employment. While prior studies in developed countries have shown that high temperatures tend to reduce hours worked in sectors with primarily outdoor jobs, our findings suggest that in the context of a highly segmented labour market — such as that of many developing countries — the type of industry becomes less relevant. In such settings, informal workers experience reductions in working hours due to high temperatures regardless of whether their jobs are performed indoors or outdoors.
Third, we find no evidence of intertemporal labour substitution as a mechanism for adapting to temperature changes. In response to high temperatures, workers do not appear to shift their work hours across weeks. This suggests that the reduction in hours worked is not merely temporary, but may instead reflect a persistent effect of heat on labour supply.
This study contributes to the growing literature on the impacts of climate change on labour market outcomes. Prior research has examined the effects of weather shocks on work time (Connolly, Reference Connolly2008; Zivin and Neidell, Reference Zivin and Neidell2014; Kruger and Neugart, Reference Kruger and Neugart2018; Schwarz, Reference Schwarz2018; Garg et al., Reference Garg, Gibson and Sun2020; Gray et al., Reference Gray, Taraz and Halliday2023); ability to work (Heyes and Saberian, Reference Heyes and Saberian2022); wages (Schwarz, Reference Schwarz2018); earnings (Das and Somanathan, Reference Das and Somanathan2024); productivity (Dell et al., Reference Dell, Jones and Olken2014; Somanathan et al., Reference Somanathan, Somanathan, Sudarshan and Tewari2021; LoPalo, Reference LoPalo2023); absenteeism (Somanathan et al., Reference Somanathan, Somanathan, Sudarshan and Tewari2021); and labour reallocation (Jessoe et al., Reference Jessoe, Manning and Taylor2016; Colmer, Reference Colmer2021). However, little attention has been paid to the role of labour market segmentation — a pervasive feature of labour markets in developing countries — in shaping the future impacts of climate change on labour outcomes. The study most closely related to ours is Gray et al. (Reference Gray, Taraz and Halliday2023), which uses a linear probability model to examine the effects of droughts and temperature on employment in South Africa. They find no statistically significant effects of temperature on overall, formal, or informal employment. In contrast, we focus on the intensive margin of labour supply and study a context — Peru — with greater variation in weather conditions. Additionally, this paper contributes to the literature on weather and intertemporal labour supply, which has largely focused on high-income countries such as the United States and Germany (Connolly, Reference Connolly2008; Zivin and Neidell, Reference Zivin and Neidell2014; Kruger and Neugart, Reference Kruger and Neugart2018) with China as a notable exception (Garg et al., Reference Garg, Gibson and Sun2020).
The remainder of this paper is organised as follows. Section 2 provides background context. Section 3 describes the data used to measure weather conditions and work hours. Section 4 outlines the empirical strategy. Section 5 presents the main results, followed by a discussion of informal employment in section 6. Section 7 concludes.
2. Background
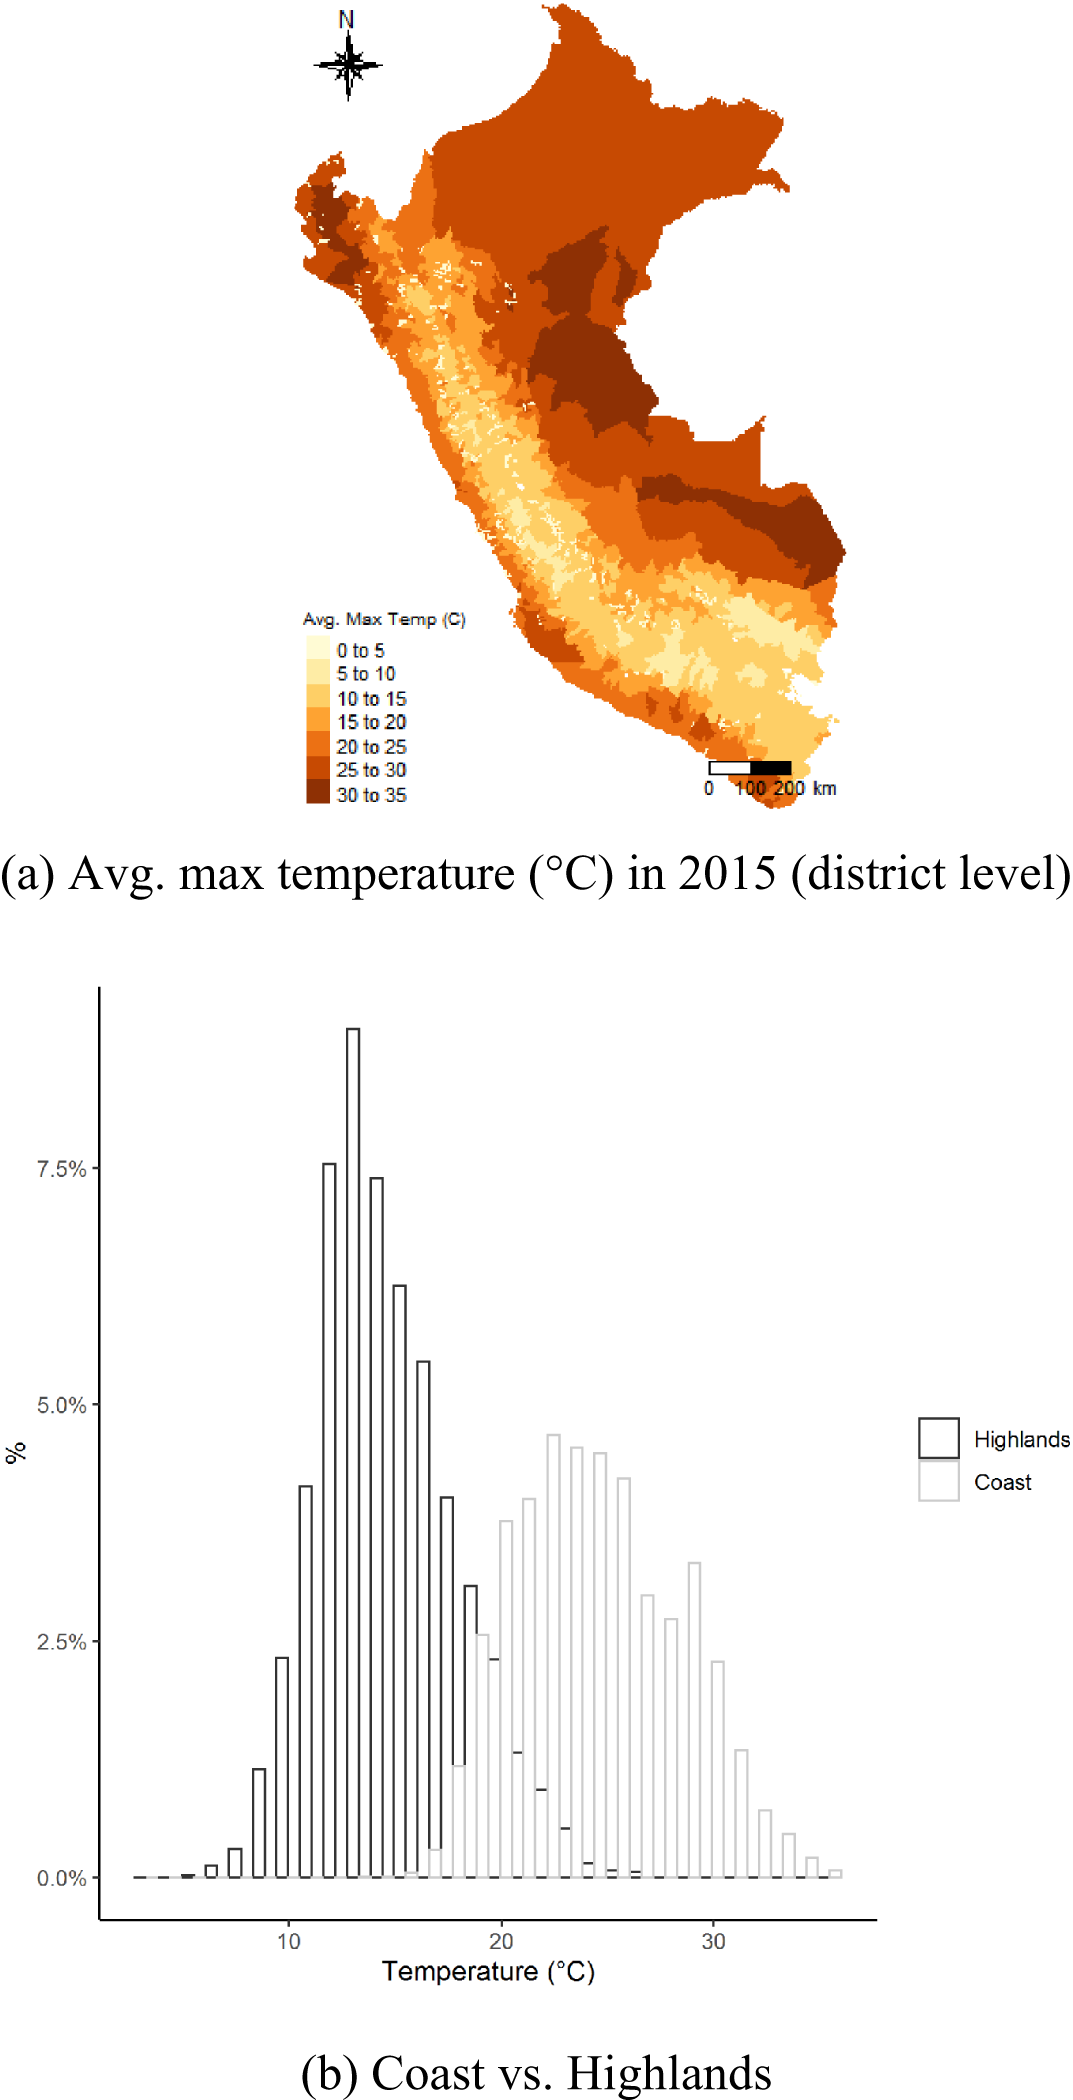
Peru is geographically divided into three main regions — the coast, the highlands, and the jungle — and is considered highly vulnerable to climate change. The country features low-lying coastal zones; arid and semi-arid areas; regions prone to flooding, drought, and desertification; fragile mountain ecosystems; disaster-prone zones; areas affected by high levels of urban air pollution; and economies that rely heavily on income from fossil fuel production and use (MINAM, 2015). These characteristics correspond to seven of the nine criteria established by the United Nations for classifying a country as particularly vulnerable to climate change. Additionally, Peru exhibits significant climatic diversity, encompassing over 70 per cent of the world’s climate types (MINAM, 2014). The vast majority of this climatic diversity is concentrated in the coastal and highland regions of the country (SENAMHI, 2020). Figure 1 illustrates the distribution of temperatures across Peru.
Temperature distribution in Peru.
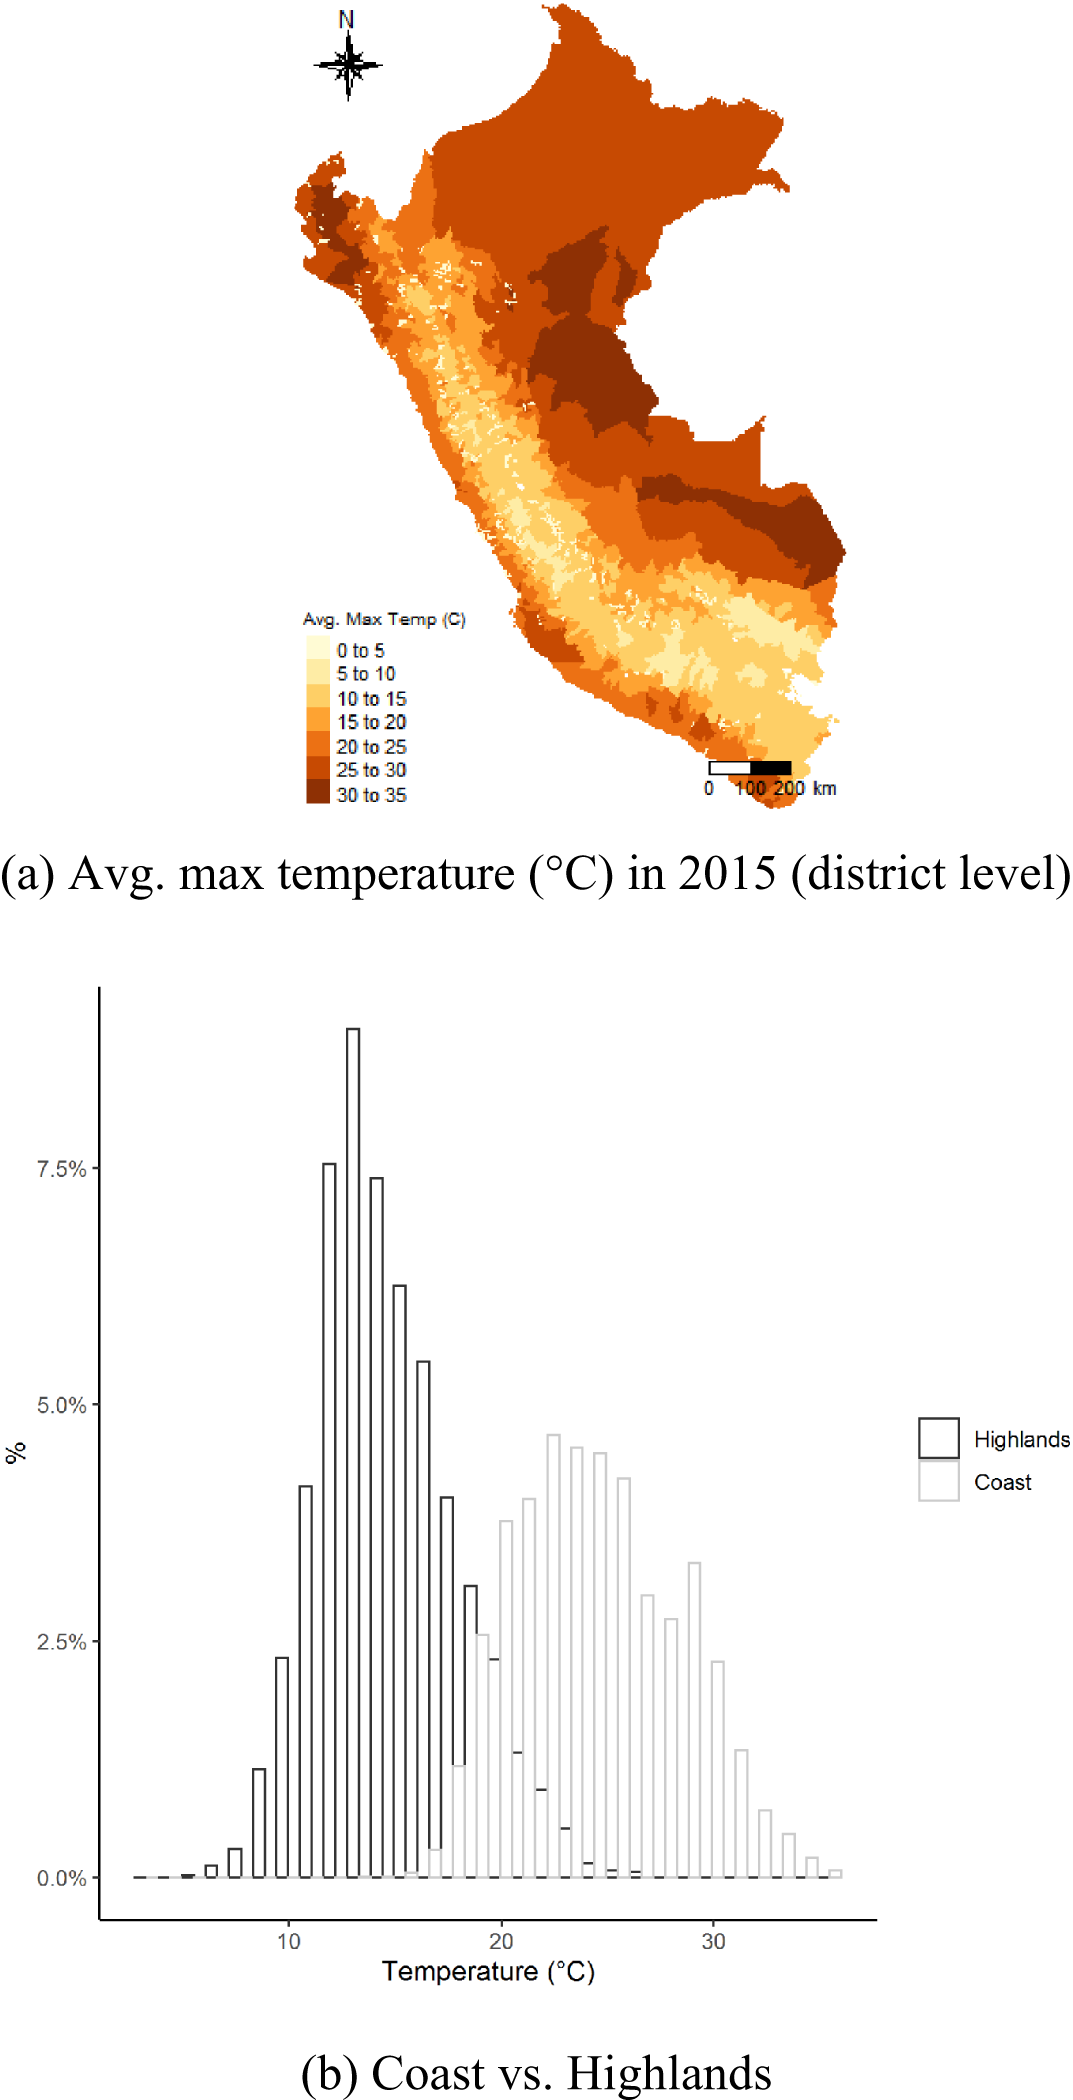
Figure 1 Long description
The image A showing text: (a) Avg. max temperature (degree Celsius) in 2015 (district level). A thematic map of Peru labeled with a legend titled Avg. Max Temp (C). Legend categories: 0 to 5, 5 to 10, 10 to 15, 15 to 20, 20 to 25, 25 to 30, 30 to 35. A compass symbol labeled N is shown. A scale bar shows 0, 100, 200 km. The map shows multiple temperature categories across the country, including areas in the 0 to 5 category and areas in the 30 to 35 category. The image B showing text: (b) Coast vs. Highlands. A histogram with two bar outlines and a legend labeled Highlands and Coast. The horizontal axis label is Temperature (degree Celsius). The vertical axis label is percent, with tick labels 0.0 percent, 2.5 percent, 5.0 percent, 7.5 percent. The Highlands distribution is concentrated around temperatures near 10 to 18 degree Celsius, with the tallest bars around the low teens and reaching above 7.5 percent. The Coast distribution is concentrated around temperatures near 18 to 33 degree Celsius, with the tallest bars around the low to mid 20s and reaching below 5.0 percent. The two distributions overlap around temperatures near 18 to 20 degree Celsius.
3. Data
This paper examines the relationship between temperature changes and work-time allocation. We combine worker-level data from household surveys with meteorological reanalysis data for Peru. The unit of observation is the worker-year, and weather conditions (temperature, relative humidity, and rainfall) are assigned to each household by overlaying meteorological data with the household’s geographic coordinates (longitude and latitude). The analysis is restricted to workers in the coastal and highland regions — which together represent over 85 per cent of the country’s labour market — due to limitations in satellite data accuracy for the jungle region (Aragón et al., Reference Aragón, Oteiza and Rud2021). The final sample includes 113,392 worker-year observations spanning the period from 2007 to 2015. Summary statistics for the main variables are presented in table A1 of the appendix.
3.1 Labour data
We use two panel datasets from the Peruvian Living Standards Survey (ENAHO), one covering the period 2007–2011 and the other covering the period 2011–2015. This nationally representative survey collects data year-round at both the household and individual levels. Each worker in the panel is interviewed during the same calendar month across different years, which helps control for seasonality in weather. The households that participated in the 2007–2011 panel differ from those in the 2011–2015 panel, with the exception of a subset of households that were interviewed in 2011 and appear in both panels. Within each panel period, households can be observed for two to five years, depending on their participation. It is important to note that households present in both panels may have data spanning up to six years (see the number of years households and individuals are observed in our sample in table A7 in the appendix). Households were included in the main analysis if they were observed at least twice in either the 2007–2011 or the 2011–2015 panels. These may consist of households appearing exclusively in the first panel, exclusively in the second, or in both. For robustness, the repeated cross-section sample is also employed, which includes all households regardless of the number of appearances, thereby incorporating households observed only once.
This survey includes the interview date and provides geographic coordinates (longitude and latitude) for each participating household. Less than 0.03 per cent of the sample was excluded due to missing geographic information. While we observe the household location, the precise coordinates of the workplace are not available. However, according to the 2017 National Census, 67 per cent of the national labour force works within their residential district, which helps mitigate concerns about the absence of precise workplace coordinates.
We use the employment module to calculate total daily and weekly working hours for each individual, regardless of the number of jobs held. Notably, 26 per cent of the sample reported having a secondary job, while only 1 per cent reported zero hours worked. In this module, working-age individuals provided detailed information on their time allocation to work for each day of the reference week — defined as the week immediately preceding the interview date — along with other socio-economic characteristics.
3.2 Temperature and (relative) humidity
We use data from ERA5, produced by the European Centre for Medium-Range Weather Forecasts (Muñoz Sabater, Reference Muñoz Sabater2019) to calculate average, maximum, and minimum daily temperatures and daily relative humidity for each household location. ERA5 offers hourly observations of surface air temperature and humidity on a 0.25 × 0.25 degree latitude-longitude grid, providing significantly higher spatial and temporal resolution than its predecessor, the widely used ERA-Interim archive (Auffhammer et al., Reference Auffhammer, Hsiang, Schlenker and Sobel2013). When temperature data are missing for a specific day and household location — cases that account for 2.80 per cent of the sample — we impute values using temperature data from other households within the same district on that day. Additionally, we calculate relative humidity using the August-Roche-Magnus approximation following the guidelines of the US Environmental Protection Agency.Footnote 1
For the main analysis, temperature is categorised into seven bins of 3°C increments: <12°C, 12–15°C, 15–18°C, 18–21°C, 21–24°C, 24–27°C, and >27°C. These bins are constructed using the daily maximum temperature at the household’s location. For each reference week, we count the number of days that fall into each temperature bin. These counts enter the regressions as explanatory variables, with the 18–21°C bin omitted as the reference category. Since the dependent variable is total weekly hours worked, the estimated coefficients are interpreted as the marginal effect, in weekly hours, of substituting one day in the reference bin (18–21°C) with one day in the corresponding temperature bin.
3.3 Precipitation
We use precipitation data from two sources: the Peruvian Interpolated data of SENAMHI’s Climatological and Hydrological Observations (SENAMHI PISCOp), developed by Aybar et al. (Reference Aybar, Fernández, Huerta, Lavado, Vega and Felipe-Obando2019) and the Climate Hazards Group InfraRed Precipitation with Station data (CHIRPS), developed by Funk et al. (Reference Funk, Peterson, Landsfeld, Pedreros, Verdin, Shukla, Husak, Rowland, Harrison, Hoell and Michaelsen2015). SENAMHI PISCOp provides monthly precipitation estimates on a 0.1 × 0.1 degree latitude-longitude grid, combining data from ground-based monitoring stations and CHIRPS. For robustness checks, we also incorporate monthly precipitation data from CHIRPS at a fine 0.05 × 0.05 degree resolution. It is important to note that SENAMHI PISCOp achieves its highest accuracy for the Pacific coast and the western flank of the Andes in Peru. To obtain daily rainfall estimates, we divide the monthly precipitation values by the number of days in the corresponding month.
3.4 Daylight
We calculate daily daylight hours for each weekday by measuring the difference between sunset and sunrise times at each household location. These times are derived using standard astronomical algorithms, based on the specific date each individual worked and the residential geographic coordinates provided in the ENAHO survey.
4. Empirical approach
To examine the effect of temperature shocks on work time, we estimate the following baseline model using panel data with location and time fixed effects:
 \begin{equation}{y_{idt}} = f\!\left({\beta ,\,{w_{it}}} \right)\, + \,{\alpha _d}\, + \,{\lambda _t}\, + \,\delta {Z_{dt}}\, + \,\theta {X_{idt}}\, + \,{\varepsilon _{idt}}\end{equation}
 where the unit of observation is worker  $i$ in district $d$ in year $t$.
$t$.  ${y_{idt}}$ represents the labour outcome variable: total hours worked during the reference week of a given year;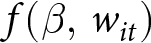 $f\!\left({\beta ,\,{w_{it}}} \right)$ is a nonlinear function of temperature ${w_{it}}$; and $\beta $ is the parameter of interest. Temperature is categorised into seven bins of 3°C increments. Bin 18–21°C serves as the reference category, as it falls within the human thermal ‘comfort zone’ of 18–22°C (Heal and Park, Reference Heal and Park2016), and it also corresponds to the average maximum temperature observed in our sample. $\beta $ can then be interpreted as the effect on work hours of shifting a day with 18–21°C to a day with temperatures associated with bin $j$ during the week. Note that the number of bins was selected so that each bin contains information for at least 10 per cent of the sample. Robustness checks are conducted using alternative bin definitions. The model includes time fixed effects ${\lambda _t}$ to control for seasonality — captured through year-month and weekly dummies — and district fixed effects ${\alpha _d}$ to account for time-invariant local characteristics. The error term ${\varepsilon _{idt}}$ is clustered at the region-month level to address temporal and spatial correlation in temperature. Additionally, we implement the standard error correction proposed by Conley (Reference Conley1999, Reference Conley, Durlauf and Blume2010) using the algorithm developed by Colella et al. (Reference Colella, Lalive, Sakalli and Thoenig2019). Our identification strategy relies on plausibly exogenous year-to-year variation in temperature within districts, allowing us to estimate whether individuals work more or fewer hours in relatively warmer years, conditional on location-specific and seasonal controls.
Although the baseline model reduces concerns about omitted variable bias (Deschênes and Greenstone, Reference Deschênes and Greenstone2007), we include an additional set of controls,  ${Z_{dt}}$, capturing district-level weather conditions that may be correlated with temperature and independently influence working hours — specifically, rainfall, relative humidity, and daylight hours. We also include a vector of individual-level sociodemographic controls, ${X_{idt}}$, which accounts for characteristics such as age, gender, rural residence, and the presence of dependents. As a robustness check, we replace ${X_{idt}}$ with individual fixed effects to control for time-invariant unobserved heterogeneity at the individual level.
A potential concern with the baseline model is that the inclusion of fixed effects may absorb a substantial portion of the variation in weather, potentially leading to attenuation bias in the estimated temperature effects (Auffhammer et al., Reference Auffhammer, Hsiang, Schlenker and Sobel2013). To assess this, we follow the approach used in previous studies (Guiteras, Reference Guiteras2009; Fisher et al., Reference Fisher, Hanemann, Roberts and Schlenker2012; Jessoe et al., Reference Jessoe, Manning and Taylor2016; Schwarz, Reference Schwarz2018) and regress temperature on various combinations of fixed effects and time trends. The residuals from these regressions capture the remaining variation in temperature after accounting for fixed effects, providing a measure of the identifying variation available in our empirical strategy. Ideally, the remaining variation in temperature should be comparable in magnitude to the changes projected by climate change models. In this paper, we consider a benchmark scenario involving a predicted temperature increase of 1°C. Table A2 in the appendix reports the R 2 from the regression, the standard deviation of the residuals, and the share of observations with residuals exceeding 1°C in absolute value. The remaining variation in weather is greater when using maximum temperature and when the model excludes individual fixed effects (see, for example, rows 7 and 21 in table A2). Table A3 in the appendix supports this conclusion, showing consistent results when each temperature bin is regressed on the various fixed effects specifications and time trends. These findings suggest that the data used in this study appear suitable for the baseline model in equation (1).
Finally, the empirical analysis leverages within-individual variation in working hours. Table A4 in the appendix presents a decomposition of the standard deviation of work hours into between- and within-individual components, following Kruger and Neugart (Reference Kruger and Neugart2018). The results confirm that while there is meaningful variation in the labour data, the between-individual variation in work hours is larger than the within-individual variation.
5. Results
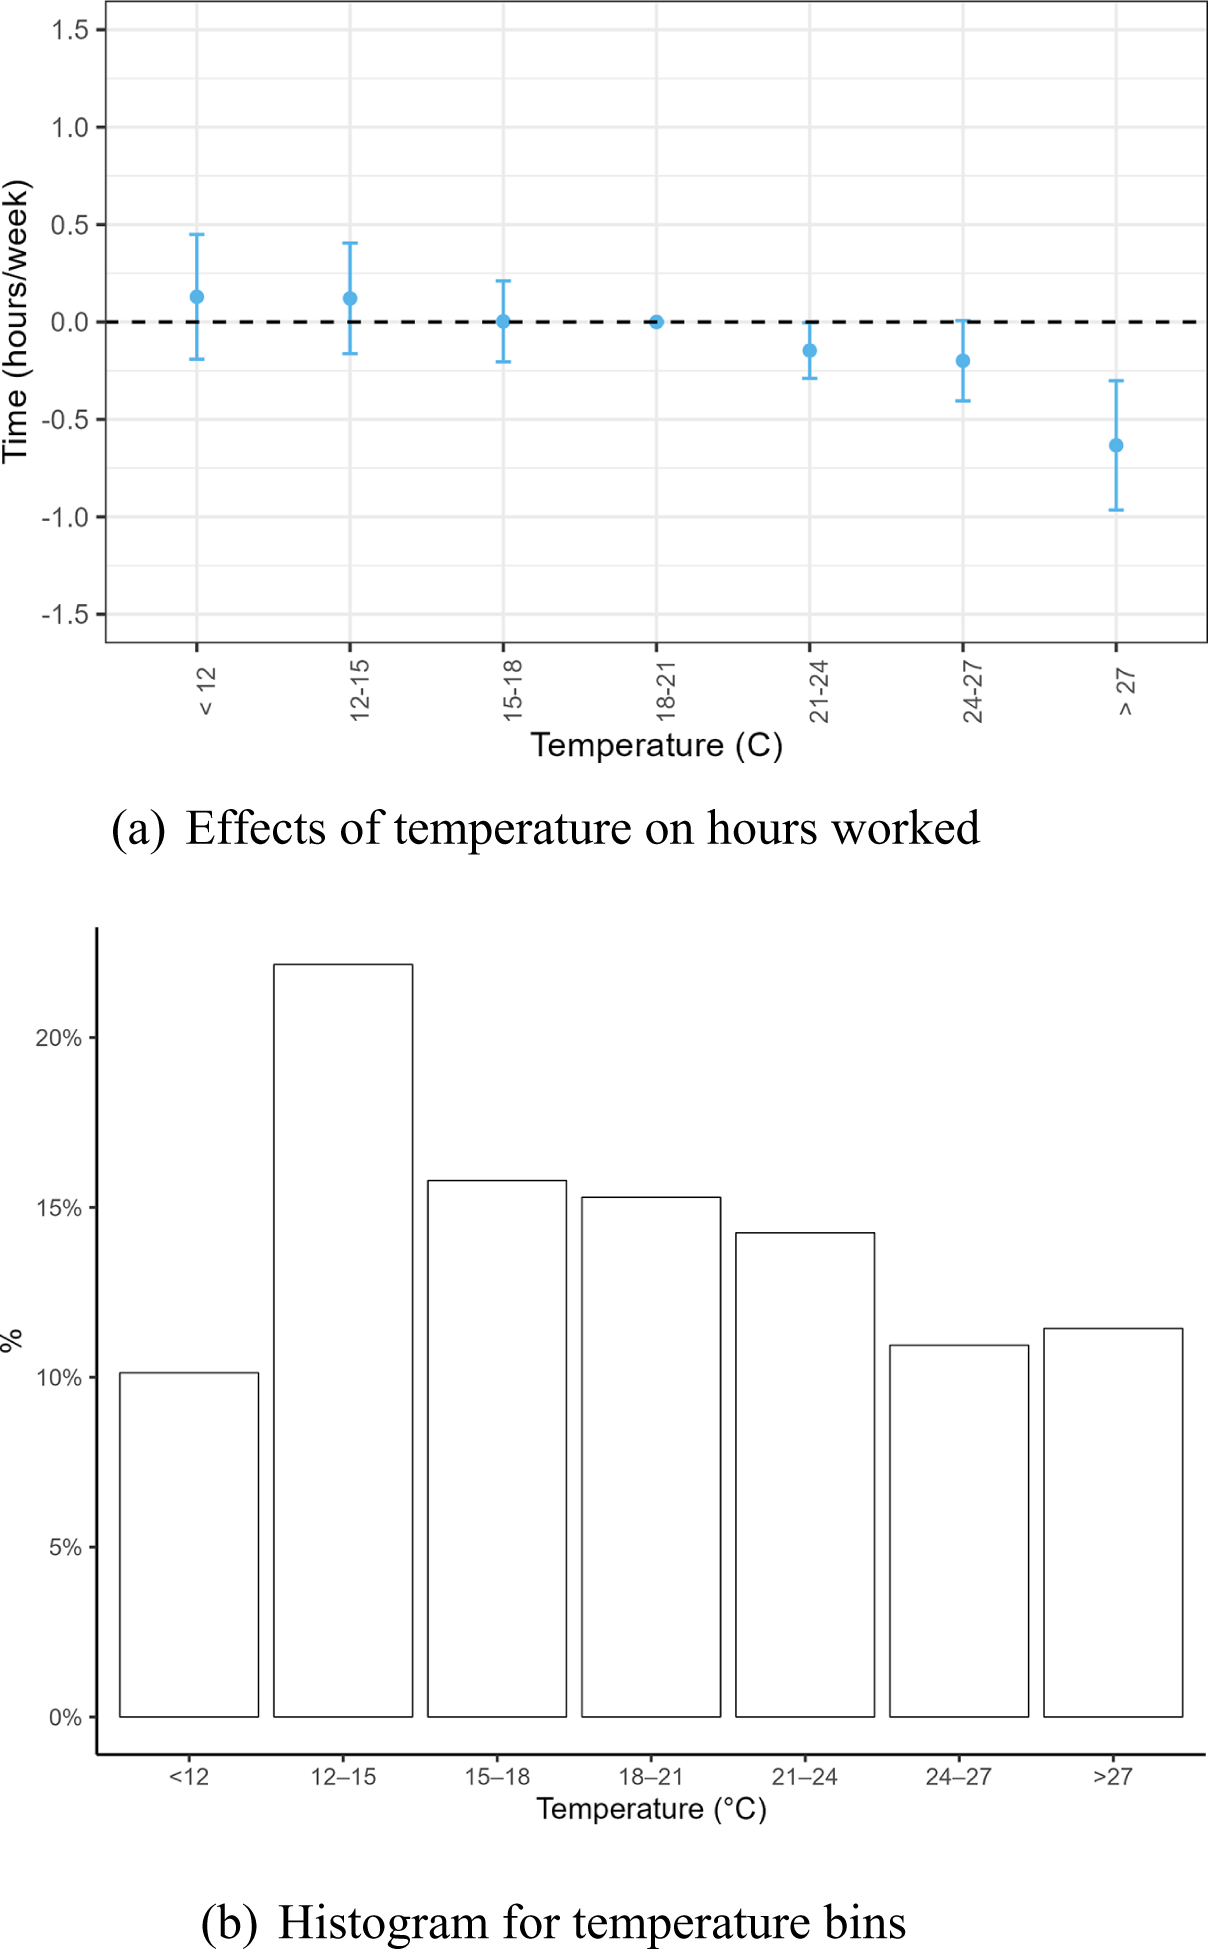
Figure 2 presents the main results from the baseline model. It plots the estimated effects on weekly work hours of replacing a day within the 18–21°C reference range with a day falling into a different temperature bin. The corresponding coefficient estimates and standard errors are reported in column (1) of table 1.
The effects of temperature on work time.
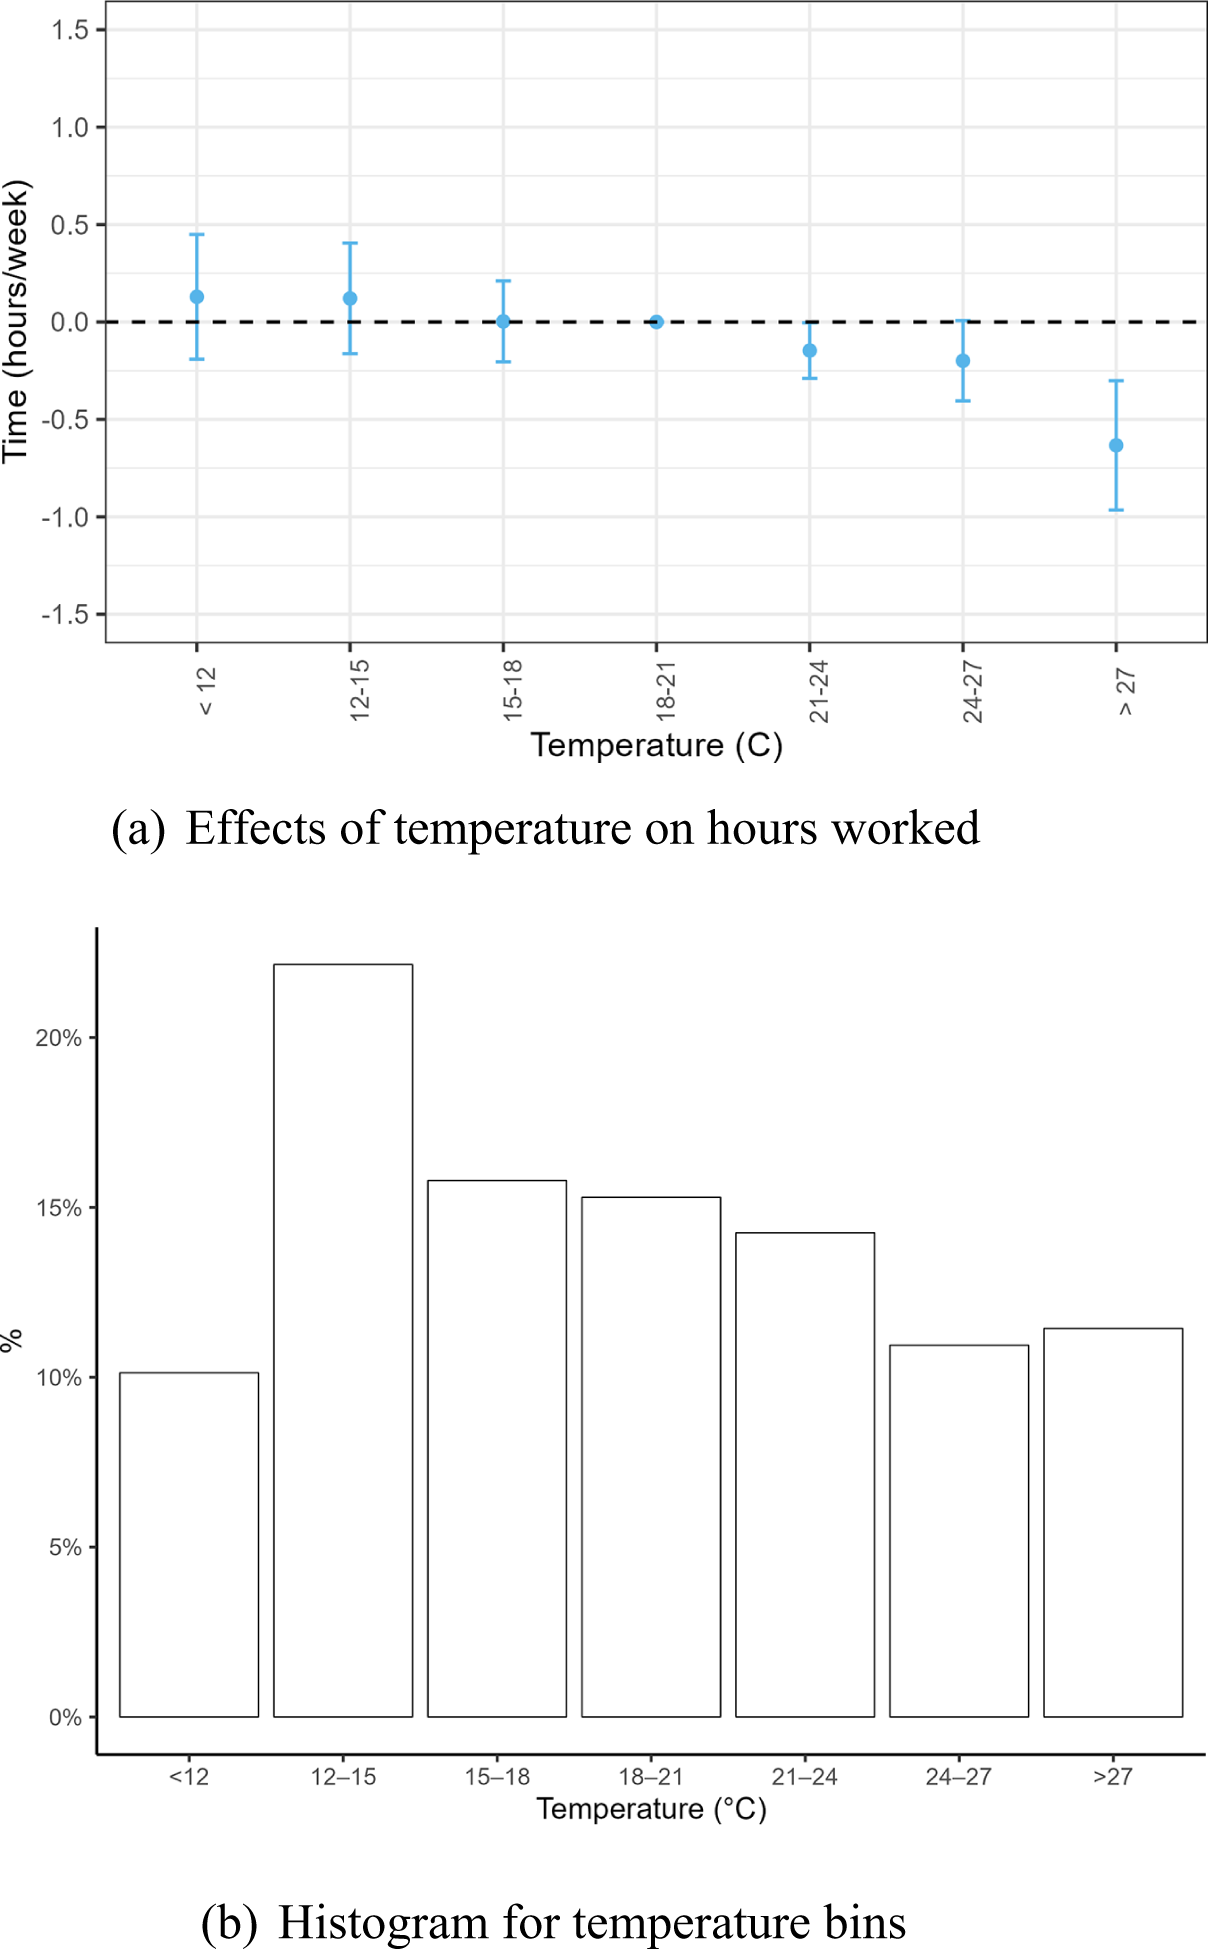
Figure 2 Long description
The image A showing (a) Effects of temperature on hours worked. Time (hours/week) Temperature (C) Horizontal axis categories: less than 12; 12 dash 15; 15 dash 18; 18 dash 21; 21 dash 24; 24 dash 27; greater than 27. Vertical axis tick labels: negative 1.5, negative 1.0, negative 0.5, 0.0, 0.5, 1.0, 1.5. A dashed horizontal reference line at 0.0. Plotted points with vertical error bars at each temperature category. Point positions relative to the 0.0 line: less than 12 above 0.0; 12 dash 15 above 0.0; 15 dash 18 on 0.0; 18 dash 21 on 0.0; 21 dash 24 below 0.0; 24 dash 27 below 0.0; greater than 27 below 0.0. The image B showing (b) Histogram for temperature bins. Vertical axis label: percent. Horizontal axis label: Temperature (degree C). Horizontal axis categories: less than 12; 12 dash 15; 15 dash 18; 18 dash 21; 21 dash 24; 24 dash 27; greater than 27. Vertical axis tick labels: 0 percent, 5 percent, 10 percent, 15 percent, 20 percent. Seven bars, one per temperature category. Bar heights relative to the tick labels: less than 12 near 10 percent; 12 dash 15 above 20 percent; 15 dash 18 above 15 percent; 18 dash 21 above 15 percent; 21 dash 24 below 15 percent; 24 dash 27 above 10 percent; greater than 27 above 10 percent.
Robustness checks
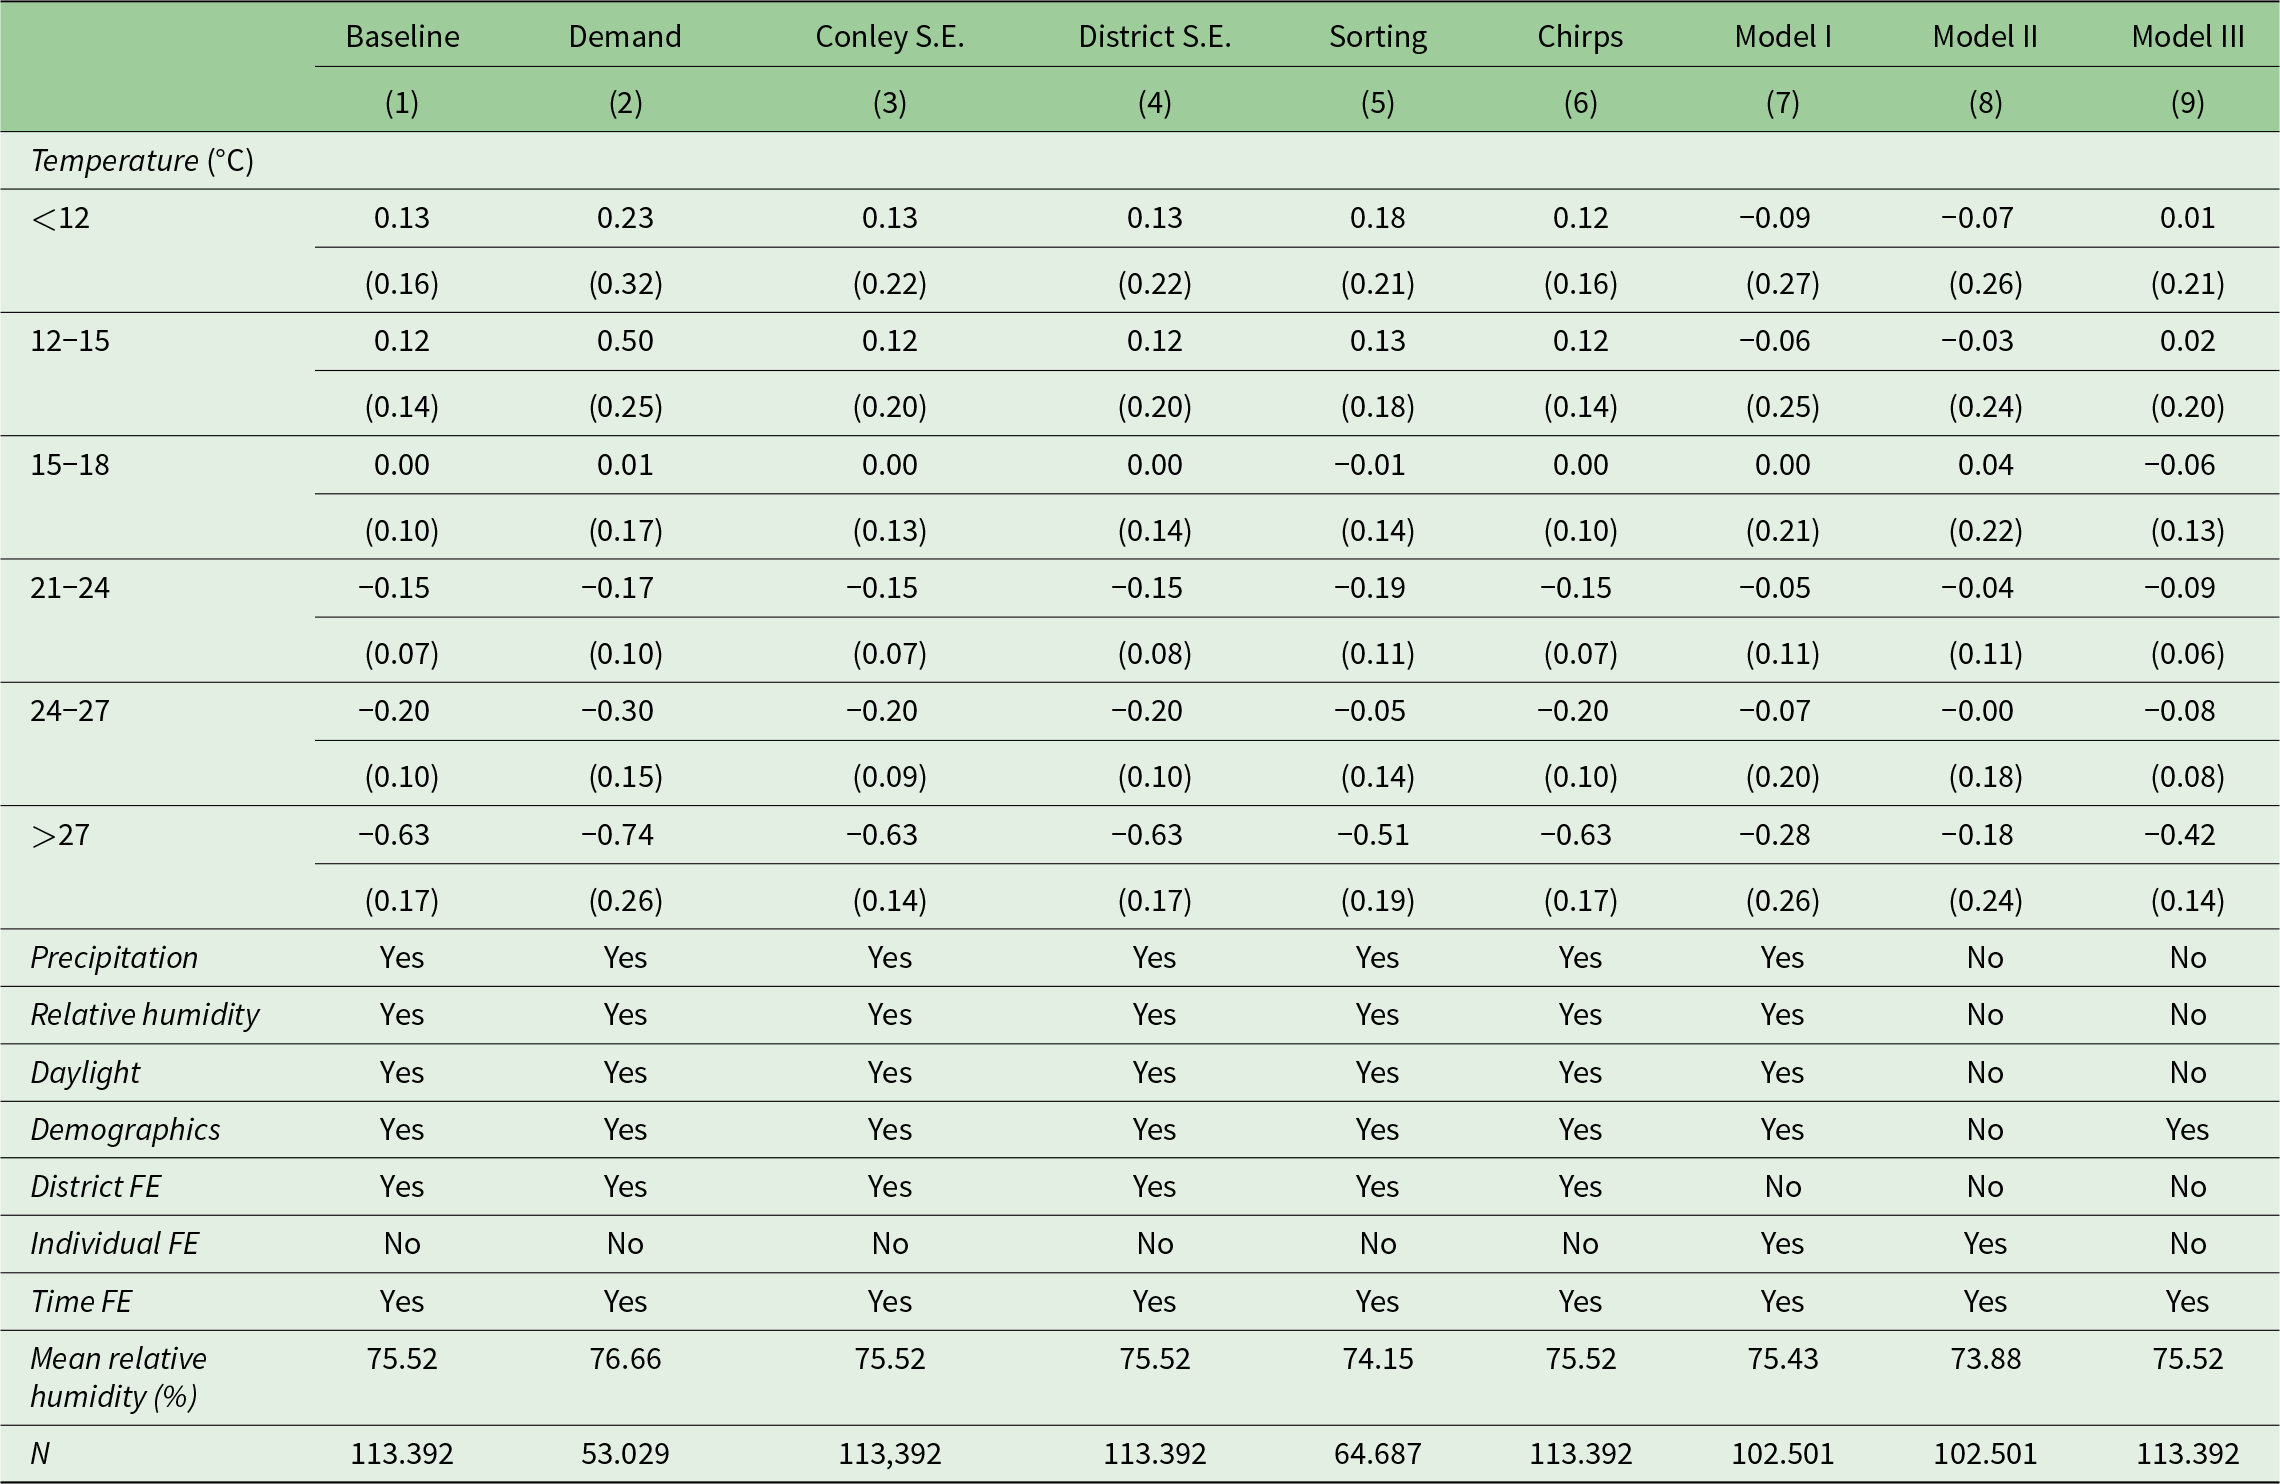
Table 1 Long description
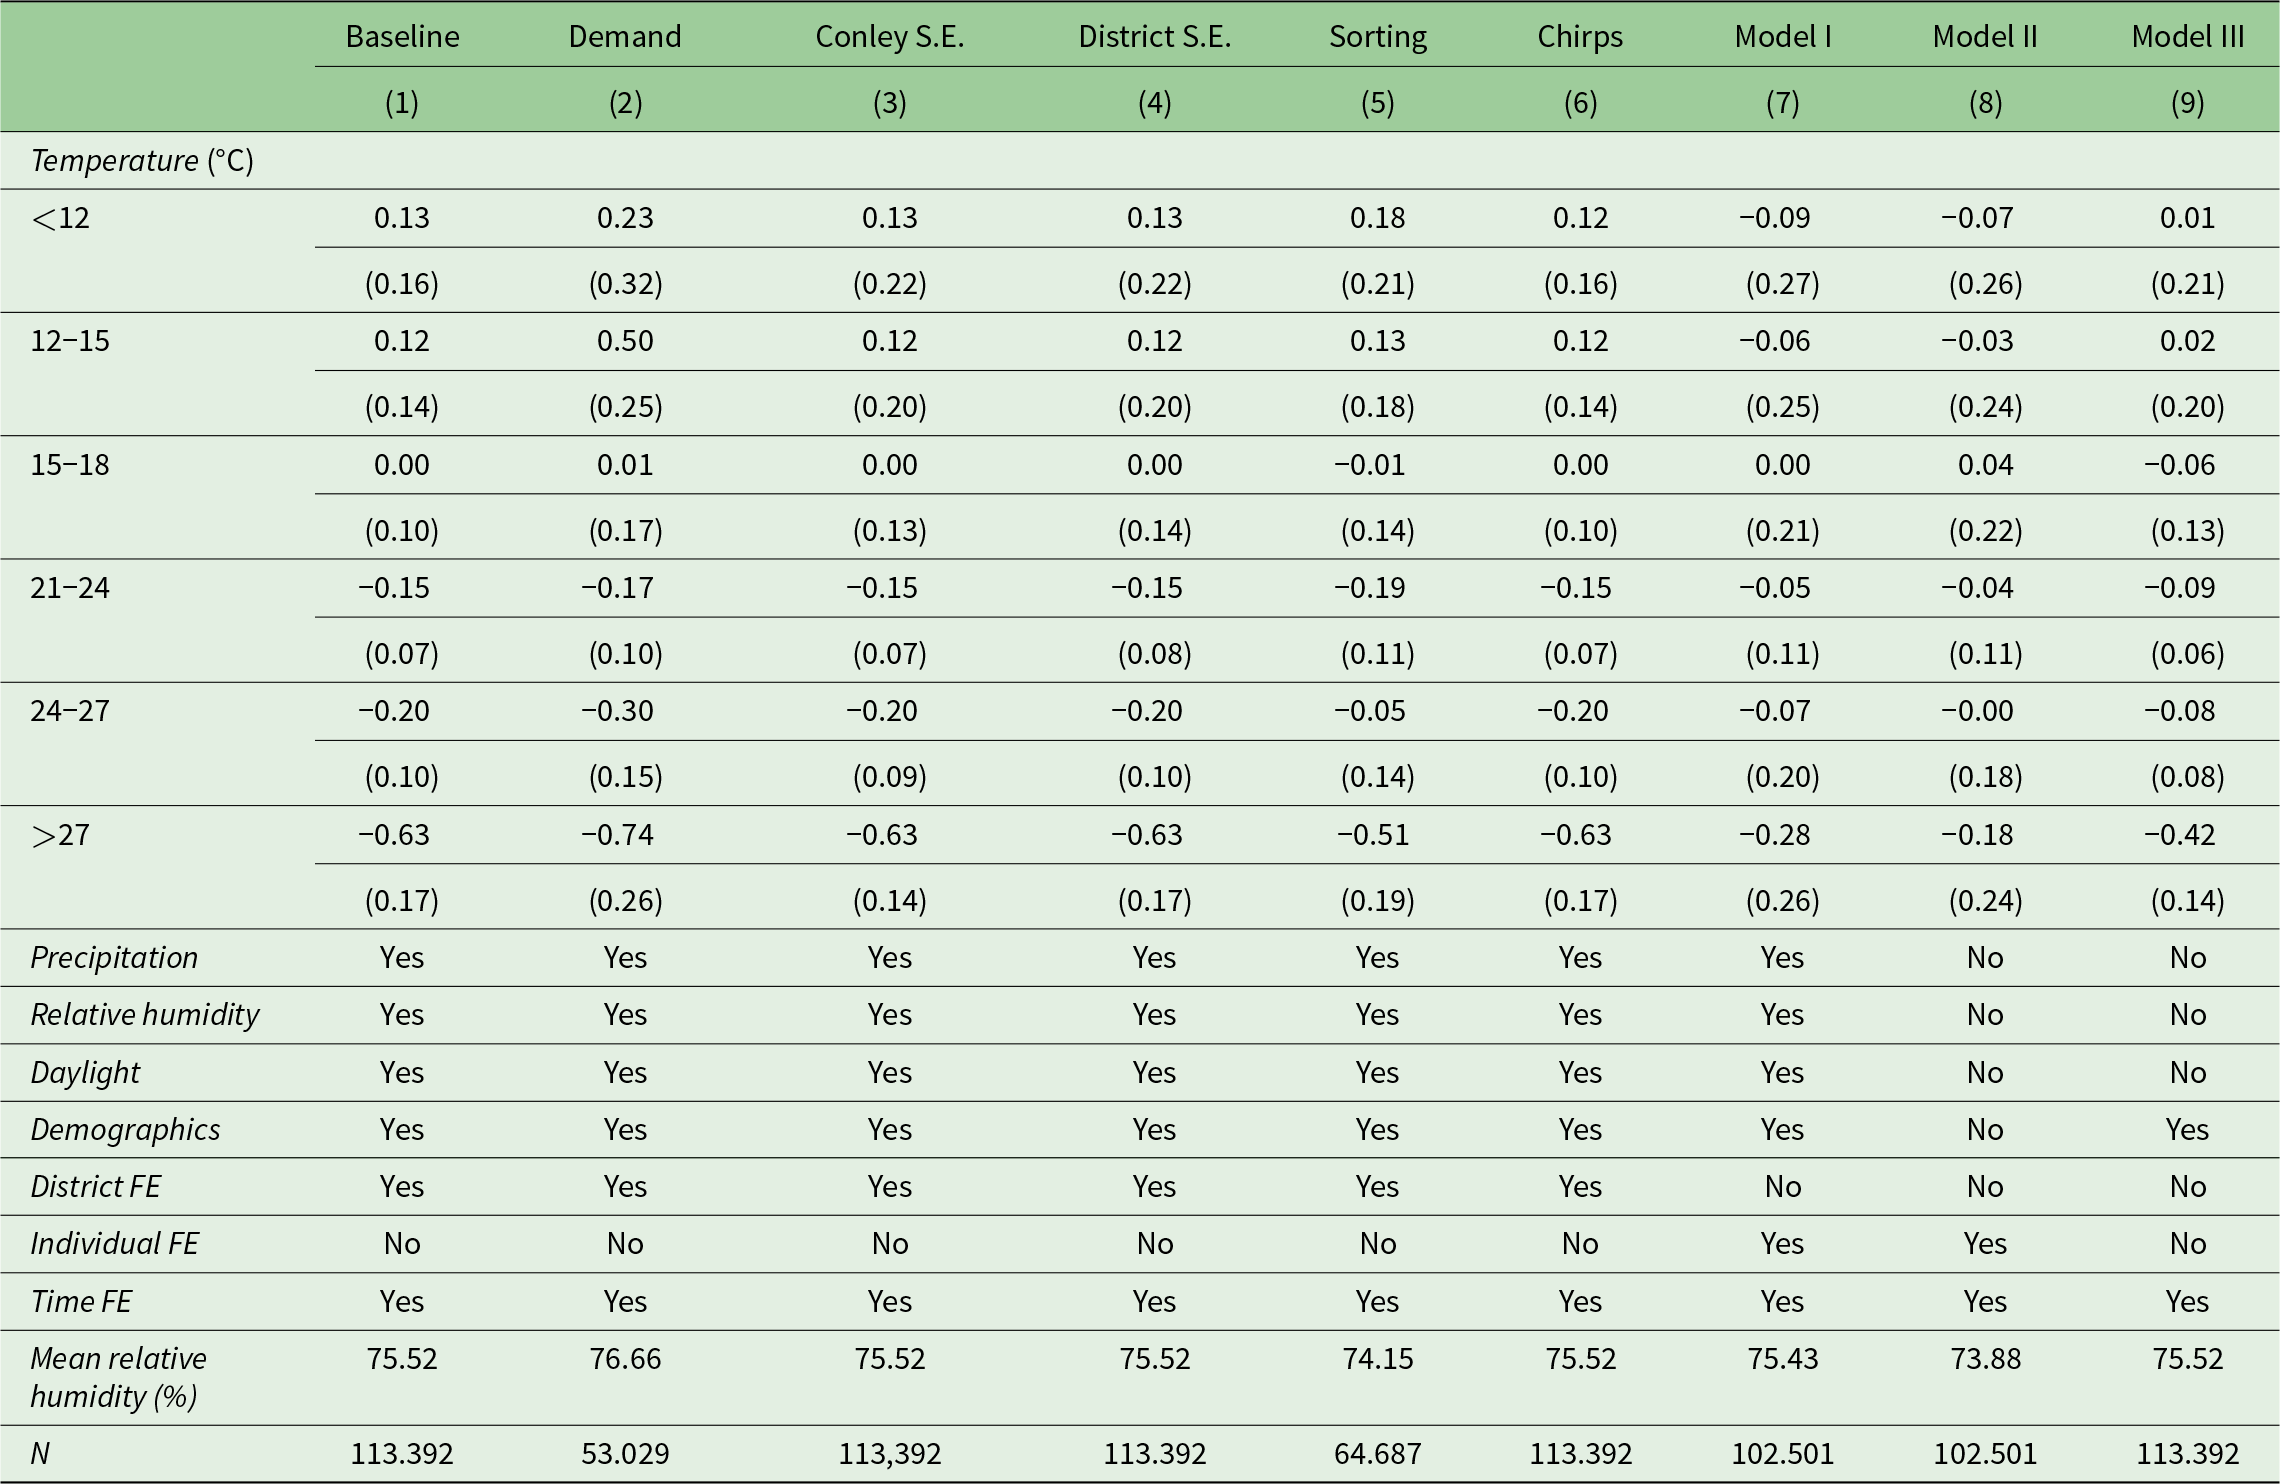
The table has nine columns: Baseline (1), Demand (2), Conley S.E. (3), District S.E. (4), Sorting (5), Chirps (6), Model I (7), Model II (8), Model III (9). Column names: Baseline (1); Demand (2); Conley S.E. (3); District S.E. (4); Sorting (5); Chirps (6); Model I (7); Model II (8); Model III (9). Row 1: Temperature (degrees Celsius) section header. Row 2: less than 12: coefficients 0.13; 0.23; 0.13; 0.13; 0.18; 0.12; -0.09; -0.07; 0.01. Row 3: Standard errors in parentheses for less than 12: (0.16); (0.32); (0.22); (0.22); (0.21); (0.16); (0.27); (0.26); (0.21). Row 4: 12–15: coefficients 0.12; 0.50; 0.12; 0.12; 0.13; 0.12; -0.06; -0.03; 0.02. Row 5: Standard errors in parentheses for 12–15: (0.14); (0.25); (0.20); (0.20); (0.18); (0.14); (0.25); (0.24); (0.20). Row 6: 15–18: coefficients 0.00; 0.01; 0.00; 0.00; -0.01; 0.00; 0.00; 0.04; -0.06. Row 7: Standard errors in parentheses for 15–18: (0.10); (0.17); (0.13); (0.14); (0.14); (0.10); (0.21); (0.22); (0.13). Row 8: 21–24: coefficients -0.15; -0.17; -0.15; -0.15; -0.19; -0.15; -0.05; -0.04; -0.09. Row 9: Standard errors in parentheses for 21–24: (0.07); (0.10); (0.07); (0.08); (0.11); (0.07); (0.11); (0.11); (0.06). Row 10: 24–27: coefficients -0.20; -0.30; -0.20; -0.20; -0.05; -0.20; -0.07; -0.00; -0.08. Row 11: Standard errors in parentheses for 24–27: (0.10); (0.15); (0.09); (0.10); (0.14); (0.10); (0.20); (0.18); (0.08). Row 12: greater than 27: coefficients -0.63; -0.74; -0.63; -0.63; -0.51; -0.63; -0.28; -0.18; -0.42. Row 13: Standard errors in parentheses for greater than 27: (0.17); (0.26); (0.14); (0.17); (0.19); (0.17); (0.26); (0.24); (0.14). Row 14: Precipitation: Yes; Yes; Yes; Yes; Yes; Yes; Yes; No; No. Row 15: Relative humidity: Yes; Yes; Yes; Yes; Yes; Yes; Yes; No; No. Row 16: Daylight: Yes; Yes; Yes; Yes; Yes; Yes; Yes; No; No. Row 17: Demographics: Yes; Yes; Yes; Yes; Yes; Yes; Yes; No; Yes. Row 18: District FE: Yes; Yes; Yes; Yes; Yes; Yes; No; No; No. Row 19: Individual FE: No; No; No; No; No; No; Yes; Yes; No. Row 20: Time FE: Yes; Yes; Yes; Yes; Yes; Yes; Yes; Yes; Yes. Row 21: Mean relative humidity (percent): 75.52; 76.66; 75.52; 75.52; 74.15; 75.52; 75.43; 73.88; 75.52. Row 22: N: 113.392; 53.029; 113.392; 113.392; 64.687; 113.392; 102.501; 102.501; 113.392. Across the temperature rows, the coefficients are near zero at 15–18 (0.00; 0.01; 0.00; 0.00; -0.01; 0.00; 0.00; 0.04; -0.06) and are more negative at higher temperatures, with the most negative values in the greater than 27 row (-0.63; -0.74; -0.63; -0.63; -0.51; -0.63; -0.28; -0.18; -0.42).
Notes: This table reports estimated coefficients and standard errors from regressions of total weekly working hours on temperature bins for all workers. Column (1) presents the baseline model. Column (2) excludes workers in agriculture, forestry, fishing, and construction. Column (3) uses Conley standard errors to correct for spatial and temporal correlation. Column (4) clusters standard errors at the district level. Column (5) restricts the sample to individuals currently living in the district where they were born. Column (6) re-estimates the baseline model using CHIRPS precipitation data. Column (7) replicates the empirical model in Garg et al. (Reference Garg, Gibson and Sun2020). Columns (8) and (9) replicate the specifications used in Schwarz (Reference Schwarz2018). Unless otherwise noted, standard errors (in parentheses) are clustered at the region-month level. For Columns (3), (4), (7), (8), and (9), standard errors are clustered at the district level.
We find evidence that high temperatures negatively affect hours worked across the overall labour market. These results are consistent with findings from other developing countries, such as China, where Garg et al. (Reference Garg, Gibson and Sun2020) report that both extremely low and high temperatures reduce work hours. However, our findings differ from those in Mexico (Schwarz, Reference Schwarz2018), South Africa (Gray et al., Reference Gray, Taraz and Halliday2023), and the US (Zivin and Neidell, Reference Zivin and Neidell2014). In the US and South Africa, temperature appears to have no significant effect on aggregate work hours, while in Mexico, only low temperatures are associated with reductions in hours worked.
The overall magnitude of the estimated temperature effects on hours worked is relatively modest. As shown in figure 2, replacing a day within the ‘comfort zone’ temperature range (i.e., 18–21°C) with a day above 27°C is associated with a reduction of approximately 37.8 minutes (or 0.63 hours) of work time over the course of a week. This finding is consistent with observations from the ILO (2019), which reports that temperatures above 26°C impair work capacity. However, our estimate is smaller than the 1.2-hour weekly reduction reported for China over the same temperature range by Garg et al. (Reference Garg, Gibson and Sun2020). One possible explanation for this discrepancy is Peru’s higher rate of self-employment, which may allow for greater flexibility in adjusting work schedules in response to temperature fluctuations, thereby dampening the overall effect.
However, our estimated effects imply a non-negligible economic impact. To illustrate the potential aggregate implications, we combine our estimated reduction of 0.63 hours in labour supply with official 2017 statistics from the Central Reserve Bank of Peru and the National Institute of Statistics and Informatics. These include an employed population of 15,677,384 individuals, an average hourly labour income of 7 PEN (Peruvian nuevo sol), and a national GDP of 632,992 million PEN. A back-of-the-envelope calculation suggests that elevated temperatures could lead to a reduction in GDP of approximately 0.6 per cent. Thus, while the estimated effect of 0.63 hours corresponds to a modest 1.45 per cent decline in the average number of hours worked per week, its impact is distributed across millions of workers, resulting in aggregate economic losses that are economically significant.
5.1 Robustness checks
Table 1 demonstrates the robustness of the main findings across a variety of model specifications. Column (1) reports the estimates from our baseline model, as specified in equation (1). In column (2), we exclude workers in sectors where labour demand is more sensitive to temperature — namely, agriculture, forestry, fishing, and construction (Kruger and Neugart, Reference Kruger and Neugart2018) — to address concerns that the observed effects may be driven by labour demand rather than labour supply. This concern is further mitigated by our focus on short-run, year-to-year variations, where changes in wages, employers, or employment contracts are less likely to occur (Connolly, Reference Connolly2008). Table A9 in the appendix presents additional evidence to mitigate this concern by directly adding demand conditions to the set of covariates, such as employment and unemployment rates, and regional GDP. Column (3) of table 1 applies the spatial and temporal correlation correction proposed by Conley (Reference Conley1999, Reference Conley, Durlauf and Blume2010) using the implementation developed by Colella et al. (Reference Colella, Lalive, Sakalli and Thoenig2019). Column (4) clusters standard errors at the district level, which corresponds to the cross-sectional level of exogenous variation in temperature. In column (5), we address potential residential sorting by excluding individuals who do not currently live in the district where they were born — under the assumption that individuals residing in their birth district remained there throughout the analysis period. Finally, column (6) uses CHIRPS precipitation data in place of SENAMHI PISCOp to test the sensitivity of results to the choice of weather data source. Across all specifications, the estimated effects remain consistent in both magnitude and sign with the baseline model and are statistically significant, reinforcing the robustness of our findings.
Table 1 also reports results from alternative model specifications drawn from existing studies on temperature and work hours. Column (7) estimates a model with individual fixed effects in place of district fixed effects, following the approach of Garg et al. (Reference Garg, Gibson and Sun2020). Column (8) includes individual fixed effects but omits controls for key weather-related variables — precipitation, relative humidity, and daylight hours — as in Schwarz (Reference Schwarz2018). When individual fixed effects are included [columns (7) and (8)], the main coefficients become statistically insignificant. This outcome reflects the limited within-individual variation in exposure to temperature shocks relative to the larger cross-sectional variation observed across districts. Consequently, part of the baseline estimates may be capturing between-subject rather than within-subject variation. Nonetheless, we contend that the estimated effects are not solely attributable to cross-sectional differences. As documented in section 6, the results are driven by informal workers, whose heightened sensitivity to temperature shocks arises from structural vulnerabilities — such as greater caregiving responsibilities, larger numbers of dependents, and lower access to electricity — rather than from simple sorting across warmer versus cooler regions. Column (9) follows another specification from Schwarz (Reference Schwarz2018) controlling only for time fixed effects and individual demographics. All alternative specifications are replicated as closely as possible, and the resulting estimates remain broadly consistent in magnitude and direction with those from the baseline model.
We also estimate our baseline model using the full repeated cross-section sample from ENAHO, which includes all individuals — regardless of whether they are part of the panel. The results show qualitatively similar patterns: high temperatures are associated with significant reductions in work hours for informal workers, while the effect is not statistically significant for the overall population and becomes positive and significant for formal workers (see table A8). These differences appear driven by changes in the composition of the sample, with a lower share of informal workers in the repeated cross-section. These findings confirm that the effects observed in the panel data hold more broadly across the labour force.
Tables A5 and A6 in the appendix present robustness checks based on alternative temperature bin specifications. Table A5 reports results using nine bins with 3°C increments, while table A6 uses narrower bins with 2°C increments. Across both specifications, the estimated effects remain consistent with those from the baseline model in terms of sign and magnitude, supporting the robustness of the main findings to alternative functional forms.
5.2 Intertemporal substitution
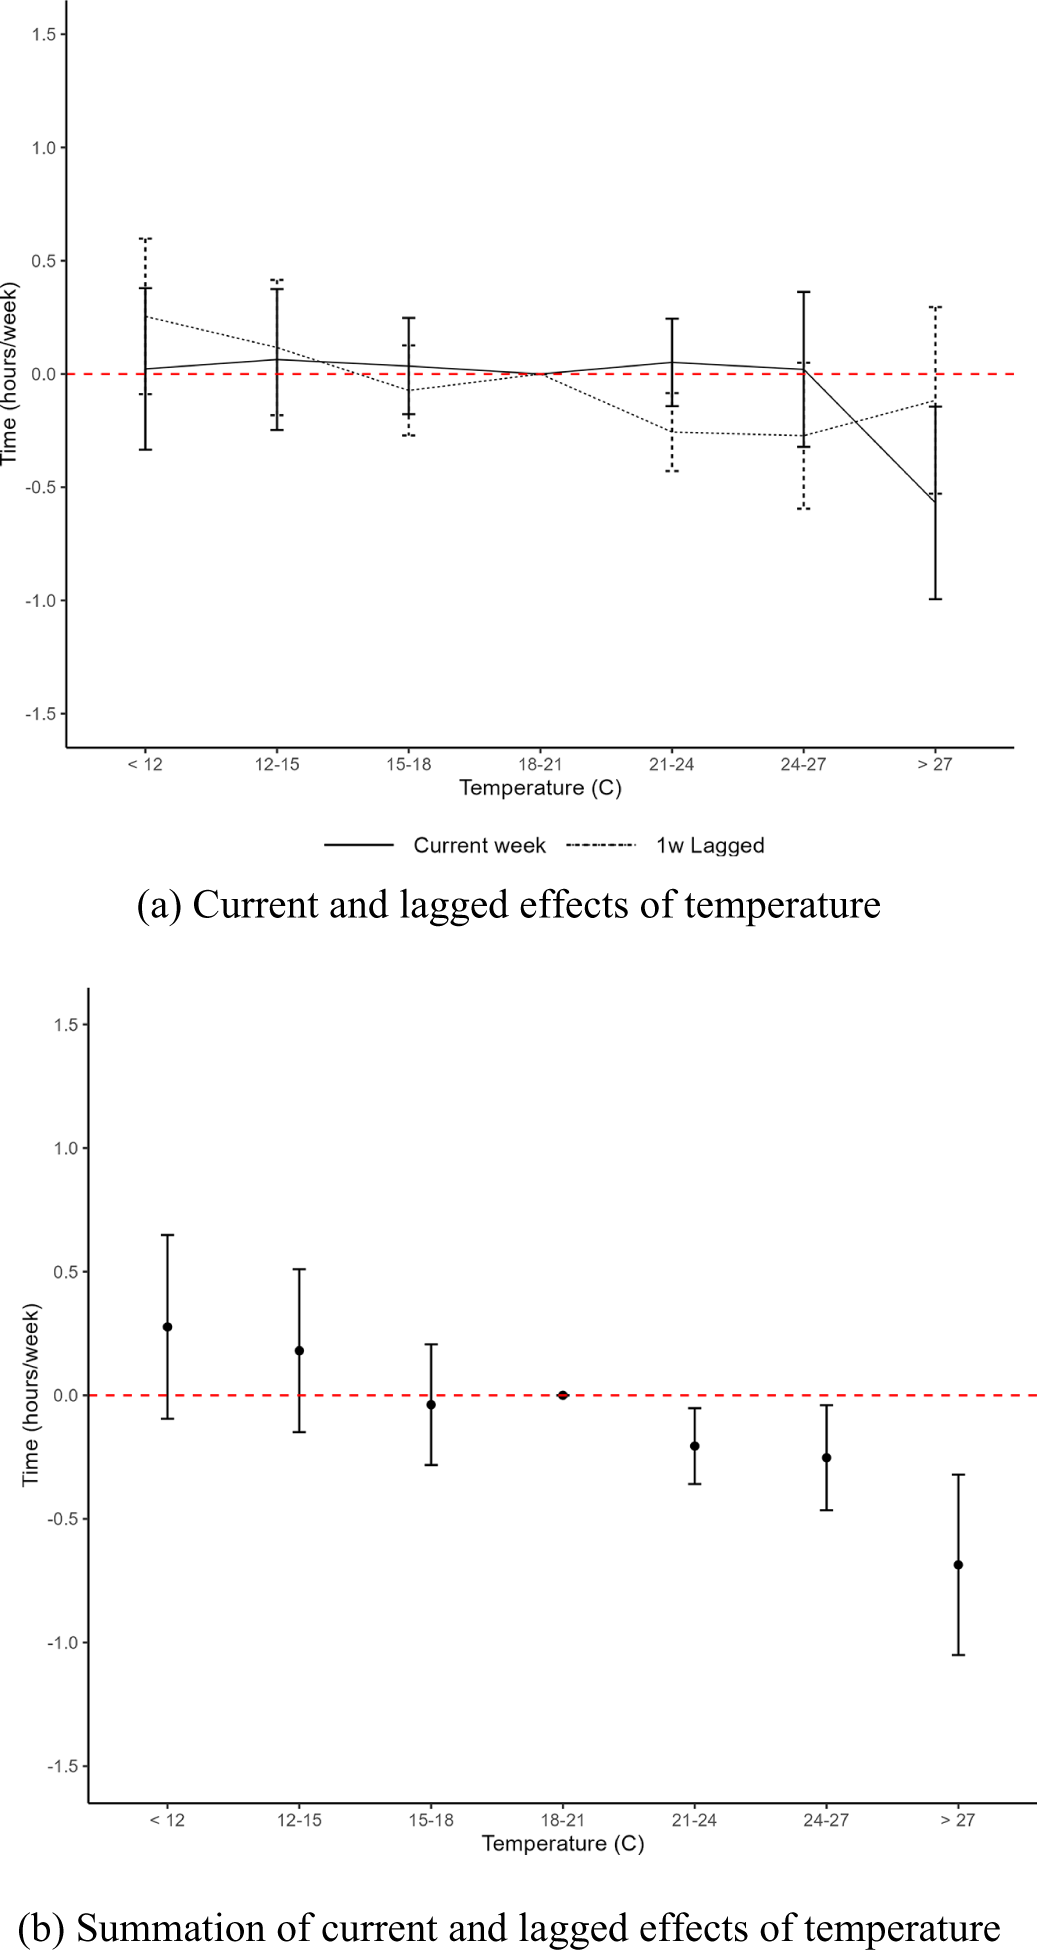
We find no evidence of intertemporal substitution of work hours across adjacent weeks in response to high temperatures. This is illustrated in figure 3, panel (a), where exposure to temperatures above 27°C is associated with a reduction in work hours during the same week (solid line). Similarly, high temperatures in the previous week are associated with lower work hours in the current week (dashed line), although this effect is not statistically significant. Panel (b) of figure 3 shows the combined effects of contemporaneous and lagged exposure, with the estimate for temperatures above >27°C remaining negative and statistically significant. These findings suggest that workers are not shifting work hours across weeks in response to high temperatures. Therefore, the effects reported in figure 2 are unlikely to be driven by intertemporal labour substitution and may reflect persistent, rather than temporary, impacts on labour supply.
Intertemporal labour substitution.
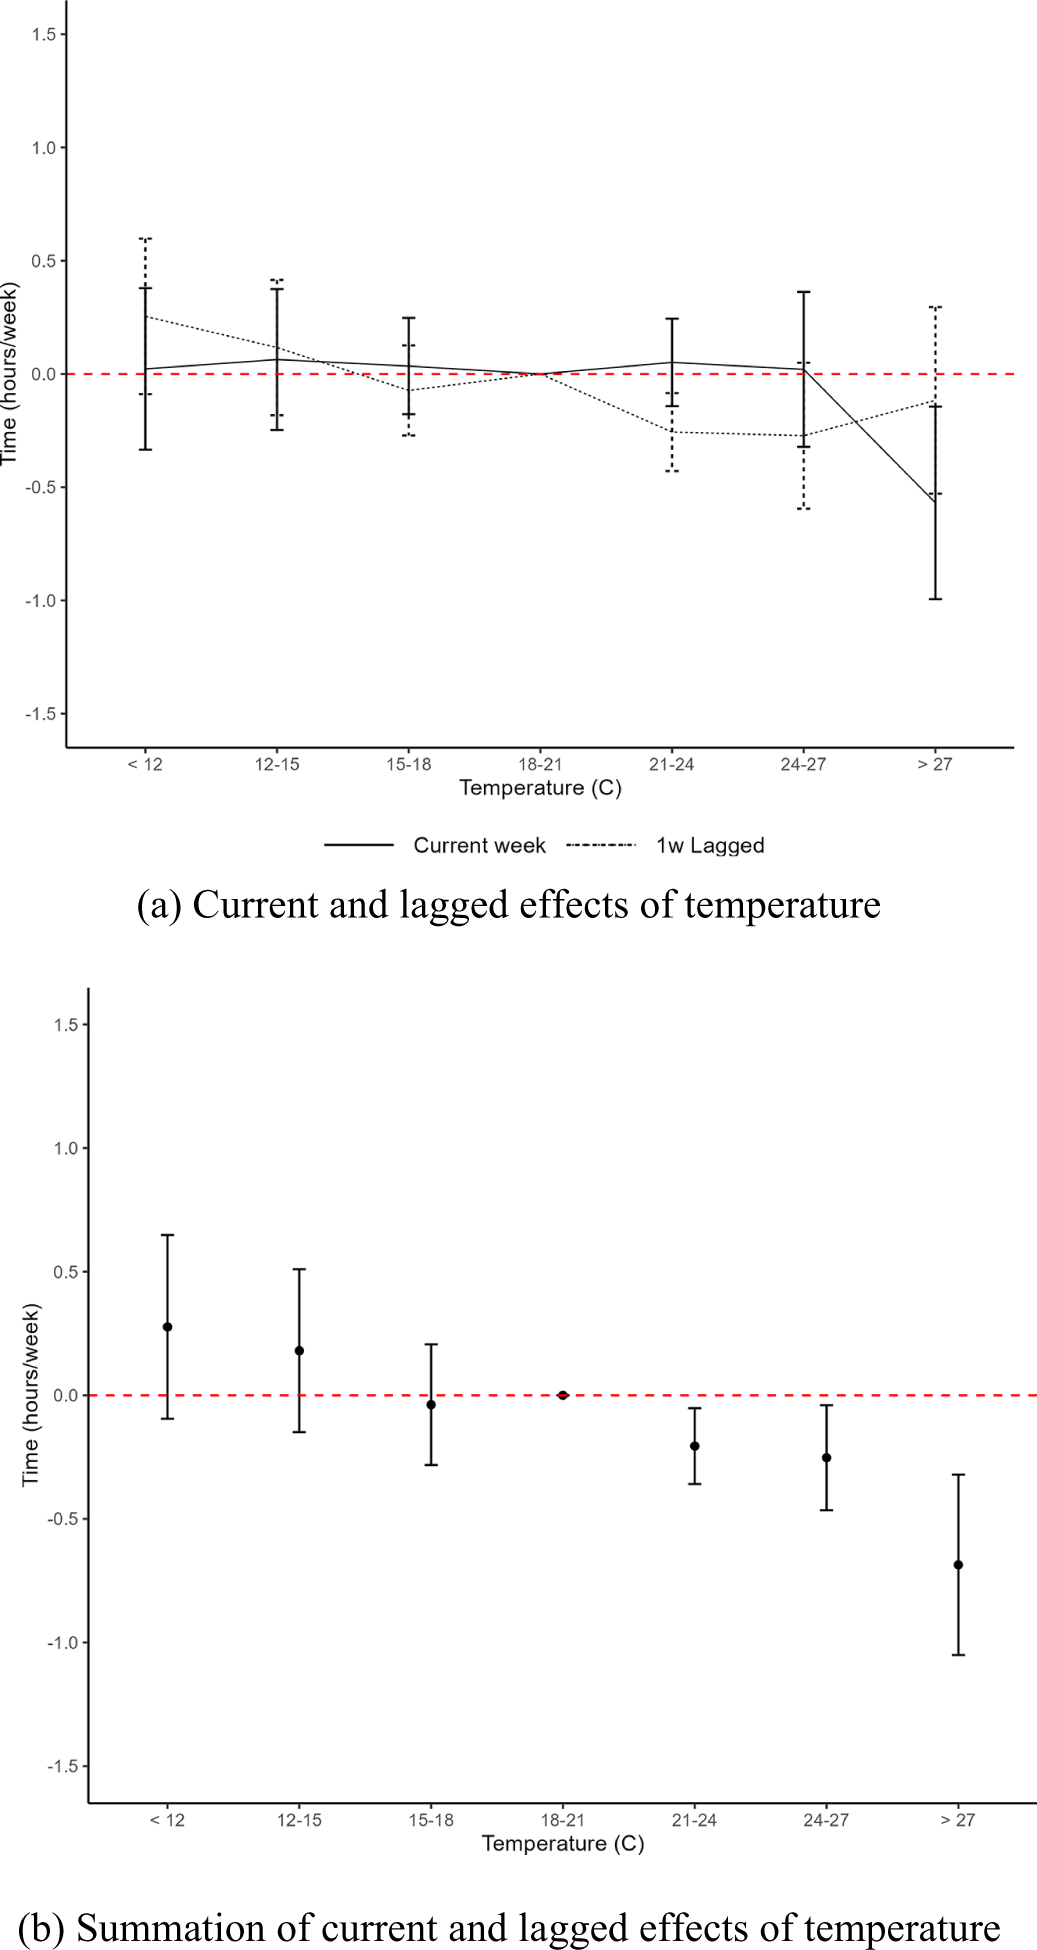
Figure 3 Long description
The image A showing “(a) Current and lagged effects of temperature”. The horizontal axis label is “Temperature (C)” with categories “less than 12”, “12-15”, “15-18”, “18-21”, “21-24”, “24-27”, “greater than 27”. The vertical axis label is “Time (hours/week)” with tick labels negative 1.5, negative 1.0, negative 0.5, 0.0, 0.5, 1.0, 1.5. A horizontal dashed reference line is drawn at 0.0. The legend lists “Current week” shown as a solid line and “1w Lagged” shown as a dashed line. Both series use point markers with vertical error bars at each temperature category. The solid line is near 0.0 at “less than 12”, rises to a small positive value at “12-15”, is near 0.0 at “15-18” and “18-21”, is slightly positive at “21-24” and “24-27” and drops to a negative value at “greater than 27”. The dashed line is positive at “less than 12” and “12-15”, is near 0.0 at “15-18” and “18-21”, is negative at “21-24” and “24-27” and is slightly negative at “greater than 27”. The image B showing “(b) Summation of current and lagged effects of temperature”. The horizontal axis label is “Temperature (C)” with categories “less than 12”, “12-15”, “15-18”, “18-21”, “21-24”, “24-27”, “greater than 27”. The vertical axis label is “Time (hours/week)” with tick labels negative 1.5, negative 1.0, negative 0.5, 0.0, 0.5, 1.0, 1.5. A horizontal dashed reference line is drawn at 0.0. One series of point markers with vertical error bars is plotted. The point is positive at “less than 12” and “12-15”, is near 0.0 at “15-18” and “18-21”, is negative at “21-24” and “24-27” and is the most negative at “greater than 27”.
6. Discussion
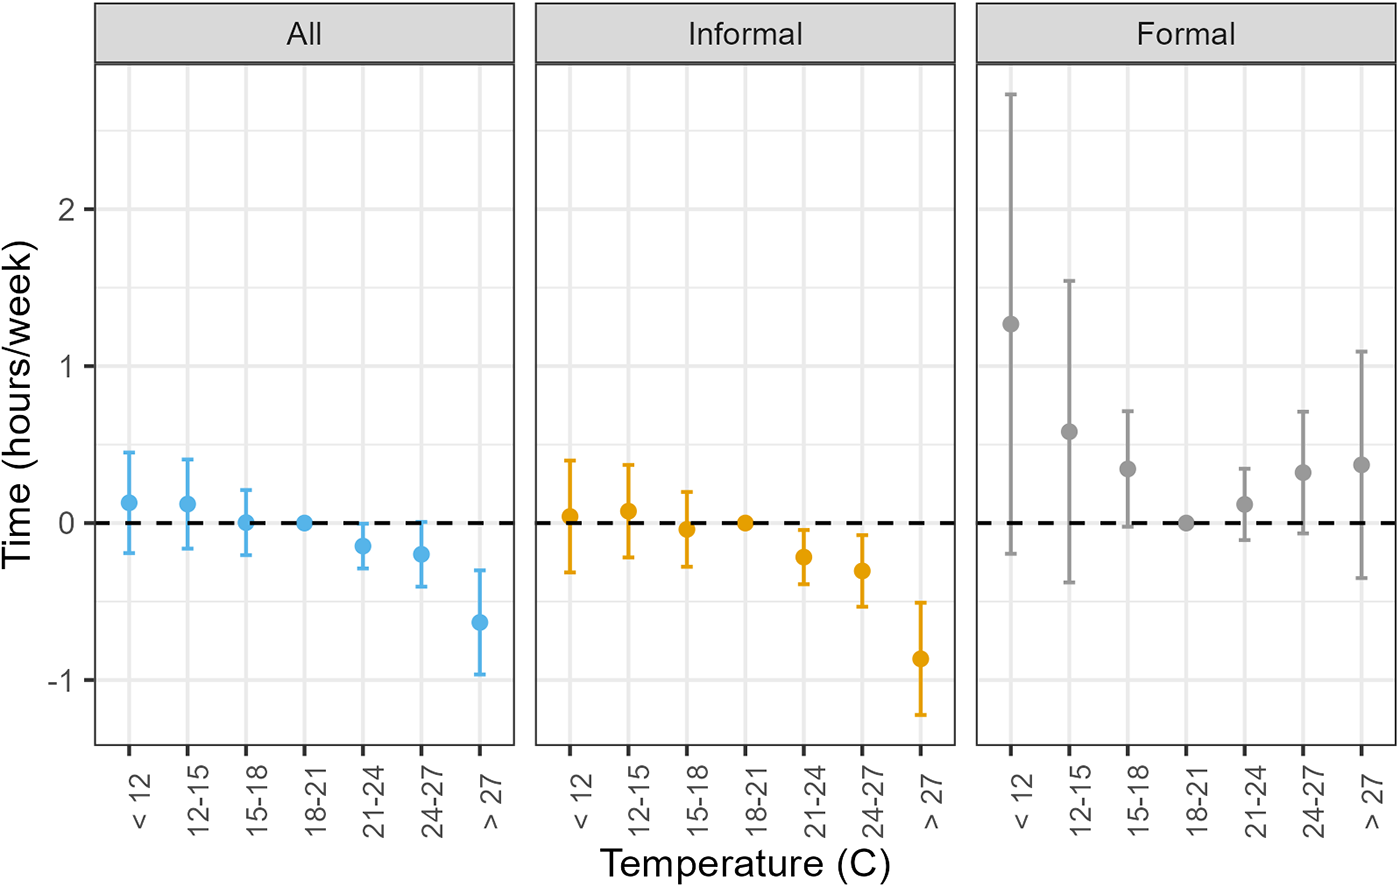
Workers in informal employment appear to be the primary drivers of the negative effect of high temperatures on hours worked. A job is classified as informal if the production unit is not registered for tax purposes or if the worker is not covered by social security. Figure 4 illustrates the estimated effects of temperature on work hours for three groups: (i) all workers, (ii) informal workers, and (iii) formal workers. These estimates are obtained from separate regressions conducted for each group, rather than through interaction terms between temperature bins and a labour informality indicator. We tested whether the effects of the remaining control variables were equivalent across subgroups and found statistically significant differences. As a result, assuming homogeneity of control effects across groups — an assumption required when using interaction terms — does not appear appropriate in this context. The results in figure 4 indicate that the overall negative effect observed in the baseline model is largely driven by informal workers.
The effects of temperature on work time.
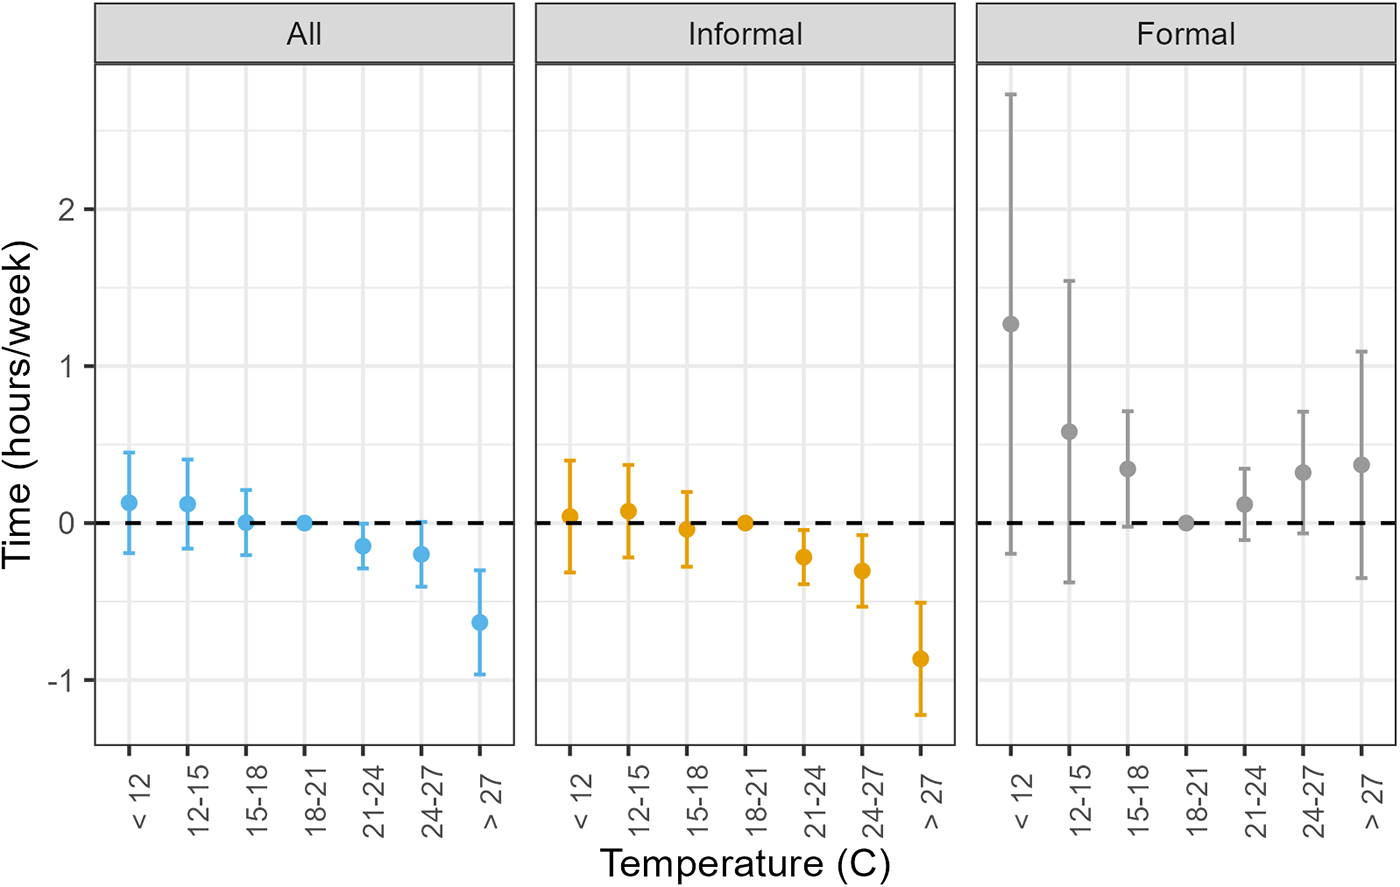
Figure 4 Long description
All. Vertical axis label: Time (hours per week). Tick labels shown: minus 1, 0, 1, 2. Horizontal axis label: Temperature (C). Category labels shown: less than 12, 12 dash 15, 15 dash 18, 18 dash 21, 21 dash 24, 24 dash 27, greater than 27. A dashed horizontal reference line is drawn at 0. Points with vertical error bars are plotted at each temperature category. The point at 18 dash 21 is on the 0 line. The points at less than 12 and 12 dash 15 are above 0. The point at 15 dash 18 is near 0. The points at 21 dash 24, 24 dash 27 and greater than 27 are below 0, with the lowest point at greater than 27. Informal. Vertical axis label: Time (hours per week). Tick labels shown: minus 1, 0, 1, 2. Horizontal axis label: Temperature (C). Category labels shown: less than 12, 12 dash 15, 15 dash 18, 18 dash 21, 21 dash 24, 24 dash 27, greater than 27. A dashed horizontal reference line is drawn at 0. Points with vertical error bars are plotted at each temperature category. The points at less than 12 and 12 dash 15 are above 0. The point at 15 dash 18 is below 0. The point at 18 dash 21 is on the 0 line. The points at 21 dash 24, 24 dash 27 and greater than 27 are below 0, with the lowest point at greater than 27. Formal. Vertical axis label: Time (hours per week). Tick labels shown: minus 1, 0, 1, 2. Horizontal axis label: Temperature (C). Category labels shown: less than 12, 12 dash 15, 15 dash 18, 18 dash 21, 21 dash 24, 24 dash 27, greater than 27. A dashed horizontal reference line is drawn at 0. Points with vertical error bars are plotted at each temperature category. The points at less than 12, 12 dash 15 and 15 dash 18 are above 0. The point at 18 dash 21 is on the 0 line. The points at 21 dash 24, 24 dash 27 and greater than 27 are above 0.
However, whether a job is classified as formal may correlate with other factors that influence how temperature affects hours worked — such as access to air conditioning (AC) at work, job flexibility through self-employment, or vulnerability to demand shocks. In our sample, 60 per cent of informal workers hold outdoor jobs — such as those in agriculture, fishing, mining, manufacturing, transportation, and utilities — where exposure to weather conditions is particularly high. Meanwhile, a study by the Ministry of Energy and Mines in Peru reports that 87 per cent of government agencies do not use AC, and most private-sector firms also lack AC, with the exception of 44 per cent of firms in the mining sector (MINEM, 2013). These findings suggest that limited access to AC at work is a common feature across both informal and formal employment.
It is important to note that many informal jobs are held by self-employed individuals who typically have greater flexibility in their work schedules. This suggests that informality may be correlated with job flexibility. However, we find no evidence that workers use this flexibility to shift work hours across weeks in response to temperature shocks. This result may be surprising, given that informal employment often allows for de facto flexibility. Yet, consistent with Kruger and Neugart (Reference Kruger and Neugart2018), our findings suggest that flexibility does not necessarily translate into intertemporal substitution of labour. Moreover, informal jobs may be particularly vulnerable to demand-side shocks — for instance, on hot days when people are more likely to stay indoors, reducing foot traffic and the number of customers served by informal workers. As a result, informal workers may need to adjust their hours in response to both supply- and demand-side shocks. Due to data limitations, however, we are unable to disentangle these mechanisms in the current analysis.
6.1 Informal vs. outdoor
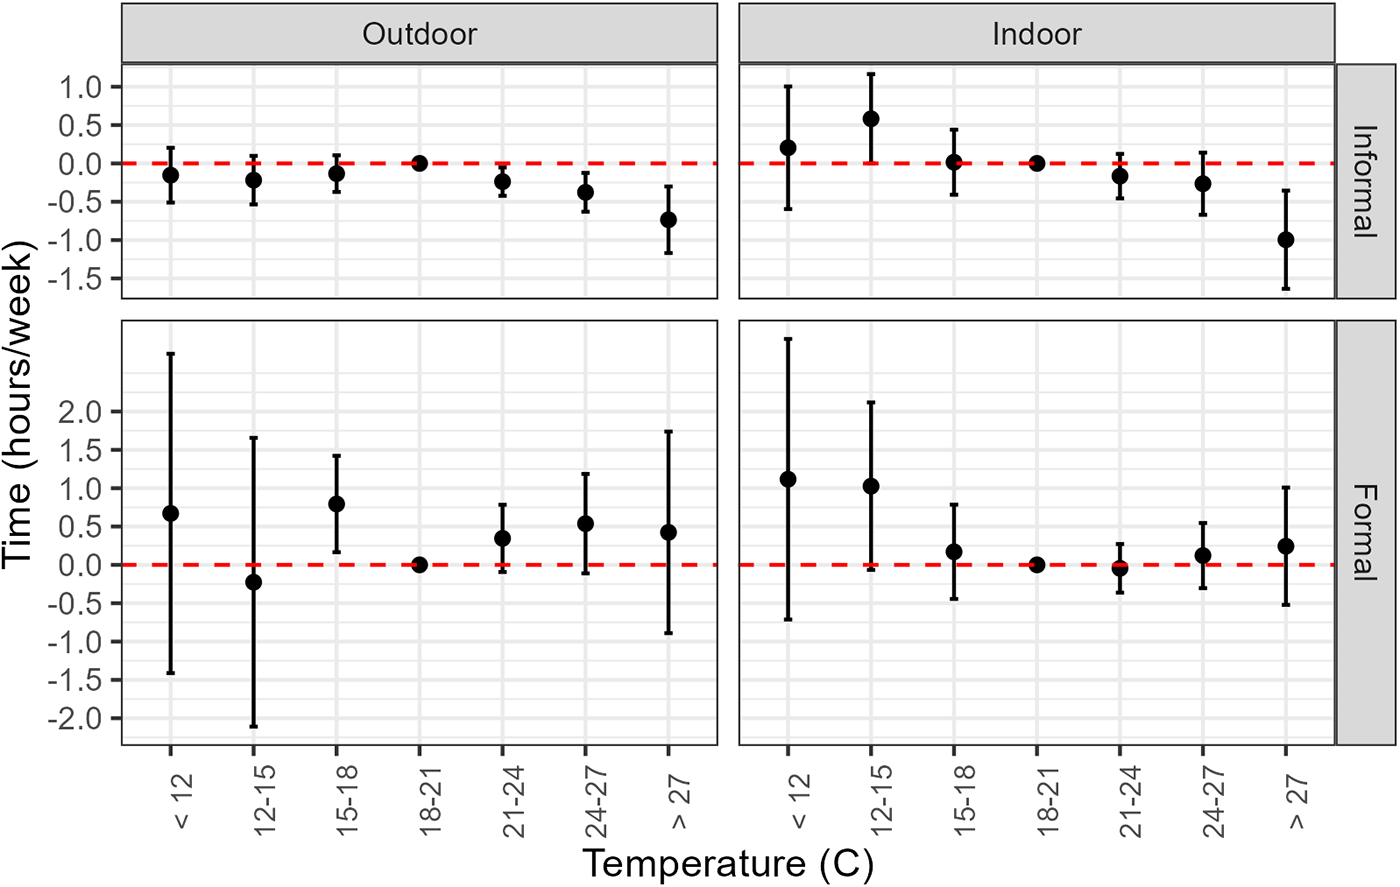
One possible explanation relates to exposure to extreme temperatures, as informal workers are disproportionately employed in occupations that involve outdoor work. According to our data, 60 per cent of informal workers are in outdoor-intensive industries — such as agriculture and construction — compared to 42 per cent of formal workers (see table A1 in the appendix), a statistically significant difference. To disentangle whether the observed effects are driven by job informality or by outdoor exposure, we estimate separate regressions for four distinct groups: (i) informal outdoor workers, (ii) informal indoor workers, (iii) formal outdoor workers, and (iv) formal indoor workers. The results, presented in figure 5, show that high temperatures negatively affect work hours for informal workers regardless of whether their jobs are performed indoors or outdoors. In contrast, we find no significant effect of temperature on work hours for formal workers in either setting. These findings suggest that occupational exposure alone cannot explain the differential impact, and that additional structural factors associated with informality likely drive the observed heterogeneity.
The effects of temperature on work time: informal vs. outdoor.
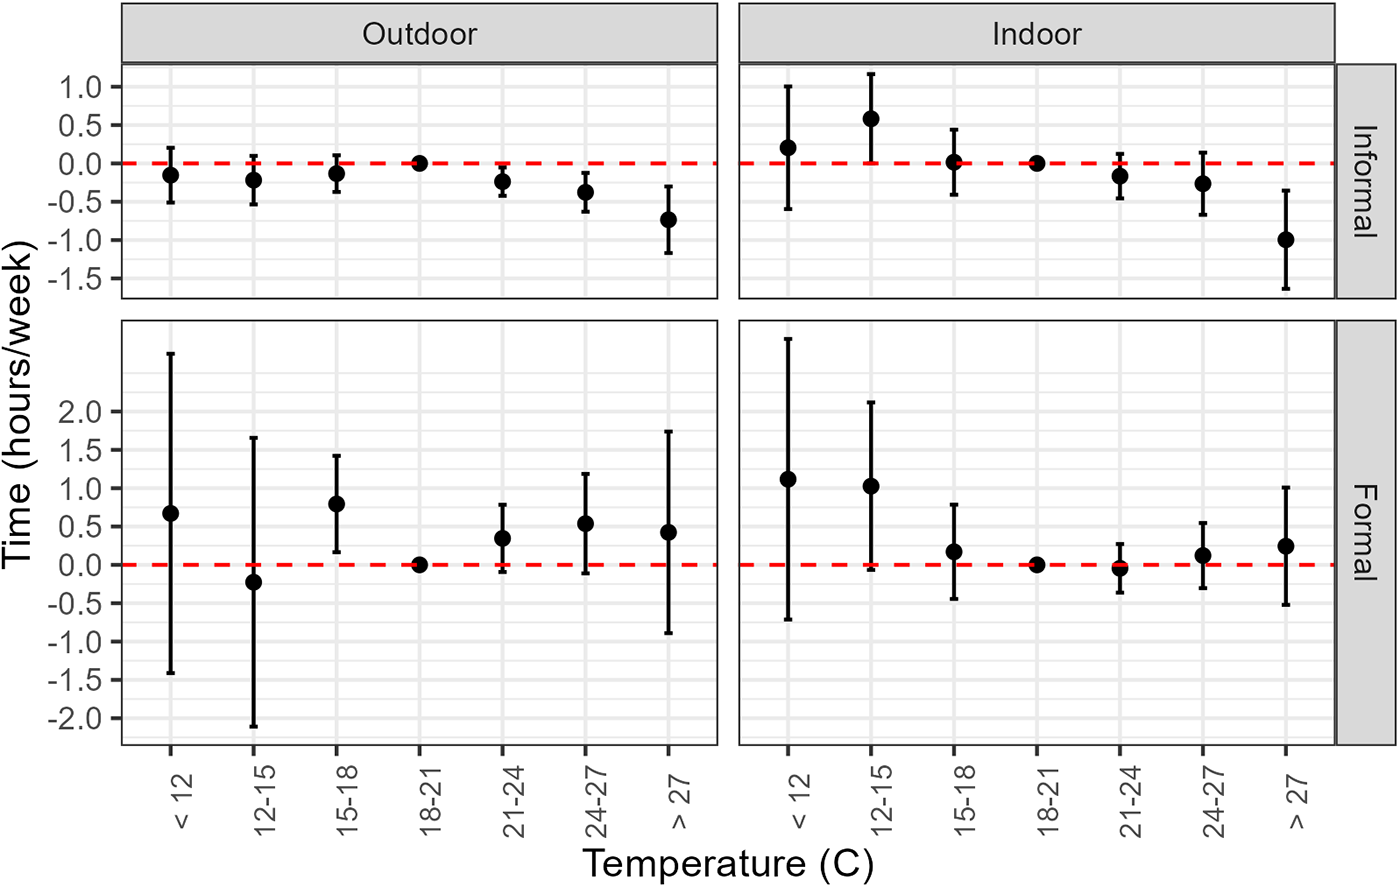
Figure 5 Long description
Outdoor. Informal. The horizontal axis label is Temperature (C). The vertical axis label is Time (hours/week). Temperature categories are less than 12, 12-15, 15-18, 18-21, 21-24, 24-27 and greater than 27. A dashed horizontal reference line is at 0.0. Markers with vertical error bars are plotted for each category. The marker at 18-21 is on 0.0. Markers at less than 12, 12-15, 15-18, 21-24, 24-27 and greater than 27 are below 0.0, with the lowest marker at greater than 27. Indoor. Informal. The horizontal axis label is Temperature (C). The vertical axis label is Time (hours/week). Temperature categories are less than 12, 12-15, 15-18, 18-21, 21-24, 24-27 and greater than 27. A dashed horizontal reference line is at 0.0. Markers with vertical error bars are plotted for each category. Markers at less than 12 and 12-15 are above 0.0. The marker at 18-21 is on 0.0. Markers at 15-18, 21-24, 24-27 and greater than 27 are below 0.0, with the lowest marker at greater than 27. Outdoor. Formal. The horizontal axis label is Temperature (C). The vertical axis label is Time (hours/week). Temperature categories are less than 12, 12-15, 15-18, 18-21, 21-24, 24-27 and greater than 27. A dashed horizontal reference line is at 0.0. Markers with vertical error bars are plotted for each category. The marker at 18-21 is on 0.0. Markers at less than 12, 15-18, 21-24, 24-27 and greater than 27 are above 0.0. The marker at 12-15 is below 0.0. The error bars at less than 12 and 12-15 extend across a wider vertical range than the other categories. Indoor. Formal. The horizontal axis label is Temperature (C). The vertical axis label is Time (hours/week). Temperature categories are less than 12, 12-15, 15-18, 18-21, 21-24, 24-27 and greater than 27. A dashed horizontal reference line is at 0.0. Markers with vertical error bars are plotted for each category. Markers at less than 12, 12-15, 15-18, 24-27 and greater than 27 are above 0.0. The marker at 18-21 is on 0.0. The marker at 21-24 is below 0.0. The error bars at less than 12 and 12-15 extend across a wider vertical range than the other categories. Across the four plots, the lowest markers occur at greater than 27 for both informal plots, while the formal plots show markers clustered near 0.0 across most temperature categories.
First, baseline climate conditions and local adaptation capacity may influence the magnitude of heat-related effects. Informal workers tend to live and work in cooler districts, with an average maximum temperature of 19.5°C and a minimum of 11.7°C, compared to 21.2°C and 14.7°C for formal workers, respectively — both differences are statistically significant (table A1). As argued by Heyes and Saberian (Reference Heyes and Saberian2022), marginal effects of heat are often greater in cooler regions, due to lower local adaptation (i.e., populations and infrastructure are less adapted to extreme temperatures). Thus, the same level of heat stress may generate larger negative effects for informal workers who are less acclimated. One concern here may be that our results could be driven by cross-district differences among informal workers, rather than by genuine within-district responses to temperature shocks. If this were the case, we would expect informal workers in warmer districts to work fewer hours than those in cooler districts. However, descriptive evidence in table A10 indicates the opposite pattern: on average, informal workers in warmer districts work more hours than their counterparts in cooler districts. This suggests that simple cross-sectional differences may not completely explain the negative coefficients in our baseline regressions.
Second, household structure and caregiving responsibilities can reduce the ability of informal workers to maintain a consistent labour supply during heat events. Informal workers are more likely to live in households with children (0.47 vs. 0.29), elderly members (0.08 vs. 0.06), and sick dependents (1.01 vs. 0.78),Footnote 2 all statistically significant differences. Moreover, they are more likely to be women (47 per cent vs. 35 per cent), who disproportionately carry the burden of caregiving. As shown in Das and Somanathan (Reference Das and Somanathan2024) and Heyes and Saberian (Reference Heyes and Saberian2022), heat increases the likelihood of illness among both workers and dependents. Without access to paid leave or healthcare coverage, informal workers — particularly women — may be compelled to reduce work hours to meet caregiving needs exacerbated by heat exposure.
Third, differences in access to electricity contribute to disparities in heat resilience. Only 88 per cent of informal workers report having electricity at home, compared to 99 per cent of formal workers (table A1). Limited access to reliable electricity hinders the use of fans or cooling appliances, reducing the capacity of both workers and their dependents to cope with extreme heat. This lack of in-home adaptation not only exacerbates heat-related fatigue and sleep disruption among workers, increasing the likelihood of labour supply reductions on hot days, but also heightens the vulnerability of children, elderly members, and sick dependents, thereby increasing the likelihood that caregiving demands will translate into further labour supply reductions on hot days.
These findings suggest that job informality — rather than outdoor exposure — drives the negative impact of high temperatures on labour supply. While Zivin and Neidell (Reference Zivin and Neidell2014) report that high temperatures reduce hours worked in primarily outdoor industries in the US, our results indicate that, in the context of a highly segmented labour market such as Peru’s, the distinction between indoor and outdoor work becomes less relevant. In such labour markets, informal workers are disproportionately vulnerable to temperature shocks, independent of their work environment.
7. Conclusion
This study examines the impact of temperature on working hours in Peru over the period 2007–2015. Using detailed worker-level and meteorological data, we find that high temperatures are associated with a reduction of 0.63 weekly hours worked. Other authors suggest that this effect may arise because working on hotter days becomes more physically demanding or less productive, or because warmer weather increases the relative appeal of leisure activities (Zivin and Neidell, Reference Zivin and Neidell2014). However, our analysis further shows that the negative impact of high temperatures is driven by informal employment, which is associated with household characteristics — such as limited access to electricity — and caregiving responsibilities, including the presence of more children, elderly members, sick dependents, and women within the household, which heighten the vulnerability of informal workers to heat exposure. Finally, we find no evidence of intertemporal labour substitution across weeks.
This paper leverages short-term variations in weather that exceed the projected long-term changes associated with climate change. By doing so, it aims to capture how working hours might respond as climate conditions evolve over time. However, interpreting these results requires caution, as they do not account for long-term behavioural adaptations that may become feasible in the future — or, conversely, for adaptation strategies currently available that may not be sustainable over time. As such, the short-run focus of this study does not fully reflect the gradual and complex nature of climate change and its long-term effects on labour supply. Future research should explore these behavioural responses in greater depth and develop improved methods for identifying workers exposed to outdoor conditions, as this group is particularly vulnerable to temperature shocks. Accurately characterising this population is essential for understanding the broader impacts of climate change on labour markets. Additionally, future studies should incorporate modern big data sources to more precisely identify individuals’ workplace locations and refine estimates of temperature shocks on time spent at work.
Supplementary material
The supplementary material for this article can be found at https://doi.org/10.1017/S1355770X25100272.
Acknowledgements
This paper has greatly benefited from the insightful comments and feedback of Fernando Aragon, Jane Friesen, Josh Merfeld, Kevin Schnepel, Vis Taraz, Hendrik Wolff, as well as participants at the EfD 14th Annual Meeting, SEEDS 2020 Annual Workshop, 2021 CEA, NAREA 2021, 2021 CIREQ Interdisciplinary PhD Student Symposium on Climate Change, and LAERE 2025.
Competing interests
The author declares none.


 Open access

