

1. Introduction
The growing use of internet-of-things has made data mining an important field of research. Mobile devices now leave a digital footprint and these footprints consist of thousands of data points distributed across space and time, requiring the analysis and interpretation of vast amounts of data. This issue exists for data from virtual environments where the tracking systems generate many points of data as a function of time which need to be analysed to obtain meaning.
Gracia de Luna (Reference de Luna2019; Reference de Luna2020; Reference de Luna, Butler and Timmer2021) performed an experiment where users took different trajectories in a virtual environment (VE) in response to 3 distractions. The locations and orientations of the users’ right and left hand, and head in a 3D space were recorded at intervals of 0.011 seconds. Gracia’s thesis (2019) examined the relationship between the user’s performance and their gender. Although spatial temporal data was gathered, Gracia’s work did not analyse the spatial temporal data for relationships to user performance. Using clustering algorithms, this paper analyses the trajectories taken in Gracia de Luna’s (2019) experiment looking for similarities within user performance (number of times a balanced ball drops), and user’s demographics. Using this collected but not analysed trajectory data, this study attempts to obtain and document relationships from the trajectory analysis with DeLuna’s study variables.
The research goals of this paper are to explore the use of trajectory clustering analysis as a means of gaining meaning from trajectory information from a virtual environment experiment. The importance of a potential discovery could lead to new methods in analysing user behaviour in virtual environments. To the understanding of the authors, this type of analysis has not been published before, and if successful, could result in techniques and methods that have the potential to enhance the usefulness of virtual environments to the design processes and enterprise.
Gracia de Luna ’s Reference de Luna(2019) experiment did not include analysis of trajectory in the virtual environment. So, the purpose of this work is to delve further into the analysis of the acquired data to determine if the subjects’ demographics, performance (balanced ball drops), and sense of presence in the VE can be related to their trajectory. This general objective is to compare trajectories taken by the users’ dominant and non-dominant hand and head by generating clusters that group them if similar. By comparing the trajectories to independent variables (number of times a balanced ball is dropped, sense of presence, gender, game experience), a better understanding of human reaction to virtual stimuli can be achieved. By using trajectory clustering algorithms and data analysis techniques, this study investigates whether balance and motion response to 3 separate stimuli events in the VE correlate with the users’ self-perception of performance, performance (balanced ball drops) and sense of presence.
The second section of this paper includes a literature review of prior work, clustering techniques used for data analysis along with their benefits and which techniques work better with spatiotemporal data. Section three explains the methodology used to adapt de Gracia de Luna’s (2019) data for clustering algorithms along with the use of these algorithms and their results. The fourth section presents the results obtained from data analysis techniques, and the last section provides conclusions and future work.
2. Literature review
2.1. Gracia de Luna’s work
Gracia de Luna Reference de Luna(2019) conducted an experiment where users in a VR path carried a plate on their non-dominant hand while the dominant is used for navigation. This plate supported a ball which was balanced with the movement of the user. To accurately capture the range of these movements, the 6 degrees of freedom are tracked with an HTC Vive system. The HTC Vive has two tracking base stations that cover a 360-degree play area. They are placed in a designated area covering the ‘path’ that users follow. The user wears the head-mounted display and grabs the hand controllers during the virtual walk. The lighthouses are integrated with the sensors in the headset and controllers. The lighthouses track the headset and hand controllers with the six DOF by measuring the position and orientation of the sensors when they are activated. Figure 1 shows the path taken by users in an urban park setting in the virtual environment.
Virtual path obtained from gracia de luna’s study (2019)

Others have done similar work. Hammet et al. (2017) tracked movements in x, y, z, roll, pitch, and yaw to properly track motion in a VR snowboarding exercise. Slater et al. Reference Slater, Usoh and Steed(1994) used logistic regression analysis to show that visual, auditory, and kinaesthetic representation in a VE, associated with higher reporting of presence by users.
In Gracia de Luna’s work, his designed VE included 3 different stimuli to provide a change of environment to the user and record their spatial response. The stimuli are an explosion on the path shown in Figure 2, meteors falling from the left side, and a bird flock crossing through the path. These ‘distractions’ are not disclosed to the user prior to occurrence.
Stimuli events taken from gracia de luna’s study (2019) a) Explosion; b) Meteor; c) Birds

Usoh et al. Reference Usoh, Catena and Slater(2000) suggested a questionnaire for VR subjects to answer using a scale from 1 to 7 to indicate their self-perception of presence in the environment. This scale is appropriate to quantify their “sense of being there” rather than analysing open answers that may be subjective to the user. Gracia de Luna Reference de Luna(2019) employed a 7 question-survey for the users with the purpose of recording their level of self-perception during the experiment. The results from this questionnaire are statistically compared to the actual performance of the users during the test.
To analyse the collected data, the following statistical methods were used by Gracia de Luna Reference de Luna(2019): Contingency Table, T-Test, Correlation, and Phase Plane analysis. Gracia de Luna’s experiment gave favourable results to understanding the gap between presence and performance; however, the spatiotemporal data obtained about the users’ trajectories was not used.
While there have been attempts at analysing user’s performance on a virtual environment, there is a lack of studies based on trajectory data. The user’s position and movement add a layer of complexity to the data that can be challenging to analyse using traditional methods. In this study, human balance and trajectories are examined using unsupervised machine learning.
2.2. Big data
Big Data, the term given to the massive and complex collection of data, from such sources as online shopping and social media interactions, has become a component of current research. Zhu et al. Reference Zhu, Wu, Min, Zomaya and Hu(2018) mentioned that Big Data “seeks to explore complex and evolving relationships among data.” Wu et al. Reference Wu, Zhu, Wu and Ding(2014) even compares it to blind men trying to size up a giant elephant that keeps growing.
One kind of relationship that can be found in Big Data is preferences from online shoppers. Ozer and Cebeci Reference Ozer and Cebeci(2019) experimented with two common algorithms to analyse big data and concluded that online shoppers are more likely to be annoyed when they are either “bombarded” with unneeded information or frustrated when they receive less than expected information. Bulagang et al. Reference Bulagang, Mountstephens and Teo(2021) coordinated an experiment with 20 subjects whose heart rate was tracked as they watched videos through a HTC Vive Virtual Reality headset. The results of this experiment showed that heart rate is a good potential approach in predicting human emotions. Hasenbein et al. Reference Hasenbein, Stark, Trautwein, Gao, Kasneci and Göllner(2023) investigated social comparison behaviour among students in a virtual reality classroom. The specific behaviour examined is the participation of students by raising their hand to answer questions. An experiment done by Birenboim et al. Reference Birenboim, Dijst, Ettema, de Kruijf, de Leeuw and Dogterom(2019) consisted of participants cycling virtual routes with changing environmental characteristics and through a route with still, static images.
Bouchard and St. Jaques (2008) studied the subjective feeling of presence from individuals in a virtual reality environment through induced anxiety. Furthermore, Chuan et al. Reference Chuan, Qian, Bogdanovych, Kumar, McKendrick and McLeod(2023) created virtual reality software that helps teach cognitive-motor needling skills needed for the performance of ultrasound-guided regional anaesthesia.
2.3. Preprocessing
The initial step before any data analysis is to pre-process the data. Data is collected as events happen, showing location coordinates, qualitative or quantitative characteristics, and temporal position; this data can extend to be thousands of pages long. Therefore, a helpful step is to “clean” or structure the data in a way that can be analysed more easily (Reference Xia, Jiang, Yang, Hu, Li, Li and WangXia et al., 2021). Ansari et al. Reference Ansari, Ahmad, Khan and Bhushan(2020) said that irrelevant attributes could negatively affect similarity measures.
Apart from eliminating not useful data, the remaining information can be structured in a different format; titles could be added for easier location, dimensions can be zeroed to decrease computation time, and format can be matched to computational programs.
2.4. Clustering
Spatiotemporal datasets represent new dimensions to track, thus, increasing the difficulty for analysis. A common strategy to simplify this data is to develop clusters or perform a cluster analysis. By applying a similarity measure to trajectories, it is possible to group them based on specific characteristics and reduce the number of paths to analyse. There are multiple algorithms for trajectory clustering, each produces different results based on the data reviewed and the use that the analyst seeks.
Yuan et al. (2027) grouped into 5 main categories based on how they model data: model-based, hierarchical, grid-based, density-based, and partitioning methods. Hierarchical clustering requires a large amount of computational time since it reads every data point as a cluster and then looks to merge that data point with others (Reference Han, Kamber and PeiHan and Pei, 2012). Grid-based clustering, although used in many two-dimensional path studies, do not work well for irregular paths. Model-based clustering works by examining the spatiotemporal data and comparing mathematical models to find the best match (Reference Li, Liu, Liu, Xiong, Wu and KimLi et al., 2017).
Density-based clustering is good for the detection of shapes and clusters from different sizes, but this method rely on other inputs (Reference Agrawal, Garg, Sharma and PatelAgrawal et al., 2016). The main two algorithms of this category are Density-Based Spatial Clustering and Ordering Points to Identify the Clustering Structure. These two algorithms are effective for identifying nested clusters, or data points that might seem close in space, but far in other dimensions.
Density-Based Spatial Clustering (DBSCAN) functions based on the concept that regions with a high density of data points that are separated by sparser regions in the dataspace are identified as clusters. Bushra and Yi Reference Bushra and Yi(2021) explained that the DBSCAN algorithm uses a radius input and neighbourhood points to identify the core point and measure if it is surrounded by the neighbourhood points in the radius, if so, these points become a part of one cluster. The core points that are in the radius of a point in that cluster are combined to it, making it larger. The points near the cluster that are not core points are added as well but the algorithm does not look for core points in their radius. When core points are detected far from the first cluster, they form a second cluster using the same methodology.
Birant and Kut Reference Birant and Kut(2007) presented a spatial temporal version of DBSCAN that clustered weekly daytime and nighttime temperature records. By adding a radius for temporal distance, a “ST-DBSCAN” version was made. Another use for ST-DBSCAN comes from Chimwayi and Anuradha Reference Chimwayi and Anuradha(2018). In his experiment, the algorithm was used to analyse a public health dataset.
Ordering Points To Identify the Clustering Structure (OPTICS) has a clustering approach similar to DBSCAN, but OPTICS works better over clusters with different densities (Malahan, 2017). This algorithm uses DBSCAN’s input variables and core distance and reachability distance. Core distance is the lowest possible radius to classify a point as core, differing from the fixed radius in DBSCAN.
Agrawal et al. Reference Agrawal, Garg, Sharma and Patel(2016) developed a version of OPTICS that generated spatial-temporal clusters of the presence of vegetation across Indian states. The algorithm steps for the ST-OPTICS are the same as the original OPTICS algorithm but consider two core distances (one more for the time dimension).
For proper comparison between points from different trajectories, it is helpful to measure their “similarity” or how far they are from each other in spatiotemporal coordinates. Zhuang and Chen Reference Zhuang and Chen(2021) used Dynamic Time Warping (DTW) to measure similarity in aerial target’s trajectories. Chen et al. Reference Zhuang and Chen(2021) explained that “DTW detects a ‘warping’ path through the matrix constructed by two sequences that minimize the cumulative distance.” An advantage of DTW metric is that it considers the sequence or track of past points that have existed prior to the most current when doing the similarity calculation. Zhuang and Chen Reference Zhuang and Chen(2021) then used this similarity to feed a DBSCAN algorithm which performed the clusters. The results were proper clusters of dynamic enemy targets in a two dimensional which can indicate different tasks or tactics. Zhao and Shi Reference Zhao and Shi(2019) also utilized DTW and DBSCAN to form clusters.
Dupas et al. Reference Dupas, Tavenard, Fovet, Gilliet, Grimaldi and Gascuel-Odoux(2015) used DTW to identify and align storm discharge time series of different lengths and with difference in phase. Once aligned, k-means clustering was used on them to identify common patterns in water quality (Reference Xing and SelaXing and Sela, 2019). Zhang et al. Reference Zhang, Masoud, Bandegi and Malhan(2022) used K-means with DTW metric to cluster driving patterns in an x-y coordinate plane with time. Similarly, Chen et al. Reference Zhuang and Chen(2021) used DTW k-means clustering to separate lane-changing risk profiles into different categories. K-means with DTW metric was used by Jang et al. Reference Jang, Han, Kim and Yang(2011) to cluster handwritings.
As shown, there have been studies that utilize algorithms to analyse spatiotemporal data and clustering algorithms that facilitate trajectory analysis. However, there is a lack of studies that combine statistical spatiotemporal clustering applied to virtual reality data. Utilizing clustering algorithms to categorize virtual reality spatiotemporal trajectories for comparison with non-spatial metrics, is a nascent area of exploration, and this paper begins that exploration of virtual environment trajectory data.
3. Methodology
The objective of the experiments reported in this paper is to perform statistical analysis of the collected data to determine if there are any significant interpretations where meaning regarding a virtual environment problem can be drawn from the spatial-temporal data. This objective requires a proper data structure that can be clearly interpreted by a proper algorithm to produce the desired results. There are several steps involved in obtaining the proper data structure and the desired results. These steps are summarized and shown in Galicia Avila’s work (2023).
3.1. Data collection in Virtual Reality
As part of the data preprocessing, scaled three-dimension coordinates were used. This technique helps interpret data more easily to scale all trajectories, so their coordinates are located within the same spatial range, similar to the temporal standardization. The coordinates are scaled to a range between 0 and 1.
To reduce the algorithm’s loading time, the three databases are divided by trajectory. The result is 9 datasets with the same structure, whose data represents the spatiotemporal trajectories of 57 users and their independent variables, functioning metrics for comparison:
1. Explosion – Head
2. Explosion – Dominant Hand
3. Explosion – Non-Dominant Hand
4. Meteor – Head
5. Meteor – Dominant Hand
6. Meteor – Non-Dominant Hand
7. Birds – Head
8. Birds – Dominant Hand
9. Birds – Non-Dominant Hand
This data separation helps the algorithm to focus on each situation separately, reducing loading time and memory needed.
3.2. Algorithm: K-Means with DTW
K-Means was selected as the most appropriate algorithm to cluster the full trajectories that the users take in the virtual path. This algorithm requires the initial input of “k” or the number of clusters desired to find in the data, and this approach is where the Elbow Method is useful (Reference Larose and LaroseLarose and Larose, 2015; Johnson and Wichern, 1988). The elbow method technique consists of completing several k-means program executions using different k-values and plotting the resultant Within Cluster Sum of Squares (WCSS).
When choosing the best k-value, a low WCSS is a reliable metric but not too low because that involves a high number of clusters. The Elbow Method plot shows the number of clusters against their obtained WCSS. The code is executed using k-means integrated with dynamic time warping metric to obtain the “elbow” point of 9 scenarios: 3 stimuli events per point (for head, dominant hand, non-dominant hand). A different k-value is expected to be obtained from each situation.
Jupyter Notebook environment is selected to execute the Python code since it easily handles running different code blocks instead of the full code. The code blocks calculate and show: cluster formation, colour coded clusters in spatiotemporal space, trajectory distribution among clusters chart, and the statistical tests.
3.3. Statistical analysis
When the algorithm is executed and clusters are formed, a statistical analysis of the gathered data is done. The clusters and the pre-processed datasets formed the foundation of this analysis. The aim in this step was to venture beyond a mere data collection and look for the meaning of the patterns found in the clusters.
To compare the user trajectories from the user performance and presence self-evaluation, this research focuses on the clusters obtained from the k-means with DTW metric algorithm. This comparison is important to understand not just how users move in the virtual path, but also how this navigation influences their perceived experience and performance. The Chi-squared (X 2) test is used here as a statistical tool to measure the strength and significance of these relationships. To properly perform this statistical test, data is organized in the code to resemble contingency tables with the cluster labels and the categorical results from the metrics. Multiple tests are required to consider all combinations of cluster labels and metrics.
The Chi-squared test helps reveal whether observed user outcomes across different trajectory clusters occur by randomness or reflect a significant pattern. If the Chi-squared test yields significant results, it would suggest that the way users navigate through the virtual path is linked to their performance metrics or their perception of the experience. To perform this statistical test, it is essential to formulate a null hypothesis (H 0) which states that there is no association between the clusters and the metrics; this null hypothesis is either rejected or not rejected, indicating whether there is an association in the data.
The p-value is obtained to provide a probability-based perspective to the interpretation. This statistic indicates the probability of obtaining the observed results in the null hypothesis scenario. A large p-value indicates that the observed values are likely to occur in a null hypothesis state, supporting it. A p-value smaller than 0.05 suggests that the observed values are unlikely to have occurred by random chance under the null hypothesis, leading to its rejection.
4. Results
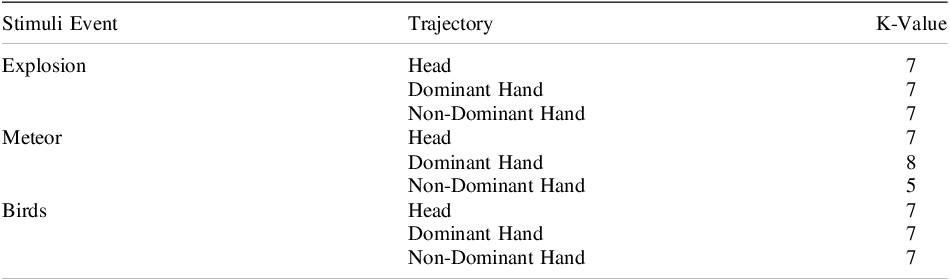
The optimal k-values per situation are shown in Table 1 where the three path distractions are shown with their three trajectories.
K values obtained from elbow method.

4.1. Trajectory clusters
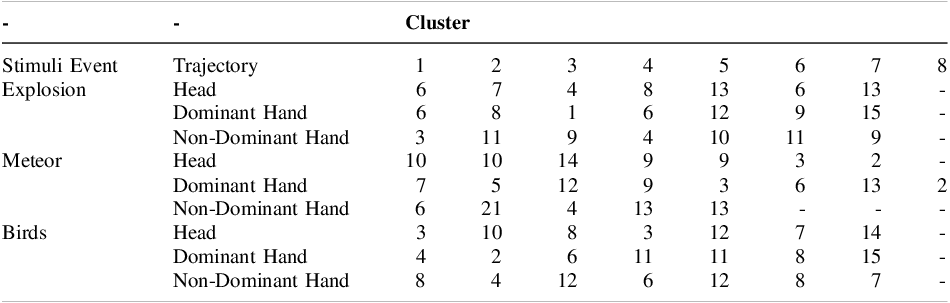
The optimal k-value determines the ideal number of clusters to be created in each of the nine scenarios through k-means algorithm with DTW metric implemented using the Python command TimeSeries KMeans from the tslearn library (https://tslearn.readthedocs.io/en/stable/gen_modules/clustering/tslearn.clustering. TimeSeriesKMeans.html). Originally, the data contained 57 individual trajectories for the different stimuli event/trajectory combinations. The use of TimeSeries KMeansCustering grouped (clustered) individuals with similar trajectories into clusters and reduced the number of trajectories that need to be between 5 and 8 clusters as shown in Table 1. The number of individual subjects assigned to each cluster specified in Table 2. Notice that the total of individuals in each row sums to 57.
The clusters generated can be visually represented as centroids of the trajectories or time series. Figure 3 plots the centroid values in different colors per cluster for all three sets for one event, each corresponding to a movement type after a distinct event. Figures for other events can be found in Galicia Avila’s thesis Reference Galicia-Avila(2023). To accurately represent the normalized trajectory lengths, the plots are scaled with a three-dimensional spatial distance (x, y, and z coordinates) ranging from 0 to 1.
Plotting of normalized trajectory cluster centroids for the explosion event a) Head; b) Dominant Hand; c) Non-Dominant Hand

Please note that in figure 3 c), which show the clusters associated with non-dominant hand trajectories, the trajectories appear more intermingled. It is hypothesized that this intermingling is caused by the need to balance the ball on the plate by the non-dominant hand.
4.2. Chi-squared test results
Multiple chi-squared tests are conducted to compare the association between the clusters and the different variables or metrics. In each of the nine situations (stimuli event/trajectory), tests are conducted to determine if the performance metrics of presence, ball drop, gamer and balance ball are independent of the factors gender, cluster and hand dominance. The performance metrics are aggregated scores. The metric presence is based upon presence survey answers ranging from 1 to 42, are categorized into three levels reflecting presence intensity: low (1-14), neutral (15-28), and high (29-42). The number of users whose presence survey responses fell into the three categories are distributed across the different trajectory clusters. The performance metric drop balls is categorized into 4 levels:
1st level is if the ball was dropped only once
2nd level is if the ball was dropped 2 times
3rd level is if the ball was dropped 3 times
4th level represents if the ball was dropped more than 3 times
The number of time series (trajectories) grouped into clusters.

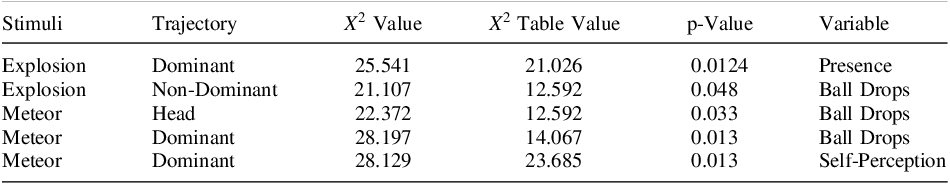
The users were asked at the end of the experiment, how would they rate the difficulty balancing the ball while walking in the virtual path and the answers were categorized by score: low expertise (1-2), medium (3-4), and high level of expertise (5-7). A total of 162 Chi-squared tests of independence were conducted comprising all possible combinations of the stimuli event/trajectory clusters versus the performance metrics. A p-value of 0.05 was selected because it limits the probability of a type 1 error (incorrectly rejecting a true null hypothesis) to 5%. This is a very commonly used p-value that the authors adopted. A p value of 0.05 provides confidence–that the stimuli event trajectory cluster was not independent of the performance metric. Table 3 summarizes the statistics where the p-value less than or equal to 0.05. It is apparent that almost all of the tests of Chi-squared tests of independence of cluster versus performance metric were not statistically significant indicating that for all tests, except for the five tests contained in Tables, there was no difference in the performance metric due to gender, clusters or hand dominance.
Figure 4 is a bar chart containing the data for the Chi-squared test of independence provides perspective on how the clustering relates to the variable metric sense of presence (low, neutral, and high). Figure 4 is the best of five plots which show these relationships. Although not the exemplary results desired by the authors, this plot gives some sense of the effectiveness of this technique. Clusters 2, 3, 4, and 6 only containing individuals with low value of presence metric is interesting. Thus, graphically it is apparent that the cluster values are not independent of the performance metric presence as indicated by the statistically significant test result.
Relationship between cluster number and presence level

5. Conclusions and future work
The authors are unaware of any previous studies with unsupervised learning and trajectories from virtual environments. Stated differently, the authors believe that no previous work has been reported in the application of unsupervised learning algorithms to virtual environment trajectories. As a novel approach to the use of unsupervised learning, the hope was that methods could be developed that would extract meaning from virtual environment trajectory data.
The study reported in this paper, was limited to the use of existing methods in statistical trajectory clustering, but it was applied to a new area of research, trajectories in a virtual environment. Further, this study only examined the use of unsupervised learning methods.
This study was successful in finding statistically significant, at the a = 0.05 level, relationships of some trajectory clusters to some measures of presence, performance (ball drops), and self-perception. These relationships were intended to help establish statistically significant relationships that could relate trajectory to the measures of presence, performance (ball drops), and self-perception. Although the hoped for relationships were not achieved as shown in Figure 4, future work may permit the user to determine user meaningful relationships through other methods, such as supervised learning.
With supervised learning, it may be possible to relate the dependent variable such as ball drops to the trajectory. Essentially, this approach requires advanced signal processing techniques. For example, wavelet decomposition, splines or functional principal component analysis could be used to extract meaningful features which may give high correlation with the responses. With future work on the Gracia de Luna Reference de Luna(2019) data set, better relationships may be established, possibly by supervised learning methods, thus ushering in new tools for design in virtual environments.
Statistics for clusters with a p value less than or equal to 0.05.

Acknowledgements
This work was supported in part by the Office of Naval Research, Manufacturing Engineering Education Program. Further, the Department of Manufacturing and Industrial Engineering, at the University of Texas Rio Grande Valley also provided some support. The authors are grateful for this support.


 Open access