





1. Introduction
This work concerns stratification in drying films, examining how a mixture of differently sized particles arranges itself upon drying. It is seen experimentally that smaller particles typically preferentially accumulate at the top surface, but it is not fully understood why (Routh Reference Routh2013). Understanding this could have applications across a wide range of industries, from the surface of catalyst pellets, to coating surfaces with biocides (Mardones et al. Reference Mardones, Legnoverde, Monzón, Bellotti and Basaldella2019). It may have significance in the development of cheaper and more sustainable materials, as the drying process can be engineered such that expensive components are only located where they are required.
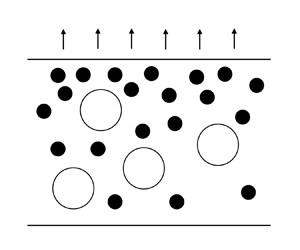
As solvent evaporates from a film, the top surface, initially at height H, descends at velocity  $\dot{E}$. The situation and coordinate system used are depicted in figure 1, where z is the spatial coordinate, $\xi $ is the transformed spatial coordinate (see § 3.2) and t is time. Particles which are unable to diffuse away from the top are collected by the top surface. Whether or not the particles can diffuse sufficiently quickly away from the surface is characterised by the Péclet number, $Pe = 6{\rm \pi}\eta R\dot{E}H/kT$, where R is the particle radius, $\eta $ is the solvent viscosity, k is the Boltzmann constant and T is the temperature (Routh & Zimmerman Reference Routh and Zimmerman2004). Hence it is expected that drying dispersions with different size particles will lead to different particle arrangements in the dried film. On the basis of diffusional arguments alone, it would be expected that larger particles stratify to the top surface.
Schematic of the drying of a film containing two types of particles.

In light of experimental observations of small particles at the top surface, it is thought that a simple diffusional model may not suffice. The terminology small-on-top stratification is used in this work to describe a layer, including just a thin layer, of small particles at the top surface, and likewise for large-on-top stratification. This work derives a fluid mechanics model for both the simple diffusion case, and the case that adds a type of diffusiophoresis: an excluded volume effect. The aim is to use the numerical results to determine whether diffusiophoresis could explain these experimental observations. It will be shown that diffusiophoresis may result in small-on-top stratification, including a thin layer of small particles at the top surface.
A literature review is carried out in § 1.1 to explain the context of the work and the existing hypotheses. In § 2, the relevant theory is derived, then in § 3, the solution methodology is explained. The results of the simulations are presented and discussed in § 4. Asymptotic solutions are outlined in § 5, before drawing conclusions in § 6.
1.1. Literature review
Different approaches have been taken in the literature to model the drying of particulate films and attempt to explain the particle arrangements seen experimentally. Key works which have used thermodynamic models include (i) Routh & Zimmerman (Reference Routh and Zimmerman2004), who derived equations for the drying of a film containing just one species of particles and solved them numerically; and (ii) Trueman et al. (Reference Trueman, Lago Domingues, Emmett, Murray and Routh2012b), who extended Routh & Zimmerman's work to a film containing particles of two different sizes.
In the expression for the solute chemical potential,  ${\mu _i}$, Trueman et al. (Reference Trueman, Lago Domingues, Emmett, Murray and Routh2012b) included only an entropic contribution, ${\mu _i} = \mu _i^0 + kT\ln {\phi _i}$, where $\mu _i^0$ is the reference chemical potential and ${\phi _i}$ is the solute volume fraction. Zhou, Jiang & Doi (Reference Zhou, Jiang and Doi2017) took a similar approach to Trueman et al., but also included a binary interaction term in the chemical potential. This cross-interaction term in the chemical potential accounts for enthalpic effects, i.e. inter-particle interactions. Zhou et al. (Reference Zhou, Jiang and Doi2017) include these up to the order
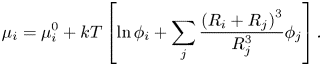 \begin{equation}{\mu _i} = \mu _i^0 + kT\left[ {\ln {\phi_i} + \mathop \sum \limits_j \frac{{{{({R_i} + {R_j})}^3}}}{{R_j^3}}{\phi_j}} \right].\end{equation}
This can predict that the small particles end up on top of the larger particles. However, it does not explain why some images suggest that only a thin layer at the top is made up of small particles (Trueman et al. Reference Trueman, Lago Domingues, Emmett, Murray, Keddie and Routh2012a). A further shortcoming is that the form of the interaction terms used by Zhou et al. does not account for the change in interactions as the film approaches close packing, i.e. as the solution becomes more concentrated. Zhou et al. consider this to be acceptable, arguing that most of the stratification is formed before the film approaches close packing. Following the approach of Russel, Saville & Schowalter (Reference Russel, Saville and Schowalter1989) and Routh & Zimmerman (Reference Routh and Zimmerman2004), Trueman et al. (Reference Trueman, Lago Domingues, Emmett, Murray and Routh2012b) form particle chemical potential expressions that are valid even in non-dilute systems by using an expression for the solvent chemical potential that diverges at close packing. Having an accurate expression for the solvent chemical potential allows the chemical potentials of the two particles,  ${\mu _1}$ and ${\mu _2}$, to be related through the Gibbs–Duhem equation. Therefore, only ${\mu _1}$ or ${\mu _2}$ needs to be specified to fully describe the system. In this work we choose to specify $\boldsymbol{\nabla }{\mu _1}/\boldsymbol{\nabla }{\mu _2}$. The approach of Russel et al. will be adopted in this present work, so that the model can be run to close to the end of drying.
An alternative to the thermodynamic approach described above is using molecular dynamics. Simulations of this type include diffusiophoresis because they simulate every particle, and do not allow the particles to overlap. In this way, excluded volume, including the small particles being excluded from around the large ones, is part of these models. These simulations can be divided into two types, implicit solvent models, where only the non-solvent particles are directly simulated, and explicit solvent models, where the solvent particles are included. This allows the hydrodynamic interactions to be simulated, resulting in greater accuracy, but at significant computational expense. This present work models volume fraction evolution, rather than every colloidal particle. In doing so, diffusiophoresis is modelled at a coarser level than, for example, molecular dynamics, at which level implicit/explicit solvent methods become important. This is intended to allow different insights to be obtained with the benefit of analytic expressions and without the computational expense.
Considering implicit solvent models, Fortini et al. (Reference Fortini, Martín-Fabiani, De La Haye, Dugas, Lansalot, D'Agosto, Bourgeat-Lami, Keddie and Sear2016) used Langevin dynamics with a short-range repulsive interaction. This method predicts layers of small particles on top, but not a single layer of small particles. Fortini et al. argue that this stratification is due to the gradient in osmotic pressure. Similar results were obtained by the Langevin dynamics simulations of Howard, Nikoubashman & Panagiotopoulos (Reference Howard, Nikoubashman and Panagiotopoulos2017a). Note that they obtain film profiles with a thin layer of large particles at the very top surface, which is present in their equilibrium film profiles before commencing drying. They argue that this is due to volume exclusion of the large particles at the interface. This is a well-known entropic effect near a boundary, as, for example, shown by Roth & Dietrich (Reference Roth and Dietrich2000) in comparing Rosenfeld density functional calculations with simulations. Directly beneath is a stratified layer of small particles, which grows over time. In addition to the Langevin dynamics simulations, Howard et al. outline, and subsequently simulate (Howard, Nikoubashman & Panagiotopoulos Reference Howard, Nikoubashman and Panagiotopoulos2017b), a model based on density functional theory. This can be thought of as an extension to the approach of Zhou et al. (Reference Zhou, Jiang and Doi2017), using a high-accuracy equation of state to calculate the chemical potentials. This would be valid for concentrated solutions.
Tang, Grest & Cheng (Reference Tang, Grest and Cheng2018) carried out molecular dynamics simulations that model the solvent explicitly, obtaining a modified threshold for the occurrence of small-on-top stratification. Statt, Howard & Panagiotopoulos (Reference Statt, Howard and Panagiotopoulos2018) argue that hydrodynamic interactions which are modelled in an explicit solvent model are important for reliably predicting stratification: small-on-top stratification is predicted using the implicit solvent method, but not with the explicit solvent one. In contrast, Tang, Grest & Cheng (Reference Tang, Grest and Cheng2019) also compare implicit and explicit solvent models, although with limitations on the film thicknesses that can be assessed with the computationally expensive explicit solvent models. For the systems they studied, the implicit solvent model was found to be sufficient, as both the implicit and explicit solvent models predicted small-on-top stratification.
Adequate modelling of the solvent is important for assessing the effect of diffusiophoresis. A recent hypothesis for explaining the accumulation of small particles at the top surface concerns a type of diffusiophoresis. Diffusiophoresis is the migration of particles along a concentration gradient of a different solute species, which could be either ionic or non-ionic (Anderson & Prieve Reference Anderson and Prieve1984). Whilst diffusiophoresis can be used as a general term, covering different mechanisms which result in such particle migration, including electrophoresis and chemiphoresis, the hypothesis in this work concerns a specific non-ionic type of diffusiophoresis. Other phoretic terms could be easily added to the model in this work if desired: this model requires an expression for the total flux, so other flux contributions can be added.
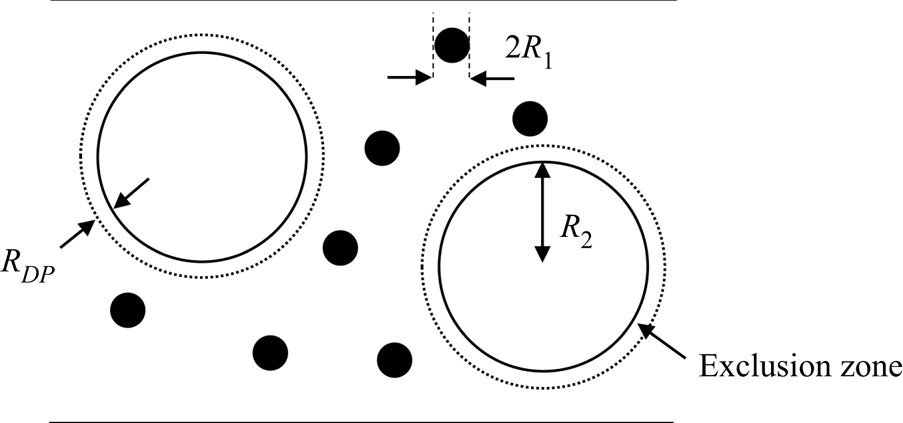
The non-ionic type of diffusiophoresis considered is an excluded volume effect, relevant in a mixture of small (component one) and large particles (component two). The small particles are excluded from a layer of solvent of thickness  ${R_{DP}}$ around each of the large particles. For the case of hard spheres, ${R_{DP}}$ is expected to equal the radius of a small particle, ${R_1}$. However, this work will explore what happens as ${R_{DP}}$ varies, which may correspond to, for example, non-spherical particles. The situation is depicted in figure 2. The radius of each large particle is ${R_2}$. Note that there will also be excluded volume effects between particles of the same type but, by definition, these are not diffusiophoresis, and are excluded in the present study.
Schematic of the exclusion zones around the larger particles, which give rise to diffusiophoresis.
Sear & Warren (Reference Sear and Warren2017) outline a simple model for this type of diffusiophoresis in a drying film. It is an idealised model, assuming that particles do not interact and that the particle size ratio is infinite. Diffusion of the larger particles is ignored, on the assumption that it is small compared with the diffusiophoretic flux. Diffusion of the smaller particles is included, by finding the concentration gradient of an ideal gas diffusing between two impenetrable walls, and then calculating the diffusiophoretic flux due to this concentration gradient.
Whilst Sear & Warren (Reference Sear and Warren2017) obtain elegant approximate analytical solutions, which are useful for gaining understanding, their model's applicability is limited to dilute solutions and very large size ratios. To aid insight into less idealised situations, particularly where the particle size ratio is not infinite, diffusion of both particles should be included. This allows identification of criteria for when diffusiophoresis is important. To allow the entire drying process to be modelled, not just the early stages, the model could be adapted to be valid up to close packing, again using the approach of Russel et al. (Reference Russel, Saville and Schowalter1989).
Diffusiophoresis with different relative strengths of diffusion of the large and small particles was modelled by Ault et al. (Reference Ault, Warren, Shin and Stone2017). The geometry that they chose, particle injection into or withdrawal from a semi-infinite or finite domain, is simpler than the drying geometry and has static boundaries. They formed advection–diffusion equations which are valid for dilute solutions. For the case where the diffusivity of the larger particles is neglected, Ault et al. obtain an analytical solution using the method of characteristics. This is compared with the numerical results which include diffusion of the larger particles. They found that ignoring diffusion of the larger particles accurately predicted the trajectories of the particle fronts, but not the particle concentrations around the fronts. Diffusiophoresis has also been modelled and imaged in a dead-end channel geometry (Shin et al. Reference Shin, Um, Sabass, Ault, Rahimi, Warren and Stone2016). This present work will seek to establish the relative importance of diffusion and diffusiophoresis in the geometry of a drying film.
Experimentally, it is difficult to determine whether the top layer is a monolayer of small particles, or thicker. It requires the ability to take measurements throughout the film depth, not just at the top surface. Small-angle X-ray scattering (SAXS) measurements have shown enrichment of small particles in the top several hundred layers of particles (Liu et al. Reference Liu, Carr, Yager, Routh and Bhatia2019). Existing works which include diffusiophoresis (Fortini et al. Reference Fortini, Martín-Fabiani, De La Haye, Dugas, Lansalot, D'Agosto, Bourgeat-Lami, Keddie and Sear2016; Howard et al. Reference Howard, Nikoubashman and Panagiotopoulos2017a,Reference Howard, Nikoubashman and Panagiotopoulosb) predict a growing layer of small particles at the top surface, in agreement with this. Experimental observation of a monolayer of small particles would support a different mechanism, such as interfacial effects. Atmuri, Bhatia & Routh (Reference Atmuri, Bhatia and Routh2012) added a surface interaction term to the model of Trueman et al. (Reference Trueman, Lago Domingues, Emmett, Murray and Routh2012b) to demonstrate this theoretically.
The review article by Schulz & Keddie (Reference Schulz and Keddie2018) compared predicted stratification regimes based on the interaction potential model of Zhou et al. (Reference Zhou, Jiang and Doi2017), and the diffusiophoresis models of Sear & Warren (Reference Sear and Warren2017) and Sear (Reference Sear2018), with experiments from the literature. Sear's model considers a jammed layer of small particles at the top surface, with diffusiophoretic drift of the large particles occurring just beneath it. This produces a simple criterion for small-on-top stratification: the speed of the jammed layer must be smaller than that of diffusiophoresis. Good agreement was found between experimental data for drying dilute dispersions and Zhou et al.'s predictions, but less so for concentrated ones. This suggests that a model which is valid for more concentrated solutions but allows input of Zhou et al.'s chemical potential expressions, could improve the agreement. Such a model is developed in this present work. Noting that there was a lack of experimental data in the range required to test the predicted stratification regimes of Sear & Warren and Sear, Schulz et al. (Reference Schulz, Smith, Sear, Brinkhuis and Keddie2020) subsequently carried out experiments with films containing colloid and polymer. The data obtained agree qualitatively with the predictions of Sear & Warren and Sear, but not with the exact position of the transition to small-on-top stratification.
It is clear from this survey that several hypotheses could explain the small-on-top observations, although existing simulations seem to predict a thicker final layer than is sometimes seen experimentally (Atmuri et al. Reference Atmuri, Bhatia and Routh2012). Whilst diffusiophoresis has been suggested as an explanation, it has not been directly modelled in a drying film. This work seeks to address this, adopting a fluid mechanics partial differential equation (PDE) model, since its simple formulation allows insight to be gained.
2. Derivation
2.1. Diffusion
To make explicit how the theory outlined here compares with previous work, whilst (2.7) in § 2.2 was also used by Trueman et al. (Reference Trueman, Lago Domingues, Emmett, Murray and Routh2012b), (2.12)–(2.14) correct the hydrodynamics implementation. These equations are given here in their most general forms. Also, (2.8)–(2.11) add clarification regarding diffusion reference frames. Equations (2.18)–(2.23) are reproduced from the work of Trueman et al., but they are subsequently substituted into the general conservation equation derived in § 2.2. §§ 2.3, 3.1 and 3.2 follow the same approach as Trueman et al., although again following through with the general equations.
2.1.1. Explanation of hydrodynamics correction
Using the thermodynamic approach in this present work, it is found that the extension from the one-component case of Routh & Zimmerman (Reference Routh and Zimmerman2004) to the two-component case is non-trivial. The Stokes–Einstein diffusion coefficient,  ${D_{SE}}$, was originally derived for a single particle in infinite solvent, so it needs to be determined how to use ${D_{SE}}$ in a system that is no longer infinitely dilute. According to Batchelor (Reference Batchelor1976), ${D_{SE}}$ applies to a force-free solvent. Hence instead of deriving that the diffusive flux of particles in a one-component film, ${\boldsymbol{j}_1}$, is
 \begin{equation}{\boldsymbol{j}_1} ={-} {D_{SE}}\boldsymbol{\nabla }{\mu _1},\end{equation}
where  $- \boldsymbol{\nabla }{\mu _1}$ is the force acting on component one due to its chemical potential, ${\mu _1}$, Batchelor derives
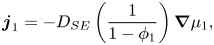 \begin{equation}{\boldsymbol{j}_1} ={-} {D_{SE}}\left( {\frac{1}{{1 - {\phi_1}}}} \right)\boldsymbol{\nabla }{\mu _1},\end{equation}
where  ${\phi _1}$ is the volume fraction of component one. The factor of $1/(1 - {\phi _1})\; $ results from a force correction. This force correction could be expressed as
 \begin{equation}{(\boldsymbol{\nabla }{\mu _1})_{eff}} = \boldsymbol{\nabla }{\mu _1} - \frac{{{\textstyle{4 \over 3}}{\rm \pi} R_1^3}}{{{\nu _s}}}\boldsymbol{\nabla }{\mu _s},\end{equation}
where  $(4/3){\rm \pi} R_1^3$ is the volume of a particle of component one, ${\nu _s}$ is the volume of a particle of the solvent and ${\mu _s}$ is the chemical potential of the solvent. The subscript $eff$ denotes the effective driving force for diffusion. Since the ratio of particle volumes is a constant, (2.3) could be equivalently written as
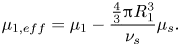 \begin{equation}{\mu _{1,eff}} = {\mu _1} - \frac{{{\textstyle{4 \over 3}}{\rm \pi} R_1^3}}{{{\nu _s}}}{\mu _s}.\end{equation}
This correction appears in the equations of Routh & Zimmerman (Reference Routh and Zimmerman2004). Trueman et al. (Reference Trueman, Lago Domingues, Emmett, Murray and Routh2012b) incorrectly extended this by writing
 \begin{equation}{\mu _{1,eff}} = {\mu _1} - \frac{{{\textstyle{4 \over 3}}{\rm \pi} R_1^3}}{{{\nu _s}}}\left( {\frac{{1 - {\phi_1} - {\phi_2}}}{{1 - {\phi_1}}}} \right){\mu _s} - {\left( {\frac{{{R_1}}}{{{R_2}}}} \right)^3}\left( {\frac{{{\phi_2}}}{{1 - {\phi_1}}}} \right){\mu _2},\end{equation}
where  ${\phi _2}$ is the volume fraction of component two, and ${\mu _2}$ is its chemical potential. Whilst this appears to be a logical extension of (2.4), (2.3) is still correct for a film with any number of components, following the reasoning of Batchelor (Reference Batchelor1976). Equation (2.3) should therefore be used to replace the erroneous (2.5) in the work of Trueman et al.
In a multicomponent solution, (2.3) is used to form an expression for  ${\boldsymbol{j}_{\boldsymbol{i}}}$ by summing over the contributions from all components in the mixture
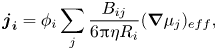 \begin{equation}{\boldsymbol{j}_{\boldsymbol{i}}} = {\phi _i}\mathop \sum \limits_j \frac{{{B_{ij}}}}{{6{\rm \pi}\eta {R_i}}}{(\boldsymbol{\nabla }{\mu _j})_{eff}},\end{equation}
where  ${B_{ij}}$ is the bulk mobility coefficient, which is generally a function of all ${\phi _j}$ and ratios of ${R_j}$. Substituting in expressions for ${B_{ij}}$ allows an equation of the form of (2.12) to be derived (Batchelor Reference Batchelor1983).
This present work will use the methodology of Trueman et al. (Reference Trueman, Lago Domingues, Emmett, Murray and Routh2012b), but with the corrected (2.12). The numerical results of Trueman et al. solved diffusion fluxes of the same leading order in  $P{e_1}$ and $P{e_2}$ as the equations in this present work, and so the results in § 4.1 are expected to show the same qualitative behaviour.
2.2. Governing equations
The conservation equation for one type of particles can be written as
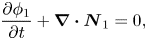 \begin{equation}\frac{{\partial {\phi _1}}}{{\partial t}} + \boldsymbol{\nabla }\boldsymbol{\cdot }{\boldsymbol{N}_1} = 0,\end{equation}
where  ${\boldsymbol{N}_1}$ is the total flux of particles of component one. Following the approach of Cussler (Reference Cussler2009), the total flux can be arbitrarily split up into a convective and diffusive flux
 \begin{equation}{\boldsymbol{N}_1} = \boldsymbol{j}_1^{\boldsymbol{a}} + {\phi _1}{\boldsymbol{U}^{\boldsymbol{a}}} = {\phi _1}{\boldsymbol{U}_1},\end{equation}
where the volume average velocity of type one particles is  ${\boldsymbol{U}_1}$, and their diffusive flux $\boldsymbol{j}_1^{\boldsymbol{a}}$ relative to the reference velocity ${\boldsymbol{U}^{\boldsymbol{a}}}$ is
 \begin{equation}\boldsymbol{j}_1^{\boldsymbol{a}} = {\phi _1}({\boldsymbol{U}_1} - {\boldsymbol{U}^{\boldsymbol{a}}}) ={-} \frac{{D_{11}^a}}{{kT}}\boldsymbol{\nabla }{\mu _1} - \frac{{D_{12}^a}}{{kT}}\boldsymbol{\nabla }{\mu _2}.\end{equation}
The chemical potential of component i in the two-component film is denoted by  ${\mu _i}$, and the diffusion coefficient of particles of type one in particles of type i, using a reference velocity ${\boldsymbol{U}^{\boldsymbol{a}}}$, is denoted by $D_{1i}^a$. It is convenient to choose the volume average velocity ${\boldsymbol{U}^{\boldsymbol{v}}}$as ${\boldsymbol{U}^{\boldsymbol{a}}}$, since ${\boldsymbol{U}^{\boldsymbol{v}}} = 0$ in a static film. Hence (2.7) becomes
 \begin{equation}\frac{{\partial {\phi _1}}}{{\partial t}} + \boldsymbol{\nabla }\boldsymbol{\cdot }({\phi _1}{\boldsymbol{U}_1}) = \frac{{\partial {\phi _1}}}{{\partial t}} + \boldsymbol{\nabla }\boldsymbol{\cdot }\boldsymbol{j}_1^{\boldsymbol{v}} = 0,\end{equation}
and diffusion coefficients using a volume-fixed reference frame are required.
For a volume-fixed reference frame,
 \begin{equation}{\boldsymbol{N}_1} = \boldsymbol{j}_1^{\boldsymbol{v}} + {\phi _1}{\boldsymbol{U}^{\boldsymbol{v}}} ={-} \frac{{D_{11}^v}}{{kT}}\boldsymbol{\nabla }{\mu _1} - \frac{{D_{12}^v}}{{kT}}\boldsymbol{\nabla }{\mu _2} = {\phi _1}{\boldsymbol{U}_1},\end{equation}
so expressions for  $D_{11}^v$ and $D_{12}^v$ are required. It is desired to relate these to the Stokes–Einstein diffusion coefficient of component one, ${D_{SE,1}} = kT/6{\rm \pi}\eta {R_1}$.
Hydrodynamic effects are taken into account via  ${K_{11}}({\phi _1},{\phi _2})$ and ${K_{12}}({\phi _1},{\phi _2})$, which are referred to as sedimentation coefficients by analogy with sedimentation (Batchelor Reference Batchelor1976). It is expected that these will be functions of ${R_1}$ and ${R_2}$ as well as ${\phi _1}$ and ${\phi _2}$. This gives
 \begin{equation}{\boldsymbol{U}_1} ={-} \frac{1}{{6{\rm \pi}\eta {R_1}}}[{K_{11}}({\phi _1},{\phi _2})\boldsymbol{\nabla }{\mu _1} + {\phi _2}{K_{12}}({\phi _1},{\phi _2})\boldsymbol{\nabla }{\mu _2}].\end{equation}
Defining the sedimentation coefficients such that  ${U_1}$ is a velocity relative to the volume average velocity, and so can be used in (2.10) and (2.11), the conservation equation for component one becomes
 \begin{equation}\frac{{\partial {\phi _1}}}{{\partial t}} = \frac{1}{{6{\rm \pi}\eta {R_1}}}\boldsymbol{\nabla }\boldsymbol{\cdot }[{\phi _1}{K_{11}}({\phi _1},{\phi _2})\boldsymbol{\nabla }{\mu _1} + {\phi _1}{\phi _2}{K_{12}}({\phi _1},{\phi _2})\boldsymbol{\nabla }{\mu _2}].\end{equation}
Hence,  $D_{11}^v$ and $D_{12}^v$ can be found in relation to ${D_{SE,1}}$ by comparison with the sedimentation coefficients. Note that, in this work, the diffusive fluxes are written in terms of chemical potential gradients, as opposed to concentration gradients. This is why we divide ${D_{SE,1}}$ by $kT$ in the flux expressions, (2.12) and (2.13), and why a factor of ${\phi _1}$ appears in front of the $\boldsymbol{\nabla }{\mu _1}$ term in (2.13), and likewise for the ${\phi _2}$ term in front of the $\boldsymbol{\nabla }{\mu _2}$.
Expressions for  ${K_{11}}({\phi _1},{\phi _2})$ and ${K_{12}}({\phi _1},{\phi _2})$ for rigid spheres with zero interaction potential in dilute solution can be found in Batchelor's work (Reference Batchelor1983). However, it is desired to use generalised forms of these expressions to run the model up to close packing. A factor of ${\phi _1}$ is included in front of the $\boldsymbol{\nabla }{\mu _2}$ term in (2.13) in order to match the leading-order coefficients in $({\phi _1},{\phi _2})$ for dilute solution. Batchelor's (Reference Batchelor1983) dilute expressions will need to be adapted such that the sedimentation coefficients fall to zero as the mixture approaches close packing, due to hydrodynamic hindrance (Russel et al. Reference Russel, Saville and Schowalter1989). Steric effects could be incorporated into the chemical potential terms if desired.
We consider the case of one-dimensional drying with the top surface decreasing normally to the substrate. By scaling with  $\hat{z} = z/H$ and $\hat{t} = t\dot{E}/H$, (2.13), in one dimension, becomes
 \begin{equation}\frac{{\partial {\phi
_1}}}{{\partial \hat{t}}} = \frac{\partial }{{\partial
\hat{z}}}\left[ {\frac{1}{{6{\rm \pi}\eta
{R_1}\dot{E}H}}\left[{\phi_1}{K_{11}}({\phi_1},{\phi_2})\frac{{\partial
{\mu_1}}}{{\partial \hat{z}}} +
{\phi_1}{\phi_2}{K_{12}}({\phi_1},{\phi_2})\frac{{\partial
{\mu_2}}}{{\partial \hat{z}}}\right]}\right].\end{equation}
\begin{equation}\frac{{\partial {\phi
_1}}}{{\partial \hat{t}}} = \frac{\partial }{{\partial
\hat{z}}}\left[ {\frac{1}{{6{\rm \pi}\eta
{R_1}\dot{E}H}}\left[{\phi_1}{K_{11}}({\phi_1},{\phi_2})\frac{{\partial
{\mu_1}}}{{\partial \hat{z}}} +
{\phi_1}{\phi_2}{K_{12}}({\phi_1},{\phi_2})\frac{{\partial
{\mu_2}}}{{\partial \hat{z}}}\right]}\right].\end{equation}
2.2.1. Evaporation rate
For the purpose of (2.14),  $\dot{E}$ needs only to be a constant, characteristic evaporation velocity used for non-dimensionalising. When evaporation at the top surface is included in the boundary condition (§ 3.2), it is assumed that the evaporation rate is approximately constant. Evaporation is driven by the thermodynamic driving force between the vapour pressure of the solvent at the top of the film and the vapour pressure of the gas above the film. The vapour pressure of the gas above the film is affected by the time scale for diffusion from the layer of saturated vapour directly above the film to the bulk gas. This time scale is orders of magnitude smaller than the evaporation time (Popòv Reference Popòv2005), leading to a quasi-static problem (Routh Reference Routh2013).
Routh & Russel (Reference Routh and Russel1998) derived an expression for  $\dot{E}$,
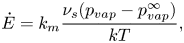 \begin{equation}\dot{E} = {k_m}\frac{{{\nu _s}({p_{vap}} - p_{vap}^\infty )}}{{kT}},\end{equation}
where  ${k_m}$ is the gas-side mass transfer coefficient, ${p_{vap}}$ is the vapour pressure of the solvent at the top of the film and $p_{vap}^\infty $ is the vapour pressure of the bulk gas.
The chemical potential of the solvent is related to the osmotic pressure,  $\varPi $, as
 \begin{equation}\varPi ={-} \frac{{{\mu _s} - \mu _s^0}}{{{\nu _s}}} = \left( {\frac{{{\phi_1}}}{{{\textstyle{4 \over 3}}{\rm \pi} R_1^3}} + \frac{{{\phi_2}}}{{{\textstyle{4 \over 3}}{\rm \pi} R_2^3}}} \right)kTZ({\phi _1},{\phi _2}),\end{equation}
where  $\mu _s^0$ is the solvent reference potential and $Z({\phi _1},{\phi _2})$ is the compressibility, which accounts for the non-ideality of the osmotic pressure at high volume fractions. Relating the chemical potential to the solvent pressure through ${\mu _s} - \mu _s^0 = kT\ln ({p_{vap}}/p_{vap}^0)$, where $p_{vap}^0$ is the solvent reference vapour pressure, and extending the approach of Routh & Russel (Reference Routh and Russel1998) to a two-component mixture, (2.16) is substituted into (2.15), giving
 \begin{equation}\dot{E} = {k_m}\frac{{{\nu _s}}}{{kT}}\left[ {p_{vap}^0exp \left[ { - {\nu_s}\left( {\frac{{{\phi_1}}}{{{\textstyle{4 \over 3}}{\rm \pi} R_1^3}} + \frac{{{\phi_2}}}{{{\textstyle{4 \over 3}}{\rm \pi} R_2^3}}} \right)Z({\phi_1},{\phi_2})} \right] - p_{vap}^\infty } \right].\end{equation}
Since  ${\nu _s} \ll (4/3){\rm \pi} R_1^3$, and ${\nu _\textrm{s}} \ll (4/3){\rm \pi} R_2^3$, as long the film has not yet reached close packing, we obtain $\dot{E}\sim {k_m}{\nu _s}(p_{vap}^0 - p_{vap}^\infty )/kT$, which is independent of film composition. In other words, the driving force is dominated by the humidity of the gas. In this one-dimensional drying model, a large surface area of film is assumed, so geometric edge effects are not applicable (Routh Reference Routh2013). When the film is close packed, $Z({\phi _1},{\phi _2})$ diverges.
This work models drying up until the film is close packed throughout. There are stages of drying beyond this (deformation and aging) that lead to film formation (Sonzogni et al. Reference Sonzogni, Passeggi, Wedepohl, Calderón, Gugliotta, Gonzalez and Minari2018), but it is the first part of drying, where the particles can move throughout the film, that affects their arrangement in the dried film. If the particles are colloids, as they would be in many common examples of films (Routh Reference Routh2013), then they are assumed to be colloidally stable. However, the model would also be valid for particles smaller than the colloidal range until the composition at which they precipitate.
2.3. Derivation of the spatial derivative of the chemical potential
The chemical potential of component one can be written as a function of  ${\phi _1}$ and ${\phi _2}$, such that $\partial {\mu _1}/\partial \hat{z} = f({\phi _1}(\hat{z}),{\phi _2}(\hat{z}))$, and likewise for the chemical potential of component two, ${\mu _2}$. These expressions could be directly inputted into (2.14). However, it is difficult to find expressions for the chemical potential of the solutes that are valid as the solution approaches close packing. One means of resolving this is to relate ${\mu _1}$ and ${\mu _2}$ to the chemical potential of the solvent, ${\mu _s}$, for which an expression that diverges at close packing can be found.
For a system which contains  ${n_1} = {\phi _1}/(4/3){\rm \pi} R_1^3$ particles of component one, ${n_2} = {\phi _2}/(4/3){\rm \pi} R_2^3$ particles of component two and ${n_s} = (1 - {\phi _1} - {\phi _2})/{\nu _s}$ particles of solvent per unit volume, conservation of volume can be expressed as
 \begin{equation}{\textstyle{4 \over 3}}{\rm \pi} R_1^3{n_1} + {\textstyle{4 \over 3}}{\rm \pi} R_2^3{n_2} + {\nu _s}{n_s} = 1.\end{equation}
The Gibbs–Duhem equation relates the chemical potentials in the system at constant temperature and pressure as
 \begin{equation}{n_1}\boldsymbol{\nabla }{\mu _1} + {n_2}\boldsymbol{\nabla }{\mu _2} + {n_s}\boldsymbol{\nabla }{\mu _s} = 0.\end{equation}
The Gibbs–Duhem equation (2.19), in one dimension, can be rearranged, giving
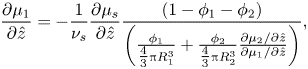 \begin{equation}\frac{{\partial {\mu _1}}}{{\partial \hat{z}}} ={-} \frac{1}{{{\nu _s}}}\frac{{\partial {\mu _s}}}{{\partial \hat{z}}}\frac{{(1 - {\phi _1} - {\phi _2})}}{{\left( {\frac{{{\phi_1}}}{{{\textstyle{4 \over 3}}{\rm \pi} R_1^3}} + \frac{{{\phi_2}}}{{{\textstyle{4 \over 3}}{\rm \pi} R_2^3}}\frac{{\partial {\mu_2}/\partial \hat{z}}}{{\partial {\mu_1}/\partial \hat{z}}}} \right)}},\end{equation}
and
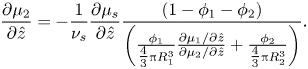 \begin{equation}\frac{{\partial {\mu _2}}}{{\partial \hat{z}}} ={-} \frac{1}{{{\nu _s}}}\frac{{\partial {\mu _s}}}{{\partial \hat{z}}}\frac{{(1 - {\phi _1} - {\phi _2})}}{{\left( {\frac{{{\phi_1}}}{{{\textstyle{4 \over 3}}{\rm \pi} R_1^3}}\frac{{\partial {\mu_1}/\partial \hat{z}}}{{\partial {\mu_2}/\partial \hat{z}}} + \frac{{{\phi_2}}}{{{\textstyle{4 \over 3}}{\rm \pi} R_2^3}}} \right)}}.\end{equation}
Using the spatial derivative of (2.16), plus the relationship  ${R_1}/{R_2} = P{e_1}/P{e_2}$, (2.20) and (2.21) become
 \begin{equation}\frac{{\partial {\mu _1}}}{{\partial \hat{z}}} = \frac{{(1 - {\phi _1} - {\phi _2})}}{{\left( {{\phi_1} + {{\left( {\frac{{P{e_1}}}{{P{e_2}}}} \right)}^3}{\phi_2}\frac{{\partial {\mu_2}/\partial \hat{z}}}{{\partial {\mu_1}/\partial \hat{z}}}} \right)}}\frac{\partial }{{\partial \hat{z}}}\left[ {\left( {{\phi_1} + {{\left( {\frac{{P{e_1}}}{{P{e_2}}}} \right)}^3}{\phi_2}} \right)kTZ({\phi_1},{\phi_2})} \right],\end{equation}
and
 \begin{equation}\frac{{\partial {\mu _2}}}{{\partial \hat{z}}} = \frac{{(1 - {\phi _1} - {\phi _2})}}{{\left( {{{\left( {\frac{{P{e_2}}}{{P{e_1}}}} \right)}^3}{\phi_1}\frac{{\partial {\mu_1}/\partial \hat{z}}}{{\partial {\mu_2}/\partial \hat{z}}} + {\phi_2}} \right)}}\frac{\partial }{{\partial \hat{z}}}\left[ {\left( {{{\left( {\frac{{P{e_2}}}{{P{e_1}}}} \right)}^3}{\phi_1} + {\phi_2}} \right)kTZ({\phi_1},{\phi_2})} \right].\end{equation}
The purpose of rewriting the chemical potential gradients as in (2.22) and (2.23) is to obtain the advantages, discussed below, of expressing them as functions of  $\partial {\mu _s}/\partial \hat{z}$ and $(\partial {\mu _1}/\partial \hat{z})/(\partial {\mu _2}/\partial \hat{z})$. The chosen model formulation intends for the effects of concentrated solution to be addressed via the divergence in solvent chemical potential, ${\mu _s}$, and the particle interactions to be input via $(\partial {\mu _1}/\partial \hat{z})/(\partial {\mu _2}/\partial \hat{z})$. Hence, this extends approaches that are valid only for more dilute solution, for example, Zhou et al. (Reference Zhou, Jiang and Doi2017). Since the ratio of the chemical potential gradients is determined physically by the inter-particle interactions, the chemistry of the types of particles that are used to form the film, such as their surface charge, will be relevant (Atmuri et al. Reference Atmuri, Bhatia and Routh2012).
Note that the Gibbs–Duhem equation (2.19) relates  ${\mu _1}$, ${\mu _2}$ and ${\mu _s}$. Equation (2.16) gives an expression for ${\mu _s}$ which diverges at close packing. Hence, only one of ${\mu _1}$ and ${\mu _2}$, or a relationship between them, can also be specified. Since (2.20) and (2.21) give $\partial {\mu _1}/\partial \hat{z}$ and $\partial {\mu _2}/\partial \hat{z}$ only as implicit functions to be inserted into the conservation equation, different rearrangements of the Gibbs–Duhem equation could have been chosen instead. The particular rearrangements in (2.20) and (2.21) were chosen since their right-hand sides depend on $\partial {\mu _s}/\partial \hat{z}$ and the ratio $(\partial {\mu _1}/\partial \hat{z})/(\partial {\mu _2}/\partial \hat{z})$. The solvent chemical potential is measurable up to close packing, where it diverges. This means that $\partial {\mu _1}/\partial \hat{z}$ and $\partial {\mu _2}/\partial \hat{z}$ also diverge at close packing, in an unknown fashion. An expression chosen for the ratio $(\partial {\mu _1}/\partial \hat{z})/(\partial {\mu _2}/\partial \hat{z})$ is more likely to be valid approaching close packing than expressions that could be put forward for each particle separately. Equations (2.20) and (2.21) are also of the same form as each other, as desired.
Equation (2.16) for the osmotic pressure is used to generate an expression for  ${\mu _s}$ only, rather than being used as an equation of state to also generate the other chemical potentials. The thermodynamic consistency of this approach with respect to the Maxwell relations is further explained in § S6 of the supplementary material (SI) available at https://doi.org/10.1017/jfm.2021.800.
In summary, a thermodynamically consistent approach is achieved by satisfying the Gibbs–Duhem equation. In choosing to specify  $Z({\phi _1},{\phi _2})$, as a proxy for $\partial {\mu _s}/\partial \hat{z}$, and $(\partial {\mu _1}/\partial \hat{z})/(\partial {\mu _2}/\partial \hat{z})$, the system chemical potentials are fully specified. As formulated, the right-hand sides of (2.22) and (2.23) require input of an expression for $(\partial {\mu _1}/\partial \hat{z})/(\partial {\mu _2}/\partial \hat{z})$. Although the chemical potential expressions given in (2.22) and (2.23) appear complicated, they are merely (2.16) combined with rearrangements of the Gibbs–Duhem equation, in the same way as Russel et al. (Reference Russel, Saville and Schowalter1989) and Trueman et al. (Reference Trueman, Lago Domingues, Emmett, Murray and Routh2012b).
2.4. Diffusiophoresis
The governing conservation equation (2.7) requires an expression for the total flux. In this section, the aim is to investigate the effect of diffusiophoresis. The total flux is written as the sum of two terms, one described as the diffusion term, and the other described as the diffusiophoresis term.
The deviation of osmotic pressure from ideality, and hence  $Z({\phi _1},{\phi _2})$ from unity, accounts for the total excluded volume (Russel et al. Reference Russel, Saville and Schowalter1989). However, this model uses the same form of $Z({\phi _1},{\phi _2})$ for the diffusion term, for both the flux of component one and two. In not differentiating between the expressions used for the two fluxes, this form of equation will not give rise to diffusiophoresis. It will give a diffusional model in the sense of the fluxes of both particle types remaining inversely proportional to their particle radius. The flux contribution that is due to diffusiophoresis can be found from first principles for a dilute solution, and written as a separate term. The language of this paper refers to this as the diffusiophoresis term.
Excluded volume effects are more general than diffusiophoresis resulting from excluded volume, since the latter specifically refers to one component moving in response to the concentration gradient of another, whereas in general a component can have volume excluded by both itself and other components. An alternative approach could write the total flux as one term, with a form of  $Z({\phi _1},{\phi _2})$ from an equation of state that would include the diffusiophoretic flux. However, the approach taken here allows the effect of diffusiophoresis to be identified separately.
With this approach, a model including diffusiophoresis is constructed, assuming  ${R_2} \gg {R_1}$. The particles of type one are modelled using an extension of the Asakura–Oosawa model to concentrated solution. Under the Asakura–Oosawa model, the type one particles are assumed to be excluded from a layer of solvent of thickness ${R_{DP}}$ around each particle of type two. Using this model, in a dilute solution, the drift velocity of the large particles due to diffusiophoresis, ${\boldsymbol{U}_{\boldsymbol{P}}}$, in a static film is given by
 \begin{equation}{\boldsymbol{U}_{\boldsymbol{P}}} ={-} \frac{{3{\phi _1}kT}}{{8{\rm \pi}\eta }}\frac{{R_{DP}^2}}{{R_1^3}}\boldsymbol{\nabla }\ln {\phi _1} = {\varGamma _1}\boldsymbol{\nabla }\ln {\phi _1},\end{equation}
where  ${\varGamma _1}$ is the diffusiophoretic drift coefficient (Anderson & Prieve Reference Anderson and Prieve1984; Sear & Warren Reference Sear and Warren2017). Following the approach of Marbach, Yoshida & Bocquet (Reference Marbach, Yoshida and Bocquet2017), this is extended to concentrated solution via invoking the osmotic pressure (SI, § S1.2), to obtain
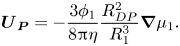 \begin{equation}{\boldsymbol{U}_{\boldsymbol{P}}} ={-} \frac{{3{\phi _1}}}{{8{\rm \pi}\eta }}\frac{{R_{DP}^2}}{{R_1^3}}\boldsymbol{\nabla }{\mu _1}.\end{equation}
This is taken to be the extra slip velocity, in addition to that due to diffusion, between the particles of component two and the solvent. For the case of hard spheres, which is considered here,  ${R_{DP}} = {R_1}$. Since ${\boldsymbol{U}_{\boldsymbol{P}}}$ gives the relative diffusiophoretic velocity between type two particles and the solvent, this needs to be converted to a velocity relative to the volume average velocity, ${\boldsymbol{U}^{\boldsymbol{v}}}$. Note that the result in (2.24) is the correct diffusiophoretic drift velocity for dilute solution, expected to agree with explicit solvent models. This contrasts with the result of implicit solvent methods which neglect the solvent dynamics, and consequently may overpredict the diffusiophoretic velocity (Sear & Warren Reference Sear and Warren2017).
The velocity of each type of particle i is split up into a component due to diffusion (denoted by the superscript  $D$), which has been found in § 2.2, and a component due to diffusiophoresis (denoted by the superscript $P$)
$P$)
 \begin{equation}{\boldsymbol{U}_{\boldsymbol{i}}} = \boldsymbol{U}_{\boldsymbol{i}}^{\boldsymbol{D}} + \boldsymbol{U}_{\boldsymbol{i}}^{\boldsymbol{P}}.\end{equation}
The local average velocities of the type one, type two and solvent particles are denoted by  ${\boldsymbol{U}_1}$, ${\boldsymbol{U}_2}$ and ${\boldsymbol{U}_{\boldsymbol{s}}}$, respectively.
It is necessary to obtain relationships between  $\boldsymbol{U}_1^{\boldsymbol{P}}$, $\boldsymbol{U}_2^{\boldsymbol{P}}$ and $\boldsymbol{U}_{\boldsymbol{s}}^{\boldsymbol{P}}$. First, note that for a static film, ${\boldsymbol{U}^{\boldsymbol{v}}} = 0$, so
 \begin{equation}{\boldsymbol{U}^{\boldsymbol{v}}} = {\phi _1}{\boldsymbol{U}_1} + {\phi _2}{\boldsymbol{U}_2} + (1 - {\phi _1} - {\phi _2}){\boldsymbol{U}_{\boldsymbol{s}}} = 0.\end{equation}
The components of the velocities due to diffusion already obey
 \begin{equation}{\boldsymbol{U}^{\boldsymbol{v},\boldsymbol{D}}} = {\phi _1}\boldsymbol{U}_1^{\boldsymbol{D}} + {\phi _2}\boldsymbol{U}_2^{\boldsymbol{D}} + (1 - {\phi _1} - {\phi _2})\boldsymbol{U}_{\boldsymbol{s}}^{\boldsymbol{D}} = 0.\end{equation}
Hence, subtracting equation (2.28) from (2.27), provides
 \begin{equation}{\boldsymbol{U}^{\boldsymbol{v},\boldsymbol{P}}} = {\phi _1}\boldsymbol{U}_1^{\boldsymbol{P}} + {\phi _2}\boldsymbol{U}_2^{\boldsymbol{P}} + (1 - {\phi _1} - {\phi _2})\boldsymbol{U}_{\boldsymbol{s}}^{\boldsymbol{P}} = 0.\end{equation}
The velocity of component two and the velocity of the solvent are related by
 \begin{equation}\boldsymbol{U}_2^{\boldsymbol{P}} - \boldsymbol{U}_{\boldsymbol{s}}^{\boldsymbol{P}} = {\boldsymbol{U}_{\boldsymbol{P}}}.\end{equation}
Under the assumptions of this model, diffusiophoresis does not affect the velocity of component one relative to the solvent,
 \begin{equation}\boldsymbol{U}_1^{\boldsymbol{P}} = \boldsymbol{U}_{\boldsymbol{s}}^{\boldsymbol{P}}.\end{equation}
This is the case in an idealised model and is therefore used as a starting point for a non-ideal model, with finite size ratios. Although deviation from this will be expected when the particle size ratio is finite (Howard & Nikoubashman Reference Howard and Nikoubashman2020), it would not be expected to be large. Solving (2.29)–(2.31) simultaneously, and including sedimentation coefficients,  ${K_{P1}}({\phi _1},{\phi _2})$ and ${K_{P2}}({\phi _1},{\phi _2})$, obtains
 \begin{equation}\boldsymbol{U}_1^{\boldsymbol{P}} = \boldsymbol{U}_{\boldsymbol{s}}^{\boldsymbol{P}} ={-} {\phi _2}{\boldsymbol{U}_{\boldsymbol{P}}} = \frac{{3{\phi _1}{\phi _2}{K_{P1}}({\phi _1},{\phi _2})}}{{8{\rm \pi}\eta {R_1}}}\boldsymbol{\nabla }{\mu _1},\end{equation}
and
 \begin{equation}\boldsymbol{U}_2^{\boldsymbol{P}} = (1 - {\phi _2}){\boldsymbol{U}_{\boldsymbol{P}}} ={-} \frac{{3{\phi _1}(1 - {\phi _2}){K_{P2}}({\phi _1},{\phi _2})}}{{8{\rm \pi}\eta {R_1}}}\; \boldsymbol{\nabla }{\mu _1}.\end{equation}
To satisfy continuity, it is required that  ${K_{P2}}({\phi _1},{\phi _2}) = {K_{P1}}({\phi _1},{\phi _2}) = {K_P}({\phi _1},{\phi _2})$. Note that this is not a general result; it is just a result of how this model chooses to write the total flux as two separate terms. Addressing the more general question of whether ${K_{12}}({\phi _1},{\phi _2}) = {K_{21}}({\phi _1},{\phi _2})$, these are not equal, as can be seen from analytical expressions for dilute solution (Batchelor Reference Batchelor1983). However, equating these expressions would be a reasonable approximation for generating example solutions. ${K_{ij}}({\phi _1},{\phi _2})$ and ${K_P}({\phi _1},{\phi _2})$ are both denoted with ‘ $K$’ since they are both sedimentation coefficients, i.e. they represent the same physical phenomenon of hydrodynamic hindrance. The different subscripts identify the terms for which these are the coefficients.
Equation (2.32) can be interpreted as showing that component one and the solvent move backwards compared with the diffusiophoretic motion of component two, in order to conserve volume. Using (2.12), which gives  $\boldsymbol{U}_1^{\boldsymbol{D}}$, and the analogous expression for $\boldsymbol{U}_2^{\boldsymbol{D}}$, the complete expressions for the component velocities including both diffusion and diffusiophoresis are
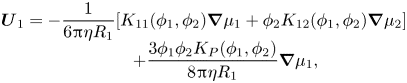 \begin{equation}\begin{array}{c} {\boldsymbol{U}_1} ={-} \dfrac{1}{{6{\rm \pi}\eta {R_1}}}[{K_{11}}({\phi _1},{\phi _2})\boldsymbol{\nabla }{\mu _1} + {\phi _2}{K_{12}}({\phi _1},{\phi _2})\boldsymbol{\nabla }{\mu _2}]\\ \qquad\ \, + \dfrac{{3{\phi _1}{\phi _2}{K_P}({\phi _1},{\phi _2})}}{{8{\rm \pi}\eta {R_1}}}\boldsymbol{\nabla }{\mu _1}, \end{array}\end{equation}
and
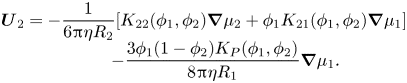 \begin{equation}\begin{array}{c} {\boldsymbol{U}_2}={-} \dfrac{1}{{6{\rm \pi}\eta {R_2}}}[{K_{22}}({\phi _1},{\phi _2})\boldsymbol{\nabla }{\mu _2} + {\phi _1}{K_{21}}({\phi _1},{\phi _2})\boldsymbol{\nabla }{\mu _1}]\\ \qquad\ \, - \dfrac{{3{\phi _1}(1 - {\phi _2}){K_P}({\phi _1},{\phi _2})}}{{8{\rm \pi}\eta {R_1}}}\boldsymbol{\nabla }{\mu _1}. \end{array}\end{equation}
Including diffusiophoresis, the conservation equation for particles of type one is now
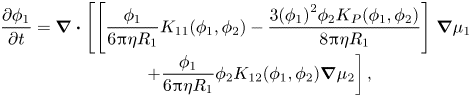 \begin{equation}\begin{array}{c} \dfrac{{\partial {\phi _1}}}{{\partial t}} = \boldsymbol{\nabla }\boldsymbol{\cdot }\left[ {\left[ {\dfrac{{{\phi_1}}}{{6{\rm \pi}\eta {R_1}}}{K_{11}}({\phi_1},{\phi_2}) - \dfrac{{3{{({\phi_1})}^2}{\phi_2}{K_P}({\phi_1},{\phi_2})}}{{8{\rm \pi}\eta {R_1}}}} \right]} \right.\boldsymbol{\nabla }{\mu _1}\\ \qquad\ \ \left. { + \dfrac{{{\phi_1}}}{{6{\rm \pi}\eta {R_1}}}{\phi_2}{K_{12}}({\phi_1},{\phi_2})\boldsymbol{\nabla }{\mu_2}} \right], \end{array}\end{equation}
and that for particles of type two becomes
 \begin{equation}\begin{array}{c} \dfrac{{\partial {\phi _2}}}{{\partial t}} = \boldsymbol{\nabla }\boldsymbol{\cdot }\left[ {\left[ {\dfrac{{{\phi_2}}}{{6{\rm \pi}\eta {R_2}}}{\phi_1}{K_{21}}({\phi_1},{\phi_2}) + \dfrac{{3{\phi_1}{\phi_2}(1 - {\phi_2}){K_P}({\phi_1},{\phi_2})}}{{8{\rm \pi}\eta {R_1}}}} \right]\boldsymbol{\nabla }{\mu_1}} \right.\\ \qquad\ \ \left. { + \dfrac{{{\phi_2}}}{{6{\rm \pi}\eta {R_2}}}{K_{22}}({\phi_1},{\phi_2})\boldsymbol{\nabla }{\mu_2}} \right]. \end{array}\end{equation}
Note that the divergence of the total flux should reflect the total excluded volume, which is incorporated into  $Z({\phi _1},{\phi _2})$, hence all the flux terms, including the diffusiophoresis terms, should diverge in the same form as $Z({\phi _1},{\phi _2})$. Since all of the flux terms contain a factor of $\boldsymbol{\nabla }{\mu _1}$ or $\boldsymbol{\nabla }{\mu _2}$, which diverge via $Z({\phi _1},{\phi _2})$ through the formulations for (2.22) and (2.23), (2.36) and (2.37) obtain suitable divergence at close packing.
3. Methodology
3.1. Scaling
Equations (2.22) and (2.23), the spatial derivatives of the chemical potentials, are substituted into (2.36), and scaled in one dimension, to form the conservation equation for component one,
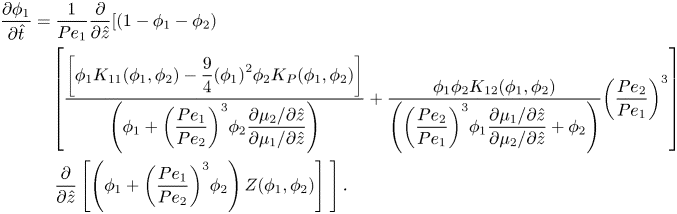 \begin{align}
\dfrac{{\partial {\phi _1}}}{{\partial \hat{t}}} & =
\dfrac{1}{{P{e_1}}}\dfrac{\partial }{{\partial
\hat{z}}}[{(1 - {\phi_1} - {\phi_2})} \notag\\ & \quad \left[
{\dfrac{{\left[ {{\phi_1}{K_{11}}({\phi_1},{\phi_2}) -
\dfrac{9}{4}{{({\phi_1})}^2}{\phi_2}{K_P}({\phi_1},{\phi_2})}
\right]}}{{\left( {{\phi_1} + {{\left(
{\dfrac{{P{e_1}}}{{P{e_2}}}}
\right)}^3}{\phi_2}\dfrac{{\partial {\mu_2}/\partial
\hat{z}}}{{\partial {\mu_1}/\partial \hat{z}}}} \right)}} +
\dfrac{{{\phi_1}{\phi_2}{K_{12}}({\phi_1},{\phi_2})}}{{\left(
{{{\left( {\dfrac{{P{e_2}}}{{P{e_1}}}}
\right)}^3}{\phi_1}\dfrac{{\partial {\mu_1}/\partial
\hat{z}}}{{\partial {\mu_2}/\partial \hat{z}}} + {\phi_2}}
\right)}}{{\left( {\dfrac{{P{e_2}}}{{P{e_1}}}} \right)}^3}}
\right]\notag\\ & \quad \left. {\dfrac{\partial }{{\partial
\hat{z}}}\left[ {\left( {{\phi_1} + {{\left(
{\dfrac{{P{e_1}}}{{P{e_2}}}} \right)}^3}{\phi_2}}
\right)Z({\phi_1},{\phi_2})} \right]\; } \right].
\end{align}
\begin{align}
\dfrac{{\partial {\phi _1}}}{{\partial \hat{t}}} & =
\dfrac{1}{{P{e_1}}}\dfrac{\partial }{{\partial
\hat{z}}}[{(1 - {\phi_1} - {\phi_2})} \notag\\ & \quad \left[
{\dfrac{{\left[ {{\phi_1}{K_{11}}({\phi_1},{\phi_2}) -
\dfrac{9}{4}{{({\phi_1})}^2}{\phi_2}{K_P}({\phi_1},{\phi_2})}
\right]}}{{\left( {{\phi_1} + {{\left(
{\dfrac{{P{e_1}}}{{P{e_2}}}}
\right)}^3}{\phi_2}\dfrac{{\partial {\mu_2}/\partial
\hat{z}}}{{\partial {\mu_1}/\partial \hat{z}}}} \right)}} +
\dfrac{{{\phi_1}{\phi_2}{K_{12}}({\phi_1},{\phi_2})}}{{\left(
{{{\left( {\dfrac{{P{e_2}}}{{P{e_1}}}}
\right)}^3}{\phi_1}\dfrac{{\partial {\mu_1}/\partial
\hat{z}}}{{\partial {\mu_2}/\partial \hat{z}}} + {\phi_2}}
\right)}}{{\left( {\dfrac{{P{e_2}}}{{P{e_1}}}} \right)}^3}}
\right]\notag\\ & \quad \left. {\dfrac{\partial }{{\partial
\hat{z}}}\left[ {\left( {{\phi_1} + {{\left(
{\dfrac{{P{e_1}}}{{P{e_2}}}} \right)}^3}{\phi_2}}
\right)Z({\phi_1},{\phi_2})} \right]\; } \right].
\end{align}For component two, substituting equations (2.22) and (2.23) into (2.37) and scaling gives
 \begin{align}
\dfrac{{\partial {\phi _2}}}{{\partial \hat{t}}} & =
\dfrac{1}{{P{e_2}}}\dfrac{\partial }{{\partial
\hat{z}}}\left[\vphantom{\left(\dfrac{{P{e_2}}}{{P{e_1}}}\right)}{(1 - {\phi_1} - {\phi_2})} \right.\notag\\ & \quad \left. \left[
{{\left( {\dfrac{{P{e_1}}}{{P{e_2}}}} \right)}^3}\left[
{\dfrac{{{\phi_1}{\phi_2}{K_{21}}({\phi_1},{\phi_2}) +
\dfrac{9}{4}\left( {\dfrac{{P{e_2}}}{{P{e_1}}}}
\right){\phi_1}{\phi_2}(1 -
{\phi_2}){K_P}({\phi_1},{\phi_2})}}{{\left( {{\phi_1} +
{{\left( {\dfrac{{P{e_1}}}{{P{e_2}}}}
\right)}^3}{\phi_2}\dfrac{{\partial {\mu_2}/\partial
\hat{z}}}{{\partial {\mu_1}/\partial \hat{z}}}} \right)}}}
\right]\right.\right. \notag\\ &\quad + \left.\left.
\dfrac{{{\phi_2}{K_{22}}({\phi_1},{\phi_2})}}{{\left(
{{{\left( {\dfrac{{P{e_2}}}{{P{e_1}}}}
\right)}^3}{\phi_1}\dfrac{{\partial {\mu_1}/\partial
\hat{z}}}{{\partial {\mu_2}/\partial \hat{z}}} + {\phi_2}}
\right)}} \right]\right. \notag\\ & \quad \left. {\; \dfrac{\partial
}{{\partial \hat{z}}}\left[ {\left( {{{\left(
{\dfrac{{P{e_2}}}{{P{e_1}}}} \right)}^3}{\phi_1} +
{\phi_2}} \right)Z({\phi_1},{\phi_2})} \right]} \right].
\end{align}
\begin{align}
\dfrac{{\partial {\phi _2}}}{{\partial \hat{t}}} & =
\dfrac{1}{{P{e_2}}}\dfrac{\partial }{{\partial
\hat{z}}}\left[\vphantom{\left(\dfrac{{P{e_2}}}{{P{e_1}}}\right)}{(1 - {\phi_1} - {\phi_2})} \right.\notag\\ & \quad \left. \left[
{{\left( {\dfrac{{P{e_1}}}{{P{e_2}}}} \right)}^3}\left[
{\dfrac{{{\phi_1}{\phi_2}{K_{21}}({\phi_1},{\phi_2}) +
\dfrac{9}{4}\left( {\dfrac{{P{e_2}}}{{P{e_1}}}}
\right){\phi_1}{\phi_2}(1 -
{\phi_2}){K_P}({\phi_1},{\phi_2})}}{{\left( {{\phi_1} +
{{\left( {\dfrac{{P{e_1}}}{{P{e_2}}}}
\right)}^3}{\phi_2}\dfrac{{\partial {\mu_2}/\partial
\hat{z}}}{{\partial {\mu_1}/\partial \hat{z}}}} \right)}}}
\right]\right.\right. \notag\\ &\quad + \left.\left.
\dfrac{{{\phi_2}{K_{22}}({\phi_1},{\phi_2})}}{{\left(
{{{\left( {\dfrac{{P{e_2}}}{{P{e_1}}}}
\right)}^3}{\phi_1}\dfrac{{\partial {\mu_1}/\partial
\hat{z}}}{{\partial {\mu_2}/\partial \hat{z}}} + {\phi_2}}
\right)}} \right]\right. \notag\\ & \quad \left. {\; \dfrac{\partial
}{{\partial \hat{z}}}\left[ {\left( {{{\left(
{\dfrac{{P{e_2}}}{{P{e_1}}}} \right)}^3}{\phi_1} +
{\phi_2}} \right)Z({\phi_1},{\phi_2})} \right]} \right].
\end{align}
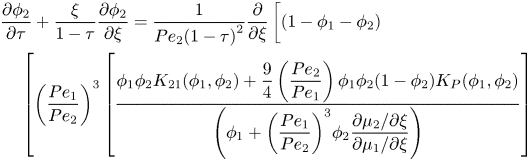
A key observation is that the only dimensionless groups appearing in (3.1) and (3.2) are  $P{e_1}$ and $P{e_2}$ i.e. no further dimensionless groups appear due to diffusiophoresis, as would be expected from dimensional analysis.
3.2. Coordinate transform
In order to create a static top boundary, the conservation equations are transformed using  $\xi = \hat{z}/(1 - \hat{t})$ and $\tau = \hat{t}$. This results in
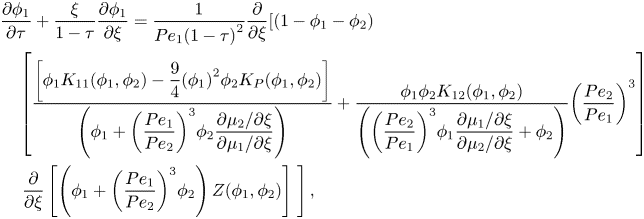 \begin{align}
& \dfrac{{\partial {\phi _1}}}{{\partial \tau }} +
\dfrac{\xi }{{1 - \tau }}\dfrac{{\partial {\phi
_1}}}{{\partial \xi }} = \dfrac{1}{{P{e_1}{{(1 - \tau
)}^2}}}\dfrac{\partial }{{\partial \xi }}[{(1 - {\phi_1} -
{\phi_2})} \notag\\ & \quad \left[ {\dfrac{{\left[
{{\phi_1}{K_{11}}({\phi_1},{\phi_2}) -
\dfrac{9}{4}{{({\phi_1})}^2}{\phi_2}{K_P}({\phi_1},{\phi_2})}
\right]}}{{\left( {{\phi_1} + {{\left(
{\dfrac{{P{e_1}}}{{P{e_2}}}}
\right)}^3}{\phi_2}\dfrac{{\partial {\mu_2}/\partial \xi
}}{{\partial {\mu_1}/\partial \xi }}} \right)}} +
\dfrac{{{\phi_1}{\phi_2}{K_{12}}({\phi_1},{\phi_2})}}{{\left(
{{{\left( {\dfrac{{P{e_2}}}{{P{e_1}}}}
\right)}^3}{\phi_1}\dfrac{{\partial {\mu_1}/\partial \xi
}}{{\partial {\mu_2}/\partial \xi }} + {\phi_2}}
\right)}}{{\left( {\dfrac{{P{e_2}}}{{P{e_1}}}} \right)}^3}}
\right]\notag\\ & \quad \left. {\dfrac{\partial }{{\partial \xi
}}\left[ {\left( {{\phi_1} + {{\left(
{\dfrac{{P{e_1}}}{{P{e_2}}}} \right)}^3}{\phi_2}}
\right)Z({\phi_1},{\phi_2})} \right]\; } \right],
\end{align}
\begin{align}
& \dfrac{{\partial {\phi _1}}}{{\partial \tau }} +
\dfrac{\xi }{{1 - \tau }}\dfrac{{\partial {\phi
_1}}}{{\partial \xi }} = \dfrac{1}{{P{e_1}{{(1 - \tau
)}^2}}}\dfrac{\partial }{{\partial \xi }}[{(1 - {\phi_1} -
{\phi_2})} \notag\\ & \quad \left[ {\dfrac{{\left[
{{\phi_1}{K_{11}}({\phi_1},{\phi_2}) -
\dfrac{9}{4}{{({\phi_1})}^2}{\phi_2}{K_P}({\phi_1},{\phi_2})}
\right]}}{{\left( {{\phi_1} + {{\left(
{\dfrac{{P{e_1}}}{{P{e_2}}}}
\right)}^3}{\phi_2}\dfrac{{\partial {\mu_2}/\partial \xi
}}{{\partial {\mu_1}/\partial \xi }}} \right)}} +
\dfrac{{{\phi_1}{\phi_2}{K_{12}}({\phi_1},{\phi_2})}}{{\left(
{{{\left( {\dfrac{{P{e_2}}}{{P{e_1}}}}
\right)}^3}{\phi_1}\dfrac{{\partial {\mu_1}/\partial \xi
}}{{\partial {\mu_2}/\partial \xi }} + {\phi_2}}
\right)}}{{\left( {\dfrac{{P{e_2}}}{{P{e_1}}}} \right)}^3}}
\right]\notag\\ & \quad \left. {\dfrac{\partial }{{\partial \xi
}}\left[ {\left( {{\phi_1} + {{\left(
{\dfrac{{P{e_1}}}{{P{e_2}}}} \right)}^3}{\phi_2}}
\right)Z({\phi_1},{\phi_2})} \right]\; } \right],
\end{align}and
 \begin{align}&
\dfrac{{\partial {\phi _2}}}{{\partial \tau }} + \dfrac{\xi
}{{1 - \tau }}\dfrac{{\partial {\phi _2}}}{{\partial \xi }}
= \dfrac{1}{{P{e_2}{{(1 - \tau )}^2}}}\dfrac{\partial
}{{\partial \xi }}\left[\vphantom{\left(\dfrac{{P{e_2}}}{{P{e_1}}}\right)}{(1 - {\phi_1} -{\phi_2})} \right. \notag\\ &\quad\left.
\left[ {{\left( {\dfrac{{P{e_1}}}{{P{e_2}}}}
\right)}^3}\left[
{\dfrac{{{\phi_1}{\phi_2}{K_{21}}({\phi_1},{\phi_2}) +
\dfrac{9}{4}\left( {\dfrac{{P{e_2}}}{{P{e_1}}}}
\right){\phi_1}{\phi_2}(1 -
{\phi_2}){K_P}({\phi_1},{\phi_2})}}{{\left( {{\phi_1} +
{{\left( {\dfrac{{P{e_1}}}{{P{e_2}}}}
\right)}^3}{\phi_2}\dfrac{{\partial {\mu_2}/\partial \xi
}}{{\partial {\mu_1}/\partial \xi }}} \right)}}} \right]\right.\right. \notag\\ &\quad + \left. \left.
\dfrac{{{\phi_2}{K_{22}}({\phi_1},{\phi_2})}}{{\left(
{{{\left( {\dfrac{{P{e_2}}}{{P{e_1}}}}
\right)}^3}{\phi_1}\dfrac{{\partial {\mu_1}/\partial \xi
}}{{\partial {\mu_2}/\partial \xi }} + {\phi_2}} \right)}}
\right]\right. \notag\\ & \quad \left. {\; \dfrac{\partial }{{\partial
\xi }}\left[ {\left( {{{\left( {\dfrac{{P{e_2}}}{{P{e_1}}}}
\right)}^3}{\phi_1} + {\phi_2}}
\right)Z({\phi_1},{\phi_2})} \right]} \right].
\end{align}
\begin{align}&
\dfrac{{\partial {\phi _2}}}{{\partial \tau }} + \dfrac{\xi
}{{1 - \tau }}\dfrac{{\partial {\phi _2}}}{{\partial \xi }}
= \dfrac{1}{{P{e_2}{{(1 - \tau )}^2}}}\dfrac{\partial
}{{\partial \xi }}\left[\vphantom{\left(\dfrac{{P{e_2}}}{{P{e_1}}}\right)}{(1 - {\phi_1} -{\phi_2})} \right. \notag\\ &\quad\left.
\left[ {{\left( {\dfrac{{P{e_1}}}{{P{e_2}}}}
\right)}^3}\left[
{\dfrac{{{\phi_1}{\phi_2}{K_{21}}({\phi_1},{\phi_2}) +
\dfrac{9}{4}\left( {\dfrac{{P{e_2}}}{{P{e_1}}}}
\right){\phi_1}{\phi_2}(1 -
{\phi_2}){K_P}({\phi_1},{\phi_2})}}{{\left( {{\phi_1} +
{{\left( {\dfrac{{P{e_1}}}{{P{e_2}}}}
\right)}^3}{\phi_2}\dfrac{{\partial {\mu_2}/\partial \xi
}}{{\partial {\mu_1}/\partial \xi }}} \right)}}} \right]\right.\right. \notag\\ &\quad + \left. \left.
\dfrac{{{\phi_2}{K_{22}}({\phi_1},{\phi_2})}}{{\left(
{{{\left( {\dfrac{{P{e_2}}}{{P{e_1}}}}
\right)}^3}{\phi_1}\dfrac{{\partial {\mu_1}/\partial \xi
}}{{\partial {\mu_2}/\partial \xi }} + {\phi_2}} \right)}}
\right]\right. \notag\\ & \quad \left. {\; \dfrac{\partial }{{\partial
\xi }}\left[ {\left( {{{\left( {\dfrac{{P{e_2}}}{{P{e_1}}}}
\right)}^3}{\phi_1} + {\phi_2}}
\right)Z({\phi_1},{\phi_2})} \right]} \right].
\end{align}This is the coordinate transform that is classically used in solving problems with this geometry, as in Routh & Zimmerman (Reference Routh and Zimmerman2004), Trueman et al. (Reference Trueman, Lago Domingues, Emmett, Murray and Routh2012b) and Howard et al. (Reference Howard, Nikoubashman and Panagiotopoulos2017b). The boundary conditions are no flux of particles at both the top and bottom boundaries (see Section S1.1 of the SI). For the top boundary condition, the evaporation rate is assumed to be constant, as explained in § 2.2.
Setting  ${K_P}({\phi _1},{\phi _2}) = 0$ in (3.3)–(3.4) gives a system of PDEs to describe a diffusion-only model that neglects diffusiophoresis. This can be compared with the diffusion–diffusiophoresis model, with non-zero ${K_P}({\phi _1},{\phi _2})$, to observe the effect of diffusiophoresis. Discussion regarding satisfying the Onsager reciprocal relations with each model is provided in the SI, § S3.3.
3.3. Numerical method
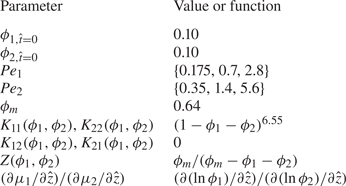
The system of (3.3)–(3.4) can be solved if  ${\phi _{1,t = 0}}$, ${\phi _{2,t = 0}}$, $P{e_1}$, $P{e_2}$ and the maximum volume fraction, ${\phi _m}$, which could be a function of ${\phi _1}$ and $\; {\phi _2}$, are specified. Appropriate forms of $K({\phi _1},{\phi _2})$ and $Z({\phi _1},{\phi _2})$ can be taken from the literature. Also needing to be specified is the ratio of the chemical potential gradients, as explained in § 2.3.
The compressibility is taken to be  $Z({\phi _1},{\phi _2}) = {\phi _m}{({\phi _m} - {\phi _1} - {\phi _2})^{ - 1}}$ (Trueman et al. Reference Trueman, Lago Domingues, Emmett, Murray and Routh2012b). The canonical concentrated extension of the dilute form of $K(\phi )$ for the one-component case, $1 - 6.55\phi $, is ${(1 - \phi )^{6.55}}$ (Russel et al. Reference Russel, Saville and Schowalter1989). For the two-component case, this is extended to ${K_{ij|i,j = 1\;\textrm{or}\;2}}({\phi _1},{\phi _2}) = {(1 - {\phi _1} - {\phi _2})^{6.55}}$ (Trueman et al. Reference Trueman, Lago Domingues, Emmett, Murray and Routh2012b). This is adopted for the example results in this work. The particle concentration up to which this is applicable is discussed in § S3.1 of the SI. It is shown in § S3.2 of the SI that the stratification results are minimally affected by how the form of K is extended.
A code was written in MATLAB to solve the PDEs numerically. The governing PDEs are of a similar form to diffusion–advection equations, where  $\xi /(1 - \tau )$ is the effective advection velocity, but the effective diffusion coefficient is a complicated function of ${\phi _1}$ and ${\phi _2}$. The PDEs are solved numerically using a finite volume method for the transformed diffusion term. This conserves mass by construction and is an appropriate choice for results containing sharp fronts. Due to the $\xi $-dependence of its coefficient, the quasi-convective term cannot be formulated using the finite volume method, so finite differences are employed instead. Since the $\partial \phi /\partial \xi $ term represents advection due to the stretching of the coordinate frame, this term is coded using backward finite differences. This ensures that information travels from upstream to downstream, avoiding potential stability issues that might result from using forward or central finite differences instead. The Euler method is used for time-stepping. The numerical results are verified by checking the final mass balance for each component, and by comparison with asymptotic solutions for high $Pe$ (§ 5).
4. Results and discussion
4.1. Diffusion
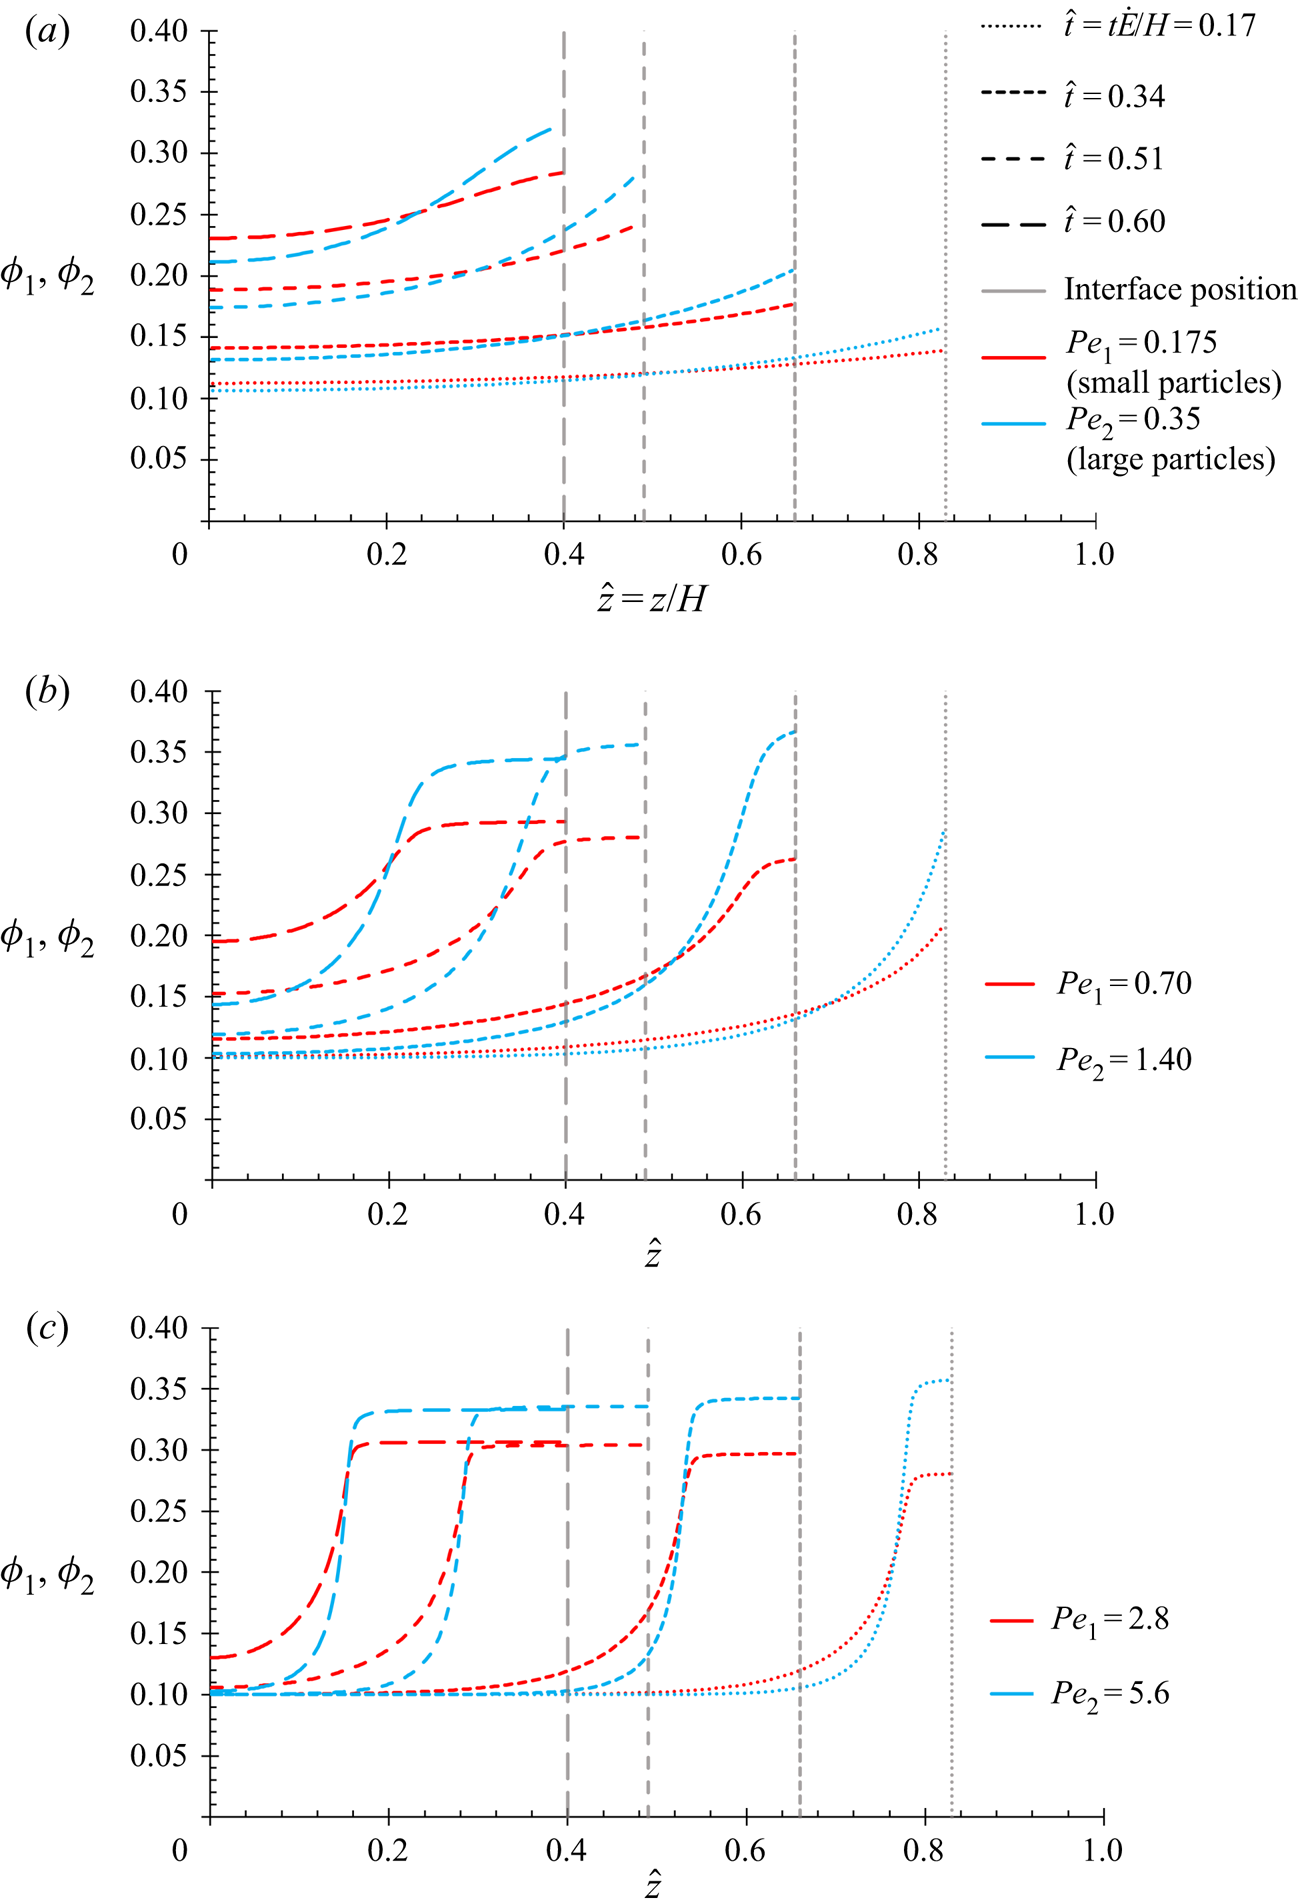
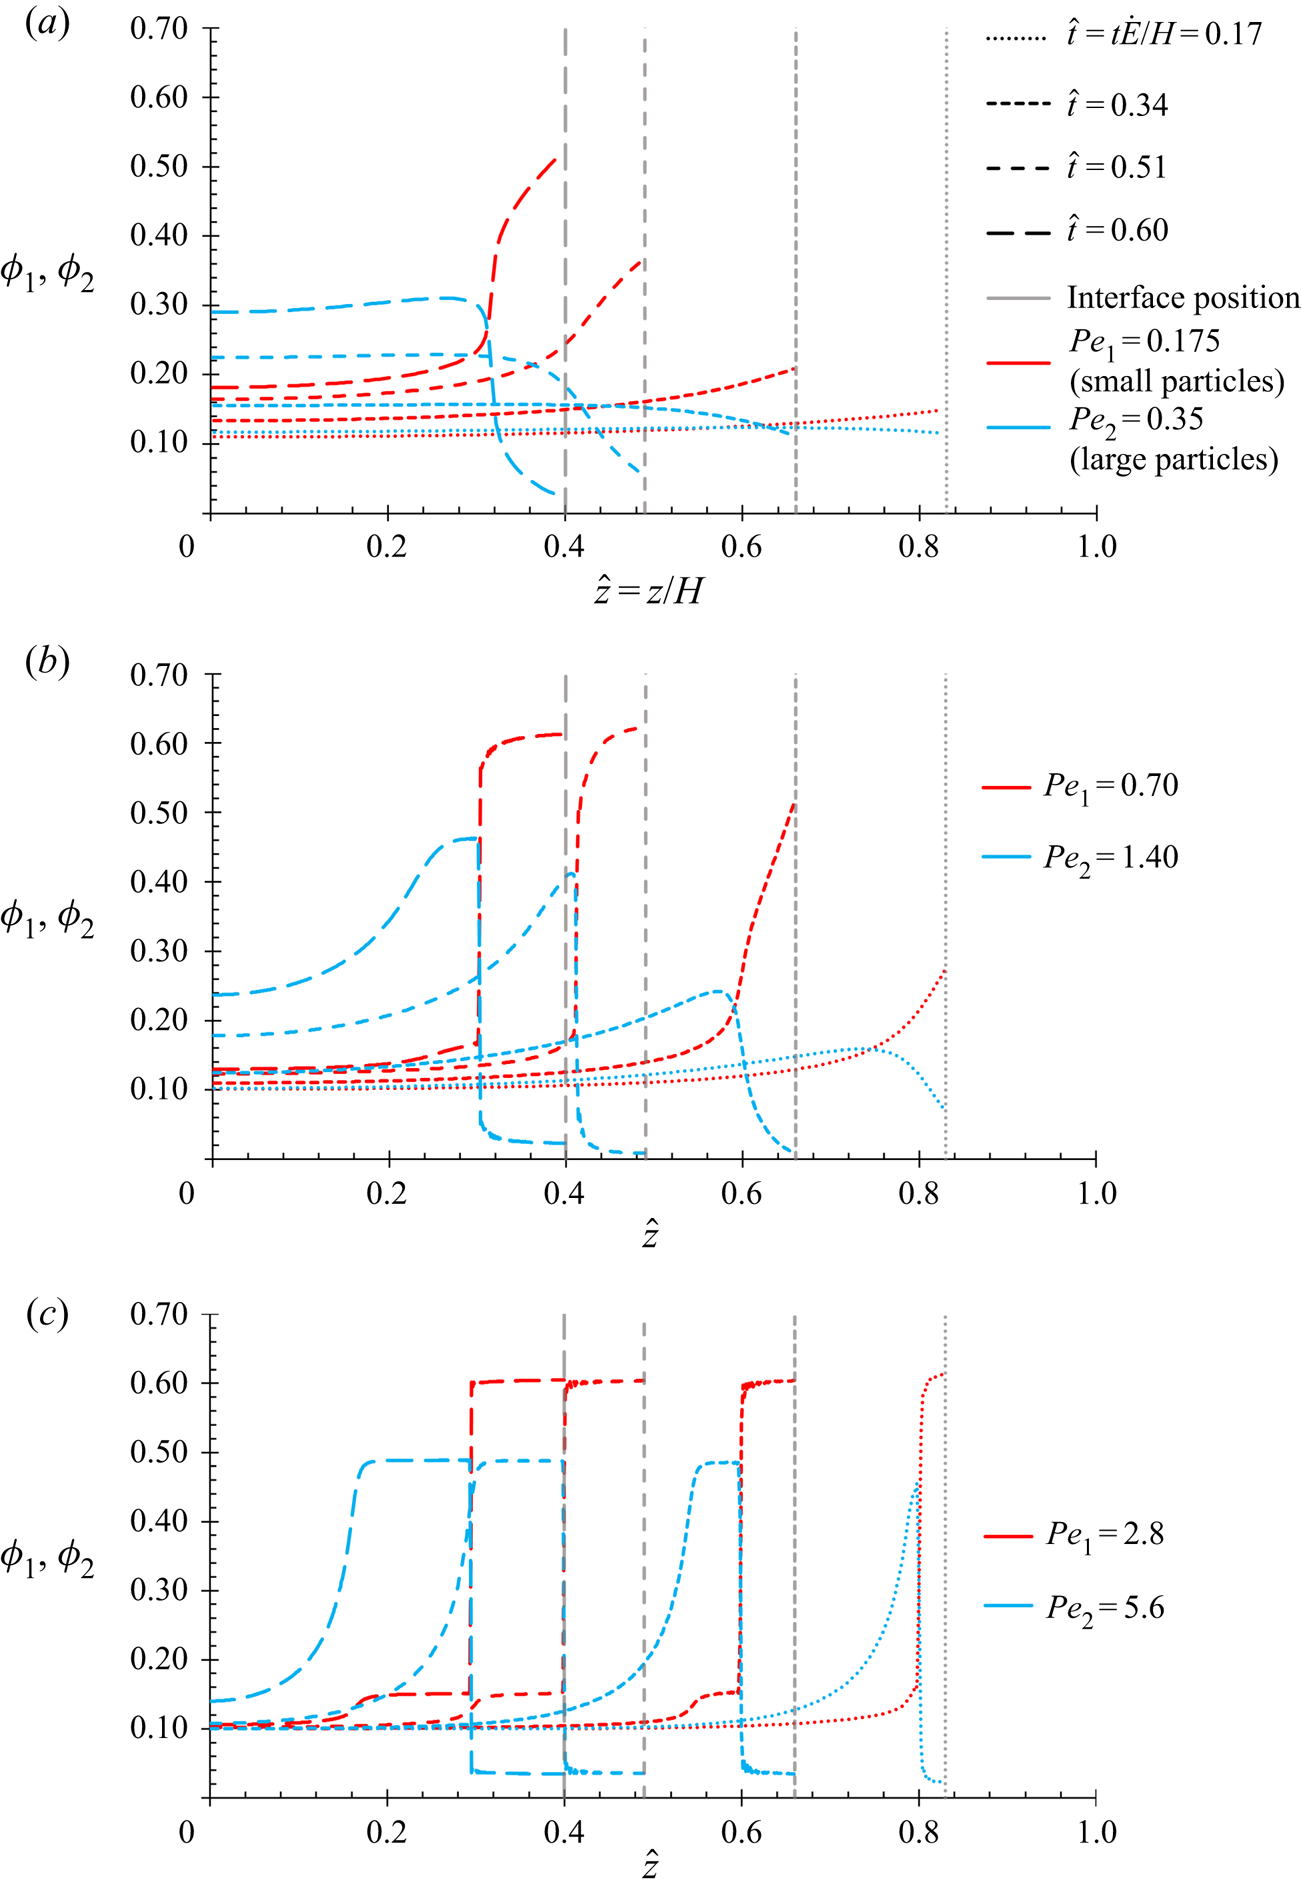
Figure 3 shows the diffusion-only model results for  $P{e_2}/P{e_1} = 2$, as the geometric mean of the Péclet numbers is increased from less than one, to one, to greater than one. The initial volume fractions are ${\phi _{1,\hat{t} = 0}} = {\phi _{2,\hat{t} = 0}} = 0.10$, and the maximum packing fraction is taken as ${\phi _m} = 0.64$, the value for randomly packed monodisperse spheres. Any drying film, regardless of its initial volume fraction, will go through higher concentrations in the course of drying. It is most interesting to show examples where the film is initially not too concentrated, since then there is time for the particles to rearrange themselves before movement becomes too hydrodynamically hindered. Hence why ${\phi _{1,\hat{t} = 0}} = {\phi _{2,\hat{t} = 0}} = 0.10$ is chosen for these examples. Drying an initially more concentrated film involves the same phenomena as starting from a more dilute film: what changes (when diffusiophoresis is included) is the proportions of the drying time when different phenomena are dominant (see § S4 in the SI). § S5 in the SI demonstrates that there is minimal effect on the stratification results as ${\phi _m}$ is varied. From a mass balance on the particles, the end of drying would be at ${\tau _f} = {\hat{t}_f} = 0.6875$.
Volume fraction of each component as a function of height for: (a)  $P{e_1} = 0.175$ and $P{e_2} = 0.35$. Large-on-top stratification is predicted, shown by the blue lines being above the red lines in the upper part of the film, as expected for a diffusion-only model; (b) $P{e_1} = 0.70$ and $P{e_2} = 1.40$. As the Péclet numbers now straddle one, there is a greater difference between the volume fractions of the two components at the top surface, compared with (a); (c) $P{e_1} = 2.8$ and $P{e_2} = 5.6$. Péclet numbers greater than one cause there to be a sharp transition in volume fraction between the lower and upper parts of the film. (a) $Pe_{1}$, $Pe_{2}< 1(Pe = 6{\rm \pi}\eta R\dot{E}H/kT)$, (b) $Pe_{1} < 1$, $Pe_{2} > 1$ and (c) $Pe_{1}$, $Pe_{2} > 1$.
The model allows input of any form of  ${K_{ij}}$. To run an example with numerical ease, and due to not being able to analytically derive the cross-terms for concentrated solution, ${K_{ij|i \ne j}}({\phi _1},{\phi _2}) = 0$ is used. The same model could be rerun with ${K_{12}}({\phi _1},{\phi _2})$, ${K_{21}}({\phi _1},{\phi _2}) \ne 0$, if desired. For example, ${K_{ij|i \ne j}}({\phi _1},{\phi _2}) = {(1 - {\phi _1} - {\phi _2})^{6.55}}$ would be expected to give similar results. This is because the fluxes for the cross-terms are small.
In addition to modifying for hydrodynamic hindrance via  $K({\phi _1},{\phi _2})$, the diffusion-only model, as run in these examples, also differs from that of Zhou et al. (Reference Zhou, Jiang and Doi2017) in the expressions used for the chemical potential: (i) not including the cross-interaction terms in the chemical potential expressions; and (ii) writing the chemical potentials via the osmotic pressure so that they are valid for concentrated solution. For the ratio of the chemical potential gradients, $(\partial {\mu _1}/\partial \hat{z})/(\partial {\mu _2}/\partial \hat{z})$, a non-interacting expression is chosen: $(\partial (\ln {\phi _1})/\partial \hat{z})/(\partial (\ln {\phi _2})/\partial \hat{z})$. Whilst this expression is chosen for these example numerical results, the model is general, and can be run with input of any form of $(\partial {\mu _1}/\partial \hat{z})/(\partial {\mu _2}/\partial \hat{z})$, for example, from different equations of state (EoS), including the Boublík–Mansoori—Carnahan—Starling–Leland EoS for hard sphere mixtures (Heyes & Santos Reference Heyes and Santos2016).
The parameter values used are collected in table 1. To give an idea of a physical system that could be represented with these Péclet numbers, Liu et al. (Reference Liu, Liu, Carr, Vazquez, Nykypanchuk, Majewski, Routh and Bhatia2018) estimated evaporation rates of  $\dot{E} = 2.0 \times {10^{ - 8}}\;\textrm{m}\;{\textrm{s}^{ - 1}}$ at $T = 296\;\textrm{K}$ and 60 % humidity. For a film of initial height $H = 1.0\;\textrm{mm}$, and a solvent of viscosity $\eta = 0.001\;\textrm{Pa}\;\textrm{s}$, particles of size {7.5, 15} nm would correspond to Péclet numbers of {0.7, 1.4}. Silica particles, for example, of this size can be readily obtained.
Parameter values used to obtain the example results.
The temporal and spatial resolutions, in  $(\xi = \hat{z}/(1 - \hat{t}),\tau = \hat{t})$ coordinates, are selected in order to give mass balance errors of $< 1\,\%$ in each component by near the end of drying. For example, figure 3(a) used $\Delta \xi = 0.01$ and $\Delta \tau = {10^{ - 8}}$, giving a mass balance error of 0.17% in ${\phi _1}$ and 0.42% in ${\phi _2}$ at $\tau = 0.683$. Increasing $Pe$ requires smaller $\Delta \xi $ in order to resolve the increasing sharpness of the curves, and correspondingly smaller $\Delta \tau $ for stability. It is checked that the change on further improving the resolution is acceptably small. For example, halving the $\Delta \xi $ used for figure 3(a) roughly halves the mass balance errors to 0.08% in ${\phi _1}$ and 0.21% in ${\phi _2}$. Halving the $\Delta \tau $ used in figure 3(a) produces a negligible change in the mass balance errors. The resolutions used to generate each figure are tabulated in § S1.3 of the SI.
4.1.1. Diffusion only
In figure 3, the films become more concentrated over time. The volume fraction profiles show the large particles stratifying to the top surface, as expected for a purely diffusional model: the diffusive flux of component one in (3.3) scales as  $1/P{e_1}$, whilst that of component two in (3.4) scales as $1/P{e_2}$.
In figure 3(a), since  $P{e_1},P{e_2} < 1$, the film remains fairly uniform over the course of drying, but with the film concentration increasing towards the top surface. As $\sqrt {P{e_1}P{e_2}} $ is increased from 0.25 (figure 3a) to 1.0 (figure 3b), the degree of stratification increases, and the concentration profiles sharpen. Increasing $\sqrt {P{e_1}P{e_2}} $ again from 1.0 (figure 3b) to 4.0 (figure 3c), further sharpens the profiles, starting to form a sharp transition between the volume fractions at the top and bottom of the film. This sharpening is due to slower diffusion relative to the evaporation rate, such that the lower parts of the film do not ‘see’ the effect of the evaporating top surface.
4.2. Diffusiophoresis
The same sets of parameters are run as in figure 3, but now with the addition of the diffusiophoresis term. The form used for  ${K_P}({\phi _1},{\phi _2})$ is taken as ${(1 - {\phi _1} - {\phi _2})^{6.55}}$, which is the same as for ${K_{ii}}({\phi _1},{\phi _2})$. The exact functional forms used for ${K_{ii}}({\phi _1},{\phi _2})$ and ${K_P}({\phi _1},{\phi _2})$ do not significantly impact the numerical results. Interestingly, if ${K_{ii}}({\phi _1},{\phi _2})$ and ${K_P}({\phi _1},{\phi _2})$ are equal, then the functional form does not affect the relative fluxes, which is the important factor when determining the importance of diffusiophoresis, relative to diffusion.
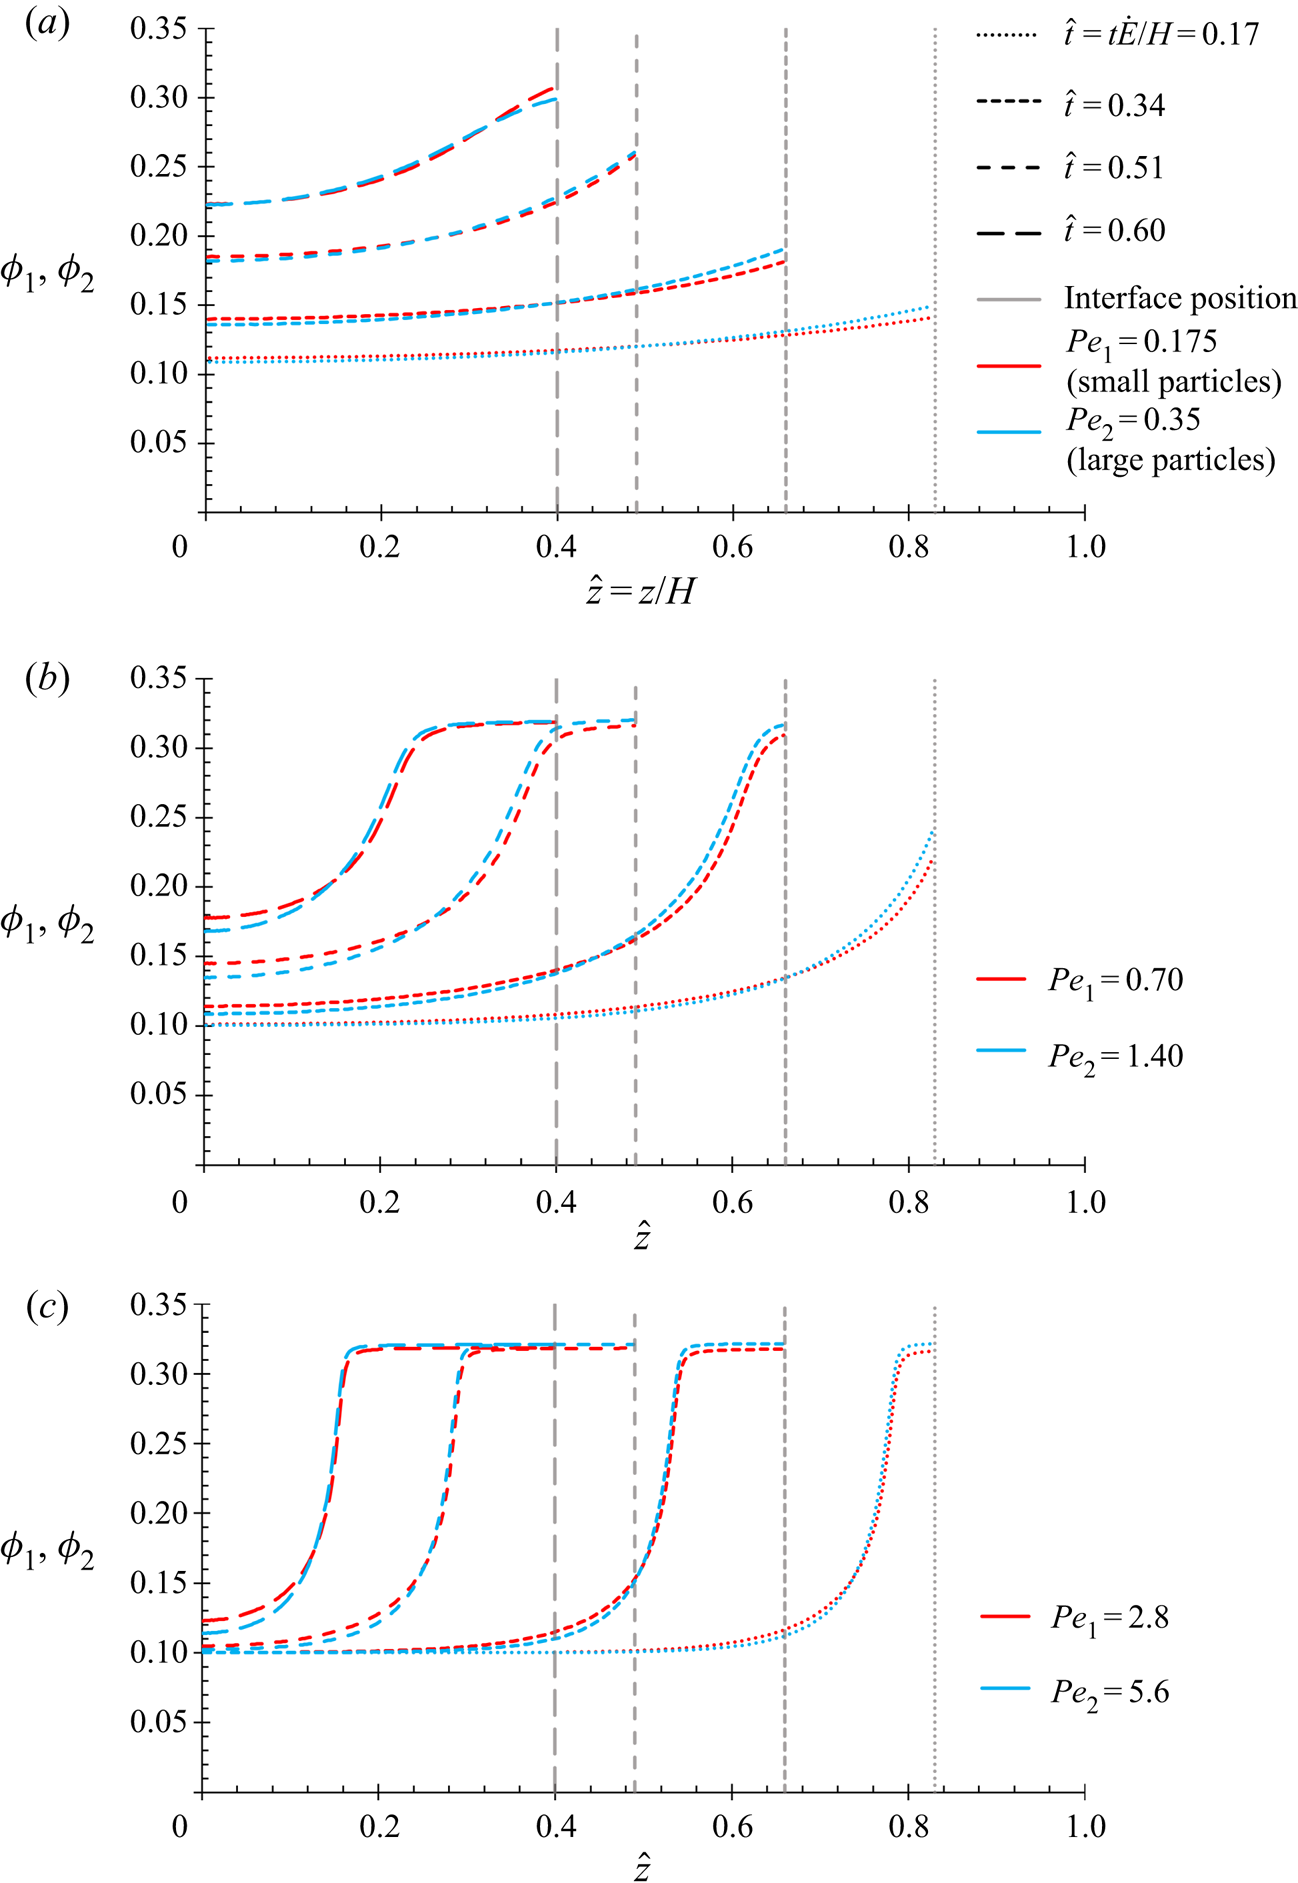
The resulting volume fraction profiles are shown in figure 4.
Volume fraction of each component as a function of height, predicted by the model including diffusiophoresis, for: (a)  $P{e_1} = 0.175$ and $P{e_2} = 0.35$. There is little difference between the red and the blue curves throughout drying, indicating that the film is nearly uniform in composition; (b) $P{e_1} = 0.7$ and $P{e_2} = 1.4$. The film profiles are sharper than in (a), due to the higher Péclet numbers, but there is still little stratification between the two components; (c) $P{e_1} = 2.8$ and $P{e_2} = 5.6$. As in (b), little stratification between the two components develops, although the film profiles are sharper than (b) due to the Péclet numbers being increased again. (a) $P{e_1},P{e_2} < 1(Pe = 6{\rm \pi}\eta R\dot{E}H/kT)$, (b) $P{e_1} < 1,P{e_2} > 1$ and (c) $P{e_1},P{e_2} > 1$.
4.2.1. Non-enhanced diffusiophoresis
In contrast to the diffusion-only results, at all  $Pe$ modelled, including diffusiophoresis results in the film being almost uniform in composition. By $\hat{t} = 0.60$, the films are now only slightly large-on-top stratified, with the exception of the film with low $Pe$ (figure 4a), which has just transitioned from slightly large-on-top stratified to slightly small-on-top stratified. As is discussed in § S4 of the SI, the films in figures 4(b) and 4(c) will also transition to slightly small-on-top stratified even later than the latest time shown on these graphs. These results therefore suggest that diffusiophoresis acts against large-on-top stratification, such that the effects of the diffusion and diffusiophoresis terms largely counteract each other. As in the diffusion-only case, increasing $\sqrt {P{e_1}P{e_2}} $ results in sharper profiles, as shown in figures 4(b) and 4(c).
4.2.2. Increased diffusiophoresis
To verify that it is diffusiophoresis in the model which is promoting small-on-top stratification, the model is run with an increased diffusiophoretic drift coefficient. From (2.25), this corresponds to a larger value of  ${R_{DP}}$, i.e. a larger excluded volume. For example, non-spherical particles, such as polymers, may be excluded from a distance equal to their radius of their gyration. The radius ${R_1}$ in this case would correspond to the radius of a sphere with the equivalent volume. The ratio ${R_{DP}}/{R_1}$ would therefore be expected to be greater than unity for a non-spherical particle. However, in order to accurately model non-spherical particles, the other parameters, ${K_{ij}}({\phi _1},{\phi _2})$ and $Z({\phi _1},{\phi _2})$, would also need adapting. As merely an example of increasing diffusiophoresis alone, results for the case ${R_{DP}}/{R_1} = {(4{\rm \pi}/3)^{1/2}}$ are shown in figure 5.
Volume fraction of each component as a function of height, predicted by the model including enhanced diffusiophoresis, for: (a)  $P{e_1} = 0.175$ and $P{e_2} = 0.35$. Small-on-top stratification develops over time, as seen by the increasing difference between the volume fractions of the two components at the top surface as $\hat{t}$ increases; (b) $P{e_1} = 0.7$ and $P{e_2} = 1.4$. Small-on-top stratification develops more rapidly than in (a), as can be seen by the greater distance between the red and blue lines at the top surface. This is due to the increase in the Péclet numbers; (c) $P{e_1} = 2.8$ and $P{e_2} = 5.6$. Significant stratification between the two components develops rapidly, as can be seen from the large volume fraction difference at the top surface at $\hat{t} = 0.17$. The depth of the layer enriched in small particles at the top surface grows over time. (a) $P{e_1},P{e_2} < 1(Pe = 6{\rm \pi}\eta R\dot{E}H/kT)$, (b) $P{e_1} < 1,P{e_2} > 1$ and (c) $P{e_1},P{e_2} > 1$.
At small Pe (figure 5a), the stratification increases over time, as small particles accumulate at the top surface. As the  $Pe$ numbers are increased (figure 5b), the stratification develops at a greater rate, until the top surface is almost entirely small particles. At large $Pe$ numbers ( $P{e_1}$, $P{e_2} > 1$, figure 5c), a thin layer of small particles at the top surface rapidly develops at early drying times. The thickness of this layer grows over time. Directly beneath this layer, ${\phi _1}$ falls sharply to a much smaller value (~0.15), as ${\phi _2}$, at ~0.49, dominates this region of this film. Over the lower region of the film, where the effect of evaporation from the top surface is yet to significantly manifest, the volume fractions of both components fall to their initial values.
Continuing this present model to the end of drying predicts a film of two regions: an upper layer of almost entirely small particles, at an approximately constant concentration, and a lower layer with a majority of large particles, at an approximately constant concentration. A drawback of these results is that the form of  ${K_{ii}}$ used allows particle rearrangement within the close-packed region (SI, § S3.1). This, numerically, allows the layer of small particles to grow into the close-packed region beneath it. However, physically, such a degree of rearrangement is unlikely.
4.2.3. Key mechanism
The results can be understood by considering the scaling of (3.3) and (3.4). The diffusiophoretic flux of component two has an extra order of  $({\phi _1},{\phi _2})$ in its coefficient, compared with the diffusive flux of component two, which is only just compensated for by the prefactors $(P{e_2}/P{e_1})$ and $9/4$. Hence the results for hard spheres with diffusiophoresis in figure 4 show minimal stratification. Noting this concentration dependence of the relative importance of diffusiophoresis, in the SI, § S4, the effect of varying the initial concentration on the film structure is presented.
For figure 5, the ratio  ${R_{DP}}/{R_1}$ can be considered as a geometric factor, relating the excluded distance of the small particles around the large particles, to the radius of the small particles. With the value of ${R_{DP}}/{R_1}$ adopted for this figure, the extra order of $({\phi _1},{\phi _2})$ in the coefficients of the diffusiophoretic flux of component two is more than compensated for by its other coefficients. This is sufficient to make the magnitude of the total diffusive and diffusiophoretic flux of component two greater than that of component one, resulting in small-on-top stratification. Note that the scaling of the ratio of the diffusiophoretic flux to the diffusive flux of component two increases with ${\phi _2}$. Hence just beneath the front of small particles, where ${\phi _2}$ is at its largest value in the film, there is a strong driving force for more small particles to travel to the top surface. This is seen most clearly in figure 5(c).
To illustrate the relative magnitudes of the different fluxes across the film, figure 6 is plotted. The fluxes are plotted against  $\hat{z}$ for $P{e_1} = \; 0.7$ and $P{e_2} = 1.4$, so the flux profiles can be compared against the concentration profiles given in figures 4(b) and 5(b). An early time, $\hat{t} = 0.17$, when the profiles are forming, is chosen for this illustration. The cases with non-enhanced and enhanced diffusiophoresis are shown for comparison. In figure 6(a), the non-enhanced case, the total fluxes for components one and two are similar throughout the film, hence a nearly uniform film results in figure 4(b). The total flux for each component is in the negative $\hat{z}$-direction, consistent with the solvent evaporating from top surface. The magnitude of the diffusive flux of component one (the smaller particles) is larger than that of component two, despite the gradients being similar, since this is proportional to $1/Pe$.
Flux contributions from diffusion and diffusiophoresis, calculated using (3.3) and (3.4), for both components. Examples for  $P{e_1} = 0.7$ and $P{e_2} = 1.4$ at $\hat{t} = t\dot{E}/H = 0.17$ are shown, with (a) non-enhanced diffusiophoresis, as in figure 4(b), and (b) enhanced diffusiophoresis, as in figure 5(b).
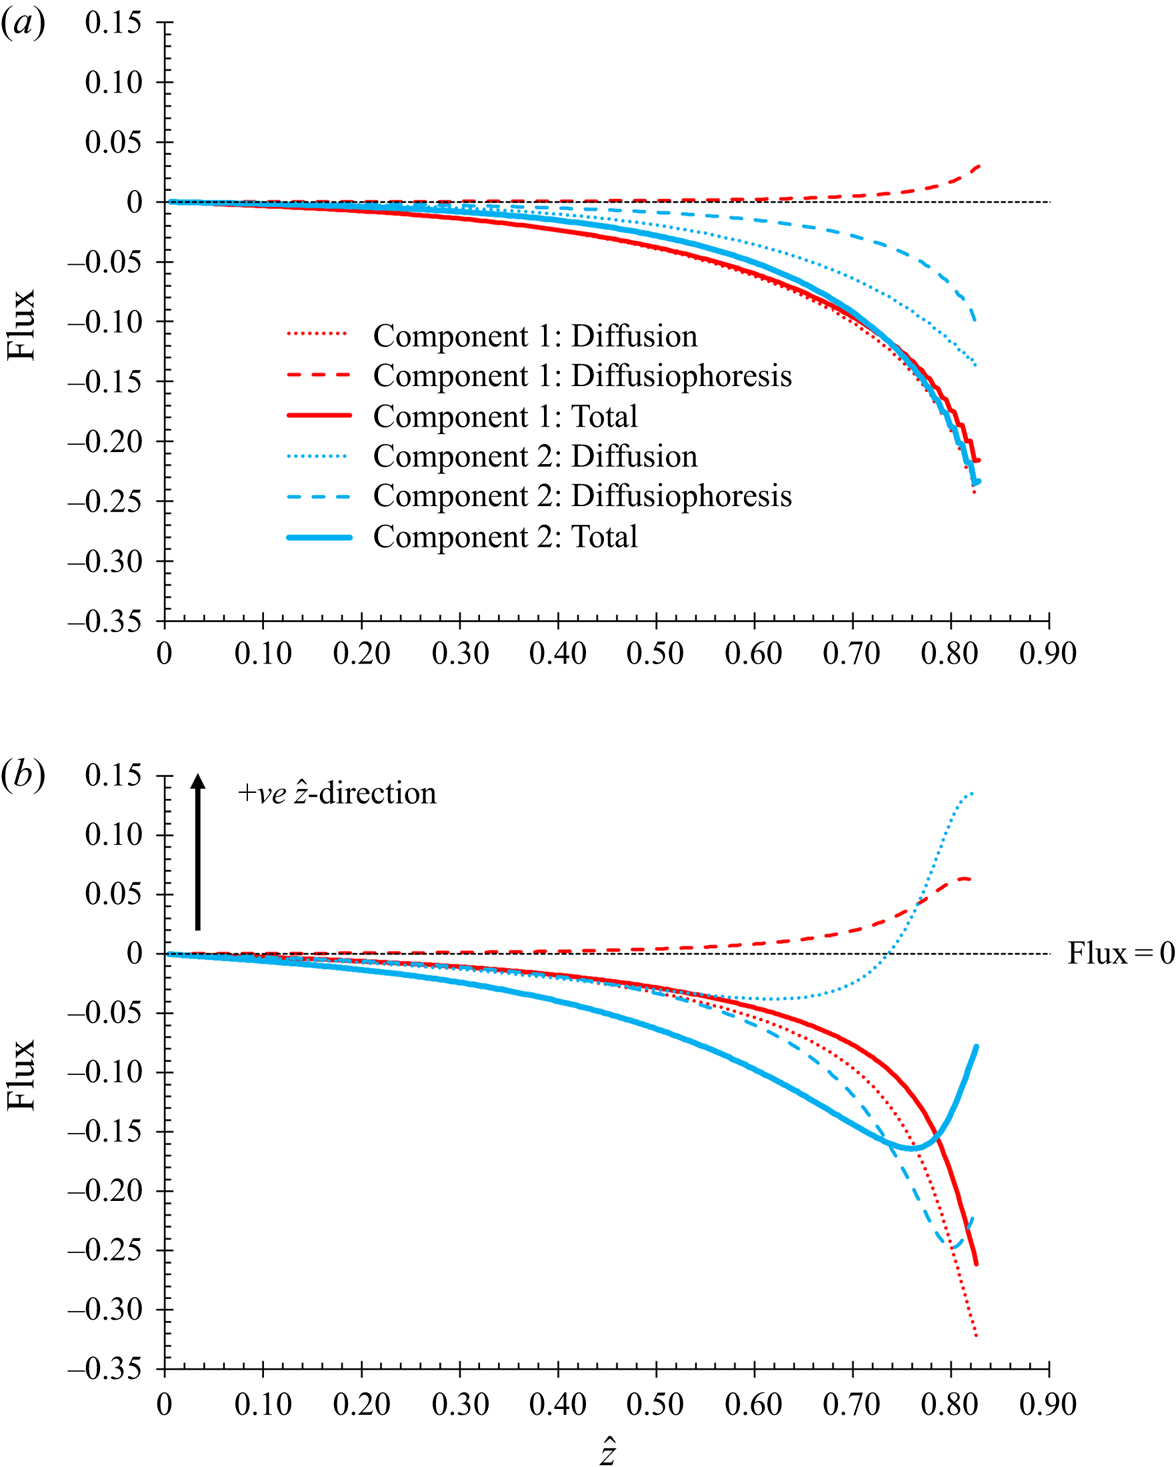
In figure 6(b), at the uppermost part of the film, which corresponds to the small particles-enriched section in figure 5(b), the magnitude of the total flux of component two is less than that of component one. These total fluxes are both in the negative  $\hat{z}$-direction. However, the mechanism that causes the layer of small particles to continue to build, occurs below this layer, where the magnitude of the total flux of component two is greater than that of component one. This change in the component with the greatest total flux is due to the maximum in the concentration profile of component two, which changes the direction of its diffusive flux. The large diffusiophoretic flux of component two and diffusive flux of component one are in the negative $\hat{z}$-direction, since these act down the concentration gradient of the component one particles. The component one flux labelled diffusiophoresis is backflow due to the diffusiophoretic flux of component two ((2.30) and (2.31)).
4.3. Scenario comparison
For ease of comparison, the results from figures 3–5 are summarised in figure 7. The degree of stratification, defined by (4.1), is plotted against the geometric mean of the component Péclet numbers at selected times throughout drying, for the diffusion-only, diffusiophoresis and enhanced diffusiophoresis cases.


There are different possible stratification measures that can be used, but the one below, similar to the average separation measure used by Tang et al. (Reference Tang, Grest and Cheng2018), is deemed to be appropriate here
 \begin{equation}\beta = 2\left[ {\frac{{{{\hat{z}}_1} - {{\hat{z}}_2}}}{{\hat{z}(H)}}} \right] = 2\left[ {\frac{{\mathop \smallint \nolimits_0^1 {\phi_1}\xi \,\textrm{d}\xi }}{{\mathop \smallint \nolimits_0^1 {\phi_1}\,\textrm{d}\xi }} - \frac{{\mathop \smallint \nolimits_0^1 {\phi_2}\xi \,\textrm{d}\xi }}{{\mathop \smallint \nolimits_0^1 {\phi_2}\,\textrm{d}\xi }}} \right],\end{equation}
where  ${\hat{z}_1}$ denotes the average position of particles of component one up the scaled height of the film. Hence ${\hat{z}_1} - {\hat{z}_2}$ is a measure of the average vertical distance between component one and component two particles in the film. This is normalised by the height of the film at the end of drying, $\hat{z}(H) = (1 - {\hat{t}_f}) = (1 - {\tau _f})$, in order to be able to compare different close-packing fractions (§ S5). The scaling factor of 2 is included such that $\beta $ varies between −1 (a layer of large particles on top of a layer of small particles) and +1 (vice versa) in the final dried film, beginning from equal concentrations.
From the summary figure, it can be clearly seen that the diffusion-only model leads to large-on-top stratification, whilst adding diffusiophoresis promotes  $\beta $ in the direction of small-on-top. In the diffusion-only and enhanced diffusiophoresis cases, the greatest magnitudes of $\beta $ are reached as the Péclet numbers straddle one, and $\beta $ increases with time. The non-enhanced diffusiophoresis results remain negligibly stratified throughout.
4.4. Model discussion
4.4.1. Effect of cross-interactions
Similarly to figure 5, Howard et al. (Reference Howard, Nikoubashman and Panagiotopoulos2017a) obtain a growing layer of small particles, although they did not run both  $P{e_1},P{e_2} < \; 1$. The particle size ratios explored by Howard et al., $P{e_2}/P{e_1} = \{ 4,6,8\} $, were larger than the $P{e_2}/P{e_1} = 2$ studied here, but based on scaling arguments, similar trends would be expected. Howard et al. found faster rate of growth of the layer of small particles at higher $P{e_2}/P{e_1}$, and that would also be found from this model. Fortini et al. (Reference Fortini, Martín-Fabiani, De La Haye, Dugas, Lansalot, D'Agosto, Bourgeat-Lami, Keddie and Sear2016) obtain a growing layer of small particles, although they only present simulations for $P{e_2}/P{e_1} = 7$. The large Péclet numbers tested may explain why they predicted such a sharp stratification.
Whilst the work of Howard et al. and Fortini et al. give similar small-on-top stratification to figure 5 with enhanced diffusiophoresis, they differ from the approximately uniform films predicted in figure 4, for hard spheres. The work of Zhou et al. (Reference Zhou, Jiang and Doi2017) demonstrates that cross-interaction terms alone, in the absence of diffusiophoresis, can also give rise to small-on-top stratification. Note also that Howard et al. (Reference Howard, Nikoubashman and Panagiotopoulos2017a,Reference Howard, Nikoubashman and Panagiotopoulosb) use models accurate to higher order, and in doing so account for cross-interaction terms. Since their models combine these EoS with diffusiophoresis, it suggests that both diffusiophoresis and cross-interaction terms contribute to small-on-top stratification. From figure 4, which did not include cross-interaction terms, in order to see the effect of diffusiophoresis separately, diffusiophoresis alone seems not to be sufficient to give rise to significant small-on-top stratification. Figure 5 suggests that in cases with enhanced volume exclusion, diffusiophoresis can cause small-on-top stratification in the absence of cross-interactions. Cross-interaction terms could be incorporated into this model by using (1.1) to form an expression for  $(\partial {\mu _1}/\partial \hat{z})/(\partial {\mu _2}/\partial \hat{z})$, to replace the example in table 1 which only includes entropy.
Further comparing these results with the work of Zhou et al. (Reference Zhou, Jiang and Doi2017), the term in the Zhou et al. model which is responsible for the small-on-top stratification is the cross-interaction term; diffusiophoresis could also be thought of as a cross-interaction term. Zhou et al. argue that the flux of large particles due to the cross-interaction term must be greater than the flux due to diffusion of the large particles down their own concentration gradient, in order to observe small-on-top stratification. A more general explanation of the condition, applicable to this diffusiophoresis model also, would be that the cross-interaction term must be sufficiently large to make the total flux of the large particles exceed that of the small particles. Zhou et al.'s cross-interaction term disproportionately affected the flux of the larger particles, and that is also the case with the diffusiophoresis term in this model.
One similarity between this model and the Langevin dynamics simulations of Fortini et al. (Reference Fortini, Martín-Fabiani, De La Haye, Dugas, Lansalot, D'Agosto, Bourgeat-Lami, Keddie and Sear2016) and Howard et al. (Reference Howard, Nikoubashman and Panagiotopoulos2017a) is that diffusiophoresis results from a short-range repulsive interaction between the two particle types, whilst Fortini et al. use the Yukawa interaction, and Howard et al. adopt the Weeks–Chandler–Andersen potential. As explained in § 2.4, an alternative approach to adding diffusiophoresis to the diffusion model in (2.13) would be to include the exclusion potential in the chemical potential term.
4.4.2. Finite large particle  ${\boldsymbol{R}}_{2}$ size effects

Note also that the diffusiophoresis term is idealised, assuming infinite size ratio between the two particle sizes, yet is it being used to model a finite size ratio (Sear & Warren Reference Sear and Warren2017). The results in figure 4 therefore give an upper bound for the predicted effect of diffusiophoresis. This is because the surface of a component two particle of finite radius will not all be able to get as close to the surface of a component one particle, compared with the case of infinite-sized component two particles. Whilst this upper bound will provide insight into the importance of diffusiophoresis, and it is likely to be most important when  ${R_2} \gg {R_1}$, an improved model would include the ${R_2}$-dependence for the case where ${R_2}$ is finite. In this work, $P{e_2}/P{e_1} = 2$ was run as an example. The model can be run with a larger size ratio, such as $P{e_2}/P{e_1} = 10$, in which case the infinite size ratio assumption becomes more accurate, as long as the dispersion remains colloidally stable.
There are various approaches to correcting the model for when  ${R_2}$ is finite. The simplest correction is that by Anderson, Lowell & Prieve (Reference Anderson, Lowell and Prieve1982), which still models the small particles as a solute in a fluid but corrects the geometry to include the finite size of ${R_2}$. Including the correction term to first order in $P{e_1}/P{e_2}$ results in the diffusiophoretic velocity being $2/3$ of that given in (2.24). This suggests the order of magnitude of the error that is introduced from using the Asakura–Oosawa model. Brady (Reference Brady2011) derives equations for a colloidal system that no longer requires the small particles to be much smaller than the large ones, showing that the continuum and colloidal approaches agree in the limit where this requirement is satisfied. Whilst being valid for any particle size ratio, Brady notes that the approach is analytically limited to dilute solution. Marbach, Yoshida & Bocquet (Reference Marbach, Yoshida and Bocquet2020) derive a similar expression to Brady, by considering Stokes flow around a large particle and the force-free particle condition for diffusiophoretic motion. In addition, for the case of finite particle size ratio, the present model could be improved to accurately model the remaining excluded volume/diffusiophoresis effects. Besides small particles being excluded from large particles (small–large), there are also large–large, small–small and large–small exclusions to consider.
4.4.3. Other model comments
Other possible improvements to the model include making  ${\phi _m}$ a function of $P{e_2}/P{e_1}$, ${\phi _1}$ and ${\phi _2}$, to model how particles of two different sizes pack. The deviation from ${\phi _m} = 0.64$ will be more significant as $P{e_2}/P{e_1}$ is increased, but assuming a constant value should be a reasonable approximation for $P{e_2}/P{e_1} = 2$, as in figures 3–5.
The dilute limit of the equations can be inferred by construction of the model: the leading order of the diffusion velocities is just  $- (kT/6{\rm \pi}\eta {R_i}){K_{ii}}\boldsymbol{\nabla }\ln {\phi _i}$, and the leading order of the diffusiophoretic drift velocity for the large particles is $- (3{\phi _1}kT/8{\rm \pi}\eta {R_1}){K_P}\boldsymbol{\nabla }\ln {\phi _1}$.
5. Asymptotic solution for large $Pe$

As  $P{e_1}$ and $P{e_2}$ are increased, the shapes of the curves appear to attain a sharp transition front with constant shape. This suggests that an asymptotic solution could be sought in the regime of high $P{e_1}$ and $P{e_2}$, with $P{e_2} > P{e_1}$. Physically, this corresponds to a film dried with a fast evaporation rate, such that the diffusive processes do not have time to flatten the shape of the transition front. The method of Russel et al. (Reference Russel, Saville and Schowalter1989), for one particle type, also adopted by Trueman et al. (Reference Trueman, Lago Domingues, Emmett, Murray and Routh2012b) for two particle types, is followed.
It is expected that the total particle volume fraction at the top of the film will be  ${\phi _m}$, as fast evaporation will lead to this being quickly obtained, whilst the volume fractions at the bottom of the film will be ${\phi _1}(\tau = \hat{t} = 0)$ and ${\phi _2}(\tau = 0)$. As the Péclet numbers are increased, there will be a sharper transition between these values. The position of this transition is denoted as $P(\tau )$.
The method is outlined here, with further details given in § S2 of the SI. The general strategy is to use the change of variable  $X = [\xi - P(\tau )]P{e_2}$ to expand the region around the transition. In the case of the diffusion-only model, there is only one transition front, so the solution method is that found in the supplementary material of Trueman et al. (Reference Trueman, Lago Domingues, Emmett, Murray and Routh2012b), but with the governing hydrodynamics equations corrected. In the case of the diffusion–diffusiophoresis model with strong diffusiophoresis, a second transition appears, which complicates the solution, as will be outlined in § 5.2.
To leading order in  $P{e_2}$, the PDEs in (3.3)–(3.4) reduce to ordinary differential equations (ODEs) for $\textrm{d}{\phi _1}/\textrm{d}X$ and $\textrm{d}{\phi _2}/\textrm{d}X$, describing the shape of the transition front. The position of the front $P(\tau )$ is found from integrating the ODEs across the discontinuity from $X ={-} \infty $ to $X = \infty $ and summing
 \begin{equation}P(\tau ) = \frac{{1 - \frac{{{\phi _m}}}{{{\phi _m} - ({\phi _{1,\tau = 0}} + {\phi _{2,\tau = 0}})}}\tau }}{{1 - \tau }}.\end{equation}
This is the same result as for the one component case, and as would be obtained from a mass balance across the drying film, assuming a sharp discontinuity at  $P(\tau )$. Interestingly, it was necessary to assume large $P{e_1}$ as well as large $P{e_2}$, for the assumption of a sharp discontinuity in ${\phi _1}$ at $P(\tau )$ to be valid.
5.1. Diffusion
For the case where  ${K_{12}}({\phi _1},{\phi _2}) = {K_{21}}({\phi _1},{\phi _2}) = 0$ and the chemical potentials are just determined by entropy, $\textrm{d}{\mu _1}/\textrm{d}{\mu _2}\; = \textrm{d}\ln {\phi _1}/\textrm{d}\ln {\phi _2}$, and employing the limit where ${(P{e_2}/P{e_1})^3} \gg 1$, it is shown in the SI that there is a unique relation linking ${\phi _1}$ and ${\phi _2}$
 \begin{equation}\frac{{{\phi _1} - {\phi _{1,\tau = 0}}}}{{\frac{{{\phi _m}{\phi _{1,\tau = 0}}}}{{({\phi _{1,\tau = 0}} + {\phi _{2,\tau = 0}})}} - {\phi _{1,\tau = 0}}}} = {\left[ {\frac{{{\phi_2} - {\phi_{2,\tau = 0}}}}{{\frac{{{\phi_m}{\phi_{2,\tau = 0}}}}{{({\phi_{1,\tau = 0}} + {\phi_{2,\tau = 0}})}} - {\phi_{2,\tau = 0}}}}} \right]^{P{e_1}/P{e_2}}}.\end{equation}
This can be compared with numerical results. Note that (5.2) is independent of  ${K_{11}}({\phi _1},{\phi _2})$, ${K_{22}}({\phi _1},{\phi _2})$, $Z({\phi _1},{\phi _2})$ and $\tau $.
The result in (5.2) can be substituted into the expression for  $\textrm{d}{\phi _1}/\textrm{d}X$ and $\textrm{d}{\phi _2}/\textrm{d}X$, giving $X({\phi _1})$ or $X({\phi _2})$. For the boundary condition, we arbitrarily set $X = 0$ at $({\phi _{1,X = 0}} + {\phi _{2,X = 0}}) = [({\phi _{1,\tau = 0}} + {\phi _{2,\tau = 0}}) + ({\phi _{1,X \to \infty }} + {\phi _{2,X \to \infty }})]/2$. This sets the asymptotic coordinate system to be centred at the transition.
The resulting asymptotic solution for an example set of Péclet numbers is shown in figure 8. In the transition region, there is excellent agreement between the asymptotic and numerical solutions. This validates the numerical code used to generate figures 3–5. When  ${\phi _{1,\tau = 0}} = {\phi _{2,\tau = 0}}$, the asymptotic solution predicts that ${\phi _{1,X \to \infty }} = {\phi _{2,X \to \infty }}$ (SI). Whilst there is therefore disagreement in the values at the top surface, these do tend to the values given by the asymptotic solution over time. The small excess of large particles at the top surface, a diffusive effect, counterbalances the excess of small particles in the rest of the film (see (5.2)), to satisfy the mass balance.
Volume fraction of each component as a function of height for  $P{e_1} = 10$ and $P{e_2} = 20$, with ${\phi _{1,\hat{t} = 0}} = {\phi _{2,\hat{t} = 0}} = 0.10$ and ${\phi _m} = 0.64$. Both the numerical and asymptotic solutions are shown for comparison.
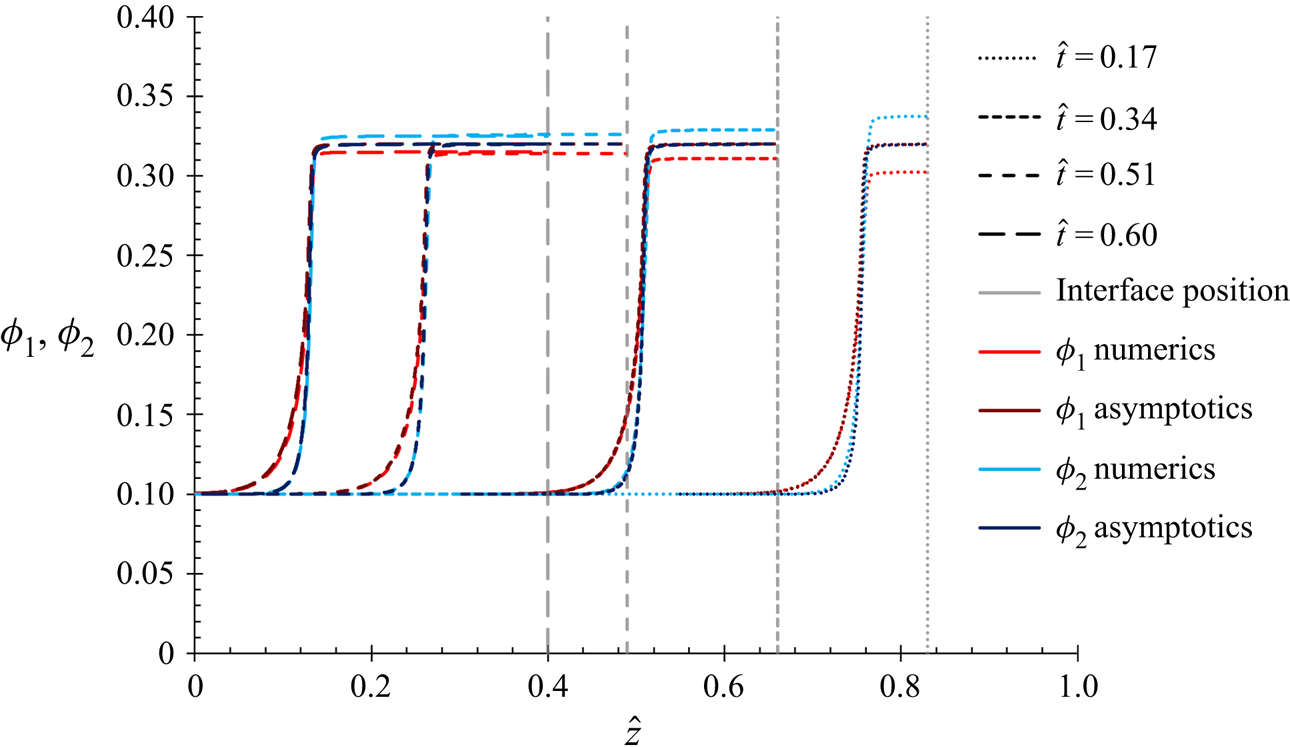
5.2. Diffusiophoresis
As for the diffusion-only results, the diffusiophoresis results at high  $P{e_1}$ and $P{e_2}$ appear to be curves of constant shape moving through the film. The numerical code is verified using the equations with enhanced diffusiophoresis. This is because the main purpose of this asymptotic solution is to specifically verify the coding of the diffusiophoresis term.
The approach to deriving the asymptotic solution for the non-enhanced diffusiophoresis case is very similar to that described in § 5.1. However, there are two key transitions in the curves for the enhanced diffusiophoresis case: The first is the position of the particle front i.e. the front of total volume fraction. This is denoted by  $P(\tau )$, as in the diffusion-only case. The second is between the region of constant high ${\phi _1}$ and low ${\phi _2}$ values and the region of constant high ${\phi _2}$ and low ${\phi _1}$. The position of this transition is denoted by $Q(\tau )$. The transitions are annotated on figure 9. This section seeks to construct an asymptotic solution for all parts of the film:
• the position of both transitions,
$P(\tau )$, as already described, and $Q(\tau )$;• the concentration profiles around
$P(\tau )$; and• the values of
${\phi _1}$ and ${\phi _2}$ either side of $Q(\tau )$.


The full derivation is shown in the SI from § S2.2. Briefly, the change of variable  $X = [\xi - P(\tau )]P{e_2}$ forms differential equations for $X({\phi _1},{\phi _2})$, which can be solved to give the profile in the film region around $P(\tau )$, from the bottom of the film up to just beneath $Q(\tau )$.
Volume fraction of each component as a function of height for  $P{e_1} = 10$ and $P{e_2} = 20$, with ${\phi _{1,\hat{t} = 0}} = {\phi _{2,\hat{t} = 0}} = 0.10$ and ${\phi _m} = 0.64$. Both the numerical and asymptotic solutions are shown for comparison. The model includes enhanced diffusiophoresis. The positions of $P(\tau )$ and $Q(\tau )$ at $\tau = 0.34$ are indicated as examples.

Unlike the diffusion case, in the limit  ${(P{e_2}/P{e_1})^3} \gg 1$, the ODEs cannot be approximated further. Since, from the numerical results, $\textrm{d}{\phi _2}/\textrm{d}{\phi _1}$ appears to be large, the product ${(P{e_1}/P{e_2})^3}{\phi _2}(\textrm{d}{\mu _2}/\textrm{d}X)/(\textrm{d}{\mu _1}/\textrm{d}X)$ cannot be neglected. For the same reason, it cannot be assumed that $|{(P{e_2}/P{e_1})^3}{\phi _1}(\textrm{d}{\mu _1}/\textrm{d}X)/(\textrm{d}{\mu _2}/\textrm{d}X)|\gg {\phi _2}$. For the case ${K_{12}}({\phi _1},{\phi _2}) = {K_{21}}({\phi _1},{\phi _2}) = 0$ and ${K_{11}}({\phi _1},{\phi _2}) = {K_{22}}({\phi _1},{\phi _2}) = {K_P}({\phi _1},{\phi _2})$, and no enthalpic contribution to the chemical potentials, $\textrm{d}{\mu _1}/\textrm{d}{\mu _2}\; = \textrm{d}\ln {\phi _1}/\textrm{d}\ln {\phi _2}$, equating the asymptotic expressions for $\textrm{d}{\phi _1}/\textrm{d}X$ and $\textrm{d}{\phi _2}/\textrm{d}X$ yields a quadratic in $\textrm{d}{\phi _1}/\textrm{d}{\phi _2}$. This equation is independent of ${K_{ij}}({\phi _1},{\phi _2})$, ${K_P}({\phi _1},{\phi _2})$, $Z({\phi _1},{\phi _2})$ and $\tau $. The quadratic equation can be solved for $\textrm{d}{\phi _1}/\textrm{d}{\phi _2}$. The resulting solution for $\textrm{d}{\phi _1}/\textrm{d}{\phi _2}$ is integrated numerically to give ${\phi _1}({\phi _2})$ around $P(\tau )$.
Finding the values of  ${\phi _1}$ and ${\phi _2}$ either side of the transition $Q(\tau )$ will provide a boundary condition for integrating $\textrm{d}{\phi _1}/\textrm{d}{\phi _2}$ around $P(\tau )$, as well as allowing the asymptotic solution for the upper part of the film to be constructed. The change of variable $Y = [\xi - Q(\tau )]P{e_2}$ is used to expand around this transition. It is assumed that $Q(\tau )$ takes the form
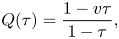 \begin{equation}Q(\tau ) = \frac{{1 - v\tau }}{{1 - \tau }},\end{equation}
which is a front travelling at constant speed v in  $(\hat{z},\; \hat{t})$ coordinates. The speed v at which $Q(\tau )$ travels can be found by integrating the equation for $\textrm{d}{\phi _1}/\textrm{d}Y$ or $\textrm{d}{\phi _2}/\textrm{d}Y$ across the transition (SI, S2.2.6). This is equivalent to a mass balance on ${\phi _1}$ or ${\phi _2}$ across $Q(\tau )$. Physically, both the diffusion and diffusiophoretic fluxes work to propel this front, changing $({\phi _1},{\phi _2})$ from the values on one side of the front to those on the other. Note that it is expected that $v < {\phi _m}/[{\phi _m} - ({\phi _{1,\tau = 0}} + {\phi _{2,\tau = 0}})]$, since $Q(\tau )$ is located higher in the film than $P(\tau )$.
The ODEs for  $\textrm{d}{\phi _1}/\textrm{d}Y$ and $\textrm{d}{\phi _2}/\textrm{d}Y$ can be integrated, and are combined for the case where ${K_{12}}({\phi _1},{\phi _2}) = {K_{21}}({\phi _1},{\phi _2}) = 0$, ${K_{11}}({\phi _1},{\phi _2}) = {K_{22}}({\phi _1},{\phi _2}) = {K_P}({\phi _1},{\phi _2})$ and the particle chemical potentials are purely entropic, $\textrm{d}{\mu _1}/\textrm{d}{\mu _2}\; = \textrm{d}\ln {\phi _1}/\textrm{d}\ln {\phi _2}$. In the upper region of the film, ${\phi _1} + {\phi _2} \approx {\phi _m}$. Substituting in ${\phi _2} = {\phi _m} - {\phi _1}$ gives a quadratic equation for the values of ${\phi _1}$ either side of $Q(\tau )$.
Using  ${K_{11}}({\phi _1},{\phi _2}) = {(1 - {\phi _1} - {\phi _2})^{6.55}}$ and $Z({\phi _1},{\phi _2}) = {\phi _m}{({\phi _m} - {\phi _1} - {\phi _2})^{ - 1}}$, figure 9 is obtained, which compares the resulting asymptotic solution with the numerical results. Figure 9 uses $P{e_1} = 10$ and $P{e_2} = 20$ i.e. the same parameters as figure 8, but now with the diffusiophoresis term included.
There is reasonably good agreement between the numerical and asymptotic solutions, although the asymptotic solution slightly overpredicts the sharpness of the transition around  $P(\tau )$. Using the numerical results for ${\phi _1}$ to reconstruct the ${\phi _2}$ curves with the asymptotic solution, and vice versa, gives excellent agreement. Therefore, the small discrepancy that does arise is mostly from the step of finding $X({\phi _1})$.
At fixed values of  ${\phi _{1,\tau = 0}}$, ${\phi _{2,\tau = 0}}$ and ${\phi _m}$, the asymptotic solution for v shows minimal variation with $P{e_1}$ and $P{e_2}$. This allows a schematic diagram to be drawn for the regions in the film, as exemplified in figure 10 for the set of ${\phi _{1,\hat{t} = 0}}$, ${\phi _{2,\hat{t} = 0}}$ and ${\phi _m}$ values that were used in figure 9.
Aside from verifying the numerical code, the asymptotic solutions shed insight into the large  $Pe$ regime. Remembering the definition of the Péclet number, $Pe = 6{\rm \pi}\eta R\dot{E}H/kT$, this corresponds to evaporation being fast compared with diffusion. Highly stratified films are predicted in this regime, with the asymptotic solutions allowing prediction of the composition of each region of the film. Figure 10 shows the depths of both (i) the region between the top surface and $Q(\tau )$, and (ii) the region between $Q(\tau )$ and $P(\tau )$, increasing linearly with $\hat{t}$. The depth of the region between the top surface and $Q(\tau )$ is the predicted thickness of the layer of small particles at the top surface. It can be seen in figure 10 that this small particle-rich layer is thinner than the large particle-rich layer beneath it, as a result of the relative speeds at which the top surface, $Q(\tau )$ and $P(\tau )$ recede. These fronts recede at speeds of 1, v and ${\phi _m}/[{\phi _m} - ({\phi _{1,\tau = 0}} + {\phi _{2,\tau = 0}})]$, respectively, in $(\hat{z},\hat{t})$ coordinates. The speeds are presented as the magnitudes of the gradients of the diagonal lines separating the regions in figure 10. Hence the schematic diagram may provide an explanation for why a thin layer of small particles can form at the top surface of a drying film.
Schematic of the regions of the asymptotic solution for large  $Pe$, when ${\phi _{1,\hat{t} = 0}} = {\phi _{2,\hat{t} = 0}} = 0.10$ and ${\phi _m} = 0.64$. The unreachable region is shaded in grey.
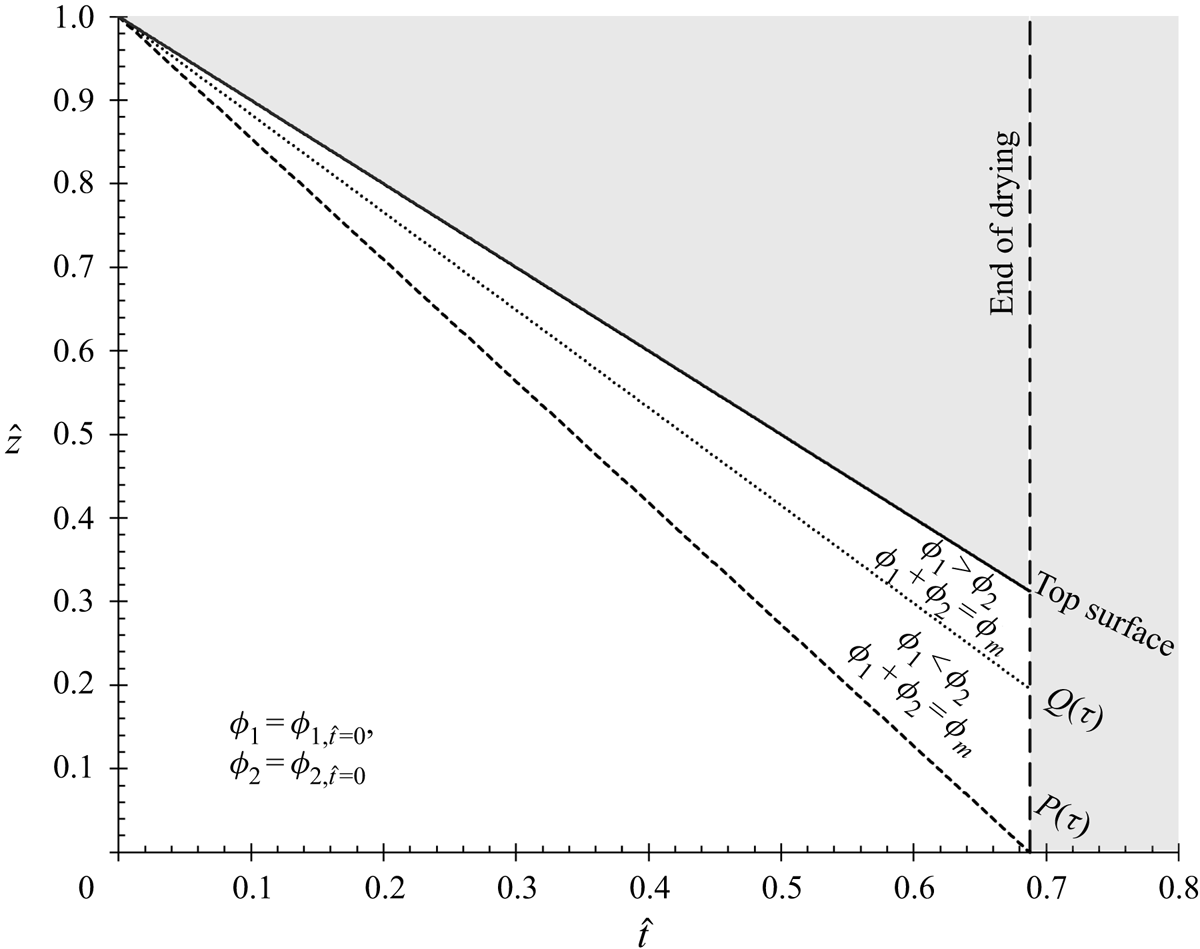
6. Conclusions
PDE models were successfully derived to describe the volume fraction evolution of two components in a drying film, for both diffusion-only and diffusion–diffusiophoresis cases. The diffusion term is written in a general form, allowing input of sedimentation coefficients and the compressibility, and can be used with different chemical potential expressions.
Both the scaling and the numerical results of the diffusion-only model predict large-on-top stratification. This model was run without interactions, but these could be included in future work. In contrast, the numerical results from the diffusion–diffusiophoresis model demonstrate that diffusiophoresis is a feasible explanation of the experimental observations of a thin layer of small particles at the top surface of a dried film, but it is dependent on the size of the excluded volume. The results suggest that diffusiophoresis combined with another effect, such as cross-interactions, may be necessary. Whether it is diffusiophoresis causing this will therefore need to be experimentally verified. Diffusiophoresis is typically investigated by setting up a gradient of salt and observing the motion of colloidal particles along this gradient, for example in dead-end microfluidic channels (Shin et al. Reference Shin, Um, Sabass, Ault, Rahimi, Warren and Stone2016; Singh et al. Reference Singh, Vladisavljević, Nadal, Cottin-Bizonne, Pirat and Bolognesi2020). This could be adapted with two colloidal particle sizes. In addition, the idealised diffusiophoresis term in this model will need to be adapted to predict whether diffusiophoresis is still expected to be significant with finite  ${R_2}$. Nevertheless, this simple PDE model, that allows the diffusiophoresis term to be switched on and off, gives clear insight into what aspect of more complex models – namely, a repulsive cross-interaction, with short range being sufficient – leads to their predictions of small-on-top stratification.
In the enhanced diffusiophoresis model, the layer of small particles at the top surface is predicted to grow over time, similarly to the results of Langevin dynamics simulations in the literature (Fortini et al. Reference Fortini, Martín-Fabiani, De La Haye, Dugas, Lansalot, D'Agosto, Bourgeat-Lami, Keddie and Sear2016; Howard et al. Reference Howard, Nikoubashman and Panagiotopoulos2017a), and at faster rates at higher  $Pe$ numbers. This suggests that in order to obtain a top surface film of a desired component, such as a biocide, fast drying rates should be used. Asymptotic solutions were found for this regime.
Supplemental material
Supplementary material are available at https://doi.org/10.1017/jfm.2021.800.
Funding
C.R.R.Z.'s work was funded by the Oppenheimer Studentship.
Declaration of interests
The authors report no conflict of interest.


 Open access

