The mucosal barrier is an important defence system that protects the host from pathogenic and immunogenic factors present in the lumen( Reference Aureli, Capurso and Castellazzi1 ). This barrier mainly consists of the mucus layer coating the epithelium, epithelium lining, tight junctions and microbiota( Reference Aureli, Capurso and Castellazzi1 ). In addition to the physical barrier, the mucosa cells have antioxidant defence system that modulates the redox balance( Reference Wu and Chen2 ) and a particular immune system, namely, the gut-associated lymphoid tissue (GALT)( Reference Aureli, Capurso and Castellazzi1 ). Therefore, the intestinal mucosal layer forms a rather important part of the immune system.
Intestinal mucins are large proteins characterised by tandem repeats rich in serine, threonine, and proline, which are highly O-glycosylated( Reference Kudelka, Ju and Heimburg-Molinaro3 ). The two types of mucins are secretory and membrane associated. The secretory mucins are produced in the goblet cells of the mucosa and secreted into the intestinal lumen to form a gel-like layer. Mucin 2 is an important secretory mucin in the large intestine( Reference Kim and Ho4 ). Deletion of Muc2 gene in mice results in spontaneous tumorigenesis in the colon( Reference Rousseau, Byrne and Kim5 ). Previous studies also indicate that alterations of mucin peptide and mucin glycosylation occur during carcinogenesis( Reference Baldus and Hanisch6 ). Therefore, the proper distribution and expression of mucins are important mechanisms for the mucosal defence system.
Tight junctions, also called zonula occludens, form continuous intercellular barrier between the intestinal epithelial cells( Reference Camilleri7 ). Tight junctions are required to separate tissue spaces, regulate selective movement of solutes across the epithelium and maintain mucosa barrier function. A leaky epithelium may lead to translocation of endotoxins and bacterial antigens and causes a persistent activation of the adaptive immune system in the GALT and systemic immune system( Reference Camilleri7 ). Currently many proteins have been identified as components of the tight junction( Reference Van Itallie and Anderson8 ). In general, the architecture can be divided into two compartments; one is the transmembrane barrier proteins (occludin, claudins, etc.) and the other is peripheral scaffolding proteins (such as zona occludin-1 (ZO-1), afadin, etc.), which are in turn linked to actin and microtubules( Reference Van Itallie and Anderson8 ).
The colonic mucosa is constantly challenged by the reactive oxidative substances (ROS) produced from the microbiota and lumen contents( Reference Seril, Liao and Yang9 ). An imbalance in the cellular redox system of mucosa leads to elevated ROS level and subsequently causes gastrointestinal tract inflammation and even colorectal cancer( Reference Seril, Liao and Yang9 , Reference Babbs10 ). Previous studies have indicated that 5 % supplementation of dietary fibres up-regulated certain colonic antioxidant enzyme gene expression against the oxidative stress caused by the high-fat diet( Reference Wu and Chen2 ). However, whether lower level supplementation of fibre could up-regulate the colonic antioxidant defence remains to be examined.
The GALT is composed of Peyer’s patch and lymphocytes such as T and B cells. The effect of konjac glucomannan (KGM) on the immune response of GALT has not been determined. In addition, most previous studies determined the modulatory effects of synbiotic (inulin and probiotic), instead of inulin oligosaccharide per se, on immunity( Reference Seifert and Watzl11 ). Therefore, more studies are required to conclude the role of dietary fibres on immunity.
Derived from the tubers of Amorphophallus konjac C. Koch, KGM is composed of β-1, 4-linked d-glucose and d-mannose units joined together with branches through β-1,6-glucosyl units( Reference Doi12 ). The KGM polysaccharide is processed into various vegetarian food products commonly consumed in the Asian countries. Inulin, found in the underground tuber of chicory (Cichorium intybus), is an oligomer or polymer of β-d-fructose containing two to mostly sixty monomeric units that are linked by β-(2 → 1) glycosidic bridges( Reference Pool-Zobel, van Loo and Rowland13 ). The fraction of inulin with the degree of polymerisation lower than 10, namely, inulin oligosaccharide, is widely used as a supplement in functional food. Both KGM and inulin oligosaccharide have been shown to increase the production of SCFA and stimulate the growth of bifidobacteria and lactobacilli in animal/human studies( Reference Pool-Zobel, van Loo and Rowland13 – Reference Chen, Cheng and Wu15 ). However, the effects of these soluble fibres on the mucosal barrier function have not been determined, which need to be determined in animal models, so that the histology of mucosal layer could be clearly observed. In addition, dietary fibres in the human diet are indigestible carbohydrates with a wide range of polymerisation and solubility. Therefore, the fibre treatments in the present study included a polymer (KGM), an oligosaccharide (a fraction of chicory inulin) and their mixture.
The present study was undertaken to investigate the effects of KGM polysaccharide, inulin oligosaccharide and the mixture on the colonic mucosal barrier, mucins, tight junction proteins, antioxidative enzymes, GALT-associated cytokines, faecal SCFA and microbiota. Plasma cytokine levels were also determined to evaluate the systemic immune effects of these dietary fibres. In order to be applicable to humans, the level of fibre supplementation was only 2 % w/w, which is equivalent to 10 g/d of normal human diet.
Material and methods
Animals
Male C57BL/6J mice were obtained at 5 weeks of age from the National Laboratory Animal Breeding and Research Center. Every three mice were housed in a solid-bottomed plastic cage with stainless wire bar lid and wood shavings for bedding in an animal holding room maintained on a 12-h light–12-h dark cycle at 23–25°C and 50 % humidity. In the present study, all animals were allowed free access to water and food. The care and use of animals followed the Animal Protective Act( 16 ) and the guidelines of the National Research Council( 17 ). All experimental procedures involving animals were approved by the Institutional Animal Care and Use Committee (IACUC) of Chung Shan Medical University (approved number 1382).
Experimental design
After 1 week of adaptation, mice (6 weeks of age) were randomly assigned to consume one of the following diets (total n 32, n 8 per group): control (control group) or fibre-supplemented (KGM 2 %, inulin oligosaccharide 2 % and KGM 1 % + inulin oligosaccharide 1 %, w/w) diets. Mice were killed after 21 d of dietary intervention. The control diet was modified from AIN-93 G diet( Reference Reeves, Nielsen and Fahey18 ), and the compositions of all diets are listed in Table 1. The konjac powder contains (w/w on dry weight basis) 80 % glucomannan, 8 % sugar, 3·4 % protein, 3·8 % lipid and 1·7 % ash; the inulin powder contains (w/w) 85 % fructo-oligosaccharide (mean degree of polymerisation 8) and 8 % sugar. The diet was adjusted based on the purity of konjac and inulin powder to provide 5 % (w/w) dietary fibre. All mice had free access to food and water throughout the study. The signs of health were observed daily. However, no adverse event occurred during the study. Food intake and body weight were determined twice a week. The voided faeces were immediately collected during days 19–21. Aliquots from the 3-d faecal composite were stored at –20°C for further analyses of faecal SCFAs and microflora. Mice were anaesthetised with CO2 on day 22 after an 18-h fasting. Blood was collected from the inferior vena cava. The entire distal colon was removed, cut longitudinally, flushed clean with ice-cold sterile saline. Segments (0·5 cm2) of the distal colon were immediately fixed in 10 % (v/v) buffered formalin and the remaining tissues were frozen for further analysis.
Composition of experimental diets
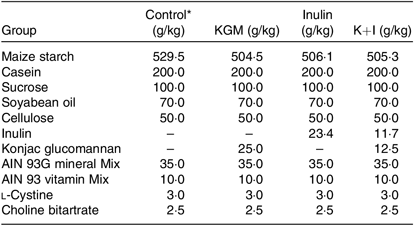
KGM, Konjac glucomannan; K+I, KGM + inulin; AIN, American Institute of Nutrition.
* The control diet was modified from AIN-93 G diet( Reference Reeves, Nielsen and Fahey18 ).
Histological evaluation
The formalin-fixed colonic tissues were processed with standard histological procedures. Paraffin sections (4 μm) were mounted on microscope slices and were dewaxed with xylene and rehydrated through descending alcohol concentration (100–70 %, w/w). Tissue sections were stained with haematoxylin and eosin. The histology of mucosal layer was observed under a 100× magnification with a Zeiss Axioskop 2 microscope (Carl Zeiss) equipped with a cooled charge-coupled device (CCD) video camera (Optronics Inc.). The mucosal layer thickness was determined using Lucia Measurement Image Analysis Systems (version 4.81; Laboratory Imaging) using a stage micrometer (Nikon) as a reference.
Mucin density
The Alcian blue is used to identify the sulphated and carboxylated acid mucopolysaccharides( Reference Lison19 ). The dewaxed and rehydrated slides were incubated in glacial acetic acid solution (3 %, w/w) for 3 min, 1 % (w/v) Alcian blue (pH 2·5, in 3 %, w/w glacial acetic acid) for 30 min and then 0·5 % (w/v) eosin solution for 1 min at room temperature. The mucin granules were enumerated in blind under 100× magnification and expressed as mucin density (number of mucin granules in each crypt).
Fluorescent in situ immunohistology of tight junction marker protein zona occludin-1
ZO-1 was determined using the fluorescent in situ immunohistological technique. Paraffin sections (4 μm) were dewaxed and rehydrated. Endogenous peroxidase activity of tissue slides were removed by treatment with 3 % (w/w) hydrogen peroxide for 20 min. Tissue slices were then blocked with 5 % (w/w) goat serum in 0·1m PBS containing 0·1 % (w/v) tween−20 for 1 h. The ZO-1 was detected with a rabbit anti-ZO-1 polyclone antibody (Abcam Co.) at a dilution of 1:50 at 37°C for 1 h, followed by a Alexa Fluor®-conjugated goat anti-rabbit IgG polyclone antibody (Abcam Co.) at a dilution of 1:10 at 37°C for 1 h. Slides were mounted with fluoroshield mounting medium containing 4′,6-diamidino-2-phenylindole (DAPI) (Abcam Co.). Fluorescence was observed and determined at 200× magnification with a Zeiss Axioskop 2 microscope (Carl Zeiss) fitted for epifluorescence device and a cooled CCD video camera (Optronics Inc.). The density of ZO-1 was determined as the red area (ZO-1 positive) over the blue area (nuclei stained by DAPI) and further calculated relative to that of the control group with Lucia Measurement Image Analysis Systems (Laboratory Imaging).
Relative gene expression
The gene expressions of Muc2, tight junction proteins including ZO-1 and occludin, antioxidant enzymes including glutathione peroxidase 2 (GPX2), glutathione S-transferase π (GST), catalase (CAT) and superoxide dismutase 1 (SOD1) and cytokines such as TNF-α and IL-10 were determined using quantitative real-time PCR (qRT-PCR). The RNA were isolated according to the method described previously( Reference Wu and Chen2 ). Briefly, the distal colon (50 mg) were homogenised in 1 ml REzolTM C&T reagent (Protech Technology). After addition with 0·2 ml chloroform, the samples were vigorously mixed and then centrifuged at 12 000 g for 15 min at 4°C. The supernatant was mixed with an equal volume of isopropanol (J. T. Baker) and centrifuged at 12 000 g for 10 min at 4°C to obtain the RNA pellets. After washing the pellets with 75 % ethanol, the RNA was dissolved in RNAase-free ultrapure water and stored at –70°C until further analysis. The concentration and quality of RNAs were determined at 260/280 nm absorbance.
The complementary DNAs were synthesised using random primers (Applied Biosystems Life Technologies) in a thermal cycler (TaKaRa Biomedical) at 25°C for 10 min, 37°C for 2 h and 85°C for 5 min. The qRT-PCR was performed using TaqMan gene expression assays (Applied Biosystems Life Technologies) with the StepOne Real-Time PCR system (Applied Biosystems Life Technologies). The exact primer and probe sequences were not provided due to the proprietary issue and policy of the supplier. The TaqMan primer/probe identification numbers of genes are provided in the supplementary material. The qRT-PCR was performed at 50°C for 2 min, 95°C for 10 min and fifty cycles at 95°C for 15 s and 60°C for 1 min. The relative gene expression of each target gene was first normalised to that of β-actin and further calculated relative to that of the control group using the comparative threshold cycle (Ct) method. The fold difference in gene expression was calculated as 2–ΔΔCt( Reference Wu and Chen2 ).
Plasma cytokines
The plasma TNF-α and IL-10 were determined using ELISA kits (eBioscience), according to the manufacturer’s instructions.
Faecal SCFA
Aliquots (0·5 g) of faecal composites were analysed for acetate, propionate and n-butyrate with 4-methyl-n valeric acid as an internal standard by the method described previously( Reference Chen, Lin and Wang14 ). The SCFA extracted using ether from faecal samples were injected onto a GC (GC-2014; Shimadzu) fitted with a glass capillary column (0·25 mm, 30 m Stabilwax-DA; Restek Corp.) and a flame ionisation detector. The initial temperature of the oven was 100°C and this was raised to 200°C at 6°C/min. The temperature of the injection port and detector was 210 and 250°C, respectively. The flow rate of carrier gas, N2, was adjusted to be 1 ml/min. Peak areas were analysed with Shimadzu GC solution data analysis program (Shimadzu Corp.).
Quantification of faecal bacteria
Faecal bifidobacteria, lactobacilli and Clostridia were quantified by the fluorescent in situ hybridisation method as described previously( Reference Jansen, Wildeboer-Veloo and Tonk20 – Reference Wang, Cao and Cerniglia22 ). In brief, genotypic probes targeting 16S rRNA of bacteria were manufactured and tagged with fluorescent markers, which allowed faecal bacterial populations to be quantified with a fluorescence microscope. The probes used were Bif164 (5′-CAT CCG GCA TTACCA CCC-3′), Laal (5′-CAT CCA GTG CAA ACC TAA GAG-3′) and Ib1 (5′-GAT GGA ACT GTA ACA AAA CT-3′), specific for bifidobacteria( Reference Wang, Cao and Cerniglia22 ), lactobacilli( Reference Wang, Cao and Cerniglia22 ) and Clostridia( Reference Nagahama, Nagayasu and Kobayashi21 ), respectively. Aliquots (5 µl) of faecal bacterial samples were fixed on the wells of microscopic slides and hybridised with probes (final concentration 25 nmol/l) at 50°C for 16 h in humid chambers. After rinsing in washing buffer (20 mmol/l Tris-HCl, 0·9 mol/l NaCl, pH 7·2) at 50°C for 30 min, the slides were air-dried in a dark room. To quantify the total faecal bacteria, the slides were incubated with a nucleic acid stain DAPI (1·4 mmol/l) for 10 min, followed by washing with washing buffer at 50°C for 10 min and air-dried. Probe fluorescence was observed and determined under the microscopic system as described previously in the present study. The microbial counts are expressed as log10 counts/g faeces.
Statistical analysis
Data are presented as means and standard deviations and analysed using SPSS (version 12.0; SPSS Inc.). The diet effects were determined using one-way ANOVA followed by post hoc analysis using Tukey’s honestly significant difference test. A P value < 0·05 was considered to be statistically significant.
Results
Mice were healthy throughout the experiment. The initial body weight for the control, KGM, inulin and K+I group was 20·45 (sd 0·54), 20·45 (sd 1·41), 20·46 (sd 1·38) and 20·48 (sd 1·24) g, respectively. The total weight gain during the experiment for the control, KGM, inulin and K+I group was 3·80 (sd 0·21), 3·55 (sd 0·23), 3·21 (sd 0·25) and 3·15 (sd 0·35) g, respectively. The weight gain was similar among groups.
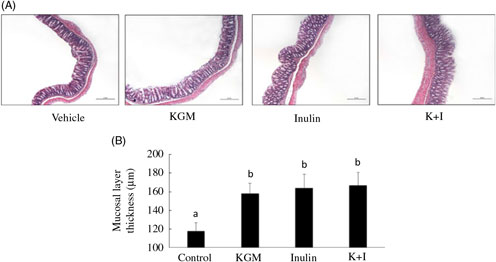
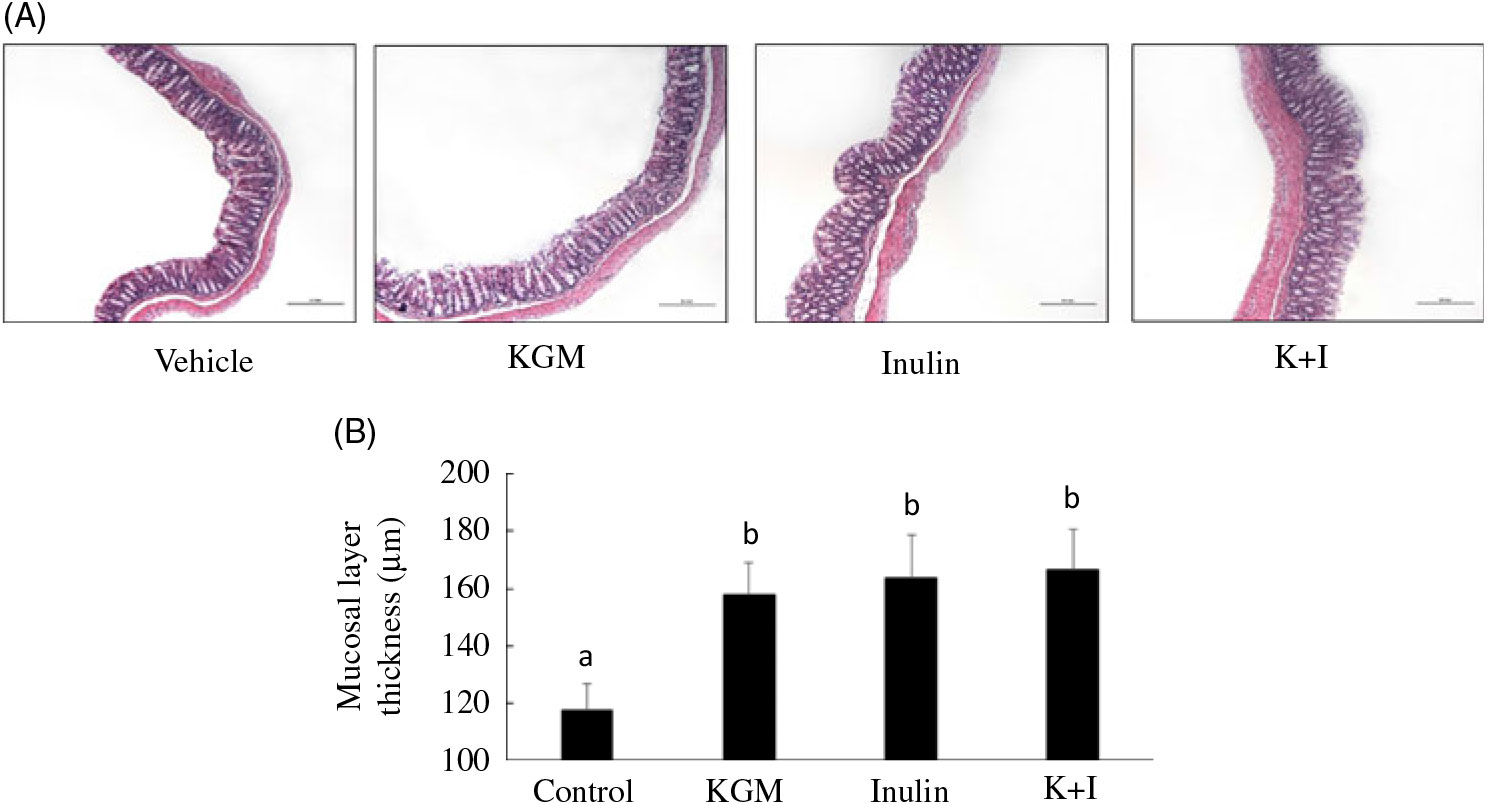
Histology of the distal colon indicated that the mucosal layer was intact in all groups (Fig. 1(A)). KGM, inulin and K+I significantly increased the mucosal layer thickness by approximately 50 % of the level in the control group (P < 0·05, respectively) (Fig. 1(B)).
(A) Histology and (B) mucosal lining thickness of the distal colon. Mice were treated with control diet (control group) or diet supplemented with 2 % (w/w) fibre derived from Konjac glucomannan (KGM group), inulin oligosaccharide (inulin group) or equal parts (1 %, w/w each) of KGM and inulin (K+I group) for 3 weeks. Segments (0·5 cm2) of the distal colon were fixed in buffered formalin, processed for histological routine and stained with haematoxylin and eosin. Scale bar represents 200 μm under 100× magnification. Bars are presented as means and standard deviations (n 8 per group). a,b Mean values with unlike letters are significantly different across groups as analysed by one-way ANOVA followed by Tukey’s honestly significant difference test (P < 0·05).
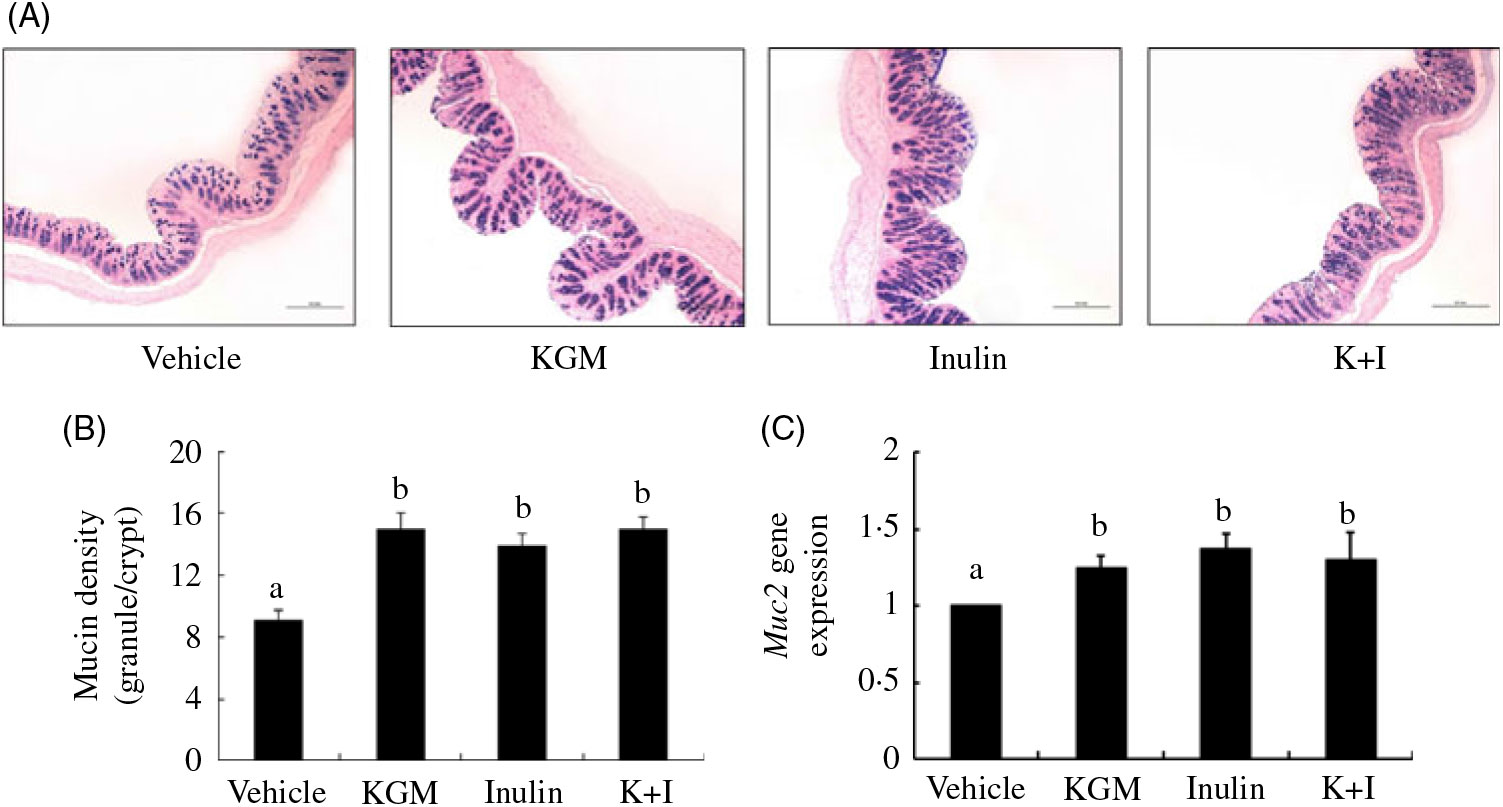
The Alcian blue-positive granules that represented the acidic mucin is shown in Fig. 2(A). KGM, inulin and K+I significantly increased the mucin density (granule number/crypt) by 77·8 (sd 7·8) % (P < 0·01), 55·6 (sd 8·8) % (P < 0·01) and 77·8 (sd 10·0) % (P < 0·01), respectively, compared with the level in the control group (Fig. 2(B)). In addition, KGM, I and K+I increased Muc2 gene expression by 0·37 (sd 0·04)-fold (P < 0·05), 0·30 (sd 0·07)-fold (P < 0·05) and 0·34 (sd 0·05)-fold (P < 0·05), respectively (Fig. 2(C)).
(A) Alcian blue staining for acidic mucins, (B) mucin density (granule number/crypt) and (C) Muc2 gene expression in the distal colon. Bars are presented as means and standard deviations (n 8 per group). Relative gene expression was normalised using internal control gene β-actin and compared with that of the control group according to the 2–ΔΔCt method. a,b Mean values with unlike letters are significantly different across groups as analysed by one-way ANOVA followed by Tukey’s honestly significant difference test (P < 0·05). KGM, Konjac glucomannan; K+I, KGM + inulin.
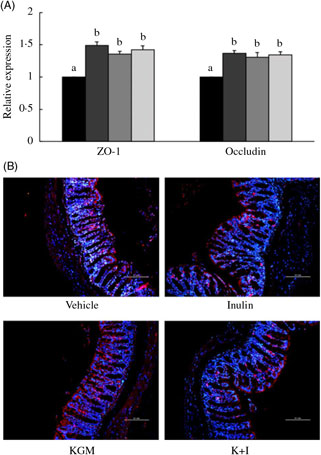
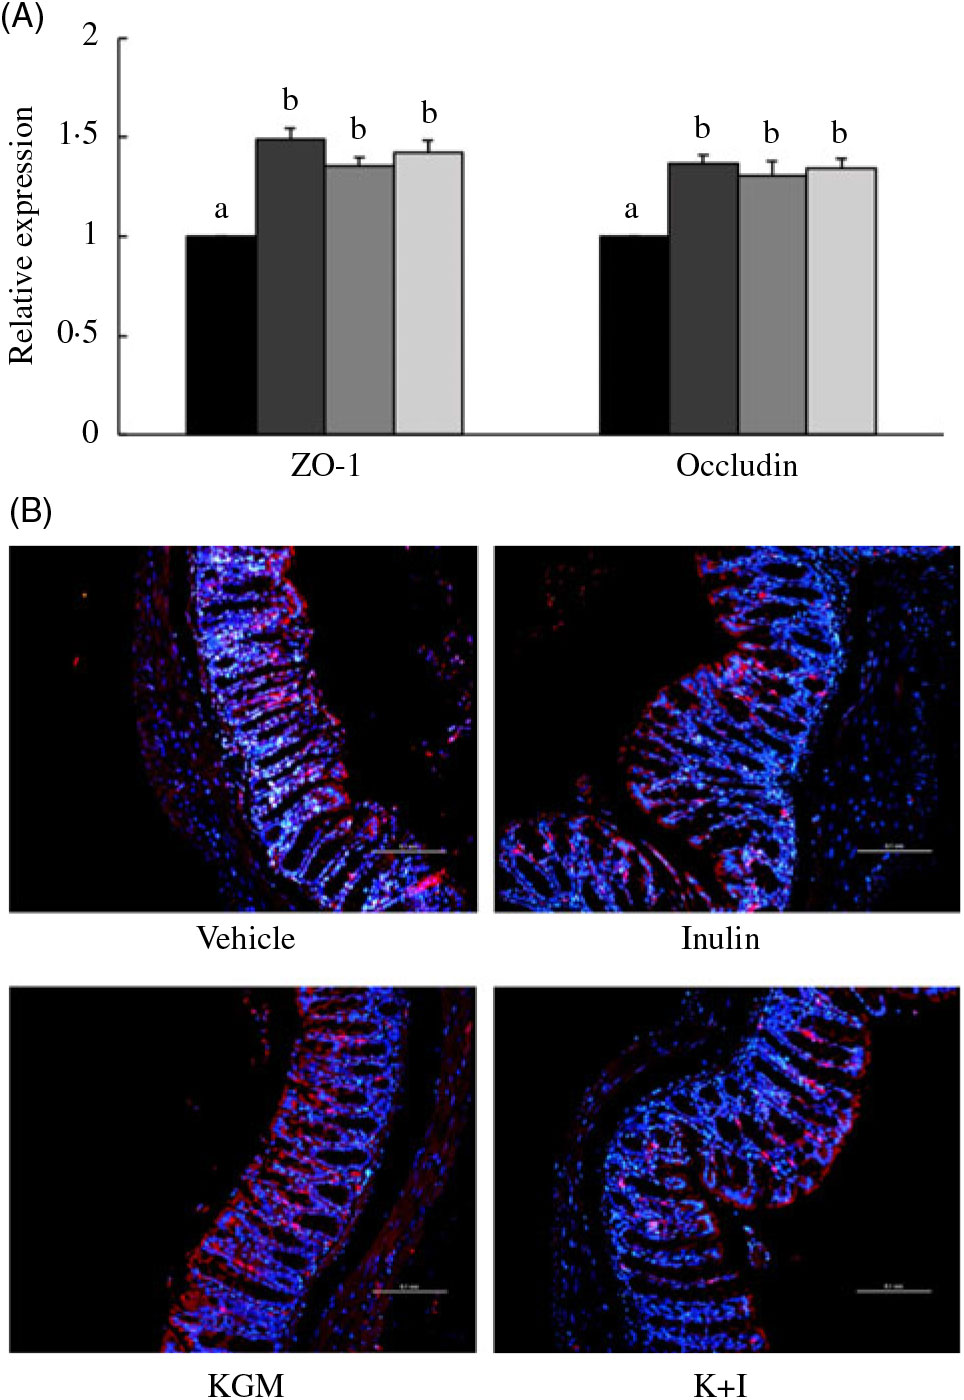
We determined the tight junction protein using both the qRT-PCR (Fig. 3(A)) and fluorescent in situ immunohistological staining (Fig. 3(B)). The qRT-PCR results indicated that KGM, I and K+I increased ZO-1 gene expression by 0·49 (sd 0·05)-fold (P < 0·05), 0·35 (sd 0·04)-fold (P < 0·05) and 0·42 (sd 0·06)-fold (P < 0·05), respectively (Fig. 3(A)). KGM, I and K+I increased occludin gene expression by 0·37 (sd 0·04)-fold (P < 0·05), 0·30 (sd 0·07)-fold (P < 0·05) and 0·34 (sd 0·05)-fold (P < 0·05), respectively. The fluorescent in situ immunohistological staining only applied to ZO-1 since the dietary effect was greater in ZO-1 than in occludin. Result indicated that KGM, I and K+I group increased the density of ZO-1 (red area/blue area) by approximately 62·2 (sd 5·0) % (P < 0·01), 22·0 (sd 1·4) % (P < 0·05) and 37·8 (sd 2·2) % (P < 0·05), respectively, compared with the level in the control group.
(A) Gene expression of tight junction proteins in the distal colon and (B) fluorescent in situ immunohistology of zona occludin-1 (ZO-1). Relative gene expression was normalised using internal control gene β-actin and compared with that of the control group according to the 2–ΔΔCt method. In the distal colon section, red fluorescence indicates ZO-1 and the blue fluorescence indicates cell nuclei stained with 4′,6-diamidino-2-phenylindole (DAPI). Scale bar represents 100 μm under 200× magnification. Bars are presented as means and standard deviations (n 8 per group). a,b Mean values with unlike letters are significantly different across groups as analysed by one-way ANOVA followed by Tukey’s honestly significant difference test (P < 0·05). (A)  , Control;
  , Konjac glucomannan (KGM);
  , inulin;
  , KGM + inulin (K+I).
Dietary fibre treatments increased the antioxidant defence of the colon by up-regulating gene expressions of GPX, GST and CAT (Fig. 4). KGM, inulin and K+I significantly increased GPX gene expression by 0·77 (sd 0·21)-fold (P < 0·01), 1·17 (sd 0·17)-fold (P < 0·001) and 1·10 (sd 0·08)-fold (P < 0·001), respectively. KGM, inulin and K+I similarly increased GST gene expression by approximately 0·4-fold (P < 0·05). KGM, I and K+I increased CAT gene expression by 0·54 (sd 0·15)-fold (P < 0·05), 0·41 (sd 0·17)-fold (P < 0·05) and 0·65 (sd 0·14)-fold (P < 0·05), respectively. SOD gene expression was not significantly modulated by any fibre treatment examined in the present study.
Relative gene expressions of glutathione S-transferase (GST), glutathione peroxidase (GPX), catalase (CAT) and superoxide dismutase (SOD) in the distal colon. Relative gene expression was normalised using internal control gene β-actin and compared with that of the control group according to the 2–ΔΔCt method. Bars are presented as means and standard deviations (n 8 per group). a,b Mean values with unlike letters are significantly different across dietary groups as analysed by one-way ANOVA followed by Tukey’s honestly significant difference test (P < 0·05).  , Control;
  , Konjac glucomannan (KGM);
  , inulin;
  , KGM + inulin.

Effects of fibres on the colonic cytokine gene expressions are shown in Fig. 5. Inulin and K+I increased the relative TNF-α gene expression by 0·45 (sd 0·12)-fold and 0·36 (sd 0·07)-fold, respectively (P < 0·05, respectively). KGM, inulin oligosaccharide and K+I increased the relative IL-10 gene expression by 0·47 (sd 0·01)-fold, 0·41 (sd 0·07)-fold and 0·6 (sd 0·09)-fold, respectively (P < 0·05, respectively).
Relative gene expressions of TNF-α and IL-10 in the colon. Relative gene expression was normalised using internal control gene β-actin and compared with that of the control group according to the 2–ΔΔCt method. Bars are presented as means and standard deviations (n 8 per group). a,b Mean values with unlike letters are significantly different across dietary groups as analysed by one-way ANOVA followed by Tukey’s honestly significant difference test (P < 0·05).  , Control;
  , Konjac glucomannan (KGM);
  , inulin;
  , KGM + inulin.

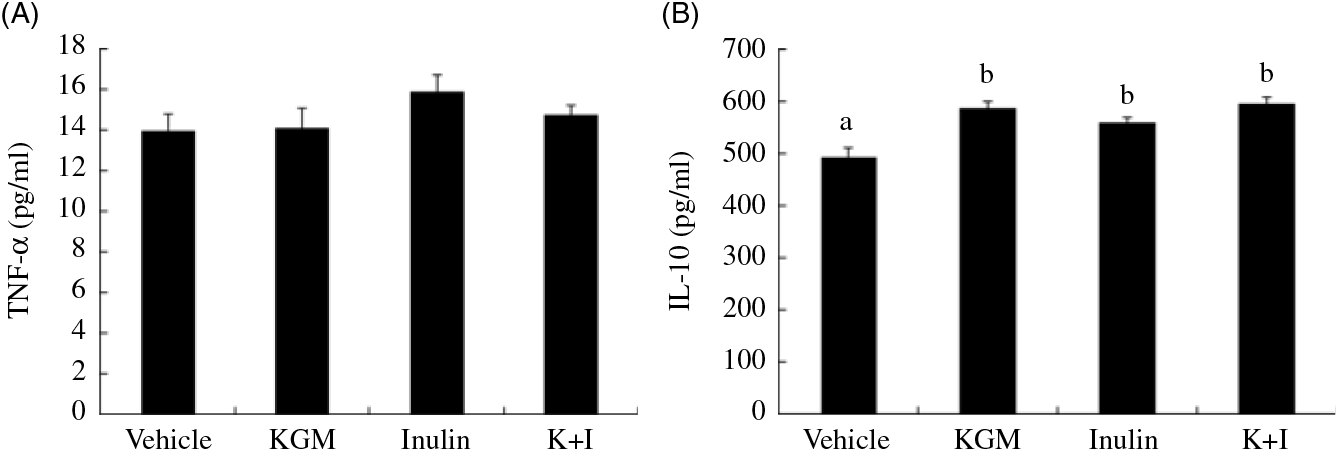
KGM, inulin oligosaccharide and K+I increased the plasma IL-10 concentration by approximately 20 % of the level in the control group and did not significantly modulate the plasma TNF-α level (Fig. 6).
Plasma TNF-α and IL-10 concentrations. Bars are presented as means and standard deviations (n 8 per group). a,b Mean values with unlike letters are significantly different across dietary groups as analysed by one-way ANOVA followed by Tukey’s honestly significant difference (P < 0·05). KGM, Konjac glucomannan; K+I, KGM + inulin.
Effects of fibres on the faecal SCFA concentrations are shown in Table 2. KGM, inulin oligosaccharide and K+I increased the faecal acetate concentration by approximately 60·4 % (P < 0·01), 55·0 % (P < 0·01) and 58·9 % (P < 0·01), respectively, compared with the level in the control group. KGM, inulin oligosaccharide and K+I increased the faecal propionate concentration by approximately 17·0 % (P < 0·05), 33·3 % (P < 0·01) and 25·2 % (P < 0·01), respectively. KGM, inulin oligosaccharide and K+I increased the faecal butyrate concentration by approximately 90·0 % (P < 0·001), 65·0 % (P < 0·01) and 80·0 % (P < 0·005), respectively. KGM, inulin oligosaccharide and K+I increased the faecal total SCFA concentration by approximately 65·7 % (P < 0·01), 52·9 % (P < 0·01) and 55·8 % (P < 0·01), respectively.
Effects of different diets on faecal SCFA concentrations (n 8) (Mean values and standard deviations)
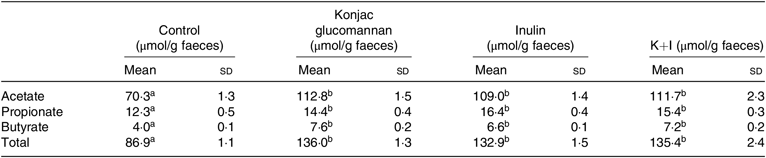
K+I, Konjac glucomannan + inulin.
a,b Mean values with unlike superscript letters within a row are significantly different (P < 0·05; ANOVA followed by Tukey’s honestly significant difference test).
After 3 weeks of dietary fibre treatments, the faecal bifidobacteria concentration (log10 counts/g faeces) in KGM, inulin oligosaccharide and K+I group was 11·29 (sd 0·02) (P < 0·001), 11·48 (sd 0·02) (P < 0·001) and 11·40 (sd 0·02) (P < 0·001), respectively, greater than that in the control (10·57 (sd 0·02)). KGM, inulin and K+I also increased the faecal lactobacilli (log10 counts/g faeces) to 11·48 (sd 0·02) (P < 0·05), 11·39 (sd 0·02) (P < 0·05) and 11·41 (sd 0·02) (P < 0·05), respectively, greater than that in the control (10·86 (sd 0·03)). However, none of the dietary fibre examined in the present study significantly modulated the faecal Clostridia concentration.
Discussion
Intestinal mucosal barrier is the largest immune system in the body and plays an essential role to protect the body from potential pathogens. As far as we know, this is the first study to determine the effects of KGM polysaccharide on the intestinal mucosal function and compare the effects of KGM polysaccharide on prebiotic inulin oligosaccharide and the mixture of KGM and inulin oligosaccharide.
Colonic mucosal thickness is an important indicator reflecting the structure and function of the colon mucosa( Reference Xue, Yu and Zhao23 ). Normal thickness of the colon mucosa represents sufficient quantity and fine morphology of the intestinal epithelium( Reference Pastorelli, De Salvo and Mercado24 ). In contrast, colonic mucosa atrophy may cause bacterial translocation( Reference Pastorelli, De Salvo and Mercado24 ). However, the effects of soluble fibres on the colonic mucosal thickness are rarely studied. The present study indicated that KGM polysaccharide, inulin oligosaccharide and K+I similarly increased the mucosal layer thickness, suggesting the protective roles of these fibres in the mucosal barrier function of the distal colon. Butyrate, which is the major fuel for colonocytes and stimulates colonocyte differentiation and normal proliferation( Reference Emenaker and Basson25 , Reference Hague, Butt and Paraskeva26 ), could play an important role. The present study and previous studies( Reference Wu and Chen2 , Reference Chen, Lin and Wang14 , Reference Wu, Yang and Chen27 ) did indicate that KGM and inulin oligosaccharide significantly increased the faecal butyrate concentration, which could in turn increase the mucosal layer thickness.
Mucins play protective roles for the mucosal lining. However, the roles of KGM and inulin oligosaccharide in the colonic mucin production have not been determined. In the present study, we suggested that KGM polysaccharide, inulin oligosaccharide and K+I similarly enhanced mucosal barrier function by the increased acidic mucin abundance and Muc2 (a secretory mucin) gene expression. Previous studies have shown that orally delivered probiotics may exert their anti-infective effects by influencing the gene expression and composition of mucins and the release of mucus( Reference Gill28 ). The in vitro co-culture of probiotics (Lactobacillus GG and Lactobacillus plantarum 299v) with colonic epithelial cells (HT-29) enhanced the expression of mucin genes (Muc2 and Muc3)( Reference Mack, Michail and Wei29 ). Therefore, the prebiotic effects of fibres examined in the present study may contribute to the enhanced mucin levels in the mucosal barrier. In addition, butyrate is also shown to up-regulate the colonic expression of Muc1-4 in mice( Reference Gaudier, Rival and Buisine30 ), which also explains the enhancing effects of KGM, inulin oligosaccharide and K+I on the Muc2 gene expression.
Differentiated epithelial cells show apico-basal polarity and contain apical tight junctions. In the present study, we suggested that supplementation of KGM polysaccharide, inulin oligosaccharide and K+I promoted the gene expressions of both the peripheral scaffolding protein ZO-1 and the transmembrane barrier protein occludin. Previous in vitro studies have suggested that butyrate increases the transcription of tight junction proteins and induces ZO-1 and occludin redistributions in the cellular membrane( Reference Wang, Wang and Wang31 , Reference Bordin, D’Atri and Guillemot32 ). Therefore, we suggested that the fermentation product, butyrate, of KGM and inulin oligosaccharide by the microbiota was likely to mediate the positive effects of these fibres on tight junction protein expressions.
Previous studies indicated that 5 % (w/w) of dietary KGM up-regulated the antioxidant defence in the colon by enhancing the gene expression of GPX and CAT( Reference Wu and Chen2 , Reference Wu, Yang and Chen27 ). However, the effect of low-level supplementation of dietary fibres on the intestinal redox system has never been documented. The present study indicated that addition of 2 % (w/w) KGM into the standard diet was enough to up-regulate the colonic antioxidant defence. In addition, the modulatory effects of inulin oligosaccharide and K+I were similar to that of KGM. Therefore, regardless of the polymerisation of fibre sources, every dietary fibre examined in the present study enhanced the antioxidant defence system in the colon.
The mucosal barrier contains microbiota that could modulate the innate and adaptive immunity of GALT( Reference Gourbeyre, Denery and Bodinier33 , Reference Markowiak and Śliżewska34 ). For example, lipoteichoic acid, a cell wall component of gram-positive bacteria (such as lactobacilli and bifidobacteria), stimulates the innate immunity by increasing the TNF-α secretion from macrophage, which in turn enhances the secretion of NO to kill pathogen/virus( Reference Markowiak and Śliżewska34 – Reference Azad, Sarker and Wan36 ). Therefore, we suggested that the prebiotic of inulin oligosaccharide and K+I caused up-regulation of colonic TNF-α gene expression, which could enhance the innate immunity of the GALT. The dietary fibres examined in the present study also modulated the pro- (TNF-α) and anti-inflammation (IL-10) cytokines which mediate the adaptive immunity in GALT( Reference Azad, Sarker and Wan36 , Reference Moore, Malefyt and Coffman37 ). KGM up-regulated the gene expression of IL-10, but not TNF-α, suggesting that KGM induced the anti-inflammatory adaptive immunity. Inulin oligosaccharide equally enhanced the gene expressions of TNF-α and IL-10, suggesting that this fibre promoted the GALT immunity to a balanced status. K+I increased the gene expression of IL-10 more than that of TNF-α, suggesting that K+I induced the GALT immunity towards anti-inflammation. Therefore, we suggested that all dietary fibres determined in the present study enhanced the GALT-associated immunity. Furthermore, KGM and K+I modulated the immunity towards anti-inflammatory immunity.
Previous studies have suggested that SCFA mediated the stimulatory effect of inulin on IL-10 production in the Peyer’s patch (part of GALT) in rats with colon cancer( Reference Roller, Pietro Femia and Caderni38 , Reference Viladomiu, Hontecillas and Yuan39 ). Certain probiotics also have been shown to increase IL-10 production, which results in decreases in allergy, inflammatory bowel disease, autoimmune diseases and inflammatory responses( Reference Arenas-Padilla, Duarte-Gutierrez and Mata-Haro40 ). Therefore, the present results suggested that both the SCFA and probiotics may mediate the modulatory effects of the fibre treatments on immunity and possibly help to protect the colon from excessive inflammation.
Dietary fibres are fermented only in the colon, but recent studies have shown that fermentable dietary fibres can modulate systemic inflammatory markers in mice( Reference Yeh, Wu and Chan41 ) and in men( Reference Xie, Ge and Huang42 ). For example, addition of 2·5 % (w/w) of fructo-oligosaccharide into a standard chow diet reduces the plasma TNF-α and lung IL-1β levels in d-galactose-treated ageing mouse model( Reference Yeh, Wu and Chan41 ). Daily supplementation of 10 g dietary fibre (mostly fermentable) reduced the blood inflammatory markers, such as TNF-α and C-reactive peptide, in haemodialysis patients( Reference Xie, Ge and Huang42 ). In accordance with these studies, the present result suggested that 2 % (w/w) of fibre treatment examined in the present study beneficially increased the plasma IL-10 level and modulated the systemic inflammatory status.
In conclusion, the present study suggests that 2 % (w/w) of KGM polysaccharide, inulin oligosaccharide and the fibre mixture beneficially protect the mucosal barrier function, modulate GLAT-associated immunity and enhance the plasma anti-inflammatory cytokine level in mice. Results of the present finding may translate into humans.
Acknowledgements
The technical support from Yu-Fong Lin for the fluorescent in situ immunohistological staining is appreciated.
The present study was supported by MOST 103-2320-B-468-005-MY3 from Ministry of Science and Technology and Chia-Yi Christian Hospital, Taiwan.
H.-L. C. designed, carried out the study and conducted partial data analysis and wrote the manuscript. C.-H. C. participated in the experiment design and co-wrote the manuscript. Y.-C. H. conducted the animal experiment and partial data analysis. All authors read and approved the findings of the study.
There are no conflicts of interest.
Supplementary material
For supplementary material referred to in this article, please visit https://doi.org/10.1017/S000711451900285X