


1 Introduction
Turbulent flows often develop within an irrotational, non-turbulent environment. Examples include canonical flows like turbulent boundary layers, jets, wakes and mixing layers. In those cases, the turbulent flow region is separated from the irrotational flow by a turbulent/non-turbulent interface (TNTI) layer. In these flows, the turbulent region can only grow by entraining (initially irrotational) fluid across this layer. The interface is a very thin layer, strongly suggesting small scales govern the entrainment process locally (e.g. Mathew & Basu Reference Mathew and Basu2002; Westerweel et al. Reference Westerweel, Fukushima, Pedersen and Hunt2005, Reference Westerweel, Fukushima, Pedersen and Hunt2009; da Silva et al. Reference da Silva, Hunt, Eames and Westerweel2014). Furthermore, several quantities, such as the velocity, exhibit a pronounced change in magnitude across this thin layer, and intense vorticity structures appear in the vicinity of the TNTI, which suggest a shear-layer-type flow structure (e.g. Westerweel et al. Reference Westerweel, Fukushima, Pedersen and Hunt2009). Recently, similarities have been suggested between the TNTI layer and the shear-layer structures that are observed well within the turbulent core region of the flow (Ishihara, Kaneda & Hunt Reference Ishihara, Kaneda and Hunt2013; Kwon et al. Reference Kwon, Philip, de Silva, Hutchins and Monty2014; da Silva et al. Reference da Silva, Hunt, Eames and Westerweel2014; Eisma et al. Reference Eisma, Westerweel, Ooms and Elsinga2015), which needs to be explored further. The resemblance is most evident in properties associated with the small scales (of the order of the layer thickness) as discussed below, whereas some differences seem to be mostly connected to the large and intermediate scales. Differences between the TNTI and internal layers have been observed in the entrainment velocity derived from conditional velocity profiles across the layers (Eisma et al. Reference Eisma, Westerweel, Ooms and Elsinga2015), and in the fractal dimension (de Silva et al. Reference de Silva, Philip, Hutchins and Marusic2017). However, it is still unclear how these differences can be reconciled with the similarities at the small scales.
When considering similarities with the internal turbulence, it is important to make a distinction between the two sublayers that have been found within the TNTI. The most outer sublayer, as seen from the turbulent side, is the laminar or viscous superlayer (VSL) (Corrsin & Kistler Reference Corrsin and Kistler1955), where viscous diffusion of vorticity is non-negligible and dominant over vorticity stretching (Taveira & da Silva Reference Taveira and da Silva2014). The mean thickness of the VSL was found to be
 $4{-}5\unicode[STIX]{x1D702}$
(Taveira & da Silva Reference Taveira and da Silva2014; Silva, Zecchetto & da Silva Reference Silva, Zecchetto and da Silva2018), where
$4{-}5\unicode[STIX]{x1D702}$
(Taveira & da Silva Reference Taveira and da Silva2014; Silva, Zecchetto & da Silva Reference Silva, Zecchetto and da Silva2018), where
 $\unicode[STIX]{x1D702}$
is the Kolmogorov length scale. Other definitions of VSL thickness also revealed Kolmogorov scaling, but with very different pre-factors (Holzner & Lüthi Reference Holzner and Lüthi2011; van Reeuwijk & Holzner Reference van Reeuwijk and Holzner2014). Adjacent to the VSL on the turbulent side is the turbulent sublayer (TSL), in which vorticity stretching dominates the production of enstrophy. The outward diffusion of vorticity in the VSL, which ultimately is the entraining mechanism, requires vorticity magnitude and its spatial gradient to increase rapidly across the TNTI, which is achieved in the TSL. The whole TNTI layer is separated from the irrotational region by an irrotational boundary (IB), which can be easily detected (Watanabe et al.
Reference Watanabe, da Silva, Nagata and Sakai2017b
). The thickness of the entire TNTI, comprising both the VSL and the TSL is typically equal to
$\unicode[STIX]{x1D702}$
is the Kolmogorov length scale. Other definitions of VSL thickness also revealed Kolmogorov scaling, but with very different pre-factors (Holzner & Lüthi Reference Holzner and Lüthi2011; van Reeuwijk & Holzner Reference van Reeuwijk and Holzner2014). Adjacent to the VSL on the turbulent side is the turbulent sublayer (TSL), in which vorticity stretching dominates the production of enstrophy. The outward diffusion of vorticity in the VSL, which ultimately is the entraining mechanism, requires vorticity magnitude and its spatial gradient to increase rapidly across the TNTI, which is achieved in the TSL. The whole TNTI layer is separated from the irrotational region by an irrotational boundary (IB), which can be easily detected (Watanabe et al.
Reference Watanabe, da Silva, Nagata and Sakai2017b
). The thickness of the entire TNTI, comprising both the VSL and the TSL is typically equal to
 $\unicode[STIX]{x1D6FF}_{\unicode[STIX]{x1D714}}\approx 10{-}16\unicode[STIX]{x1D702}$
(Silva et al.
Reference Silva, Zecchetto and da Silva2018).
$\unicode[STIX]{x1D6FF}_{\unicode[STIX]{x1D714}}\approx 10{-}16\unicode[STIX]{x1D702}$
(Silva et al.
Reference Silva, Zecchetto and da Silva2018).
Within the TSL small-scale turbulence properties appear to be similar to the internal turbulence. Watanabe et al. (Reference Watanabe, Sakai, Nagata, Ito and Hayase2014) examined the orientation of the vorticity vector,
 $\unicode[STIX]{x1D74E}$
, with respect to the strain within the TSL of a planar jet, where the vorticity is related to the velocity vector,
$\unicode[STIX]{x1D74E}$
, with respect to the strain within the TSL of a planar jet, where the vorticity is related to the velocity vector,
 $\boldsymbol{V}$
, according to
$\boldsymbol{V}$
, according to
 $\unicode[STIX]{x1D74E}=\unicode[STIX]{x1D735}\times \boldsymbol{V}$
. They found a preferential alignment between
$\unicode[STIX]{x1D74E}=\unicode[STIX]{x1D735}\times \boldsymbol{V}$
. They found a preferential alignment between
 $\unicode[STIX]{x1D74E}$
and the direction of the intermediate principal strain, which is consistent with observations made for the interior of many different turbulent flows (Ashurst et al.
Reference Ashurst, Kerstein, Kerr and Gibson1987; Tsinober, Kit & Dracos Reference Tsinober, Kit and Dracos1992; Vincent & Meneguzzi Reference Vincent and Meneguzzi1994; Lüthi, Tsinober & Kinzelbach Reference Lüthi, Tsinober and Kinzelbach2005 and many others). However, within the VSL from the TNTI of a jet, where typically the vorticity magnitude is very low, Wolf et al. (Reference Wolf, Lüthi, Holzner, Krug, Kinzelbach and Tsinober2012) found that the vorticity is not only strongly aligned with the intermediate, but also with the most stretching principal strain rate.
$\unicode[STIX]{x1D74E}$
and the direction of the intermediate principal strain, which is consistent with observations made for the interior of many different turbulent flows (Ashurst et al.
Reference Ashurst, Kerstein, Kerr and Gibson1987; Tsinober, Kit & Dracos Reference Tsinober, Kit and Dracos1992; Vincent & Meneguzzi Reference Vincent and Meneguzzi1994; Lüthi, Tsinober & Kinzelbach Reference Lüthi, Tsinober and Kinzelbach2005 and many others). However, within the VSL from the TNTI of a jet, where typically the vorticity magnitude is very low, Wolf et al. (Reference Wolf, Lüthi, Holzner, Krug, Kinzelbach and Tsinober2012) found that the vorticity is not only strongly aligned with the intermediate, but also with the most stretching principal strain rate.
Another common way of characterizing small-scale fluid motions is achieved by using the invariants of the velocity gradient tensor,
 $\unicode[STIX]{x1D63C}=\unicode[STIX]{x1D735}\boldsymbol{V}$
, the strain rate tensor,
$\unicode[STIX]{x1D63C}=\unicode[STIX]{x1D735}\boldsymbol{V}$
, the strain rate tensor,
 $\unicode[STIX]{x1D64E}=(\unicode[STIX]{x1D63C}+\unicode[STIX]{x1D63C}^{\text{T}})/2$
, and the rotation tensor,
$\unicode[STIX]{x1D64E}=(\unicode[STIX]{x1D63C}+\unicode[STIX]{x1D63C}^{\text{T}})/2$
, and the rotation tensor,
 $\unicode[STIX]{x1D734}=(\unicode[STIX]{x1D63C}-\unicode[STIX]{x1D63C}^{\text{T}})/2$
, which relate to relevant flow properties, such as the generalized local flow topology, the enstrophy and the viscous dissipation of kinetic energy (Chong, Perry & Cantwell Reference Chong, Perry and Cantwell1990; Soria et al.
Reference Soria, Sondergaard, Cantwell, Chong and Perry1994; da Silva & Pereira Reference da Silva and Pereira2008). The joint probability density functions (PDFs) of these invariants display a qualitatively universal distribution in developed turbulent flows (Soria et al.
Reference Soria, Sondergaard, Cantwell, Chong and Perry1994; Blackburn, Mansour & Cantwell Reference Blackburn, Mansour and Cantwell1996; Chong et al.
Reference Chong, Soria, Perry, Chacin, Cantwell and Na1998; Ooi et al.
Reference Ooi, Martin, Soria and Chong1999), which has raised interest in the invariants even more. da Silva & Pereira (Reference da Silva and Pereira2008, Reference da Silva and Pereira2009) analysed the shape of these universal distributions in the TNTI layer of a jet, and showed that the characteristic ‘teardrop shape’ observed for the second and third invariants of the velocity gradient tensor is already fully formed at a distance of only
$\unicode[STIX]{x1D734}=(\unicode[STIX]{x1D63C}-\unicode[STIX]{x1D63C}^{\text{T}})/2$
, which relate to relevant flow properties, such as the generalized local flow topology, the enstrophy and the viscous dissipation of kinetic energy (Chong, Perry & Cantwell Reference Chong, Perry and Cantwell1990; Soria et al.
Reference Soria, Sondergaard, Cantwell, Chong and Perry1994; da Silva & Pereira Reference da Silva and Pereira2008). The joint probability density functions (PDFs) of these invariants display a qualitatively universal distribution in developed turbulent flows (Soria et al.
Reference Soria, Sondergaard, Cantwell, Chong and Perry1994; Blackburn, Mansour & Cantwell Reference Blackburn, Mansour and Cantwell1996; Chong et al.
Reference Chong, Soria, Perry, Chacin, Cantwell and Na1998; Ooi et al.
Reference Ooi, Martin, Soria and Chong1999), which has raised interest in the invariants even more. da Silva & Pereira (Reference da Silva and Pereira2008, Reference da Silva and Pereira2009) analysed the shape of these universal distributions in the TNTI layer of a jet, and showed that the characteristic ‘teardrop shape’ observed for the second and third invariants of the velocity gradient tensor is already fully formed at a distance of only
 $12.8\unicode[STIX]{x1D702}$
from the IB. More recently, Watanabe et al. (Reference Watanabe, Jaulino, Taveira, da Silva, Nagata and Sakai2017a
) analysed in detail the entire formation of the ‘teardrop shape’ within the VSL and the TSL in a shear free turbulent configuration.
$12.8\unicode[STIX]{x1D702}$
from the IB. More recently, Watanabe et al. (Reference Watanabe, Jaulino, Taveira, da Silva, Nagata and Sakai2017a
) analysed in detail the entire formation of the ‘teardrop shape’ within the VSL and the TSL in a shear free turbulent configuration.
The mentioned small-scale flow properties, i.e. the tensor invariants and the alignment between vorticity and strain, thus appear similar in the TSL and the internal turbulent flow. Moreover, these properties appear (qualitatively) universal in many developed turbulent flows. It is interesting to note that both the strain rate tensor invariants and the vorticity alignment appeal to the same local frame of reference, that is, the strain eigenframe defined by the eigenvectors of
 $\unicode[STIX]{x1D64E}$
(see also § 5.1). An analysis of the average velocity distribution in the strain eigenframe revealed a characteristic shear-layer structure with coincident vortices (Elsinga & Marusic Reference Elsinga and Marusic2010), which was similar for different internal turbulent flows. Furthermore, these average shear layers appeared to be consistent with the mentioned vorticity–strain alignment, the tensor invariant PDFs and the shear layers observed in the instantaneous turbulent flow (Elsinga & Marusic Reference Elsinga and Marusic2010). Moreover, a topologically similar shear-layer structure was found in the strain eigenframe when conditioning on high strain, i.e. high dissipation (Elsinga et al.
Reference Elsinga, Ishihara, Goudar, da Silva and Hunt2017). This is consistent with the observation that intense vorticity and intense dissipation structures cluster in a turbulent flow (Moisy & Jiménez Reference Moisy and Jiménez2004), and that the intense vorticity clusters tend to be layer like (Vela-Martin & Ishihara Reference Vela-Martin and Ishihara2016). Intense dissipation is typically found adjacent to the intense vortices (Chacin & Cantwell Reference Chacin and Cantwell2000; Ganapathisubramani, Lakshminarasimhan & Clemens Reference Ganapathisubramani, Lakshminarasimhan and Clemens2008) implying that these events are found along the same layer-like cluster. Indeed, large internal shear layers show such a clustering of dissipation and vorticity structures (Ishihara et al.
Reference Ishihara, Kaneda and Hunt2013). In § 5 we evaluate the average flow in the eigenframe conditioned on internal vortex sheets, as detected using the method proposed by Horiuti & Takagi (Reference Horiuti and Takagi2005). The resulting shear-layer structure is again similar to the unconditional average, apart from some details within its core. These findings demonstrate that such shear layers are characteristic features of internal turbulence and that they appear robust in the strain eigenframe, meaning that their appearance (not their strength) is rather insensitive to the conditioning event. The quantitative correspondence between the average in the strain eigenframe and the instantaneous shear layers was examined by considering their Reynolds number scaling. For the average shear layer, it was found that the vortices scaled with
$\unicode[STIX]{x1D64E}$
(see also § 5.1). An analysis of the average velocity distribution in the strain eigenframe revealed a characteristic shear-layer structure with coincident vortices (Elsinga & Marusic Reference Elsinga and Marusic2010), which was similar for different internal turbulent flows. Furthermore, these average shear layers appeared to be consistent with the mentioned vorticity–strain alignment, the tensor invariant PDFs and the shear layers observed in the instantaneous turbulent flow (Elsinga & Marusic Reference Elsinga and Marusic2010). Moreover, a topologically similar shear-layer structure was found in the strain eigenframe when conditioning on high strain, i.e. high dissipation (Elsinga et al.
Reference Elsinga, Ishihara, Goudar, da Silva and Hunt2017). This is consistent with the observation that intense vorticity and intense dissipation structures cluster in a turbulent flow (Moisy & Jiménez Reference Moisy and Jiménez2004), and that the intense vorticity clusters tend to be layer like (Vela-Martin & Ishihara Reference Vela-Martin and Ishihara2016). Intense dissipation is typically found adjacent to the intense vortices (Chacin & Cantwell Reference Chacin and Cantwell2000; Ganapathisubramani, Lakshminarasimhan & Clemens Reference Ganapathisubramani, Lakshminarasimhan and Clemens2008) implying that these events are found along the same layer-like cluster. Indeed, large internal shear layers show such a clustering of dissipation and vorticity structures (Ishihara et al.
Reference Ishihara, Kaneda and Hunt2013). In § 5 we evaluate the average flow in the eigenframe conditioned on internal vortex sheets, as detected using the method proposed by Horiuti & Takagi (Reference Horiuti and Takagi2005). The resulting shear-layer structure is again similar to the unconditional average, apart from some details within its core. These findings demonstrate that such shear layers are characteristic features of internal turbulence and that they appear robust in the strain eigenframe, meaning that their appearance (not their strength) is rather insensitive to the conditioning event. The quantitative correspondence between the average in the strain eigenframe and the instantaneous shear layers was examined by considering their Reynolds number scaling. For the average shear layer, it was found that the vortices scaled with
 $\unicode[STIX]{x1D702}$
, the strain environment of these vortices scaled with the Taylor length scale,
$\unicode[STIX]{x1D702}$
, the strain environment of these vortices scaled with the Taylor length scale,
 $\unicode[STIX]{x1D706}$
, and the nearly uniform flow outside the shear layer scaled with the integral length scale (Elsinga et al.
Reference Elsinga, Ishihara, Goudar, da Silva and Hunt2017). These scalings were consistent with those proposed for the instantaneous internal shear-layer structures, especially at high Reynolds number (Ishihara et al.
Reference Ishihara, Kaneda and Hunt2013). For a more detailed comparison the reader is referred to Elsinga et al. (Reference Elsinga, Ishihara, Goudar, da Silva and Hunt2017). Thus, the strain eigenframe appears as a suitable local frame of reference to study flow structures, and shear layers in particular.
$\unicode[STIX]{x1D706}$
, and the nearly uniform flow outside the shear layer scaled with the integral length scale (Elsinga et al.
Reference Elsinga, Ishihara, Goudar, da Silva and Hunt2017). These scalings were consistent with those proposed for the instantaneous internal shear-layer structures, especially at high Reynolds number (Ishihara et al.
Reference Ishihara, Kaneda and Hunt2013). For a more detailed comparison the reader is referred to Elsinga et al. (Reference Elsinga, Ishihara, Goudar, da Silva and Hunt2017). Thus, the strain eigenframe appears as a suitable local frame of reference to study flow structures, and shear layers in particular.
Here, the analysis of the average flow structure in the strain eigenframe is extended to the TNTI of a shear free turbulent flow and a turbulent jet. Both flows were obtained by direct numerical simulation (DNS). The present statistical approach allows for a comparison between the VSL, the TSL and the internal turbulence far from the TNTI, as well as a comparison between the different flows. The results highlight some important differences between the internal turbulence structure and the TNTI, which are shown to affect the transport of a passive scalar. Moreover, the straining motions at the interface are important to understand, because of their role in vorticity stretching. Vorticity stretching maintains a large vorticity magnitude in the TSL required for the viscous diffusion of vorticity in the VSL. It is also responsible for keeping the TNTI and the TSL thin (Bisset, Hunt & Rogers Reference Bisset, Hunt and Rogers2002; da Silva et al. Reference da Silva, Hunt, Eames and Westerweel2014).
Below, the DNS databases of shear free turbulence and the turbulent jet and the TNTI detection are introduced (§ 2), which is followed by profiles showing the magnitude of the principal strain rates and enstrophy across the TNTI (§ 3). The alignments of the principal strain axes with respect to the interface and the vorticity vector are discussed in § 4. The observed alignments help to define an appropriate local reference frame based on the principal straining directions (§ 5). The method to extract the average flow structure in the local strain eigenframe is explained, and results are given for the VSL, the TSL and the internal turbulence (§ 5). Then implications for the transport of a passive scalar are discussed (§ 6) before summarizing the results in § 7.
2 Methods
2.1 DNS databases
The present analysis uses a DNS of shear free turbulence carried out with the same code used in da Silva & Taveira (Reference da Silva and Taveira2010) and Teixeira & da Silva (Reference Teixeira and da Silva2012). The TNTI was created by instantaneously inserting the velocity and scalar fields from a separate DNS of forced homogenous isotropic turbulence into the middle of a zero velocity, zero scalar field. Both the velocity and the scalar had a zero mean in the turbulence region, matching the initial conditions in the exterior. As the flow develops in time (unforced), the turbulent region slowly spreads into the irrotational region and a sharp TNTI develops (figure 1). The present analysis of the TNTI was preformed when the Reynolds number based on the Taylor length scale was
 $Re_{\unicode[STIX]{x1D706}}=86$
in the turbulent core. While the Reynolds number is moderate, it is sufficient for the small-scale straining motions considered here to be fully developed (Elsinga et al.
Reference Elsinga, Ishihara, Goudar, da Silva and Hunt2017). The Schmidt number was
$Re_{\unicode[STIX]{x1D706}}=86$
in the turbulent core. While the Reynolds number is moderate, it is sufficient for the small-scale straining motions considered here to be fully developed (Elsinga et al.
Reference Elsinga, Ishihara, Goudar, da Silva and Hunt2017). The Schmidt number was
 $Sc=0.7$
. The computational domain consisted of a
$Sc=0.7$
. The computational domain consisted of a
 $2\unicode[STIX]{x03C0}$
-sized cube discretized using 512 points in each direction. The grid size corresponds to
$2\unicode[STIX]{x03C0}$
-sized cube discretized using 512 points in each direction. The grid size corresponds to
 $\unicode[STIX]{x0394}x/\unicode[STIX]{x1D702}=1.39$
, where
$\unicode[STIX]{x0394}x/\unicode[STIX]{x1D702}=1.39$
, where
 $\unicode[STIX]{x1D702}$
is the Kolmogorov length scale. Within the turbulent core region of the flow, the Taylor length scale is
$\unicode[STIX]{x1D702}$
is the Kolmogorov length scale. Within the turbulent core region of the flow, the Taylor length scale is
 $\unicode[STIX]{x1D706}/\unicode[STIX]{x1D702}=18.3$
, while
$\unicode[STIX]{x1D706}/\unicode[STIX]{x1D702}=18.3$
, while
 $u^{\prime }/u_{\unicode[STIX]{x1D702}}=4.7$
, where
$u^{\prime }/u_{\unicode[STIX]{x1D702}}=4.7$
, where
 $u^{\prime }$
is the root-mean-square of the velocity components and
$u^{\prime }$
is the root-mean-square of the velocity components and
 $u_{\unicode[STIX]{x1D702}}$
is the Kolmogorov velocity scale.
$u_{\unicode[STIX]{x1D702}}$
is the Kolmogorov velocity scale.
Additionally, the DNS database of a temporally evolving planar jet flow at
 $Re_{\unicode[STIX]{x1D706}}=140$
described by Taveira & da Silva (Reference Taveira and da Silva2014) was also used. The spatial resolution is
$Re_{\unicode[STIX]{x1D706}}=140$
described by Taveira & da Silva (Reference Taveira and da Silva2014) was also used. The spatial resolution is
 $\unicode[STIX]{x0394}x/\unicode[STIX]{x1D702}=1.1$
. Furthermore, a scalar concentration field is included in this simulation with
$\unicode[STIX]{x0394}x/\unicode[STIX]{x1D702}=1.1$
. Furthermore, a scalar concentration field is included in this simulation with
 $Sc=0.7$
. The initial condition for the velocity inside the jet was taken from a DNS of turbulent channel flow, while the scalar concentration is uniform and non-zero. In the exterior the velocity and scalar were initially zero.
$Sc=0.7$
. The initial condition for the velocity inside the jet was taken from a DNS of turbulent channel flow, while the scalar concentration is uniform and non-zero. In the exterior the velocity and scalar were initially zero.
(a) A plane extracted from the shear free turbulence simulation showing contours of vorticity magnitude normalized using the Kolmogorov micro-scale. (b) Conditional mean profile of vorticity magnitude (along
 $y_{I}$
) normalized by its value at
$y_{I}$
) normalized by its value at
 $y_{I}=35\unicode[STIX]{x1D702}$
, for the shear free turbulence simulation. (c) Definition of the local coordinate
$y_{I}=35\unicode[STIX]{x1D702}$
, for the shear free turbulence simulation. (c) Definition of the local coordinate
 $y_{I}$
relative to the position of the irrotational boundary (IB).
$y_{I}$
relative to the position of the irrotational boundary (IB).

2.2 Interface detection
For both flows a global coordinate system is defined, in which
 $x$
and
$x$
and
 $z$
denote the homogenous directions and
$z$
denote the homogenous directions and
 $y$
coincides with the direction of average growth of the turbulent flow region. At each point in the (
$y$
coincides with the direction of average growth of the turbulent flow region. At each point in the (
 $x,z$
) plane, the irrotational boundary (IB) location,
$x,z$
) plane, the irrotational boundary (IB) location,
 $Y_{I}(x,z)$
, is determined as the outermost point along the
$Y_{I}(x,z)$
, is determined as the outermost point along the
 $y$
-direction (starting from the turbulent region) where the vorticity magnitude reaches a selected threshold value. The particular vorticity threshold used here was taken from a range of values where the total turbulent volume enclosed by the IB is insensitive to changes in the threshold value, which reflects the sharpness of the TNTI layer. Indeed, in all flows where both turbulent and non-turbulent flow regions exist, there is a large range of threshold vorticity values for which the position of the IB remains virtually constant. Recently, Silva et al. (Reference Silva, Zecchetto and da Silva2018) have shown that changing the vorticity threshold from this region by one order of magnitude, results in displacing the position of the IB by less than 1 Kolmogorov length scale. Further details of this procedure can be found in e.g. da Silva et al. (Reference da Silva, Hunt, Eames and Westerweel2014), Watanabe et al. (Reference Watanabe, da Silva, Nagata and Sakai2017b
), Silva et al. (Reference Silva, Zecchetto and da Silva2018) and references therein. Beyond this IB point, the vorticity magnitude remains below the threshold value, and the flow is considered irrotational (or non-turbulent). By definition, the IB corresponds to an isosurface of (very low) vorticity magnitude. So strictly speaking, this surface is always rotational. However, the specified vorticity threshold is so low that rotation, i.e. non-zero enstrophy, can be considered negligible beyond that point. This procedure has been used in jets, wakes, boundary layers and mixing layers, and the IB has always been found to lay at the start of the VSL (as observed from the non-turbulent region). The resulting IB surface
$y$
-direction (starting from the turbulent region) where the vorticity magnitude reaches a selected threshold value. The particular vorticity threshold used here was taken from a range of values where the total turbulent volume enclosed by the IB is insensitive to changes in the threshold value, which reflects the sharpness of the TNTI layer. Indeed, in all flows where both turbulent and non-turbulent flow regions exist, there is a large range of threshold vorticity values for which the position of the IB remains virtually constant. Recently, Silva et al. (Reference Silva, Zecchetto and da Silva2018) have shown that changing the vorticity threshold from this region by one order of magnitude, results in displacing the position of the IB by less than 1 Kolmogorov length scale. Further details of this procedure can be found in e.g. da Silva et al. (Reference da Silva, Hunt, Eames and Westerweel2014), Watanabe et al. (Reference Watanabe, da Silva, Nagata and Sakai2017b
), Silva et al. (Reference Silva, Zecchetto and da Silva2018) and references therein. Beyond this IB point, the vorticity magnitude remains below the threshold value, and the flow is considered irrotational (or non-turbulent). By definition, the IB corresponds to an isosurface of (very low) vorticity magnitude. So strictly speaking, this surface is always rotational. However, the specified vorticity threshold is so low that rotation, i.e. non-zero enstrophy, can be considered negligible beyond that point. This procedure has been used in jets, wakes, boundary layers and mixing layers, and the IB has always been found to lay at the start of the VSL (as observed from the non-turbulent region). The resulting IB surface
 $Y_{I}(x,z)$
is also known as the TNTI envelope (Hernan & Jiménez Reference Hernan and Jiménez1982; da Silva & Pereira Reference da Silva and Pereira2008; Westerweel et al.
Reference Westerweel, Fukushima, Pedersen and Hunt2009). Figure 1(a) shows the resulting TNTI envelope, which confines the region of intense vorticity associated with the turbulent flow region.
$Y_{I}(x,z)$
is also known as the TNTI envelope (Hernan & Jiménez Reference Hernan and Jiménez1982; da Silva & Pereira Reference da Silva and Pereira2008; Westerweel et al.
Reference Westerweel, Fukushima, Pedersen and Hunt2009). Figure 1(a) shows the resulting TNTI envelope, which confines the region of intense vorticity associated with the turbulent flow region.
For the subsequent analysis, a local coordinate is defined relative to the TNTI envelope. The local normal to the IB is given by the three-dimensional (3-D) unit vector
 $\boldsymbol{n}_{I}\equiv \unicode[STIX]{x1D735}\unicode[STIX]{x1D714}/|\unicode[STIX]{x1D735}\unicode[STIX]{x1D714}|$
, where
$\boldsymbol{n}_{I}\equiv \unicode[STIX]{x1D735}\unicode[STIX]{x1D714}/|\unicode[STIX]{x1D735}\unicode[STIX]{x1D714}|$
, where
 $\unicode[STIX]{x1D714}=|\unicode[STIX]{x1D74E}|$
is the vorticity magnitude. The normal is directed towards the turbulent flow region. The distance from the TNTI along
$\unicode[STIX]{x1D714}=|\unicode[STIX]{x1D74E}|$
is the vorticity magnitude. The normal is directed towards the turbulent flow region. The distance from the TNTI along
 $\boldsymbol{n}_{I}$
is given by
$\boldsymbol{n}_{I}$
is given by
 $y_{I}$
, with
$y_{I}$
, with
 $y_{I}>0$
and
$y_{I}>0$
and
 $y_{I}<0$
indicating the turbulent and irrotational (or non-turbulent) sides of the interface, respectively (figure 1
c). Conditional statistics were acquired as a function of the distance from the IB,
$y_{I}<0$
indicating the turbulent and irrotational (or non-turbulent) sides of the interface, respectively (figure 1
c). Conditional statistics were acquired as a function of the distance from the IB,
 $y_{I}$
. It is important to note that throughout the present manuscript, the conditional sampling was not corrected for irrotational patches within the turbulent flow region or for turbulent flow regions at
$y_{I}$
. It is important to note that throughout the present manuscript, the conditional sampling was not corrected for irrotational patches within the turbulent flow region or for turbulent flow regions at
 $y_{I}<0$
. The latter may occur if the negative
$y_{I}<0$
. The latter may occur if the negative
 $y_{I}$
-axis intersects a neighbouring bulge of turbulent fluid. Such intersections are very rare, especially for the shear free turbulence case, because its TNTI is relatively flat (figure 1
a). Here, these data points were included in the statistics, because we consider them an integral part of the neighbourhood of the interface located at
$y_{I}$
-axis intersects a neighbouring bulge of turbulent fluid. Such intersections are very rare, especially for the shear free turbulence case, because its TNTI is relatively flat (figure 1
a). Here, these data points were included in the statistics, because we consider them an integral part of the neighbourhood of the interface located at
 $y_{I}=0$
.
$y_{I}=0$
.
3 Conditional mean profiles across the TNTI
In this section as well as in § 4 the focus will be on shear free turbulence. For sufficiently high Reynolds numbers, profiles across the TNTI are qualitatively similar for the jet. Figure 1(b) shows the mean vorticity magnitude as a function of the distance from the interface,
 $y_{I}$
, revealing a jump similar to those reported in the literature before. The shape of this profile is consistent with the later stages in shear free turbulence (da Silva et al.
Reference da Silva, Hunt, Eames and Westerweel2014). By contrast, the initial stages of development in shear free turbulence are marked by a sharp vorticity peak at small
$y_{I}$
, revealing a jump similar to those reported in the literature before. The shape of this profile is consistent with the later stages in shear free turbulence (da Silva et al.
Reference da Silva, Hunt, Eames and Westerweel2014). By contrast, the initial stages of development in shear free turbulence are marked by a sharp vorticity peak at small
 $y_{I}$
(da Silva & Taveira Reference da Silva and Taveira2010; da Silva et al.
Reference da Silva, Hunt, Eames and Westerweel2014), which is absent here. Still, the profile reveals a strong increase in vorticity near the interface, as expected. The maximum normalized vorticity magnitude
$y_{I}$
(da Silva & Taveira Reference da Silva and Taveira2010; da Silva et al.
Reference da Silva, Hunt, Eames and Westerweel2014), which is absent here. Still, the profile reveals a strong increase in vorticity near the interface, as expected. The maximum normalized vorticity magnitude
 $|\unicode[STIX]{x1D74E}|^{\ast }$
is only 1.04, which is attained at
$|\unicode[STIX]{x1D74E}|^{\ast }$
is only 1.04, which is attained at
 $y_{I}=15\unicode[STIX]{x1D702}$
. The superscript
$y_{I}=15\unicode[STIX]{x1D702}$
. The superscript
 $\text{}^{\ast }$
indicates a normalization by the respective magnitude in the turbulent flow region away from the TNTI, which in the present work and for shear free turbulence is taken at
$\text{}^{\ast }$
indicates a normalization by the respective magnitude in the turbulent flow region away from the TNTI, which in the present work and for shear free turbulence is taken at
 $y_{I}=35\unicode[STIX]{x1D702}$
. On the non-turbulent side
$y_{I}=35\unicode[STIX]{x1D702}$
. On the non-turbulent side
 $(y_{I}<0),|\unicode[STIX]{x1D74E}|^{\ast }$
reduces to approximately 0.02. The difference with respect to zero vorticity magnitude, as expected for irrotational flow, is due to the contributions from intersections with turbulent bulges as discussed in § 2.2 and the non-zero vorticity threshold used to detect the TNTI.
$(y_{I}<0),|\unicode[STIX]{x1D74E}|^{\ast }$
reduces to approximately 0.02. The difference with respect to zero vorticity magnitude, as expected for irrotational flow, is due to the contributions from intersections with turbulent bulges as discussed in § 2.2 and the non-zero vorticity threshold used to detect the TNTI.
The averaged principal strain rates,
 $\unicode[STIX]{x1D70E}_{i}$
, conditioned on
$\unicode[STIX]{x1D70E}_{i}$
, conditioned on
 $y_{I}$
are presented in figure 2(a). The principal strain rates are given by the eigenvalues of the strain rate tensor, and the indexes
$y_{I}$
are presented in figure 2(a). The principal strain rates are given by the eigenvalues of the strain rate tensor, and the indexes
 $i=1$
, 2 and 3 refer to the most stretching, intermediate and most compressive strain rate respectively
$i=1$
, 2 and 3 refer to the most stretching, intermediate and most compressive strain rate respectively
 $(\unicode[STIX]{x1D70E}_{1}\geqslant \unicode[STIX]{x1D70E}_{2}\geqslant \unicode[STIX]{x1D70E}_{3})$
. Due to incompressibility
$(\unicode[STIX]{x1D70E}_{1}\geqslant \unicode[STIX]{x1D70E}_{2}\geqslant \unicode[STIX]{x1D70E}_{3})$
. Due to incompressibility
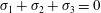 $\unicode[STIX]{x1D70E}_{1}+\unicode[STIX]{x1D70E}_{2}+\unicode[STIX]{x1D70E}_{3}=0$
, which implies
$\unicode[STIX]{x1D70E}_{1}+\unicode[STIX]{x1D70E}_{2}+\unicode[STIX]{x1D70E}_{3}=0$
, which implies
 $\unicode[STIX]{x1D70E}_{1}\geqslant 0$
and
$\unicode[STIX]{x1D70E}_{1}\geqslant 0$
and
 $\unicode[STIX]{x1D70E}_{3}\leqslant 0$
. The intermediate principal strain rate can either be positive or negative, but is positive on average. As for vorticity, the magnitude of the principal strain rates increases across the TNTI. However, the most stretching and compressive strain rates maintain significant magnitudes on the non-turbulent side of the interface. The average intermediate principal strain rate, which is smallest in magnitude anyway, decreases much more across the TNTI by comparison. Consequently, the average strain field is more two-dimensional on the non-turbulent side. This can be inferred from the ratio of the average principal strains
$\unicode[STIX]{x1D70E}_{3}\leqslant 0$
. The intermediate principal strain rate can either be positive or negative, but is positive on average. As for vorticity, the magnitude of the principal strain rates increases across the TNTI. However, the most stretching and compressive strain rates maintain significant magnitudes on the non-turbulent side of the interface. The average intermediate principal strain rate, which is smallest in magnitude anyway, decreases much more across the TNTI by comparison. Consequently, the average strain field is more two-dimensional on the non-turbulent side. This can be inferred from the ratio of the average principal strains
 $\unicode[STIX]{x1D70E}_{1}/\unicode[STIX]{x1D70E}_{2}$
(figure 2
b), which shows that
$\unicode[STIX]{x1D70E}_{1}/\unicode[STIX]{x1D70E}_{2}$
(figure 2
b), which shows that
 $\unicode[STIX]{x1D70E}_{1}:\unicode[STIX]{x1D70E}_{2}:\unicode[STIX]{x1D70E}_{3}$
reaches
$\unicode[STIX]{x1D70E}_{1}:\unicode[STIX]{x1D70E}_{2}:\unicode[STIX]{x1D70E}_{3}$
reaches
 $15:1:-16$
near
$15:1:-16$
near
 $y_{I}=-20\unicode[STIX]{x1D702}$
. (Note that
$y_{I}=-20\unicode[STIX]{x1D702}$
. (Note that
 $\unicode[STIX]{x1D70E}_{3}/\unicode[STIX]{x1D70E}_{2}=-(\unicode[STIX]{x1D70E}_{1}/\unicode[STIX]{x1D70E}_{2}+1)$
due to incompressibility.) A similar conclusion on the two-dimensional nature of the non-turbulent flow was reached by da Silva & Pereira (Reference da Silva and Pereira2008) and Watanabe et al. (Reference Watanabe, Sakai, Nagata, Ito and Hayase2014) based on the invariants of the strain rate tensor. Holzner et al. (Reference Holzner, Liberzon, Nikitin, Lüthi, Kinzelbach and Tsinober2008) also observed significant total strain magnitude,
$\unicode[STIX]{x1D70E}_{3}/\unicode[STIX]{x1D70E}_{2}=-(\unicode[STIX]{x1D70E}_{1}/\unicode[STIX]{x1D70E}_{2}+1)$
due to incompressibility.) A similar conclusion on the two-dimensional nature of the non-turbulent flow was reached by da Silva & Pereira (Reference da Silva and Pereira2008) and Watanabe et al. (Reference Watanabe, Sakai, Nagata, Ito and Hayase2014) based on the invariants of the strain rate tensor. Holzner et al. (Reference Holzner, Liberzon, Nikitin, Lüthi, Kinzelbach and Tsinober2008) also observed significant total strain magnitude,
 $\unicode[STIX]{x1D70E}_{i}^{2}$
, on the non-turbulent side. As a result, there is significant viscous dissipation of kinetic energy in the non-turbulent region (da Silva & Pereira Reference da Silva and Pereira2008).
$\unicode[STIX]{x1D70E}_{i}^{2}$
, on the non-turbulent side. As a result, there is significant viscous dissipation of kinetic energy in the non-turbulent region (da Silva & Pereira Reference da Silva and Pereira2008).
The two-dimensional nature of the non-turbulent motions near the IB can be easily explained by recalling that in this non-turbulent region the velocity fluctuations are caused (induced) by the eddies laying in the neighbouring turbulent region. Since only eddies preferentially aligned and parallel (i.e. tangent) to the IB can be very close to it (da Silva & dos Reis Reference da Silva and dos Reis2011; Watanabe et al. Reference Watanabe, da Silva, Nagata and Sakai2017b ), it is understandable that the observed non-turbulent motions near the IB induced by these eddies be approximately two-dimensional.
At the interface the ratio of the average principal strain rates is
 $5:1:-6$
, which is close to their ratio well inside the turbulent flow region (figure 2
b). It signifies that the strain is more three-dimensional near the TNTI. At
$5:1:-6$
, which is close to their ratio well inside the turbulent flow region (figure 2
b). It signifies that the strain is more three-dimensional near the TNTI. At
 $y_{I}=5\unicode[STIX]{x1D702}$
the intermediate strain rate profile peaks (figure 2
a), which causes the ratio of average principal strain rates to reach
$y_{I}=5\unicode[STIX]{x1D702}$
the intermediate strain rate profile peaks (figure 2
a), which causes the ratio of average principal strain rates to reach
 $3.5:1:-4.5$
(figure 2
b). This is close to the ratio
$3.5:1:-4.5$
(figure 2
b). This is close to the ratio
 $3:1:-4$
typical of intense dissipation (Ashurst et al.
Reference Ashurst, Kerstein, Kerr and Gibson1987; Soria et al.
Reference Soria, Sondergaard, Cantwell, Chong and Perry1994; Elsinga et al.
Reference Elsinga, Ishihara, Goudar, da Silva and Hunt2017). The present ratios are somewhat different to those inferred from averaging the invariants of the strain rate tensor (da Silva & Pereira Reference da Silva and Pereira2008; Watanabe et al.
Reference Watanabe, Sakai, Nagata, Ito and Hayase2014), because the invariants depend nonlinearly on the strain rates.
$3:1:-4$
typical of intense dissipation (Ashurst et al.
Reference Ashurst, Kerstein, Kerr and Gibson1987; Soria et al.
Reference Soria, Sondergaard, Cantwell, Chong and Perry1994; Elsinga et al.
Reference Elsinga, Ishihara, Goudar, da Silva and Hunt2017). The present ratios are somewhat different to those inferred from averaging the invariants of the strain rate tensor (da Silva & Pereira Reference da Silva and Pereira2008; Watanabe et al.
Reference Watanabe, Sakai, Nagata, Ito and Hayase2014), because the invariants depend nonlinearly on the strain rates.
(a) Conditional average profiles along
 $y_{I}$
of the principal strain rates normalized by their respective values at
$y_{I}$
of the principal strain rates normalized by their respective values at
 $y_{I}=35\unicode[STIX]{x1D702}$
. (b) The ratio of the average principal strains across the TNTI. The results shown are for shear free turbulence.
$y_{I}=35\unicode[STIX]{x1D702}$
. (b) The ratio of the average principal strains across the TNTI. The results shown are for shear free turbulence.

4 Alignments of vorticity vector and principal strain directions
As explained in the introduction, the aim of the present work is to examine the fluid motions at the TNTI in a local frame of reference based on the principal straining directions. It is, therefore, of interest to consider first the alignment of these principal directions relative to the interface, that is, relative to its normal vector,
 $\boldsymbol{n}_{I}$
. The local principal straining directions are given by the eigenvectors of the strain rate tensor,
$\boldsymbol{n}_{I}$
. The local principal straining directions are given by the eigenvectors of the strain rate tensor,
 $\unicode[STIX]{x1D740}_{i}$
, where
$\unicode[STIX]{x1D740}_{i}$
, where
 $\unicode[STIX]{x1D740}_{1}$
,
$\unicode[STIX]{x1D740}_{1}$
,
 $\unicode[STIX]{x1D740}_{2}$
and
$\unicode[STIX]{x1D740}_{2}$
and
 $\unicode[STIX]{x1D740}_{3}$
correspond to the most stretching, intermediate, and the most compressive straining direction, respectively. Their alignment can then be expressed in terms of the cosine of the angle between
$\unicode[STIX]{x1D740}_{3}$
correspond to the most stretching, intermediate, and the most compressive straining direction, respectively. Their alignment can then be expressed in terms of the cosine of the angle between
 $\boldsymbol{n}_{I}$
and
$\boldsymbol{n}_{I}$
and
 $\unicode[STIX]{x1D740}_{i}$
. Conditioned at the irrotational boundary (IB) position, within the VSL, the probability density functions (PDF) reveal a preferential alignment between the most compressive strain and the interface normal (figure 3
b), while the intermediate strain is mostly directed along the interface, i.e. perpendicular to the normal. The PDF for the most stretching strain shows a more flat distribution with a slight preference for a perpendicular orientation relative to the interface normal. For completeness, figure 3(b) also shows that the vorticity vector,
$\unicode[STIX]{x1D740}_{i}$
. Conditioned at the irrotational boundary (IB) position, within the VSL, the probability density functions (PDF) reveal a preferential alignment between the most compressive strain and the interface normal (figure 3
b), while the intermediate strain is mostly directed along the interface, i.e. perpendicular to the normal. The PDF for the most stretching strain shows a more flat distribution with a slight preference for a perpendicular orientation relative to the interface normal. For completeness, figure 3(b) also shows that the vorticity vector,
 $\unicode[STIX]{x1D74E}$
, is predominantly parallel to the TNTI, as expected, since the vortices associated with the vorticity cannot penetrate the interface and must be oriented parallel to it (da Silva & dos Reis Reference da Silva and dos Reis2011). On the non-turbulent side of the TNTI at
$\unicode[STIX]{x1D74E}$
, is predominantly parallel to the TNTI, as expected, since the vortices associated with the vorticity cannot penetrate the interface and must be oriented parallel to it (da Silva & dos Reis Reference da Silva and dos Reis2011). On the non-turbulent side of the TNTI at
 $y_{I}=-4\unicode[STIX]{x1D702}$
, the alignment of the principal straining directions are very similar to those at the IB, while the vorticity alignment changes considerably and appears nearly random at
$y_{I}=-4\unicode[STIX]{x1D702}$
, the alignment of the principal straining directions are very similar to those at the IB, while the vorticity alignment changes considerably and appears nearly random at
 $y_{I}=-4\unicode[STIX]{x1D702}$
(figure 3
a). However, notable changes in the alignment of
$y_{I}=-4\unicode[STIX]{x1D702}$
(figure 3
a). However, notable changes in the alignment of
 $\unicode[STIX]{x1D740}_{1}$
and
$\unicode[STIX]{x1D740}_{1}$
and
 $\unicode[STIX]{x1D740}_{3}$
are observed within the TSL at
$\unicode[STIX]{x1D740}_{3}$
are observed within the TSL at
 $y_{I}=4\unicode[STIX]{x1D702}$
(figure 3c). Their respective PDFs show peaks at
$y_{I}=4\unicode[STIX]{x1D702}$
(figure 3c). Their respective PDFs show peaks at
 $\cos (\unicode[STIX]{x1D703})=0.55$
and 0.9. At
$\cos (\unicode[STIX]{x1D703})=0.55$
and 0.9. At
 $y_{I}=4\unicode[STIX]{x1D702}$
, the alignments of vorticity and the intermediate principal strain are still predominantly parallel to the interface surface (figure 3
c). Here and throughout the paper,
$y_{I}=4\unicode[STIX]{x1D702}$
, the alignments of vorticity and the intermediate principal strain are still predominantly parallel to the interface surface (figure 3
c). Here and throughout the paper,
 $y_{I}=4\unicode[STIX]{x1D702}$
is taken to represent the TSL for the shear free turbulence case, since it corresponds to centre of the mean vorticity jump (figure 1
b) and the strain peak location (figure 2
a).
$y_{I}=4\unicode[STIX]{x1D702}$
is taken to represent the TSL for the shear free turbulence case, since it corresponds to centre of the mean vorticity jump (figure 1
b) and the strain peak location (figure 2
a).
The alignment between
 $\boldsymbol{n}_{I}$
and
$\boldsymbol{n}_{I}$
and
 $\unicode[STIX]{x1D740}_{i}$
within the TSL of a jet and shear free turbulence was considered by Watanabe et al. (Reference Watanabe, Sakai, Nagata, Ito and Hayase2014, Reference Watanabe, da Silva, Nagata and Sakai2017b
). Compared to the present results for shear free turbulence (figure 3
c), their PDFs for the jet (Watanabe et al.
Reference Watanabe, Sakai, Nagata, Ito and Hayase2014, figure 17) show a similar distribution for
$\unicode[STIX]{x1D740}_{i}$
within the TSL of a jet and shear free turbulence was considered by Watanabe et al. (Reference Watanabe, Sakai, Nagata, Ito and Hayase2014, Reference Watanabe, da Silva, Nagata and Sakai2017b
). Compared to the present results for shear free turbulence (figure 3
c), their PDFs for the jet (Watanabe et al.
Reference Watanabe, Sakai, Nagata, Ito and Hayase2014, figure 17) show a similar distribution for
 $\unicode[STIX]{x1D740}_{2}$
and
$\unicode[STIX]{x1D740}_{2}$
and
 $\unicode[STIX]{x1D740}_{3}$
, especially along the cross-streamwise edge of the interface, while in their jet the PDF for
$\unicode[STIX]{x1D740}_{3}$
, especially along the cross-streamwise edge of the interface, while in their jet the PDF for
 $\unicode[STIX]{x1D740}_{1}$
does not peak at
$\unicode[STIX]{x1D740}_{1}$
does not peak at
 $\cos (\unicode[STIX]{x1D703})=0.55$
. However, their shear free turbulence data (Watanabe et al.
Reference Watanabe, da Silva, Nagata and Sakai2017b
) display the same behaviour for
$\cos (\unicode[STIX]{x1D703})=0.55$
. However, their shear free turbulence data (Watanabe et al.
Reference Watanabe, da Silva, Nagata and Sakai2017b
) display the same behaviour for
 $\unicode[STIX]{x1D740}_{1}$
. This small difference between the jet and shear free turbulence remains to be explained.
$\unicode[STIX]{x1D740}_{1}$
. This small difference between the jet and shear free turbulence remains to be explained.
The preferential alignment between the normal to the interface,
 $\boldsymbol{n}_{I}$
, and the most compressive straining direction,
$\boldsymbol{n}_{I}$
, and the most compressive straining direction,
 $\unicode[STIX]{x1D740}_{3}$
, at the IB can be understood by considering that the other two principal strains are extensive (at least on average) and therefore amplify any low level/background vorticity in that direction. This causes the vorticity vector, hence the interface, to be oriented in the plane defined by those stretching directions and normal to
$\unicode[STIX]{x1D740}_{3}$
, at the IB can be understood by considering that the other two principal strains are extensive (at least on average) and therefore amplify any low level/background vorticity in that direction. This causes the vorticity vector, hence the interface, to be oriented in the plane defined by those stretching directions and normal to
 $\unicode[STIX]{x1D740}_{3}$
. It is often assumed that the large scales impose the entrainment rate by their interaction with the small scales near the TNTI, but the mechanisms involved are not completely clear. One example of such an interaction is associated with the alignments just described. Since the large scales contribute importantly to the strain in a turbulent flow, they can create significant stretching near the TNTI, which maintains the intense vortices therein (da Silva & dos Reis Reference da Silva and dos Reis2011). In that way, the large scales ultimately impose the strength of these eddies near the TNTI, hence their propagation in the direction of the irrotational flow region.
$\unicode[STIX]{x1D740}_{3}$
. It is often assumed that the large scales impose the entrainment rate by their interaction with the small scales near the TNTI, but the mechanisms involved are not completely clear. One example of such an interaction is associated with the alignments just described. Since the large scales contribute importantly to the strain in a turbulent flow, they can create significant stretching near the TNTI, which maintains the intense vortices therein (da Silva & dos Reis Reference da Silva and dos Reis2011). In that way, the large scales ultimately impose the strength of these eddies near the TNTI, hence their propagation in the direction of the irrotational flow region.
Watanabe et al. (Reference Watanabe, Sakai, Nagata, Ito and Hayase2014) have shown that for (rare) vortex compression events along the TNTI, the interface normal is preferentially aligned with the most stretching strain. Therefore, the probability for exact alignment between
 $\boldsymbol{n}_{I}$
, and
$\boldsymbol{n}_{I}$
, and
 $\unicode[STIX]{x1D740}_{1}$
does not to tend to zero, resulting in a relatively flat PDF for their cosine alignment (figure 3
b).
$\unicode[STIX]{x1D740}_{1}$
does not to tend to zero, resulting in a relatively flat PDF for their cosine alignment (figure 3
b).
PDFs of the cosine alignment between the principal strain axes
 $\unicode[STIX]{x1D740}_{i}$
, the vorticity vector
$\unicode[STIX]{x1D740}_{i}$
, the vorticity vector
 $\unicode[STIX]{x1D74E}$
and the interface normal
$\unicode[STIX]{x1D74E}$
and the interface normal
 $\boldsymbol{n}_{I}$
(a) at
$\boldsymbol{n}_{I}$
(a) at
 $y_{I}=-4\unicode[STIX]{x1D702}$
in the non-turbulent region, (b) at the irrotational boundary
$y_{I}=-4\unicode[STIX]{x1D702}$
in the non-turbulent region, (b) at the irrotational boundary
 $(y_{I}=0)$
and (c) at
$(y_{I}=0)$
and (c) at
 $y_{I}=4\unicode[STIX]{x1D702}$
, representing the TSL. The results shown are for shear free turbulence.
$y_{I}=4\unicode[STIX]{x1D702}$
, representing the TSL. The results shown are for shear free turbulence.

PDFs of the cosine alignment between the principal strain axes and the vorticity vector (a) at
 $y_{I}=-4\unicode[STIX]{x1D702}$
in the non-turbulent region, (b) at the interface
$y_{I}=-4\unicode[STIX]{x1D702}$
in the non-turbulent region, (b) at the interface
 $(y_{I}=0)$
and (c) at
$(y_{I}=0)$
and (c) at
 $y_{I}=4\unicode[STIX]{x1D702}$
distance from the interface inside the turbulence region. The results shown are for shear free turbulence.
$y_{I}=4\unicode[STIX]{x1D702}$
distance from the interface inside the turbulence region. The results shown are for shear free turbulence.

Within fully developed turbulence, it is universally observed that vorticity aligns preferentially with the intermediate principal straining direction,
 $\unicode[STIX]{x1D740}_{2}$
, while it is predominantly perpendicular to
$\unicode[STIX]{x1D740}_{2}$
, while it is predominantly perpendicular to
 $\unicode[STIX]{x1D740}_{3}$
and arbitrarily oriented with respect to
$\unicode[STIX]{x1D740}_{3}$
and arbitrarily oriented with respect to
 $\unicode[STIX]{x1D740}_{1}$
(Ashurst et al.
Reference Ashurst, Kerstein, Kerr and Gibson1987; Tsinober et al.
Reference Tsinober, Kit and Dracos1992; Vincent & Meneguzzi Reference Vincent and Meneguzzi1994; Lüthi et al.
Reference Lüthi, Tsinober and Kinzelbach2005). The same tendency was found in the TSL of a jet (Watanabe et al.
Reference Watanabe, Sakai, Nagata, Ito and Hayase2014) and is observed in figure 4(c) for shear free turbulence. However, at the IB, a preferential alignment between vorticity and the most stretching strain direction
$\unicode[STIX]{x1D740}_{1}$
(Ashurst et al.
Reference Ashurst, Kerstein, Kerr and Gibson1987; Tsinober et al.
Reference Tsinober, Kit and Dracos1992; Vincent & Meneguzzi Reference Vincent and Meneguzzi1994; Lüthi et al.
Reference Lüthi, Tsinober and Kinzelbach2005). The same tendency was found in the TSL of a jet (Watanabe et al.
Reference Watanabe, Sakai, Nagata, Ito and Hayase2014) and is observed in figure 4(c) for shear free turbulence. However, at the IB, a preferential alignment between vorticity and the most stretching strain direction
 $\unicode[STIX]{x1D740}_{1}$
is observed (figure 4
b). At the same time, there remains a weak alignment with
$\unicode[STIX]{x1D740}_{1}$
is observed (figure 4
b). At the same time, there remains a weak alignment with
 $\unicode[STIX]{x1D740}_{2}$
. The present results, obtained in shear free turbulence – thus in the absence of mean shear – are consistent with those obtained in a jet flow by Wolf et al. (Reference Wolf, Lüthi, Holzner, Krug, Kinzelbach and Tsinober2012). Compared to the internal turbulence and the TSL, vorticity stretching at the TNTI is thus more strongly affected by the most stretching principal strain rate.
$\unicode[STIX]{x1D740}_{2}$
. The present results, obtained in shear free turbulence – thus in the absence of mean shear – are consistent with those obtained in a jet flow by Wolf et al. (Reference Wolf, Lüthi, Holzner, Krug, Kinzelbach and Tsinober2012). Compared to the internal turbulence and the TSL, vorticity stretching at the TNTI is thus more strongly affected by the most stretching principal strain rate.
Finally, vorticity in the non-turbulent region is randomly oriented relative to all principal straining directions (figure 4 a), as well as the TNTI (figure 3 a). Moreover, vorticity magnitude is small there (figure 1 b), which confirms that any vorticity in the non-turbulent flow region has to be considered as numerical noise.
5 Flow and scalar patterns in the strain eigenframe
When characterizing the interaction between vorticity and strain it is convenient to do this in the reference frame given by the principal strain axes (e.g. Holzner et al. Reference Holzner, Liberzon, Nikitin, Lüthi, Kinzelbach and Tsinober2008; Watanabe et al. Reference Watanabe, Sakai, Nagata, Ito and Hayase2014). Here, the same reference frame is adopted to educe the characteristic fluid motions near the TNTI and compare them to the results for internal turbulence.
5.1 Defining the local eigenframe
For each point near the TNTI the axes of the reference frame are given by the eigenvectors of the local strain rate tensor,
 $\unicode[STIX]{x1D740}_{i}$
, which correspond to the directions of principal strain. These axes form an orthogonal basis. However, their positive directions are not well defined due to symmetry of the strain rate tensor,
$\unicode[STIX]{x1D740}_{i}$
, which correspond to the directions of principal strain. These axes form an orthogonal basis. However, their positive directions are not well defined due to symmetry of the strain rate tensor,
 $\unicode[STIX]{x1D64E}$
, that is,
$\unicode[STIX]{x1D64E}$
, that is,
 $\unicode[STIX]{x1D740}_{i}$
defines an axis rather than a specific direction. To overcome this ambiguity, the local vorticity vector,
$\unicode[STIX]{x1D740}_{i}$
defines an axis rather than a specific direction. To overcome this ambiguity, the local vorticity vector,
 $\unicode[STIX]{x1D74E}$
, is used. Because of its preferential alignment with vorticity in turbulent flow and in the TSL (figure 4
c), the positive
$\unicode[STIX]{x1D74E}$
, is used. Because of its preferential alignment with vorticity in turbulent flow and in the TSL (figure 4
c), the positive
 $\unicode[STIX]{x1D740}_{2}$
direction is chosen such that its inner product with the vorticity vector is positive. For consistency, the same criterion is used in the VSL, even if the alignment between
$\unicode[STIX]{x1D740}_{2}$
direction is chosen such that its inner product with the vorticity vector is positive. For consistency, the same criterion is used in the VSL, even if the alignment between
 $\unicode[STIX]{x1D740}_{2}$
and
$\unicode[STIX]{x1D740}_{2}$
and
 $\unicode[STIX]{x1D74E}$
is not as strong (figure 4
b). Near the TNTI
$\unicode[STIX]{x1D74E}$
is not as strong (figure 4
b). Near the TNTI
 $\unicode[STIX]{x1D740}_{3}$
is preferentially aligned with the interface normal,
$\unicode[STIX]{x1D740}_{3}$
is preferentially aligned with the interface normal,
 $\boldsymbol{n}_{I}$
(figure 3). Therefore, the positive
$\boldsymbol{n}_{I}$
(figure 3). Therefore, the positive
 $\unicode[STIX]{x1D740}_{3}$
direction is chosen such that its inner product with
$\unicode[STIX]{x1D740}_{3}$
direction is chosen such that its inner product with
 $\boldsymbol{n}_{I}$
is positive, which means the positive
$\boldsymbol{n}_{I}$
is positive, which means the positive
 $\unicode[STIX]{x1D740}_{3}$
direction points towards the turbulent side of the TNTI. The remaining
$\unicode[STIX]{x1D740}_{3}$
direction points towards the turbulent side of the TNTI. The remaining
 $\unicode[STIX]{x1D740}_{1}$
direction is adjusted to maintain a right-handed system. The resulting frame of reference is referred to as the strain eigenframe. Note that the local strain rate tensor and vorticity vector are based on the instantaneous velocity field including the mean flow, which is non-zero only for the jet.
$\unicode[STIX]{x1D740}_{1}$
direction is adjusted to maintain a right-handed system. The resulting frame of reference is referred to as the strain eigenframe. Note that the local strain rate tensor and vorticity vector are based on the instantaneous velocity field including the mean flow, which is non-zero only for the jet.
For comparison, a similar eigenframe is defined for the internal turbulent flow, far from the TNTI. The positive
 $\unicode[STIX]{x1D740}_{2}$
direction is determined as before. But away from the interface
$\unicode[STIX]{x1D740}_{2}$
direction is determined as before. But away from the interface
 $\boldsymbol{n}_{I}$
has no meaning, hence the positive
$\boldsymbol{n}_{I}$
has no meaning, hence the positive
 $\unicode[STIX]{x1D740}_{3}$
direction will be left undetermined (arbitrary). The
$\unicode[STIX]{x1D740}_{3}$
direction will be left undetermined (arbitrary). The
 $\unicode[STIX]{x1D740}_{1}$
direction is again adjusted to maintain a right-handed system. The resulting definition of the reference frame is identical to the one introduced in Elsinga & Marusic (Reference Elsinga and Marusic2010).
$\unicode[STIX]{x1D740}_{1}$
direction is again adjusted to maintain a right-handed system. The resulting definition of the reference frame is identical to the one introduced in Elsinga & Marusic (Reference Elsinga and Marusic2010).
Then, the velocity and scalar field around a data point are resampled onto a uniform rectangular grid with coordinates
 $(\unicode[STIX]{x1D709}_{1},\unicode[STIX]{x1D709}_{2},\unicode[STIX]{x1D709}_{3})$
along the corresponding local
$(\unicode[STIX]{x1D709}_{1},\unicode[STIX]{x1D709}_{2},\unicode[STIX]{x1D709}_{3})$
along the corresponding local
 $\unicode[STIX]{x1D740}_{i}$
directions defined above. However, the sign of the passive scalar,
$\unicode[STIX]{x1D740}_{i}$
directions defined above. However, the sign of the passive scalar,
 $\unicode[STIX]{x1D719}$
, is adjusted, such that in the considered data point, the scalar gradient in the direction of
$\unicode[STIX]{x1D719}$
, is adjusted, such that in the considered data point, the scalar gradient in the direction of
 $\unicode[STIX]{x1D740}_{3}$
is positive. This prevents the negative and positive scalar values to cancel in the averaging (in the shear free turbulence case), which would lead to a trivial result. Note that symmetry exists in the governing equation for a passive scalar, such that, if
$\unicode[STIX]{x1D740}_{3}$
is positive. This prevents the negative and positive scalar values to cancel in the averaging (in the shear free turbulence case), which would lead to a trivial result. Note that symmetry exists in the governing equation for a passive scalar, such that, if
 $\unicode[STIX]{x1D719}$
is a solution then so is
$\unicode[STIX]{x1D719}$
is a solution then so is
 $-\unicode[STIX]{x1D719}$
.
$-\unicode[STIX]{x1D719}$
.
Finally, the resampled velocity and scalar fields on
 $(\unicode[STIX]{x1D709}_{1},\unicode[STIX]{x1D709}_{2},\unicode[STIX]{x1D709}_{3})$
are averaged over all data points considered. Conditional averaging is performed for data points on the IB
$(\unicode[STIX]{x1D709}_{1},\unicode[STIX]{x1D709}_{2},\unicode[STIX]{x1D709}_{3})$
are averaged over all data points considered. Conditional averaging is performed for data points on the IB
 $(y_{I}=0)$
, on
$(y_{I}=0)$
, on
 $y_{I}=4\unicode[STIX]{x1D702}$
(representing the TSL) and for the internal turbulence region. The resulting flow field represents the average flow pattern around the origin,
$y_{I}=4\unicode[STIX]{x1D702}$
(representing the TSL) and for the internal turbulence region. The resulting flow field represents the average flow pattern around the origin,
 $(\unicode[STIX]{x1D709}_{1},\unicode[STIX]{x1D709}_{2},\unicode[STIX]{x1D709}_{3})=(0,0,0)$
, as seen when the observer is aligned with the local principal strain axes.
$(\unicode[STIX]{x1D709}_{1},\unicode[STIX]{x1D709}_{2},\unicode[STIX]{x1D709}_{3})=(0,0,0)$
, as seen when the observer is aligned with the local principal strain axes.
Section 5.2 discusses the average flow velocity in the eigenframe for shear free turbulence, while the corresponding scalar field is examined in § 5.3. Results for the jet will be presented in § 5.4.
Average flow and scalar patterns in the strain eigenframe conditioned at the IB
 $(y_{I}=0)$
(a–c); conditioned at
$(y_{I}=0)$
(a–c); conditioned at
 $y_{I}=4\unicode[STIX]{x1D702}$
on the turbulent side of the interface (d–f) and; for internal turbulence (g–i). Vectors represent the average velocity. The contours show the average scalar fluctuations normalized by its maximum value. (a,d,g), (b,e,h), (c,f,i) Show the cross-planes
$y_{I}=4\unicode[STIX]{x1D702}$
on the turbulent side of the interface (d–f) and; for internal turbulence (g–i). Vectors represent the average velocity. The contours show the average scalar fluctuations normalized by its maximum value. (a,d,g), (b,e,h), (c,f,i) Show the cross-planes
 $\unicode[STIX]{x1D709}_{2}=0,\unicode[STIX]{x1D709}_{3}=0$
and
$\unicode[STIX]{x1D709}_{2}=0,\unicode[STIX]{x1D709}_{3}=0$
and
 $\unicode[STIX]{x1D709}_{1}=0$
respectively. The red dashed lines and circles in (a) and (g) indicate shear-layer and vortical flow topologies respectively.
$\unicode[STIX]{x1D709}_{1}=0$
respectively. The red dashed lines and circles in (a) and (g) indicate shear-layer and vortical flow topologies respectively.

5.2 Average flow velocity
The resulting average flow patterns in the strain eigenframe are presented in figure 5. When conditioned at the IB (figure 5
a–c), a saddle-node flow topology is observed on the non-turbulent side
 $(\unicode[STIX]{x1D709}_{3}<0)$
. Here, the point of averaging (corresponding to
$(\unicode[STIX]{x1D709}_{3}<0)$
. Here, the point of averaging (corresponding to
 $(\unicode[STIX]{x1D709}_{1},\unicode[STIX]{x1D709}_{2},\unicode[STIX]{x1D709}_{3})=(0,0,0)$
) is on the IB, and since the interface normal predominantly aligns with the most compressive straining direction, we can take the plane
$(\unicode[STIX]{x1D709}_{1},\unicode[STIX]{x1D709}_{2},\unicode[STIX]{x1D709}_{3})=(0,0,0)$
) is on the IB, and since the interface normal predominantly aligns with the most compressive straining direction, we can take the plane
 $\unicode[STIX]{x1D709}_{3}=0$
as representing the IB position in figure 5(a–c). In doing so, any interface curvature at this scale is ignored. On the IB (
$\unicode[STIX]{x1D709}_{3}=0$
as representing the IB position in figure 5(a–c). In doing so, any interface curvature at this scale is ignored. On the IB (
 $\unicode[STIX]{x1D709}_{3}=0$
plane, figure 5
b) stretching is observed in all directions, as expected, because the
$\unicode[STIX]{x1D709}_{3}=0$
plane, figure 5
b) stretching is observed in all directions, as expected, because the
 $\unicode[STIX]{x1D709}_{1}$
and
$\unicode[STIX]{x1D709}_{1}$
and
 $\unicode[STIX]{x1D709}_{2}$
directions correspond to positive average principal strain rates. The present average flow pattern is similar to those along an actual interface as visualized by the instantaneous streamlines in Bisset et al. (Reference Bisset, Hunt and Rogers2002), see their figure 16. As noted before, these stretching motions along the interface are important, because they are responsible for keeping the TNTI thin (e.g. Bisset et al.
Reference Bisset, Hunt and Rogers2002; da Silva et al.
Reference da Silva, Hunt, Eames and Westerweel2014). The stretching in the
$\unicode[STIX]{x1D709}_{2}$
directions correspond to positive average principal strain rates. The present average flow pattern is similar to those along an actual interface as visualized by the instantaneous streamlines in Bisset et al. (Reference Bisset, Hunt and Rogers2002), see their figure 16. As noted before, these stretching motions along the interface are important, because they are responsible for keeping the TNTI thin (e.g. Bisset et al.
Reference Bisset, Hunt and Rogers2002; da Silva et al.
Reference da Silva, Hunt, Eames and Westerweel2014). The stretching in the
 $\unicode[STIX]{x1D709}_{2}$
direction appears to be associated with fluid motions on the turbulent side of the interface
$\unicode[STIX]{x1D709}_{2}$
direction appears to be associated with fluid motions on the turbulent side of the interface
 $(\unicode[STIX]{x1D709}_{3}>0)$
, since the stretching in the
$(\unicode[STIX]{x1D709}_{3}>0)$
, since the stretching in the
 $\unicode[STIX]{x1D709}_{2}$
direction is negligible on the non-turbulent side (figures 5
c and 2). Also on the turbulent side, a focus, i.e. swirling motion, is observed in the
$\unicode[STIX]{x1D709}_{2}$
direction is negligible on the non-turbulent side (figures 5
c and 2). Also on the turbulent side, a focus, i.e. swirling motion, is observed in the
 $\unicode[STIX]{x1D709}_{2}=0$
plane (marked by a red circle in figure 5
a), whose edge contributes to the vorticity along the part of the interface where
$\unicode[STIX]{x1D709}_{2}=0$
plane (marked by a red circle in figure 5
a), whose edge contributes to the vorticity along the part of the interface where
 $\unicode[STIX]{x1D709}_{1}<0$
. Along the other part
$\unicode[STIX]{x1D709}_{1}<0$
. Along the other part
 $(\unicode[STIX]{x1D709}_{1}>0)$
the interface vorticity is associated with a shear-layer topology (indicated by the red dashed line in figure 5
a), where the magnitude of the velocity component in the
$(\unicode[STIX]{x1D709}_{1}>0)$
the interface vorticity is associated with a shear-layer topology (indicated by the red dashed line in figure 5
a), where the magnitude of the velocity component in the
 $\unicode[STIX]{x1D709}_{1}$
direction increases across the TNTI. The general flow pattern in figure 5(a) is reminiscent of the instantaneous flow structure shown by Bisset et al. (Reference Bisset, Hunt and Rogers2002) for the TNTI of a wake (their figure 15a in particular). Their plot also includes a neighbouring focus illustrating how the general pattern of figure 5(a) may be repeated along the TNTI.
$\unicode[STIX]{x1D709}_{1}$
direction increases across the TNTI. The general flow pattern in figure 5(a) is reminiscent of the instantaneous flow structure shown by Bisset et al. (Reference Bisset, Hunt and Rogers2002) for the TNTI of a wake (their figure 15a in particular). Their plot also includes a neighbouring focus illustrating how the general pattern of figure 5(a) may be repeated along the TNTI.
The research interest in the TNTI is largely given by the fact that the growth of a turbulent flow region can be understood from the propagation of the vorticity associated with the TNTI into the irrotational flow region. This process can be described by the enstrophy transport equation (e.g. Holzner & Lüthi Reference Holzner and Lüthi2011; Watanabe et al. Reference Watanabe, Sakai, Nagata, Ito and Hayase2014; Silva & da Silva Reference Silva and da Silva2017):
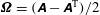
 $$\begin{eqnarray}\frac{\text{D}\unicode[STIX]{x1D714}^{2}/2}{\text{D}t}=\underbrace{\unicode[STIX]{x1D714}_{i}\unicode[STIX]{x1D714}_{j}\unicode[STIX]{x1D61A}_{ij}}_{production}+\underbrace{\unicode[STIX]{x1D708}\unicode[STIX]{x1D6FB}^{2}(\unicode[STIX]{x1D714}^{2}/2)}_{diffusion}-\underbrace{\unicode[STIX]{x1D708}(\unicode[STIX]{x1D735}\unicode[STIX]{x1D714})^{2}}_{dissipation},\end{eqnarray}$$
where
 $\unicode[STIX]{x1D708}$
is the kinematic viscosity. In order to assess whether the average flow structure conditioned at the TNTI (figure 5
a–c) captures the relevant processes, we evaluate the different terms on the right-hand side of (5.1) and compare with data from actual TNTIs available in the literature. The resulting profiles across the interface in the average flow structure are presented in figure 6(a) and they appear qualitatively consistent with those conditionally averaged along an actual TNTI (Taveira & da Silva Reference Taveira and da Silva2014; Silva & da Silva Reference Silva and da Silva2017, represented as dashed lines in figure 6). Specifically, around the IB
$\unicode[STIX]{x1D708}$
is the kinematic viscosity. In order to assess whether the average flow structure conditioned at the TNTI (figure 5
a–c) captures the relevant processes, we evaluate the different terms on the right-hand side of (5.1) and compare with data from actual TNTIs available in the literature. The resulting profiles across the interface in the average flow structure are presented in figure 6(a) and they appear qualitatively consistent with those conditionally averaged along an actual TNTI (Taveira & da Silva Reference Taveira and da Silva2014; Silva & da Silva Reference Silva and da Silva2017, represented as dashed lines in figure 6). Specifically, around the IB
 $(\unicode[STIX]{x1D709}_{3}=0)$
viscous diffusion dominates, as expected, while beyond
$(\unicode[STIX]{x1D709}_{3}=0)$
viscous diffusion dominates, as expected, while beyond
 $\unicode[STIX]{x1D709}_{3}\approx 4\unicode[STIX]{x1D702}$
, enstrophy production is larger than diffusion, which marks the transition from the VSL to the TSL. The TSL extends up to
$\unicode[STIX]{x1D709}_{3}\approx 4\unicode[STIX]{x1D702}$
, enstrophy production is larger than diffusion, which marks the transition from the VSL to the TSL. The TSL extends up to
 ${\sim}10\unicode[STIX]{x1D702}$
, where enstrophy reaches its peak. The locations of both VSL and TSL are well represented in the average flow structure. As such, the present flow structure gives considerably more information compared to a simple Burgers vortex representation of the flow field nearby the IB (Watanabe et al.
Reference Watanabe, Jaulino, Taveira, da Silva, Nagata and Sakai2017a
), which only reproduces some aspects of the VSL, because the complex strain/vorticity interaction is not well captured by the Burgers vortex model. However, while the oscillation in the diffusion profile near the TNTI is captured, its magnitude is overestimated by the average flow structure. Beyond
${\sim}10\unicode[STIX]{x1D702}$
, where enstrophy reaches its peak. The locations of both VSL and TSL are well represented in the average flow structure. As such, the present flow structure gives considerably more information compared to a simple Burgers vortex representation of the flow field nearby the IB (Watanabe et al.
Reference Watanabe, Jaulino, Taveira, da Silva, Nagata and Sakai2017a
), which only reproduces some aspects of the VSL, because the complex strain/vorticity interaction is not well captured by the Burgers vortex model. However, while the oscillation in the diffusion profile near the TNTI is captured, its magnitude is overestimated by the average flow structure. Beyond
 $\unicode[STIX]{x1D709}_{3}=10\unicode[STIX]{x1D702}$
, the present profiles decrease towards zero, since there is no additional small-scale turbulence in this simple (average) flow structure. This means that small-scale turbulence away from the TNTI is uncorrelated with the interface structure.
$\unicode[STIX]{x1D709}_{3}=10\unicode[STIX]{x1D702}$
, the present profiles decrease towards zero, since there is no additional small-scale turbulence in this simple (average) flow structure. This means that small-scale turbulence away from the TNTI is uncorrelated with the interface structure.
The present average structure for the interface (figure 5
a–c) can also be used to examine the invariants of the velocity gradient tensor, which are related to local flow topology (Chong et al.
Reference Chong, Perry and Cantwell1990). Scatter plots for the invariants at different distances to the interface are presented in figure 7. At the IB, the distribution of the invariants reveals a tail corresponding to nodal topologies. The length of the tail grows across the VSL (from figures 7
a to 7
b) before the focal topologies
 $(Q>0)$
quickly develop in the TSL (figure 7
c,d). This reproduces some basic developments of the actual joint PDF of the invariant across the TNTI (Watanabe et al.
Reference Watanabe, Jaulino, Taveira, da Silva, Nagata and Sakai2017a
). These results for enstrophy transport and the invariants demonstrate that the present flow structure (figure 5
a–c) captures relevant features of the actual TNTI layer.
$(Q>0)$
quickly develop in the TSL (figure 7
c,d). This reproduces some basic developments of the actual joint PDF of the invariant across the TNTI (Watanabe et al.
Reference Watanabe, Jaulino, Taveira, da Silva, Nagata and Sakai2017a
). These results for enstrophy transport and the invariants demonstrate that the present flow structure (figure 5
a–c) captures relevant features of the actual TNTI layer.
Terms in the enstrophy transport equation, equation (5.1), (a, solid lines) and the scalar gradient transport equation, (5.2), (b, solid lines) versus
 $\unicode[STIX]{x1D709}_{3}$
for the average flow in the strain eigenframe conditioned at the shear free TNTI (figure 5
a–c). Here,
$\unicode[STIX]{x1D709}_{3}$
for the average flow in the strain eigenframe conditioned at the shear free TNTI (figure 5
a–c). Here,
 $\unicode[STIX]{x1D709}_{3}$
represents the distance to the TNTI, as
$\unicode[STIX]{x1D709}_{3}$
represents the distance to the TNTI, as
 $\unicode[STIX]{x1D709}_{3}$
aligns approximately with the interface, see figure 3(b). The profiles have been averaged along the other two directions, i.e.
$\unicode[STIX]{x1D709}_{3}$
aligns approximately with the interface, see figure 3(b). The profiles have been averaged along the other two directions, i.e.
 $\unicode[STIX]{x1D709}_{1}$
and
$\unicode[STIX]{x1D709}_{1}$
and
 $\unicode[STIX]{x1D709}_{2}$
. The enstrophy and scalar gradient profiles are normalized by their respective maxima, while the terms in the transport equations are normalized by the maximum of the production term. Thin dashed lines show the corresponding conditional averaged profiles along the actual TNTI for comparison.
$\unicode[STIX]{x1D709}_{2}$
. The enstrophy and scalar gradient profiles are normalized by their respective maxima, while the terms in the transport equations are normalized by the maximum of the production term. Thin dashed lines show the corresponding conditional averaged profiles along the actual TNTI for comparison.

Scatter plots of the velocity gradient tensor invariants in several planes of constant
 $\unicode[STIX]{x1D709}_{3}$
, where
$\unicode[STIX]{x1D709}_{3}$
, where
 $\unicode[STIX]{x1D709}_{3}$
represents the distance to the IB.
$\unicode[STIX]{x1D709}_{3}$
represents the distance to the IB.
 $Q$
and
$Q$
and
 $R$
represent the second and third invariant respectively (Chong et al.
Reference Chong, Perry and Cantwell1990). The null discriminant is indicated by the solid (red) line. For points above this line the local flow topology is focal, while it is nodal below this line. The results shown are for the average flow in the strain eigenframe conditioned at shear free turbulence IB (figure 5
a–c).
$R$
represent the second and third invariant respectively (Chong et al.
Reference Chong, Perry and Cantwell1990). The null discriminant is indicated by the solid (red) line. For points above this line the local flow topology is focal, while it is nodal below this line. The results shown are for the average flow in the strain eigenframe conditioned at shear free turbulence IB (figure 5
a–c).

When conditioning on
 $y_{I}=4\unicode[STIX]{x1D702}$
, the average flow in the strain eigenframe appears similar but exhibits an angle with respect to the result conditioned at the interface (compare figure 5
d–f and 5
a–c). In the
$y_{I}=4\unicode[STIX]{x1D702}$
, the average flow in the strain eigenframe appears similar but exhibits an angle with respect to the result conditioned at the interface (compare figure 5
d–f and 5
a–c). In the
 $\unicode[STIX]{x1D709}_{2}=0$
plane, the TNTI is on the diagonal, where the lower left corner and the upper right corner correspond to the non-turbulent and turbulent side respectively (figure 5
d). As before, a saddle point flow structure is seen on the non-turbulent side, while on the turbulent side the flow is mostly towards and along the interface. Furthermore, a weak swirling motion is observed near the interface in the lower right corner of figure 5(d), which is associated with the local interface vorticity. The remainder of the interface, in the upper left corner of this plot, is again related to a shear-layer-type flow topology. The flow in the other two cross-planes (figure 5
e,f) reveals only minor differences with respect to the flow conditioned at the IB (figures 5
b,c). We conclude that the conditionally averaged flow structures at
$\unicode[STIX]{x1D709}_{2}=0$
plane, the TNTI is on the diagonal, where the lower left corner and the upper right corner correspond to the non-turbulent and turbulent side respectively (figure 5
d). As before, a saddle point flow structure is seen on the non-turbulent side, while on the turbulent side the flow is mostly towards and along the interface. Furthermore, a weak swirling motion is observed near the interface in the lower right corner of figure 5(d), which is associated with the local interface vorticity. The remainder of the interface, in the upper left corner of this plot, is again related to a shear-layer-type flow topology. The flow in the other two cross-planes (figure 5
e,f) reveals only minor differences with respect to the flow conditioned at the IB (figures 5
b,c). We conclude that the conditionally averaged flow structures at
 $y_{I}=0$
and
$y_{I}=0$
and
 $4\unicode[STIX]{x1D702}$
are very similar, apart from the rotation of the eigenframe relative to the interface. The eigenframe rotation is consistent with the changes in the orientation of the most stretching and compressive straining directions with respect to the interface normal over the same range of
$4\unicode[STIX]{x1D702}$
are very similar, apart from the rotation of the eigenframe relative to the interface. The eigenframe rotation is consistent with the changes in the orientation of the most stretching and compressive straining directions with respect to the interface normal over the same range of
 $y_{I}$
(figure 3
b,c). This rotation is then perceived by a fluid parcel when it is entrained, i.e. when it moves through the VSL.
$y_{I}$
(figure 3
b,c). This rotation is then perceived by a fluid parcel when it is entrained, i.e. when it moves through the VSL.
The average flow in the strain eigenframe for internal turbulence is included in figure 5(g–i) for comparison. This result is consistent with previous work (Elsinga & Marusic Reference Elsinga and Marusic2010; Elsinga et al.
Reference Elsinga, Ishihara, Goudar, da Silva and Hunt2017), where the main features are summarized as follows. The
 $\unicode[STIX]{x1D709}_{2}=0$
plane reveals a shear layer with coincident vortices, which are indicated by the red dashed line and the circles respectively. The flow direction on either side of the shear layer is nearly uniform, that is, there is no sign of a saddle topology at the scale of the plot. This average shear-layer structure is representative of the internal turbulence as discussed in the introduction.
$\unicode[STIX]{x1D709}_{2}=0$
plane reveals a shear layer with coincident vortices, which are indicated by the red dashed line and the circles respectively. The flow direction on either side of the shear layer is nearly uniform, that is, there is no sign of a saddle topology at the scale of the plot. This average shear-layer structure is representative of the internal turbulence as discussed in the introduction.
Furthermore, the shear-layer flow structure for internal turbulence does not sensitively depend on a conditioning on dissipation layers or vortex layers. This can be seen by comparing the unconditional average in the eigenframe (figure 5
g) with those obtained by averaging only over those points where the dissipation or the vortex sheet detection parameter (Horiuti & Takagi Reference Horiuti and Takagi2005) exceed a specified threshold (figure 8). Here, the vortex sheets were detected using the largest remaining eigenvalue of the symmetric second-order velocity gradient tensor
 $(\unicode[STIX]{x1D609}_{ij}=\unicode[STIX]{x1D61A}_{ik}\unicode[STIX]{x1D6FA}_{kj}+\unicode[STIX]{x1D61A}_{jk}\unicode[STIX]{x1D6FA}_{ki})$
as proposed by Horiuti & Takagi (Reference Horiuti and Takagi2005). The conditioning threshold was set at one standard deviation above the respective means. At the scale of the plot, the same shear-layer flow structure is clearly present in all cases. However, there are some minor differences at the finest scales near the origin, which are associated with the different types of conditioning events. When conditioning on dissipation (figure 8
a), the local flow topology at the origin is that of a saddle point similar to the unconditional result (figure 5
g), although shear dominates. But when conditioning on vortex sheets (figure 8
b), the local flow topology at the origin reveals a shear layer, consistent with the prescribed condition. These differences appear at the scale of several
$(\unicode[STIX]{x1D609}_{ij}=\unicode[STIX]{x1D61A}_{ik}\unicode[STIX]{x1D6FA}_{kj}+\unicode[STIX]{x1D61A}_{jk}\unicode[STIX]{x1D6FA}_{ki})$
as proposed by Horiuti & Takagi (Reference Horiuti and Takagi2005). The conditioning threshold was set at one standard deviation above the respective means. At the scale of the plot, the same shear-layer flow structure is clearly present in all cases. However, there are some minor differences at the finest scales near the origin, which are associated with the different types of conditioning events. When conditioning on dissipation (figure 8
a), the local flow topology at the origin is that of a saddle point similar to the unconditional result (figure 5
g), although shear dominates. But when conditioning on vortex sheets (figure 8
b), the local flow topology at the origin reveals a shear layer, consistent with the prescribed condition. These differences appear at the scale of several
 $\unicode[STIX]{x1D702}$
, which is below the scale of the shear layer. This suggests that these finest-scale dissipation and vortex sheet features are part of a cluster that forms the shear layer (scales larger than
$\unicode[STIX]{x1D702}$
, which is below the scale of the shear layer. This suggests that these finest-scale dissipation and vortex sheet features are part of a cluster that forms the shear layer (scales larger than
 $20\unicode[STIX]{x1D702}$
). Such shear layers are characteristic features of internal turbulence (§ 1 and Elsinga et al.
Reference Elsinga, Ishihara, Goudar, da Silva and Hunt2017), and therefore they appear already in the unconditional average flow in the eigenframe. It should be pointed out that the present comparison of the structures is qualitative. The velocity magnitude associated with the shear layers depends on the conditioning threshold. A quantification of this effect for a conditioning on dissipation can be found in Elsinga et al. (Reference Elsinga, Ishihara, Goudar, da Silva and Hunt2017). Since the unconditional averaging is more general and does require the inevitably arbitrary selection of a threshold, we will base the subsequent discussion on that case, keeping in mind that the conditional average results are quite similar.
$20\unicode[STIX]{x1D702}$
). Such shear layers are characteristic features of internal turbulence (§ 1 and Elsinga et al.
Reference Elsinga, Ishihara, Goudar, da Silva and Hunt2017), and therefore they appear already in the unconditional average flow in the eigenframe. It should be pointed out that the present comparison of the structures is qualitative. The velocity magnitude associated with the shear layers depends on the conditioning threshold. A quantification of this effect for a conditioning on dissipation can be found in Elsinga et al. (Reference Elsinga, Ishihara, Goudar, da Silva and Hunt2017). Since the unconditional averaging is more general and does require the inevitably arbitrary selection of a threshold, we will base the subsequent discussion on that case, keeping in mind that the conditional average results are quite similar.
Conditionally averaged flow and scalar patterns in the strain eigenframe for internal turbulence, (a) conditioned on dissipation, (b) conditioned on the vortex layer detection parameter (Horiuti & Takagi Reference Horiuti and Takagi2005). The conditioning is based on the respective quantities exceeding a threshold of one standard deviation above their mean. Vectors represent the average velocity in the cross-plane
 $\unicode[STIX]{x1D709}_{2}=0$
. The contours show the average scalar fluctuations normalized by its maximum value. Notice that both panels are very similar to the unconditional results shown in figure 5(g). The flow patterns in the other two cross-planes are nearly identical to figure 5(h,i) (not shown).
$\unicode[STIX]{x1D709}_{2}=0$
. The contours show the average scalar fluctuations normalized by its maximum value. Notice that both panels are very similar to the unconditional results shown in figure 5(g). The flow patterns in the other two cross-planes are nearly identical to figure 5(h,i) (not shown).

When comparing the result at the TNTI (figure 5 a–c) with the internal shear layer (figure 5 g–i), we observe a clear difference. The TNTI layer is dominated by a saddle point type structure, albeit containing a vortex, while the internal layer is a shear layer with largely uniform flow regions on either side. For the TNTI the strain rate is significant across the layer, while the vorticity magnitude is low by comparison (in the VSL). However, internal layers (in the turbulent core) contain significant strain and vorticity. As a result the most compressive principal straining direction is at a 45 degree angle with respect to the internal shear layer, while it is perpendicular to the TNTI. This has important implications for the scalar field associated with these layers as discussed in the next section.
5.3 Scalar field
The average scalar field for internal turbulence (figure 5
g–i) reveals a sharp gradient at the point of averaging, i.e. the origin of the strain eigenframe, and a more gradual variation away from the origin in the
 $\unicode[STIX]{x1D709}_{3}$
direction. This appears consistent with the ramp-and-cliff structures observed in instantaneous scalar fields (Antonia et al.
Reference Antonia, Chambers, Britz and Browne1986; Holzer & Siggia Reference Holzer and Siggia1994), where the cliff corresponds to the rapid change in the scalar at the origin and the ramp to gradual variation away from the origin. The ramp-and-cliff structure has been associated with a direct link between the large and the small scales in scalar dispersion (Warhaft Reference Warhaft2000; Brethouwer, Hunt & Nieuwstadt Reference Brethouwer, Hunt and Nieuwstadt2003). Similarly, the shear-layer velocity structure has been associated with small-scale anisotropy and direct large-scale–small-scale velocity interaction (Elsinga & Marusic Reference Elsinga and Marusic2016; Elsinga et al.
Reference Elsinga, Ishihara, Goudar, da Silva and Hunt2017). The present result links these topics and suggests statistical relevance.
$\unicode[STIX]{x1D709}_{3}$
direction. This appears consistent with the ramp-and-cliff structures observed in instantaneous scalar fields (Antonia et al.
Reference Antonia, Chambers, Britz and Browne1986; Holzer & Siggia Reference Holzer and Siggia1994), where the cliff corresponds to the rapid change in the scalar at the origin and the ramp to gradual variation away from the origin. The ramp-and-cliff structure has been associated with a direct link between the large and the small scales in scalar dispersion (Warhaft Reference Warhaft2000; Brethouwer, Hunt & Nieuwstadt Reference Brethouwer, Hunt and Nieuwstadt2003). Similarly, the shear-layer velocity structure has been associated with small-scale anisotropy and direct large-scale–small-scale velocity interaction (Elsinga & Marusic Reference Elsinga and Marusic2016; Elsinga et al.
Reference Elsinga, Ishihara, Goudar, da Silva and Hunt2017). The present result links these topics and suggests statistical relevance.
The evolution of the scalar gradients and the development of cliff structures can be understood from the scalar gradient transport equation:
 $$\begin{eqnarray}\frac{\text{D}G^{2}/2}{\text{D}t}=-\underbrace{G_{i}G_{j}\unicode[STIX]{x1D61A}_{ij}}_{production}+\underbrace{\unicode[STIX]{x1D6FE}\unicode[STIX]{x1D6FB}^{2}(G^{2}/2)}_{diffusion}-\underbrace{\unicode[STIX]{x1D6FE}(\unicode[STIX]{x1D735}G)^{2}}_{dissipation},\end{eqnarray}$$
where
 $\boldsymbol{G}=\unicode[STIX]{x1D735}\unicode[STIX]{x1D719}$
is the scalar gradient, and
$\boldsymbol{G}=\unicode[STIX]{x1D735}\unicode[STIX]{x1D719}$
is the scalar gradient, and
 $\unicode[STIX]{x1D6FE}$
is the scalar diffusivity. By analogy to enstrophy production, the production of scalar gradient magnitude (or
$\unicode[STIX]{x1D6FE}$
is the scalar diffusivity. By analogy to enstrophy production, the production of scalar gradient magnitude (or
 $G^{2}$
) depends on the alignment of the scalar gradient with the principal straining directions and the principal strain rates (e.g. Ashurst et al.
Reference Ashurst, Kerstein, Kerr and Gibson1987; Vedula, Yeung & Fox Reference Vedula, Yeung and Fox2001). Therefore, regions of high dissipation of turbulent kinetic energy (i.e. high strain rate) and high
$G^{2}$
) depends on the alignment of the scalar gradient with the principal straining directions and the principal strain rates (e.g. Ashurst et al.
Reference Ashurst, Kerstein, Kerr and Gibson1987; Vedula, Yeung & Fox Reference Vedula, Yeung and Fox2001). Therefore, regions of high dissipation of turbulent kinetic energy (i.e. high strain rate) and high
 $G^{2}$
(i.e. cliffs) are correlated (Ashurst et al.
Reference Ashurst, Kerstein, Kerr and Gibson1987; Brethouwer et al.
Reference Brethouwer, Hunt and Nieuwstadt2003), but only weakly (Kothnur & Clemens Reference Kothnur and Clemens2005). The latter can be explained by a history effect, in that the intense scalar gradient sheet can convect away from the straining flow structure that produced it initially, and it takes time before this scalar dissipation sheet is then fully diffused and disappears (depending on
$G^{2}$
(i.e. cliffs) are correlated (Ashurst et al.
Reference Ashurst, Kerstein, Kerr and Gibson1987; Brethouwer et al.
Reference Brethouwer, Hunt and Nieuwstadt2003), but only weakly (Kothnur & Clemens Reference Kothnur and Clemens2005). The latter can be explained by a history effect, in that the intense scalar gradient sheet can convect away from the straining flow structure that produced it initially, and it takes time before this scalar dissipation sheet is then fully diffused and disappears (depending on
 $Sc$
). Furthermore, strain needs to persist allowing the intense scalar gradient sheet to develop. However, the most intense strain regions are associated with very short time scales (e.g. Elsinga et al.
Reference Elsinga, Ishihara, Goudar, da Silva and Hunt2017). The present results for the turbulent core are consistent with observations of a weak correlation between strain and scalar gradient (Kothnur & Clemens Reference Kothnur and Clemens2005). For reference, the correlation coefficient between the fluctuations in the strain magnitude,
$Sc$
). Furthermore, strain needs to persist allowing the intense scalar gradient sheet to develop. However, the most intense strain regions are associated with very short time scales (e.g. Elsinga et al.
Reference Elsinga, Ishihara, Goudar, da Silva and Hunt2017). The present results for the turbulent core are consistent with observations of a weak correlation between strain and scalar gradient (Kothnur & Clemens Reference Kothnur and Clemens2005). For reference, the correlation coefficient between the fluctuations in the strain magnitude,
 $\sqrt{\unicode[STIX]{x1D61A}_{ij}\unicode[STIX]{x1D61A}_{ij}}$
, and fluctuations in the scalar gradient magnitude,
$\sqrt{\unicode[STIX]{x1D61A}_{ij}\unicode[STIX]{x1D61A}_{ij}}$
, and fluctuations in the scalar gradient magnitude,
 $|G|$
, is 0.14 for the turbulent core in the present DNS. Note however, that the orientation of the scalar gradient is ‘correlated’ with the principal straining directions, in the sense that the angle between them has a clear peak (figures 10 and 11 to be discussed in § 6), which leads to the coherence observed for the average scalar field in the strain eigenframe. Given that the magnitude of the scalar gradient can be inferred by looking into the spatial variation of the scalar field in figures 5, indeed we can observe a maximum in the scalar gradient at the point of maximum dissipation, i.e. the origin (
$|G|$
, is 0.14 for the turbulent core in the present DNS. Note however, that the orientation of the scalar gradient is ‘correlated’ with the principal straining directions, in the sense that the angle between them has a clear peak (figures 10 and 11 to be discussed in § 6), which leads to the coherence observed for the average scalar field in the strain eigenframe. Given that the magnitude of the scalar gradient can be inferred by looking into the spatial variation of the scalar field in figures 5, indeed we can observe a maximum in the scalar gradient at the point of maximum dissipation, i.e. the origin (
 $\unicode[STIX]{x1D709}_{3}\approx 0$
and
$\unicode[STIX]{x1D709}_{3}\approx 0$
and
 $\unicode[STIX]{x1D709}_{1}\approx 0$
). However, the magnitude of the maximum scalar gradient in the eigenframe is low with respect to the maxima in the instantaneous turbulent flow, and corresponds to 78 % of the turbulent mean. Furthermore, the scalar gradient maximum is associated with the unstable saddle-node topology (at the origin in figure 5
g–i) consistent with observations in fully developed turbulence (Brethouwer et al.
Reference Brethouwer, Hunt and Nieuwstadt2003; O’Neill & Soria Reference O’Neill and Soria2005).
$\unicode[STIX]{x1D709}_{1}\approx 0$
). However, the magnitude of the maximum scalar gradient in the eigenframe is low with respect to the maxima in the instantaneous turbulent flow, and corresponds to 78 % of the turbulent mean. Furthermore, the scalar gradient maximum is associated with the unstable saddle-node topology (at the origin in figure 5
g–i) consistent with observations in fully developed turbulence (Brethouwer et al.
Reference Brethouwer, Hunt and Nieuwstadt2003; O’Neill & Soria Reference O’Neill and Soria2005).
Experimental (Su & Dahm Reference Su and Dahm1996; Kothnur & Clemens Reference Kothnur and Clemens2005) and DNS (Ashurst et al.
Reference Ashurst, Kerstein, Kerr and Gibson1987; Vedula et al.
Reference Vedula, Yeung and Fox2001) studies have suggested that the scalar gradient preferentially aligns with the most compressive principal strain, where the most probable angle between the two vectors is zero degrees. The present results for internal turbulence show that this is a simplification. Indeed, at the origin of the eigenframe the scalar gradient, which is pointing in the direction normal to the scalar iso-contours, is at an angle with respect to the
 $\unicode[STIX]{x1D709}_{3}$
direction (figures 5
g and 8). This is important, because, as discussed before, the alignment between the strain and the scalar gradient determines the production rate of scalar gradients. Assuming that the most compressive strain and the scalar gradient are perfectly aligned would overpredict the production rate. In § 6 we revisit this issue for the instantaneous turbulent flow.
$\unicode[STIX]{x1D709}_{3}$
direction (figures 5
g and 8). This is important, because, as discussed before, the alignment between the strain and the scalar gradient determines the production rate of scalar gradients. Assuming that the most compressive strain and the scalar gradient are perfectly aligned would overpredict the production rate. In § 6 we revisit this issue for the instantaneous turbulent flow.
Compared to internal turbulence, the scalar distribution at the TNTI is very different. The average in the strain eigenframe shows that at the IB (
 $(\unicode[STIX]{x1D709}_{1},\unicode[STIX]{x1D709}_{2},\unicode[STIX]{x1D709}_{3})=(0,0,0)$
in figure 5
a) the scalar gradient aligns exactly with the most compressive strain, and consequently with the interface normal. Therefore, the scalar interface is approximately parallel to the TNTI (as defined by vorticity), and can be used for interface detection (e.g. Westerweel et al.
Reference Westerweel, Fukushima, Pedersen and Hunt2009) keeping in mind that the TNTI and the scalar interface do not coincide exactly (Silva & da Silva Reference Silva and da Silva2017). Furthermore, the strain rate magnitude is significant at the TNTI and the flow velocity with respect to the interface is low. Therefore, the strain acts persistently on the scalar and can produce significant scalar gradients near the TNTI, as observed by Attili, Cristancho & Bisetti (Reference Attili, Cristancho and Bisetti2014).
$(\unicode[STIX]{x1D709}_{1},\unicode[STIX]{x1D709}_{2},\unicode[STIX]{x1D709}_{3})=(0,0,0)$
in figure 5
a) the scalar gradient aligns exactly with the most compressive strain, and consequently with the interface normal. Therefore, the scalar interface is approximately parallel to the TNTI (as defined by vorticity), and can be used for interface detection (e.g. Westerweel et al.
Reference Westerweel, Fukushima, Pedersen and Hunt2009) keeping in mind that the TNTI and the scalar interface do not coincide exactly (Silva & da Silva Reference Silva and da Silva2017). Furthermore, the strain rate magnitude is significant at the TNTI and the flow velocity with respect to the interface is low. Therefore, the strain acts persistently on the scalar and can produce significant scalar gradients near the TNTI, as observed by Attili, Cristancho & Bisetti (Reference Attili, Cristancho and Bisetti2014).
The observed difference in alignment between the passive scalar gradient,
 $\unicode[STIX]{x1D735}\unicode[STIX]{x1D719}$
, and the most compressive straining direction,
$\unicode[STIX]{x1D735}\unicode[STIX]{x1D719}$
, and the most compressive straining direction,
 $\unicode[STIX]{x1D709}_{3}$
direction, is related to the flow velocity topology. The TNTI layer is dominated by a saddle-node point type structure with low vorticity magnitude, while internal layers are of shear-layer type (§ 5.2). The dispersion of fluid tracers, hence that of passive scalars, is indeed different around these flow structures as demonstrated in Goudar & Elsinga (Reference Goudar and Elsinga2018). For the saddle-node structure at the TNTI, it was shown that the tracers approach the plane
$\unicode[STIX]{x1D709}_{3}$
direction, is related to the flow velocity topology. The TNTI layer is dominated by a saddle-node point type structure with low vorticity magnitude, while internal layers are of shear-layer type (§ 5.2). The dispersion of fluid tracers, hence that of passive scalars, is indeed different around these flow structures as demonstrated in Goudar & Elsinga (Reference Goudar and Elsinga2018). For the saddle-node structure at the TNTI, it was shown that the tracers approach the plane
 $\unicode[STIX]{x1D709}_{3}=0$
with time, while for the average shear-layer structure, the tracers move towards a plane that is at
$\unicode[STIX]{x1D709}_{3}=0$
with time, while for the average shear-layer structure, the tracers move towards a plane that is at
 $18^{\circ }$
with respect to the
$18^{\circ }$
with respect to the
 $\unicode[STIX]{x1D709}_{3}=0$
plane. As the fluid tracers, hence passive scalar, converge towards a plane, significant scalar gradient magnitude can develop along this plane creating a scalar front. In that case the orientation of the scalar gradient is perpendicular to the front. Consistent with this explanation, we find that the scalar gradient is perpendicular to the
$\unicode[STIX]{x1D709}_{3}=0$
plane. As the fluid tracers, hence passive scalar, converge towards a plane, significant scalar gradient magnitude can develop along this plane creating a scalar front. In that case the orientation of the scalar gradient is perpendicular to the front. Consistent with this explanation, we find that the scalar gradient is perpendicular to the
 $\unicode[STIX]{x1D709}_{3}=0$
plane at the TNTI (figure 5
a) and is at an 18 degree angle with the
$\unicode[STIX]{x1D709}_{3}=0$
plane at the TNTI (figure 5
a) and is at an 18 degree angle with the
 $\unicode[STIX]{x1D709}_{1}$
axis for the internal shear layer (figure 5
g). Therefore, the scalar front is parallel to the TNTI, while it is an angle with respect to the internal shear layers. A similar link between such convergent planes, also referred to as diverging separatrix, and the temperature fronts in a plane jet was noted by Antonia et al. (Reference Antonia, Chambers, Britz and Browne1986), though at larger scales.
$\unicode[STIX]{x1D709}_{1}$
axis for the internal shear layer (figure 5
g). Therefore, the scalar front is parallel to the TNTI, while it is an angle with respect to the internal shear layers. A similar link between such convergent planes, also referred to as diverging separatrix, and the temperature fronts in a plane jet was noted by Antonia et al. (Reference Antonia, Chambers, Britz and Browne1986), though at larger scales.
Finally, the right-hand side terms in the scalar gradient transport equation (5.2) are evaluated for the average flow structure at the TNTI (figure 5
a–c). The resulting profiles across the interface are presented in figure 6(b). As before, the
 $\unicode[STIX]{x1D709}_{3}$
direction represents the TNTI normal. Like for an actual TNTI (Silva & da Silva Reference Silva and da Silva2017, represented as dashed lines in figure 6), diffusion dominates at the detected interface
$\unicode[STIX]{x1D709}_{3}$
direction represents the TNTI normal. Like for an actual TNTI (Silva & da Silva Reference Silva and da Silva2017, represented as dashed lines in figure 6), diffusion dominates at the detected interface
 $(\unicode[STIX]{x1D709}_{3}=0)$
. The production term and the scalar gradient magnitude, i.e.
$(\unicode[STIX]{x1D709}_{3}=0)$
. The production term and the scalar gradient magnitude, i.e.
 $G^{2}$
, increase rapidly across the interface and reach a peak at the start of the TSL,
$G^{2}$
, increase rapidly across the interface and reach a peak at the start of the TSL,
 $\unicode[STIX]{x1D709}_{3}=4\unicode[STIX]{x1D702}$
, which is the same for the present average flow structure and the actual interface (Watanabe et al.
Reference Watanabe, Sakai, Nagata, Ito and Hayase2015; Silva & da Silva Reference Silva and da Silva2017). As noted by da Silva et al. (Reference da Silva, Hunt, Eames and Westerweel2014), these narrow peaks make the modelling of scalar transport near the TNTI considerably more challenging as compared to the transport of kinetic energy, which contributions are smoother near the interface. However, the present average flow structure for the interface seems to capture the production and diffusion terms in the transport equation well, which offers some prospect for advancing scalar transport modelling near the TNTI in the future. The conditional inviscid term in the scalar gradient transport equation has also been assessed in detail by Krug et al. (Reference Krug, Holzner, Lüthi, Wolf, Kinzelbach and Tsinober2015) for an active scalar, as opposed to the passive scalar considered here and in Silva & da Silva (Reference Silva and da Silva2017). A comparison with their result can only be done in a qualitative way, due to the different flow dynamics. However, the same terms have been analysed for the present average flow structure (not shown) and it is interesting to note a qualitative agreement with the conditional profiles of Krug et al. (Reference Krug, Holzner, Lüthi, Wolf, Kinzelbach and Tsinober2015). Finally, the dissipation term continues to increase in magnitude away from the interface in this flow, which is not captured by the flow structure in the eigenframe and may be linked to details of the internal turbulence. However, the oscillation in the dissipation profile centred on
$\unicode[STIX]{x1D709}_{3}=4\unicode[STIX]{x1D702}$
, which is the same for the present average flow structure and the actual interface (Watanabe et al.
Reference Watanabe, Sakai, Nagata, Ito and Hayase2015; Silva & da Silva Reference Silva and da Silva2017). As noted by da Silva et al. (Reference da Silva, Hunt, Eames and Westerweel2014), these narrow peaks make the modelling of scalar transport near the TNTI considerably more challenging as compared to the transport of kinetic energy, which contributions are smoother near the interface. However, the present average flow structure for the interface seems to capture the production and diffusion terms in the transport equation well, which offers some prospect for advancing scalar transport modelling near the TNTI in the future. The conditional inviscid term in the scalar gradient transport equation has also been assessed in detail by Krug et al. (Reference Krug, Holzner, Lüthi, Wolf, Kinzelbach and Tsinober2015) for an active scalar, as opposed to the passive scalar considered here and in Silva & da Silva (Reference Silva and da Silva2017). A comparison with their result can only be done in a qualitative way, due to the different flow dynamics. However, the same terms have been analysed for the present average flow structure (not shown) and it is interesting to note a qualitative agreement with the conditional profiles of Krug et al. (Reference Krug, Holzner, Lüthi, Wolf, Kinzelbach and Tsinober2015). Finally, the dissipation term continues to increase in magnitude away from the interface in this flow, which is not captured by the flow structure in the eigenframe and may be linked to details of the internal turbulence. However, the oscillation in the dissipation profile centred on
 $\unicode[STIX]{x1D709}_{3}=4\unicode[STIX]{x1D702}$
is present for both the eigenframe flow structure and the actual TNTI, which therefore appears to be a feature associated with the local interface structure.
$\unicode[STIX]{x1D709}_{3}=4\unicode[STIX]{x1D702}$
is present for both the eigenframe flow structure and the actual TNTI, which therefore appears to be a feature associated with the local interface structure.
5.4 Jet results
Results for the turbulent jet are qualitatively similar to those for shear free turbulence. At the IB the average flow in the strain eigenframe reveals a dominant saddle point topology with the interface vorticity being associated partly with a vortex
 $(\unicode[STIX]{x1D709}_{1}<0)$
and partly with a shear-layer topology
$(\unicode[STIX]{x1D709}_{1}<0)$
and partly with a shear-layer topology
 $(\unicode[STIX]{x1D709}_{1}>0)$
(figure 9
a) as before. Furthermore, the scalar contours are nearly parallel to the interface in the eigenframe (
$(\unicode[STIX]{x1D709}_{1}>0)$
(figure 9
a) as before. Furthermore, the scalar contours are nearly parallel to the interface in the eigenframe (
 $\unicode[STIX]{x1D709}_{3}=0$
plane) implying that the scalar gradient is approximately aligned with
$\unicode[STIX]{x1D709}_{3}=0$
plane) implying that the scalar gradient is approximately aligned with
 $\unicode[STIX]{x1D740}_{3}$
. At the origin, the angle between the scalar gradient and
$\unicode[STIX]{x1D740}_{3}$
. At the origin, the angle between the scalar gradient and
 $\unicode[STIX]{x1D740}_{3}$
is only
$\unicode[STIX]{x1D740}_{3}$
is only
 $4^{\circ }$
.
$4^{\circ }$
.
However, there are some quantitative differences between the two flows. This is most readily seen from the critical points in the
 $(\unicode[STIX]{x1D709}_{1},\unicode[STIX]{x1D709}_{3})$
plane. For the jet the saddle point is located at
$(\unicode[STIX]{x1D709}_{1},\unicode[STIX]{x1D709}_{3})$
plane. For the jet the saddle point is located at
 $(\unicode[STIX]{x1D709}_{1},\unicode[STIX]{x1D709}_{3})\approx (0,-13\unicode[STIX]{x1D702})$
(figure 9
a), while for shear free turbulence it is at
$(\unicode[STIX]{x1D709}_{1},\unicode[STIX]{x1D709}_{3})\approx (0,-13\unicode[STIX]{x1D702})$
(figure 9
a), while for shear free turbulence it is at
 $(0,-8\unicode[STIX]{x1D702})$
(figure 5
a). Furthermore, the focus critical point (swirling topology) is at
$(0,-8\unicode[STIX]{x1D702})$
(figure 5
a). Furthermore, the focus critical point (swirling topology) is at
 $(\unicode[STIX]{x1D709}_{1},\unicode[STIX]{x1D709}_{3})\approx (-22\unicode[STIX]{x1D702},15\unicode[STIX]{x1D702})$
for the jet, while at
$(\unicode[STIX]{x1D709}_{1},\unicode[STIX]{x1D709}_{3})\approx (-22\unicode[STIX]{x1D702},15\unicode[STIX]{x1D702})$
for the jet, while at
 $(-14\unicode[STIX]{x1D702},11\unicode[STIX]{x1D702})$
for shear free turbulence. It therefore appears that the dimensions of the average flow structure at the interface are approximately 1.5 times larger for the jet. This is consistent with the VSL and TSL thickness being slightly larger for the jet as compared to shear free turbulence (Silva et al.
Reference Silva, Zecchetto and da Silva2018). Also, the exact size of the thickness of the TNTI is slightly flow dependent (not its scaling – Silva et al.
Reference Silva, Zecchetto and da Silva2018), because the potential flow contribution (from the non-turbulent region) to the large-scale strain at the interface is affected by the flow geometry, which is different. The internal turbulent motions may then still be universal, i.e. show identical Kolmogorov scaling in both flows. The differences in non-turbulent straining at the interface affect the local vorticity stretching rate, which keeps the TNTI sharp and determines its thickness, as well as the entrainment rate. Future study on the effect of non-turbulent strain seems warranted.
$(-14\unicode[STIX]{x1D702},11\unicode[STIX]{x1D702})$
for shear free turbulence. It therefore appears that the dimensions of the average flow structure at the interface are approximately 1.5 times larger for the jet. This is consistent with the VSL and TSL thickness being slightly larger for the jet as compared to shear free turbulence (Silva et al.
Reference Silva, Zecchetto and da Silva2018). Also, the exact size of the thickness of the TNTI is slightly flow dependent (not its scaling – Silva et al.
Reference Silva, Zecchetto and da Silva2018), because the potential flow contribution (from the non-turbulent region) to the large-scale strain at the interface is affected by the flow geometry, which is different. The internal turbulent motions may then still be universal, i.e. show identical Kolmogorov scaling in both flows. The differences in non-turbulent straining at the interface affect the local vorticity stretching rate, which keeps the TNTI sharp and determines its thickness, as well as the entrainment rate. Future study on the effect of non-turbulent strain seems warranted.
Average flow and scalar in the strain eigenframe for the turbulent jet. The plots present the results conditioned at the IB
 $(y_{I}=0)$
(a), and for internal turbulence (b). Vectors represent the average velocity. The contours show the average scalar normalized by its maximum value. The flow structures are qualitatively similar to those for shear free turbulence (figure 5), therefore only the cross-planes
$(y_{I}=0)$
(a), and for internal turbulence (b). Vectors represent the average velocity. The contours show the average scalar normalized by its maximum value. The flow structures are qualitatively similar to those for shear free turbulence (figure 5), therefore only the cross-planes
 $\unicode[STIX]{x1D709}_{2}=0$
are shown here.
$\unicode[STIX]{x1D709}_{2}=0$
are shown here.

The internal turbulence structure appears the same between the two flows also (e.g. compare figures 9
b and 5
g), where the velocity vectors reveal a dominant shear-layer flow structure. At the core of this shear layer, i.e. at the origin of the eigenframe, the scalar iso-contours are inclined with respect to the
 $\unicode[STIX]{x1D709}_{3}=0$
plane, which means that the scalar gradient is at an angle with the most compressive straining direction, as discussed before.
$\unicode[STIX]{x1D709}_{3}=0$
plane, which means that the scalar gradient is at an angle with the most compressive straining direction, as discussed before.
6 Scalar gradient alignment with principal strain revisited
Earlier work has suggested that the most probable angle between the scalar gradient and the most compressive straining direction is zero degrees. Here we argue that the observed alignment is biased due to ambiguity in defining the positive direction of the strain eigenvectors, and that the most probable angle between
 $\unicode[STIX]{x1D735}\unicode[STIX]{x1D719}$
and
$\unicode[STIX]{x1D735}\unicode[STIX]{x1D719}$
and
 $\unicode[STIX]{x1D740}_{3}$
is in fact non-zero for the internal turbulence. This issue is addressed by uniquely defining the positive directions of
$\unicode[STIX]{x1D740}_{3}$
is in fact non-zero for the internal turbulence. This issue is addressed by uniquely defining the positive directions of
 $\unicode[STIX]{x1D740}_{i}$
as explained in § 5.1. Then
$\unicode[STIX]{x1D740}_{i}$
as explained in § 5.1. Then
 $\unicode[STIX]{x1D703}$
is defined as the angle between
$\unicode[STIX]{x1D703}$
is defined as the angle between
 $\unicode[STIX]{x1D740}_{3}$
and the projection of
$\unicode[STIX]{x1D740}_{3}$
and the projection of
 $\unicode[STIX]{x1D735}\unicode[STIX]{x1D719}$
onto the plane spanned by
$\unicode[STIX]{x1D735}\unicode[STIX]{x1D719}$
onto the plane spanned by
 $\unicode[STIX]{x1D740}_{1}$
and
$\unicode[STIX]{x1D740}_{1}$
and
 $\unicode[STIX]{x1D740}_{3}$
(figure 10
b). The normalized probability distributions of
$\unicode[STIX]{x1D740}_{3}$
(figure 10
b). The normalized probability distributions of
 $\unicode[STIX]{x1D703}$
are evaluated for data points on the IB (
$\unicode[STIX]{x1D703}$
are evaluated for data points on the IB (
 $y_{I}=0$
, start of the VSL), at
$y_{I}=0$
, start of the VSL), at
 $y_{I}=4\unicode[STIX]{x1D702}$
(start of the TSL) and for the internal turbulence (figure 10
a). For internal turbulence the peak is at
$y_{I}=4\unicode[STIX]{x1D702}$
(start of the TSL) and for the internal turbulence (figure 10
a). For internal turbulence the peak is at
 $\unicode[STIX]{x1D703}=20^{\circ }$
, while for the IB
$\unicode[STIX]{x1D703}=20^{\circ }$
, while for the IB
 $(y_{I}=0)$
the most probable angle is indeed
$(y_{I}=0)$
the most probable angle is indeed
 $0^{\circ }$
. When conditioned on
$0^{\circ }$
. When conditioned on
 $y_{I}=4\unicode[STIX]{x1D702}$
the probability distribution of
$y_{I}=4\unicode[STIX]{x1D702}$
the probability distribution of
 $\unicode[STIX]{x1D703}$
reveals a peak at
$\unicode[STIX]{x1D703}$
reveals a peak at
 $30^{\circ }$
. These peak locations are consistent with the observed orientation of the average scalar gradient at the origin of the strain eigenframe (figures 5
a, 5
d and 5
g). As discussed in § 5.3, the difference in orientation of
$30^{\circ }$
. These peak locations are consistent with the observed orientation of the average scalar gradient at the origin of the strain eigenframe (figures 5
a, 5
d and 5
g). As discussed in § 5.3, the difference in orientation of
 $\unicode[STIX]{x1D735}\unicode[STIX]{x1D719}$
is explained by the different flow structure at the TNTI compared to the internal layers. The flow at the IB
$\unicode[STIX]{x1D735}\unicode[STIX]{x1D719}$
is explained by the different flow structure at the TNTI compared to the internal layers. The flow at the IB
 $(y_{I}=0)$
is described by a saddle point topology without significant vorticity magnitude, which blocks convective scalar transport across the interface, thereby creating a scalar front/interface approximately parallel to the TNTI. Note that for the TSL
$(y_{I}=0)$
is described by a saddle point topology without significant vorticity magnitude, which blocks convective scalar transport across the interface, thereby creating a scalar front/interface approximately parallel to the TNTI. Note that for the TSL
 $(y_{I}=4\unicode[STIX]{x1D702})$
the interface and the scalar gradient are rotated by approximately the same angle with respect to
$(y_{I}=4\unicode[STIX]{x1D702})$
the interface and the scalar gradient are rotated by approximately the same angle with respect to
 $\unicode[STIX]{x1D740}_{3}$
, such that the scalar gradient is still normal to the interface (figure 5
d). On the other hand, internal layers are predominately of shear layer type. The combined action of strain and rotation (i.e. vorticity) in those layers causes the scalar fronts to be at an angle with respect to the most compressive straining direction, as well as with respect to the shear layer itself.
$\unicode[STIX]{x1D740}_{3}$
, such that the scalar gradient is still normal to the interface (figure 5
d). On the other hand, internal layers are predominately of shear layer type. The combined action of strain and rotation (i.e. vorticity) in those layers causes the scalar fronts to be at an angle with respect to the most compressive straining direction, as well as with respect to the shear layer itself.
Normalized probability distribution for the angle
 $\unicode[STIX]{x1D703}$
between the most compressing principal straining direction,
$\unicode[STIX]{x1D703}$
between the most compressing principal straining direction,
 $\unicode[STIX]{x1D740}_{3}$
, and the projection of the scalar gradient
$\unicode[STIX]{x1D740}_{3}$
, and the projection of the scalar gradient
 $\unicode[STIX]{x1D735}\unicode[STIX]{x1D719}$
onto the plane defined by
$\unicode[STIX]{x1D735}\unicode[STIX]{x1D719}$
onto the plane defined by
 $\unicode[STIX]{x1D740}_{1}$
and
$\unicode[STIX]{x1D740}_{1}$
and
 $\unicode[STIX]{x1D740}_{3}$
(a). The positive direction of the angle
$\unicode[STIX]{x1D740}_{3}$
(a). The positive direction of the angle
 $\unicode[STIX]{x1D703}$
is defined in panel (b). The different distributions are obtained by conditioning on the IB
$\unicode[STIX]{x1D703}$
is defined in panel (b). The different distributions are obtained by conditioning on the IB
 $(y_{I}=0)$
, on
$(y_{I}=0)$
, on
 $y_{I}=4\unicode[STIX]{x1D702}$
and for internal turbulence. The dashed line is obtained by symmetrizing the distribution for internal turbulence, which represents the case where the positive
$y_{I}=4\unicode[STIX]{x1D702}$
and for internal turbulence. The dashed line is obtained by symmetrizing the distribution for internal turbulence, which represents the case where the positive
 $\unicode[STIX]{x1D740}_{1}$
direction is arbitrarily defined. The results shown are for shear free turbulence.
$\unicode[STIX]{x1D740}_{1}$
direction is arbitrarily defined. The results shown are for shear free turbulence.


In order to demonstrate the effect of ambiguity in defining the positive direction of the strain eigenvectors, the probability distribution of
 $\unicode[STIX]{x1D703}$
for internal turbulence is symmetrized. This corresponds to the positive
$\unicode[STIX]{x1D703}$
for internal turbulence is symmetrized. This corresponds to the positive
 $\unicode[STIX]{x1D740}_{1}$
direction being arbitrarily selected. The result is shown by the dashed line in figure 10(a). It clearly reveals a broad peak centred on
$\unicode[STIX]{x1D740}_{1}$
direction being arbitrarily selected. The result is shown by the dashed line in figure 10(a). It clearly reveals a broad peak centred on
 $\unicode[STIX]{x1D703}=0$
, which is consistent with the measurements of Kothnur & Clemens (Reference Kothnur and Clemens2005), in their figure 9. The ambiguity in the positive straining directions obscures the actual narrow distribution with a peak at
$\unicode[STIX]{x1D703}=0$
, which is consistent with the measurements of Kothnur & Clemens (Reference Kothnur and Clemens2005), in their figure 9. The ambiguity in the positive straining directions obscures the actual narrow distribution with a peak at
 $20^{\circ }$
, and would wrongfully suggest that
$20^{\circ }$
, and would wrongfully suggest that
 $\unicode[STIX]{x1D735}\unicode[STIX]{x1D719}$
and
$\unicode[STIX]{x1D735}\unicode[STIX]{x1D719}$
and
 $\unicode[STIX]{x1D740}_{3}$
are predominantly perfectly aligned. When using the cosine of the angle to quantify alignments, a directional sensitivity is lost also, which may lead a similar misconception.
$\unicode[STIX]{x1D740}_{3}$
are predominantly perfectly aligned. When using the cosine of the angle to quantify alignments, a directional sensitivity is lost also, which may lead a similar misconception.
The results presented in figure 10(a) are robust as can be seen when comparing them to the probability distribution for
 $\unicode[STIX]{x1D703}$
conditioned on events of intense scalar gradient magnitude (figure 11). Here, intense scalar gradient magnitude is defined as
$\unicode[STIX]{x1D703}$
conditioned on events of intense scalar gradient magnitude (figure 11). Here, intense scalar gradient magnitude is defined as
 $G^{2}$
exceeding five times its standard deviation within the turbulent region. Near the TNTI, the comparison reveals that there is virtually no effect on the probability distribution of
$G^{2}$
exceeding five times its standard deviation within the turbulent region. Near the TNTI, the comparison reveals that there is virtually no effect on the probability distribution of
 $\unicode[STIX]{x1D703}$
. For the internal turbulence region (far from the TNTI) the peak in the distribution is even more pronounced when conditioning on intense scalar gradients, that is, the probability for large angles (i.e.
$\unicode[STIX]{x1D703}$
. For the internal turbulence region (far from the TNTI) the peak in the distribution is even more pronounced when conditioning on intense scalar gradients, that is, the probability for large angles (i.e.
 $+/-90^{\circ }$
) reduces to near zero in that case (figure 11). Also, there is a slight shift in the peak location from
$+/-90^{\circ }$
) reduces to near zero in that case (figure 11). Also, there is a slight shift in the peak location from
 $\unicode[STIX]{x1D703}=20^{\circ }$
to
$\unicode[STIX]{x1D703}=20^{\circ }$
to
 $16^{\circ }$
. Please note that the bin size is
$16^{\circ }$
. Please note that the bin size is
 $4^{\circ }$
, so that the observed shift corresponds to just a single bin.
$4^{\circ }$
, so that the observed shift corresponds to just a single bin.
7 Conclusion
The average velocity and scalar fields in the strain eigenframe were evaluated for shear free turbulence and jet turbulence. Results conditioned at the TNTI show a dominant saddle-node flow topology with a vorticity interface. Along one half of this interface, vorticity is associated with a vortex, while the other half consists of a shear layer. Convection of the scalar is blocked at the interface, because the straining motion is irrotational on the non-turbulent side and the most compressive straining direction coincides with the interface normal. Consequently, the scalar front is parallel to the TNTI and the scalar gradient aligns with the most compressive straining direction. This explains the regions of particularly high scalar gradient magnitude, that are typically observed in TNTIs separating fluid with different levels of scalar concentration.
The different terms in the enstrophy and scalar gradient transport equations show similar profiles across the VSL and TSL of the average flow structure in the strain eigenframe and the actual TNTI. The same qualitative agreement is seen for the development of the velocity gradient tensor invariants across the interface. Therefore, it is concluded that average structure in the strain eigenframe clearly depicts the relevant transport processes and flow topologies across the actual TNTI layer.
The velocity and scalar structure for internal turbulence showed similarities as well as important differences with respect to the TNTI. The average flow in the strain eigenframe also reveals a layer, or interface. However, the internal layers are shear layers bounded by nearly uniform flow on both sides. For these internal shear layers both strain and vorticity are significant, while at the TNTI (specifically within the VSL) strain dominates over vorticity. Due to the combined action of strain and rotation in the internal shear layer, the scalar fronts are at an angle with respect to the layer as well as the extensive straining directions. This means that the scalar gradient is at angle with respect to the most compressive straining direction, which is different from their alignment at the TNTI. The probability distribution of this angle shows a peak at around
 $20^{\circ }$
for internal turbulence. It should be noted that in order to observe this peak it is necessary to uniquely define the positive directions of the strain eigenvectors using vorticity.
$20^{\circ }$
for internal turbulence. It should be noted that in order to observe this peak it is necessary to uniquely define the positive directions of the strain eigenvectors using vorticity.
Acknowledgements
The authors are grateful for the hospitality of the School of Aeronautics of the Universidad Politécnica de Madrid during the 2013 Multiflow Summer Workshop, funded by grant no. ERC-2010.AdG-20100224, where some of the initial ideas for this work were developed. Dr R. R. Taveira is acknowledged for the initial post-processing of the planar jet DNS data. Professor J. C. R. Hunt is acknowledged for helpful discussions on the manuscript. C.B.S. acknowledges the Laboratory for Advanced Computing at University of Coimbra for providing HPC, computing and consulting resources (http://www.lca.uc.pt), and the Fundação para a Ciência e a Tecnologia (FCT), through IDMEC, under LAETA, with projects UID/EMS/50022/2013, and PTDC/EMS-ENE/6129/2014.


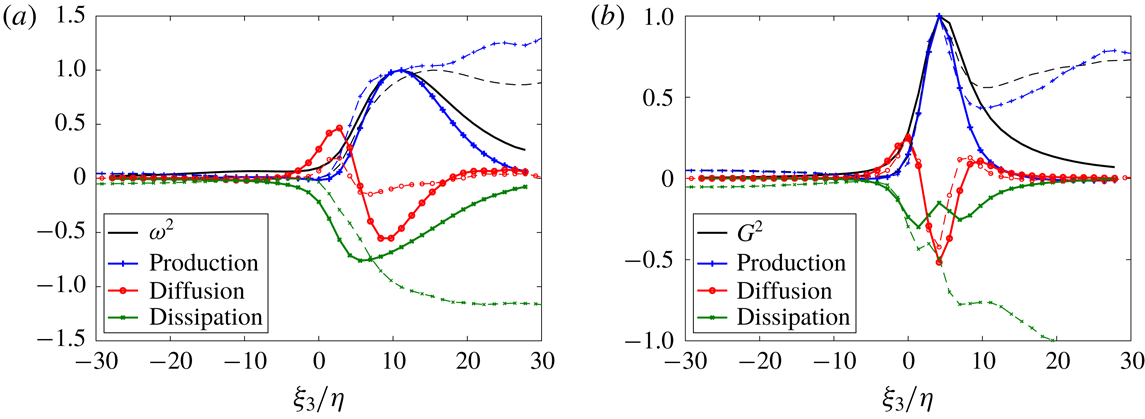

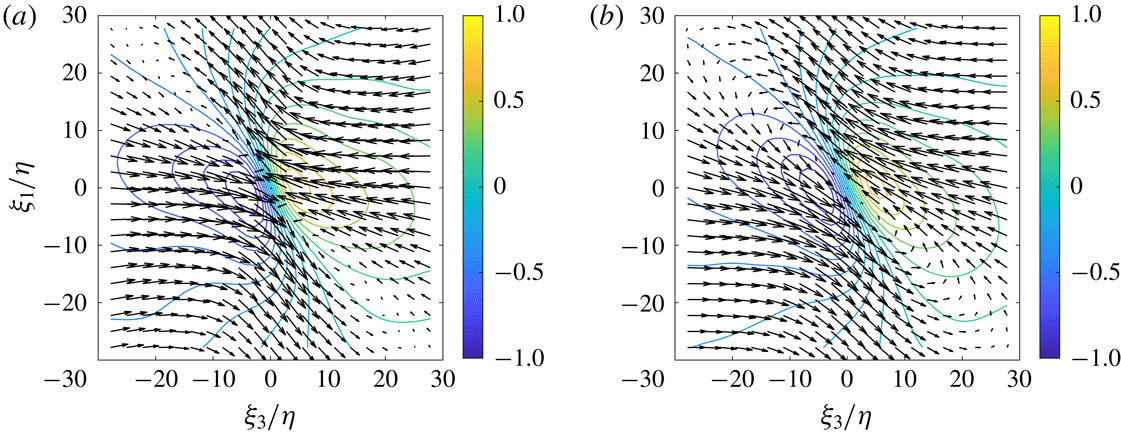


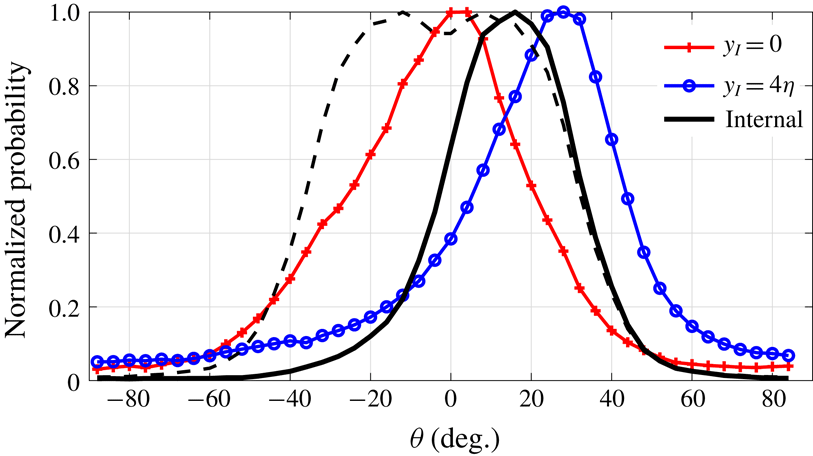

 Open access