

Previous studies have indicated that ingesting carbohydrate (CHO) beverages at regular intervals during prolonged, strenuous exercise is associated with smaller perturbations in the total and differential circulating leucocyte counts and attenuated reduction in functional responses in a number of immune cells and mediators, including lymphocytes, neutrophils and inflammatory cytokines(Reference Bishop, Walsh and Haines1–Reference Gleeson4). The effect of a CHO food on immune response is relatively small. However, the limited data still suggested that pre-exercise low-CHO meals increased the magnitude of leucocytosis and a rise in the neutrophils in the blood(Reference Bishop, Walsh and Haines1, Reference Lancaster, Jentjens and Moseley5). It seems likely that part of the underlying mechanism behind these responses is an attenuation of the cortisol response to the exercise and maintenance of plasma glucose concentrations(Reference Bishop, Walsh and Haines1, Reference Li, Wu and Gleeson6).
The glycaemic index (GI) describes the difference by ranking CHO according to their effect on blood glucose levels compared with a reference food, which may be either glucose or white bread(Reference Jenkins, Wolever and Taylor7). Numerous studies have suggested that a low-GI meal consumed at different times, i.e. 1–4 h, prior to prolonged exercise can maintain higher blood glucose concentrations, decrease plasma lactate concentrations during exercise and/or post-exercise, and cause a relative shift in substrate utilization from CHO to fat compared with a high-GI pre-exercise meal(Reference DeMarco, Sucher and Cisar8–Reference Wee, Williams and Gray10). Despite the inconsistency on improvement in exercise performance after the ingestion of GI meals(Reference DeMarco, Sucher and Cisar8–Reference Wee, Williams and Gray10), most findings indicate that a pre-exercise low-GI meal may have potential benefits over a high-GI meal because of the promotion of the sustained CHO availability during exercise(Reference Wee, Williams and Gray10, Reference Siu, Wong and Morris11). Glycaemic load (GL) was subsequently proposed as a measure that incorporates both the quantity and quality of the dietary CHO consumed(Reference Salmeron, Manson and Stampfer12). As a mathematical concept, GL has been physiologically validated as a reliable measure of glycaemic response to individual foods across a wide range of portion sizes(Reference Brand-Miller, Thomas and Swan13). It has also been suggested that GL would be a much better predictor for controlling blood glucose levels than just predicting from CHO amount/percentage or GI alone(Reference Scaglioni, Stival and Giovannini14). Compared with the number of studies that examined the application of GI in sports nutrition, the concept of GL which is primarily applied in epidemiological research has been less studied directly. GL is associated with several CVD risk factors(Reference Ford and Liu15) and appears to be an independent risk factor for myocardial infarction(Reference Liu, Willett and Stampfer16), type 2 diabetes(Reference Salmeron, Manson and Stampfer12, Reference Slyper, Jurva and Pleuss17), and cancer in many, but not all, analyses(Reference Augustin, Gallus and Bosetti18).
GL is derived by multiplying the amount of available CHO consumed in the diet by its GI value. Thus, the GL value can be reduced either by decreasing the amount of CHO consumed or the dietary GI. Both of these approaches could reduce acute plasma glucose and insulin responses and a recent study from our laboratory(Reference Chen, Wong and Wong19), which reported the metabolic responses from the same project, found that the two low-GL trials (by changing either the GI or the amount of the CHO through replacing CHO with fat) induced similarly smaller metabolic changes during the postprandial period and during exercise, which were characterized by a similarly lower CHO oxidation in the two trials. Our further study(Reference Chen, Wong and Xu20) showed that regardless of their difference in GI and GL, the CHO loading with an equally high CHO amount may produce similar muscle glycogen supercompensation status and exercise metabolic responses during subsequent endurance running. It appears that the amount, rather than the nature, of the CHO consumed during the 3 d regimen may be the most overriding factor in metabolism and endurance run performance.
Despite the recent advances in research on the relation between immunosuppression and CHO supplementation, few studies, if any, have directly investigated the influence of a GI and/or GL meal on immune response to prolonged exercise. There is clearly a pressing need to clarify the role of GI and GL on immune responses during and/or after prolonged exercise. Using an identical design and subject population(Reference Chen, Wong and Wong19), this study aimed to examine the effect of a 2 h pre-exercise meal with different GI and GL on immune responses to an endurance performance run. It was hypothesized that compared with a high-GI meal with an equal amount of CHO, the consumption of a low-GI meal 2 h before exercise would result in a reduced cortisol response to exercise, which in turn would allow the maintenance of the immune function during exercise and recovery. Additionally, it was hypothesized that ingesting meals with an equal GL value 2 h before exercise would produce similar glycaemic and immune responses regardless of their GI and CHO content.
Methods
Subjects
Eight healthy male runners (age 24·3 (sem 2·2) years; body mass 66·7 (sem 2·0) kg; VO2max 55·9 (sem 1·87) ml/kg per min) volunteered to participate in this study which was approved by the University Clinical Research Ethical Committee. Written informed consent was obtained from all subjects. They were also required to complete a general health questionnaire and were excluded if any medication had been taken during the 6 weeks prior to the study and if symptoms of upper respiratory infection had been experienced in the 4 weeks prior to the study. Moreover, at the time of the study, all subjects were involved in normal training and were accumulating at least 50 km of running distance per week.
Preliminary test
After the subjects became familiar with treadmill running and the experimental procedures, they were required to undertake a series of preliminary tests before the main trials as previously described(Reference Siu, Wong and Morris11), including a VO2-speed test, a VO2max test, and a lactate-speed test, through which the speeds of corresponding % VO2max were determined. Before the main trials, the postprandial glycaemic responses of the subjects were assessed in a screening session to ensure that they would respond normally to the prescribed test meals(Reference Siu, Wong and Morris11, Reference Brand-Miller, Thomas and Swan13).
Dietary and training control
Subjects were instructed to keep their daily exercise to a minimum and to standardize their diet during the 72 h preceding each main trial. Each subject kept a 3 d diary of their dietary intake before the main trial and energy intake and dietary composition were subsequently analyzed (The Food Processor 10.0, Esha). They were required to repeat the same diet before each main trial to minimize the variation in muscle and liver glycogen concentrations. Before each trial, they reported to the laboratory after an overnight fast of 12 h. This was to ensure an empty stomach and to minimize the effect of a previous meal on the gastric emptying rate of the test meals.
Prescribed meals
Three isoenergetic meals (approximately 2640 kJ for a 70 kg subject) were used in this study: high GI and high GL (H-H); low GI and low GL (L-L); and high GI and low GL (H-L). Since GL is a calculated indicator that incorporates the quantity and quality of the CHO, i.e. GI × CHO (g)/100, the creation of an isoenergetic meal with low GI ( < 45) and high GL (L-H) was practically infeasible. The CHO intake (% of energy intake), GI, and GL were 66 %, 79, and 82 for the H-H; 66 %, 40, and 42 for the L-L; and 36 %, 78, and 44 for the H-L, respectively. The detailed nutritional composition of the three pre-exercise meals is shown in Table 1. The H-H and L-L meals provided 1·5 g CHO/kg body mass, whereas the H-L meal provided only 0·8 g CHO/kg body mass. The water content of all meals was also standardized so that each of them provided 1100 ml fluid. The specific purpose related to GI foods and the weight of the food was not disclosed to the subjects to avoid the occurrence of bias.
Nutritional composition of pre-exercise meals (for a 70 kg participant)
GI, glycaemic index; GL, glycaemic load; CHO, carbohydrate.
* H-H, high GI and high GL; L-L, low GI and low GL; H-L, high GI and low GL.
† Calculated by a method described in the work of Wolever et al. (Reference Wolever, Jenkins and Jenkins36), with GI values taken from the work of Foster-Powell et al. (Reference Foster-Powell, Holt and Brand-Miller37).
Experimental procedure
A standardized preloaded exercise protocol, i.e. 1 h preloaded constant run at 70 % VO2max (T1), and a 10-km time trial (TT) was used in this study (Fig. 1). The pretrial preload allows for achievement of a ‘steady state’, which may be advantageous to researchers measuring gas exchanges. Furthermore, this 1 h run also allows for a lowering of endogenous substrate stores, i.e. muscle glycogen, before a TT performance test, and this type of testing has been suggested to be a relatively reproducible method assessing the effect of diet on an endurance run(Reference Chen, Wong and Wong19–Reference Tsintzas, Williams and Wilson21). The study was a counterbalanced cross-over design and the order of the three trials was randomized, separated by at least 7 d.
Schematic representation of the experimental procedures, showing an exercise bout with a 5-min run at 60 % VO2max (![]() ), a 1 h run at 70 % VO2max (
), a 1 h run at 70 % VO2max (![]() and a 10 km time trial (
and a 10 km time trial (![]() ). BS, venous sample taken for immune assessment; * expired air collection and blood glucose determination; BW, nude body weight; F, specific glycaemic index and glycaemic load meal.
). BS, venous sample taken for immune assessment; * expired air collection and blood glucose determination; BW, nude body weight; F, specific glycaemic index and glycaemic load meal.

On each experiment day, the subjects arrived at the laboratory at about 08.00 hours following an overnight fast. After sitting quietly for 15 min, a 4 cm cannula (Angiocath, 22GA 1.00 in, Becton Dickinson, USA) was inserted into an antecubital vein in the subject's forearm and an initial resting blood sample was obtained. The indwelling cannula was connected to a three-way stopcock (Connecta Plus 3, Becton Dickinson, USA) with a 10 cm extension tube and was kept patent by the infusion of NaCl solution (0·9 %, B. Braun, Malaysia) throughout the main trial. Further venous blood samples were collected at specific times: 60 min during T1, immediately after the 10 km TT, and the first (post-60 min) and the second (post-120 min) hours during the recovery period, as shown in Fig. 1.
After the collection of the baseline samples, the subjects consumed one of the three test meals. The food was completely consumed within 15 to 20 min. They remained seated in a quiet section of the laboratory so that their activity levels were minimal, while blood glucose concentrations and perceived ratings of gut fullness were recorded throughout the 2 h postprandial period, i.e. 15, 30, 45, 60, 90, and 120 min after the meal. These blood glucose assessments were also made using finger-prick sampling at 20 min intervals during T1, at 5 km intervals during the 10 km TT, and 1 h and 2 h during the recovery period, as indicated in Fig. 1.
A standardized 5 min warm-up at 60 % VO2max was performed after the 2 h resting period. Immediately following the warm-up, the treadmill speed was increased to elicit 70 % VO2max. The T1 required the subjects to run at 70 % VO2max for 1 h(Reference Williams, Brewer and Walker22). During the TT, the subjects were allowed to change their speeds ad libitum over the whole 10 km distance by pressing the control panel located beside them, but they were also required to run as quickly as possible to complete the 10 km distance. To ensure maximal effort during the TT, strong verbal encouragement was given to the subjects throughout the run solely by the chief experimenter, who was unaware of the treatments. All of the trials were performed under similar conditions of barometric pressure, temperature, and relative humidity. No food was allowed until after the final blood sample was taken, but water intake was not restricted throughout the exercise or the 2 h recovery period.
Blood analysis
Blood samples were collected into two separate vacutainer tubes (Becton Dickinson, Oxford, UK), one containing lithium heparin and the other containing K3 EDTA. Blood taken into lithium heparin vacutainers (5 ml) was used for the measurements of phytohaemagglutinin-induced lymphocyte proliferation conducted by a whole blood method (PHA; Difco Labs, Detroit, MI, USA). Of the 7 ml blood dispensed into K3 EDTA vacutainers, 5 ml blood sample was spun at 1500 g for 10 min at 4°C to obtain plasma which was immediately stored at − 70°C before being analyzed for cortisol concentrations (Active Cortisol EIA DSL-10-2000, Diagnostic Systems Laboratories Inc, USA) and cytokine production. Plasma concentrations of IL-6, IL-10, and TNFα were determined with the use of quantitative sandwich-type ELISA kits (IL-6, and IL-10: R&D Systems, Abingdon, UK; TNFα: Diaclone, Besancon, France). All standards and solutions were prepared, and procedures were followed according to the kit specifications. Samples were diluted when necessary to ensure that the measurement fell within the range of the standard curve. The minimum detectable concentrations of TNFα were < 2 pg/ml, IL-6 < 0·70 pg/ml, and IL-10 < 1 pg/ml.
The 2 ml of the 7 ml blood sample dispensed into K3 EDTA vacutainers was used for the determination of haematology and immunology parameters. Haematocrit was determined using a reader (Clay Adams, Autocrit Ultra 3, Englewood, NJ, USA), and the Hb concentration was determined by the cyanmethaemoglobin method (RA-50 Chemistry Analyzer, Bayer Diagnostics, Leverkusen, Germany). The percentage change from rest in plasma volume was estimated from the Hb and haematocrit values. The MultiTEST IMK Kit with TruCOUNT tubes (Becton Dickinson, CA, USA) by the lyse/no-wash method was used for the assessment of the absolute counts of CD3+ (T lymphocyte), CD3+CD4+ (T-helper lymphocyte), CD3+CD8+ (T-suppressor lymphocyte), CD16+CD56+ (natural killer) and CD19+ (B lymphocyte) cells in whole blood samples using a four-colour FASCalibur flow cytometer (Becton Dickinson).
The intra-assay CV of the methods used was 5·1 and 2·9 % for blood glucose and serum cortisol; 6·8, 7·7 and 6·9 % for plasma TNFα, IL-6, and IL-10. The CV for lymphocyte proliferation and for the differential blood cell counts was 9·5 and < 2 % respectively.
Statistical analysis
All statistical calculations were performed using SPSS version 11 (SPSS Inc., Chicago, IL, USA). A two-way ANOVA (trial and time) with repeated-measures design was used to assess metabolic and immune differences between groups. Any significant F ratios were assessed using a Holm–Bonferroni stepwise post hoc test to determine the locations of variance. All data were presented as means with their standard errors, with the significance set at P < 0·05.
Results
Metabolic responses
The running time for the three trials was approximately 112 min, at 70 % VO2max for the first hour and 76 % VO2max for the last 52 min in the TT performance run. During exercise, the total CHO oxidation (H-H v. L-L v. H-L: 252·2 (sem 14·3) v. 230·7 (sem 10·4) v. 225·5 (sem 12·1) g, P < 0·05) was higher in the H-H trial, with a compensatory decrease in fat oxidation (H-H v. L-L v. H-L: 24·6 (sem 3·9) v. 32·6 (sem 5·2 v. 35·2 (sem 2·6) g, P < 0·05) compared with the L-L and H-L trials. However, there were no differences in CHO and fat oxidation between the L-L and H-L trials.
As reported in our earlier publication(Reference Chen, Wong and Wong19), the postprandial 2 h incremental area under the blood glucose curve was about 1·5 times larger in the H-H meal than that in the L-L and H-L trials. Compared with the large changes in the glycaemic response to the H-H trial, the changes in the blood glucose concentrations in the L-L trial were better maintained during exercise and during the recovery period. Higher blood glucose concentrations were observed in the L-L trial at 20 min during the 1 h 70 % VO2max run (H-H v. L-L v. H-L: 4·73 (sem 0·30) v. 4·99 (sem 0·35) v. 4·57 (sem 0·28) mmol/l, P < 0·05) and at 60 min in the recovery period (H-H v. L-L v. H-L: 4·53 (sem 0·36) v. 5·13 (sem 0·36) v. 4·83 (sem) 0·31 mmol/l, P < 0·05).
Leucocyte and lymphocyte subsets
At rest all subjects had total and differential leucocyte counts well within the normal ranges for healthy adults. During the H-L trial, there was a progressive increase (P < 0·01) in neutrophil, lymphocyte, and monocyte concentrations at 60 min during exercise and immedietly after the TT, resulting in total elevated circulating leucocyte concentrations (Table 2). Meanwhile, the total leucocyte concentrations remained elevated (P < 0·01) throughout the recovery period as a result of increased neutrophil and monocyte concentrations even though the lymphocyte concentrations returned to normal during the 2 h recovery period (Table 2). When compared with those in the H-L trials, there was an attenuation in neutrophil concentrations (P < 0·05) immediately after exercise in the H-H and L-L trials, resulting in reduced (P < 0·05) circulating total leucocyte concentrations. Similarly, reduced circulating leucocyte and neutrophil concentrations were observed in the 2 h recovery period of the H-H and L-L trials compared with those in the H-L trial (P < 0·05). However, no differences were found in all the leucocyte counts between the H-H and L-L trials (Table 2).
(Mean values with their standard errors for eight subjects)

Mean values were significantly different from those pre-exercise: *P < 0·01. Mean values were significantly different from the H-L trial: †P < 0·05.
‡ For details of procedures see Methods.
§ Two-way ANOVA with repeated measures showed a significant trial × time interaction, P < 0·05. Bonferroni correction was used to analyse significance at specific time points.
There was an increase (P < 0·01) in CD3+CD4+ and CD3+CD8+ T cell counts at 60 min during exercise and immediately after the TT during the H-L trial, resulting in an increase (P < 0·05) in total circulating CD3+ T cells (Table 3). Furthermore, there was a decrease (P < 0·05) in the total CD3+T cell concentrations immedietly after the TT in the H-H and L-L trials (Table 3) compared with that in the the H-L trial. No differences were found in the T-lymphocyte subset between the H-H and L-L trials. Increased (P < 0·05) CD16+56+ natural killer cells at 60 min during exercise and immedietly after the TT and increased (P < 0·05) CD19+B cells immediately after the TT were also found in all trials. However, there were no differences among the three trials at any time point. All the lymphocyte subsets returned to normal during the 2 h recovery period.
Circulating concentrations of CD3+(T-lymphocytes), CD3+ CD4+ (T-helper lymphocytes), CD3+ CD8+ (T-suppressor lymphocytes), CD4+ CD8+ (T-cells), CD16+ CD56+ (natural killer cells) and CD19+ (B lymphocytes) before, during, and after exercise in the high glycaemic index (GI) and high glycaemic load (GL; H-H), low GI and low GL (L-L) and high GI and low GL (H-L) trials‡ (Mean values with their standard errors for eight subjects)

Mean values were significantly different from those pre-exercise: *P < 0·01. Mean values were significantly different from the H-L trial: †P < 0·05.
‡ For details of procedures see Methods.
§ Two-way ANOVA with repeated measure showed a significant trial × time interaction, P < 0·05. Bonferroni correction was used to analysis significance at specific time points.
Lymphocyte proliferation
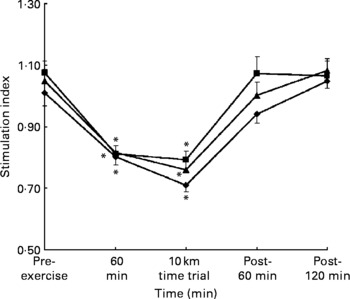
PHA-induced lymphocyte proliferation was depressed (P < 0·05) after exercise, but returned to the baseline during the 2 h recovery period. However, there were no differences among the three trials at any time points (Fig. 2).
Phytohaemagglutinin-induced lymphocyte proliferation before, during and after exercise in the H-H (high glycaemic index (GI) and high glycaemic load (GL); –♦–), L–L (low GI and low GL; –■–) and H–L (high GI and low GL; –▲–) trials. Values are the means and standard error of the mean (indicated by vertical bars) for eight subjects. Two-way ANOVA with repeated measures showed a significant trial × time interaction, P < 0·05. Bonferroni correction was used to analyse significance at specific time points. Mean values were significantly different from those pre-exercise: *P < 0·05.
Plasma cytokines
No significant responses of TNFα were detected in the three trials at any time point even using highly sensitive specific immunoassays (data not shown). The concentrations of IL-6 continued to increase (P < 0·01) in the H-L trial throughout exercise and the 2 h recovery period. Moreover, the values were higher (P < 0·01) when compared with the H-H and L-L trials at the end of the 10 km TT run and during the 2 h recovery period. However, there were no differences between the H-H and L-L trials (Fig. 3). Similar changes were observed in IL-10 concentrations throughout the experiment when compared with IL-6. However, higher (P < 0·05) values were only found at the end of the 2 h recovery period in the H-L trial compared with the H-H and L-L trials (Fig. 3).
Plasma IL-6 (a) and IL-10 (b) concentrations before, during and after exercise in the H-H (high glycaemic index (GI) and high glycaemic load (GL); –♦–), L–L (low GI and low GL; –■–) and H–L (high GI and low GL; –▲–) trials. Values are the means and standard error of the mean (indicated by vertical bars) for eight subjects. Two-way ANOVA with repeated measures showed a significant trial × time interaction, P < 0·05. Bonferroni correction was used to analyse significance at specific time points. Mean value was significantly different from pre-exercise: *P < 0·05. Mean value was significantly different from H-L: †P < 0·05. Mean value was significantly different from H-H : ‡P < 0·05. TT, time trial.

Serum cortisol
Serum cortisol concentrations increased after the onset of exercise in all trials, but no differences were found among the trials throughout the exercise period (Fig. 4). However, the cortisol concentrations were negatively correlated to the blood glucose concentrations (r − 0·52, P < 0·05). In addition, the cortisol concentrations and the neutrocyte count were significantly correlated immediately after exercise (r 0·58, P < 0·05) and at the end of the 2 h recovery period (r 0·69, P < 0·005).
Serum cortisol concentrations (μg/l) before, during and after exercise in the H-H (high glycaemic index (GI) and high glycaemic load (GL); –♦–), L–L (low GI and low GL; –■–) and H–L (high GI and low GL; –▲–) trials. Values are the means and standard error of the mean (indicated by vertical bars) for eight subjects. Two-way ANOVA with repeated measures showed a significant trial × time interaction, P < 0·05. Bonferroni correction was used to analyse significance at specific time points. Mean value was significantly different from pre-exercise: *P < 0·05. Mean value was significantly different from H-L: †P < 0·05.

Discussion
To our knowledge, this may be the first study that directly determined the role of GI and GL on immune responses during endurance exercise. The major finding of the present study revealed that the consumption of a high-CHO meal (H-H and L-L), resulted in less perturbation of the circulating numbers of leucocytes, neutrophils, and T lymphocyte subsets, and decreased the elevation of plasma IL-6 concentrations immediately after exercise and during the 2 h recovery period compared with a low-CHO meal (H-L). These responses were accompanied by an attenuated increase in plasma IL-10 concentrations at the end of the 2 h recovery period.
Most other studies of CHO intervention have used continuous prolonged exercise of fixed intensity (% VO2max) and duration and in this situation CHO ingestion during exercise is effective in minimizing perturbations in circulating stress hormones and immune cell functions. CHO is also effective in extending exercise to the point of fatigue; however with the onset of fatigue the immunological responses are different from those during constant-load exercise of fixed duration(Reference Bishop, Walsh and Haines1). Similarly, CHO ingestion during intermittent exercise seems less effective than for continuous exercise with fixed intensity, partly because the plasma glucose concentration seems to be better maintained in intermittent exercise(Reference Bishop, Walsh and Haines1, Reference Nieman, Nehlsen-Cannarella and Fagoaga2). In the present study, a preloaded fixed duration of a 1 h run at 70 % VO2max was used followed by a 10 km performance run. Exercise performance in this situation was not affected by pre-exercise CHO intake(Reference Chen, Wong and Wong19) which is in agreement with most other studies that have examined the effects of high-CHO pre-exercise meals on endurance performance. Immunoendocrine perturbations induced by exercise were generally of smaller magnitude on H-H and L-L compared with H-L, indicating that the amount of CHO consumed is the most important factor of pre-exercise meal composition in modifying the immunoendocrine response to prolonged exercise.
Exercise has been shown to produce significant leucocytosis, neutrophilia, lymphocytosis, and elevations in lymphocyte subsets. Leucocytosis and neutrophilia may be sustained for a few hours during the recovery period; however, the lymphocytosis and elevations in lymphocyte subsets are typically followed by a significant depression during recovery(Reference Bishop, Walsh and Haines1, Reference Nieman3). The pattern of changes in total leucocytes, neutrophils, and lymphocyte subsets in the three trials was similar to that reported in previous studies(Reference Bishop, Walsh and Haines1, Reference Lancaster, Jentjens and Moseley5). It has been suggested that changes in immune cell counts are caused by the exercise-induced elevations in stress hormones and/or haemodynamic factors, both of which are intensity independent(Reference Nieman, Nehlsen-Cannarella and Fagoaga2, Reference Gleeson, Bishop and Maughan23). However, the response observed in the present study seemed to be an identical exercise in the three dietary treatments. Thus, the greater shift of circulating immune cell number in the low-CHO trial (H-L) could be attributed to the hormonally induced recruitment from the marginal pool and the bone marrow by indirect influence of differences in energy substrate availability in the meals. The moderate correlation between cortisol concentrations and the neutrocyte numbers immediately after exercise and at the end of the 2 h recovery period in the present study may partly support this speculation.
One interesting finding in the present study is that there were no differences in the blood circulating cell numbers between the two high-CHO trials (H-H and L-L), although the total CHO oxidation was higher in the H-H trial compared with that in the L-L trial. It is different from a study reported recently, in which the GI of a meal (2·0g CHO/kg body mass) consumed 3 h before 90 min of treadmill running influenced leucocyte trafficking and plasma glucose concentrations(Reference Li, Wu and Gleeson6). Thus, it can be postulated that the amount of CHO provided (1·5 g CHO/kg body mass) in the two high-CHO meals in the present study may not be sufficient to elicit large metabolic perturbations. The two high-CHO meals with different GI (H-H and L-L), produced similar plasma glucose concentrations during exercise, and thus the immune cell trafficking in these two trials. This postulation may get further support from a recent report by Scharhag et al., in which 6 % or 12 % CHO beverage supplementation reduced immunological stress and blood glucose concentrations to the same extent during prolonged exercise(Reference Scharhag, Meyer and Auracher24). Although the average exercise intensity of the subjects in the present study was not too high, it reached a corresponding 85 % VO2max speed at the end of the 10 km TT. It has been reported that the CHO supplementation in shorter and more intensive exercise bouts did not influence neutrophil mobilization and function, nor did it reduce oxidative stress, probably because of higher concentrations of catecholamines during more intensive exercise bouts(Reference McAnulty, McAnulty and Nieman25).
CHO ingestion attenuated elevations in plasma IL-6 during both running and cycling mainly because of its effect at the post-transcriptional level of IL-6(Reference Nieman, Nehlsen-Cannarella and Fagoaga2, Reference Pedersen, Steensberg and Keller26, Reference Nehlsen-Cannarella, Fagoaga and Nieman27), whereas low muscle glycogen concentrations further enhanced IL-6 mRNA and the transcription rate for IL-6(Reference Steensberg28). Therefore, muscle glycogen content appears to be an important stimulus for IL-6 which acts as an energy sensor. In the present study, a marked elevation of plasma IL-6 concentrations was observed in the low-CHO meal (H-L), immediately after exercise and during the 2 h recovery period compared with the high-CHO trials (H-H and L-L). A number of studies have indicated that IL-6 was involved in the regulation of glucose homeostasis and lipolysis during exercise and high IL-6 concentrations were consistent with an enhanced lipolysis(Reference Petersen, Carey and Sacchetti29), as similarly showed in the H-L trial in the present study. However, because of the absence of data on muscle glycogen concentrations and the glucose kinetics throughout the experimental process, the accurate muscle glycogen status before and after exercise in the three trials cannot be confirmed. It is commonly recommended for athletes undertaking strenuous daily training or competition to eat a moderate-sized CHO meal before exercise for optimal storage of liver and muscle glycogen(Reference DeMarco, Sucher and Cisar8, Reference Wee, Williams and Gray10). However, a recent study(Reference Wee, Williams and Tsintzas30) also suggested that during the 3 h postprandial period, the muscle glycogen concentration increased by 15 % after the high-GI meal but remained unchanged after the low-GI meal. The similar glycaemic and insulinaemic responses during the 2 h postprandial period between the two low-GL trials (L-L and H-L) in the present study may have produced a similarly low muscle glycogen resynthesis. Considering the low-CHO components in the H-L trial (0·8 CHO/kg body mass) and the same amount of CHO and fat oxidation in the two low-GL trials (L-L and H-L) during exercise, it is likely postulated that a slightly lesser portion of unoxidized CHO remained in the gastrointestinal space at the onset of the exercise, and a more decreased muscle glycogen content found in the H-L trial(Reference Chen, Wong and Wong19).
The TNF, produced locally, are usually referred to as classic pro-inflammatory cytokines which can stimulate the production of IL-6(Reference Dinarello31). IL-6 inhibits lipopolysaccaride-induced TNFα production both in cultured human monocytes and in the human monocytic line U937. Also the levels of TNFα are markedly elevated in anti-IL-6-treated mice and in IL-6-deficient knockout mice(Reference Matthys, Mitera and Heremansl32), indicating that circulating IL-6 is involved in the regulation of TNFα. In addition, recombinant human IL-6 infusion inhibits the endotoxin-induced increase in circulating levels of TNFα in healthy human subjects(Reference Starkie, Ostrowski and Jauffred33). Thus, it was not surprising that no TNFα concentrations were detected in the present study even using a highly sensitive ELISA kit because of the profound increase in IL-6 concentrations both during exercise and the recovery period. Similar results have been reported on sixteen male runners after a competitive marathon race, which indicated that this cytokine may not occur after exercise at all or may have been inhibited by the higher IL-6 concentrations(Reference Suzuki, Nakaji and Yamada34).
The concept that IL-10 acts as an anti-inflammatory molecule was suggested primarily by studies showing the inhibition of the synthesis of a large spectrum of proinflammatory cytokines, including TNFα, by different cells, particularly those of monotypic lineage. In the present study, elevated IL-10 and cortisol concentrations were observed at the end of the recovery period, which was similar to IL-6 in the low-CHO (H-L) trial. This was in agreement with the study of Steensberg et al. (Reference Steensberg28) in which the appearance of IL-6 in the circulation was by far the most marked, an appearance which preceded that of the other cytokines. Alterations in cortisol were thought to be responsible for many of the changes in the immune status commonly observed following vigorous exercise. Meanwhile, Nieman et al. (Reference Nieman, Henson and Smith35) also demonstrated a beneficial effect of CHO supplementation on IL-10 responses following a marathon race, in which the effect was linked to higher plasma glucose concentrations and lower cortisol concentrations in the CHO trial as compared with the placebo group.
Conclusions
The low CHO (H-L) meal was associated with the higher perturbation of circulating leucocytes, neutrophils, lymphocytes, and lymphocyte subsets, which may be explained by greater responses of the stress hormone. The consumption of the high-CHO meals, i.e., H-H and L-L, 2 h before exercise also minimized the increase in IL-6 immediately after exercise and during the 2 h recovery period compared with the low-CHO meal, i.e. H-L. Such responses also led to the attenuated increase in IL-10 at the end of the recovery period. These results suggested that the amount of CHO consumed may be the most important influencing factor of pre-exercise meal composition in modifying the immunoendocrine response to prolonged exercise irrespective of its GI and GL values.
Acknowledgements
This research was supported by the Direct Grant of the Chinese University of Hong Kong. The authors wish to thank all the young men who participated in the study. Furthermore, we thank Dr P. K. Chung, Mr Raymond So, and Dr Yvonne Yuan for technical assistance, and Ms Susan Chung for providing the meals and nutritional calculation. We also thank Mr P. W. Li and Dr W. K. Ip from the Department of Chemical Pathology for their technical assistance during data collection. We declare that there is no conflict of interest that we should disclose.


