


Introduction
Since Reid's seminal publication on submerged forests, a range of studies have attempted to define the archaeological potential of the North Sea (Reid Reference Reid1913; Clark Reference Clark1936; Wymer Reference Wymer1968; Coles Reference Coles1998; Gaffney et al. Reference Gaffney, Thomson and Fitch2007; Peeters et al. Reference Peeters, Murphy and Flemming2009). Much of this work, however, has understandably focused on the nature of the geological, and for the most-part Holocene, record. The investigation of archaeological remains has evolved at a far slower pace, particularly on the UK shelf. With data from UK waters we can, however, start to redress this balance by documenting the extant offshore faunal record that, over the last two centuries, has been dispersed across local and national collections, and by demonstrating its significance for key archaeological questions. While our research relates directly to the southern North Sea, and thus to the occupation of north-west Europe, this archival approach is applicable to any area of continental shelf that was exposed during the Quaternary.
Reid (Reference Reid1913: 2) noted that submerged deposits require focused attention, as their significance is likely to be overlooked by archaeologists. While submerged landscapes cannot hold the key to all of our unanswered questions, excluding them can only work to our detriment. In the case of the southern North Sea, much of the evidence from the lower reaches of Palaeolithic fluvial systems, argued to be important ecotones (Ashton & Lewis Reference Ashton and Lewis2012), has been lost through submergence, along with strips of coastal deposits. If we do not engage with these invisible Palaeolithic landscapes, we accept a serious bias to data distribution. New ways to access the existing submerged resource are therefore vital if we are to understand fully the scope of Palaeolithic occupation, movement and adaptation.
Large scale recovery of faunal material by Dutch trawlers since the 1960s (Kortenbout van der Sluijs 1971) has led to extensive investigation and characterisation of these assemblages from the most southerly sector of the southern North Sea (van Kolfschoten & Laban Reference van Kolfschoten and Laban1995; Mol et al. Reference Mol, Post, Reumer, van der Plicht and de Vos2006; Mol & Post Reference Mol and Post2010), and strong relationships with their trawling industry have led to an ever finer resolution of provenance. For the UK, the vast majority of material in museum collections was recovered during the nineteenth and early twentieth centuries. The subsequent decline of the trawling industry reduced the amount of material collected and curated, with a historical approach hence required in order to exploit the full potential of the resource. Significantly, this not only has the potential to help us understand distributions, but also to indicate where in situ sequences of deposits may survive.
This first quantification and analysis of the Pleistocene fauna from the UK sector of the southern North Sea demonstrates the degree to which the archaeological importance of this record has been undervalued. The provenance of the specimens can, to varying degrees, be correlated with particular areas of the seabed, crucially revealing significant chrono-spatial trends that can be used to target future work.
Archaeology and submerged landscapes
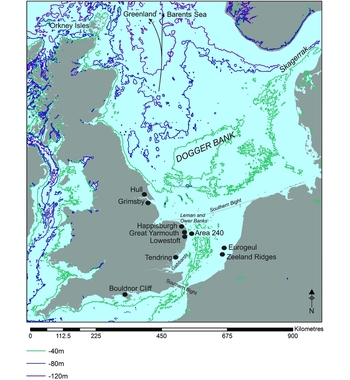
One hundred years after Reid, Roebroeks states: “Any consideration of the Pleistocene occupation history of [the North Sea] needs to deal with the fact that a major part of the landscape available to Pleistocene hunter-gatherers is currently submerged under the water” (Roebroeks Reference Roebroeks2014: 43). Despite this and other powerful statements, there has been very limited archaeological investigation (Westley et al. Reference Westley, Bailey, Davies, Firth, Flemming, Gaffney, Gibbard, Ransley, Sturt, Dix, Adams and Blue2013). Only two sites from UK waters—outside the inter-tidal zone—have been subject to detailed archaeological investigation: the Palaeolithic site of Area 240 (Tizzard et al. Reference Tizzard, Bicket, Benjamin and Loecker2014) and the Mesolithic site of Bouldnor Cliff (Momber et al. Reference Momber, Tomalin, Scaife, Satchell and Gillespie2011) (Figure 1). The general discourse that exists is one of noted high potential, but little recourse to the material record to demonstrate it.
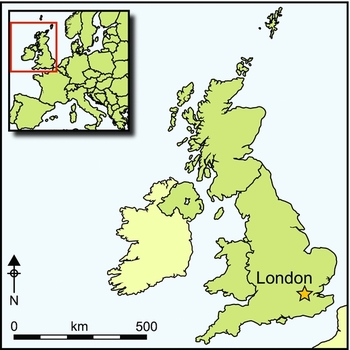
All locations and sites mentioned in the text, with contours showing current offshore bathymetry. Contours are derived from Smith and Sandwell (Reference Smith and Sandwell1997).
Despite a lack of direct intervention or analysis of material recovered from UK waters, there has been a step change in our understanding of the offshore deposits and how they relate to submerged landscapes. The pioneering work by Gaffney and his team on the Dogger Bank provided the first geophysical evidence of the preservation of large, postulated Mesolithic landscapes (23000 km2: Gaffney et al. Reference Gaffney, Fitch and Smith2009: 78). Subsequent exercises undertaken on large offshore industry datasets have started to expand our understanding of the geological complexity of the UK shelf, with fragmentary landscapes directly dated back to the early Middle Pleistocene (Dix & Sturt Reference Dix and Sturt2011). By contrast, the actual recovery of either archaeological or faunal material is limited to a few, poorly contextualised finds (Gaffney et al. Reference Gaffney, Fitch and Smith2009).
A different history of research is shown by the countries that share the waters surrounding the UK. Dutch researchers have examined large numbers of faunal remains, predominantly from the Brown Bank and the dredging of the Eurogeul (e.g. van Kolfschoten & Laban Reference van Kolfschoten and Laban1995; Mol et al. Reference Mol, Post, Reumer, van der Plicht and de Vos2006). Radiocarbon dates place these largely in the Devensian-Weichselian, mammoth steppe environments (MIS 3/2, c. 60000–15000 years ago) (Mol et al. Reference Mol, Post, Reumer, van der Plicht and de Vos2006; Mol & Post Reference Mol and Post2010). Even more significant was the discovery of the first offshore hominin fossil: a Neanderthal brow ridge, dredged from the Zeeland Ridges (Hublin et al. Reference Hublin, Weston, Gunz, Richards, Roebroeks, Glimmerveen and Anthonis2009). Geophysical and geotechnical interpretation of local deposits place this at c. 50000–30000 years ago (Hijma et al. Reference Hijma, Cohen, Roebroeks, Westerhoff and Busschers2012).
Remote sensing is extremely valuable for defining landscapes and deposits. Such projects are increasing in number with the public release of huge datasets from offshore infrastructure projects, but a corresponding push is needed to seek the material culture present on the seabed. The significance of serendipitous finds, such as Area 240, cannot be overstated, yet the fragmentary nature of outcropping Palaeolithic deposits demands a more proactive, focused approach if we are to continue to move the discipline forward.
Considerable steps have been made towards achieving the higher resolution understanding of offshore geological sequences required to contextualise archaeological finds. Investigations of the southern North Sea have progressed from broad-scale mapping of Pleistocene deposits (e.g. Cameron et al. Reference Cameron, Crosby, Balson, Jeffery, Lott, Bulat and Harrison1992) to finer-grained analysis based on the integration of multiple datasets (e.g. Dix & Sturt Reference Dix and Sturt2011; Hijma et al. Reference Hijma, Cohen, Roebroeks, Westerhoff and Busschers2012). This has increased the potential for the discovery of new finds within securely understood contexts. In order to move beyond broad generalisations, however, our understanding of the existing faunal and material cultural record in the UK sector must move to a commensurate level. Only then will we appreciate what the sequences of the southern North Sea can tell us about the Palaeolithic of the region, and thus how significant the identified deposits may be.
The record
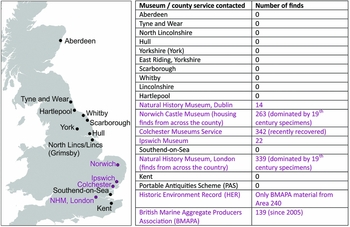
Through the extensive work of antiquarians and amateur (and, to a limited extent, professional) archaeologists, a prolific body of faunal material, mainly from trawling, has been deposited within museum collections across the UK (Figure 2). These collections have never before been systematically investigated. Our work focused on national collections and those East Coast museums that were historically associated with major fishing fleets operating in the southern North Sea. Over 1120 specimens identified as being from the southern North Sea have been located, recorded and analysed (Bynoe Reference Bynoe2014; see also online supplementary material (OSM)). These include 26 species previously identified by specialists at the Natural History Museum, Norwich Castle Museum and Colchester Museums Service, and a further 14 identified only to genus (Figure 3 & OSM).
Locations of museum (and county) collections consulted, and sources with North Sea material, including total specimens.
North Sea species from the UK data. Those in red are pre-Anglian, blue are post-Anglian, green denotes species present throughout the Pleistocene and grey shows fauna not identified to species level.

Inevitably, taphonomic processes (visibility, collector preference and entrapment in nets) have skewed this record, favouring larger and more robust specimens. In order to maximise the interpretative potential of this record, the temporal distribution of each species was combined with information regarding where they were landed and the idiosyncrasies of the contemporary trawling industry. Such contextual information allows us to move beyond the find-spots shown in Figure 1 and to identify emerging patterns within the dataset.
Widespread use of trawling in the North Sea began in the nineteenth century and expanded rapidly, responding to demands greatly increased by the Industrial Revolution and population growth (Figure S1 in OSM; Butcher Reference Butcher1980; Robinson Reference Robinson1996; Engelhard Reference Engelhard, Payne, Cotter and Potter2008). Through understanding the development of this industry, crucial points can be identified that facilitate the broad provenancing of these specimens: first, those areas of the seabed exploited by trawlers and hence where the material might originate; and second, how the overall pattern—as well as the trawling ports the specimens were landed at—relates to the locations and activities of the antiquarians curating the material.
Published oral histories from trawlermen and historical sources indicate three main areas of seabed were exploited by trawling fleets (Figure 4; Butcher Reference Butcher1980, Reference Butcher1985; Robinson Reference Robinson1996):
-
• On and around the Dogger Bank, northward towards the entrance to the Skagerrak and out towards the Shetland Islands/Greenland/Barents Sea; principally exploited by fleets operating from the north-eastern ports of Grimsby and Hull.
-
• On and around the Dogger Bank to the south of 55° but north of the Leman and Ower Banks; exploited by fleets working out of Great Yarmouth.
-
• Areas to the south of the Leman and Ower Banks in the north, to the Dutch coast in the east and as far south as the Gabbards; exploited by fleets working from Lowestoft.
a) The range of historic trawling locations identified, see Table S2 in online supplementary material for corresponding numbers and co-ordinates; b) Great Yarmouth Grounds and Northern fleets; c) Lowestoft Grounds.
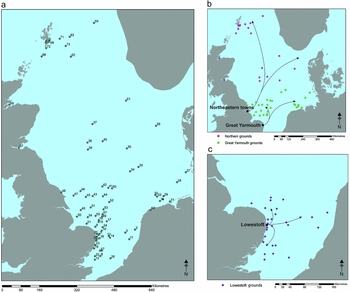
Trawling was also practised at a smaller scale by coastal communities (Smylie Reference Smylie1999; Butcher pers. comm.), providing a fourth element: smaller boats launched from the beach and exploiting areas within a few kilometres of the coastline, landing their catches at locations without formal ports.
We can therefore relate distinct fishing locations to specific ports (Figure 4 & OSM). Specimens landed at these ports can, in turn, be assigned to those areas of seabed.
Consideration must also be given to the antiquarian collectors who curated this material. Over 60 individuals were identified, but the bulk is attributable to four people: the Reverend James Layton, J.J. Colman, the Reverend John Gunn and John Owles. By noting where these collectors lived and where their specimens were landed (documented in acquisition registers and on original labels (Figure 5g)), it is possible to link aspects of their collections with certain ports and, therefore, to areas of seabed (Figure 6).
Examples of fauna from the UK collection with range of conditions: a) Cervus sp. antler base, very rounded edges and breakage; b) mandible of Trichechus huxleyi, surface abrasion and marine growth; c) atlas of Rhinoceros sp., marine growth and extensive breakage; d) Coelodonta antiquitatis mandible, breakage of extremities but a well-preserved bone surface; e) relatively well-preserved pelvis of Cervus sp., breakage at the extremities; f) atlas of Canis lupus, well-preserved bone surface and no breakage; g) Cervus sp. skull showing Owles’s Great Yarmouth stamp.

Collection areas of the main historic collectors: a) Layton; b) Owles; c) Gunn; d) Colman.

Analysis
Of the 1120 specimens included in this study, 71% (n=790) have information that ties them to particular locations. Many are general areas such as the East Coast or Suffolk, but when combined with information regarding their collectors, it is often possible to refine that further. For example, antiquarian John Owles collected from the Great Yarmouth fleets during the mid nineteenth century (Figures 5 & 6), so his ‘East Coast’ specimens can be associated with the grounds exploited by these trawlers. Similarly, those labelled as from Norfolk and Suffolk can be assigned to Lowestoft fishing grounds. The remaining 330 specimens lack locational information and are not included in the current analysis.
Recognising these spatial patterns allowed each set of specimens to be studied according to the area of the seabed from which they came. Within these spatial groupings, they were further refined by each species’ occurrence pre- and post-Anglian Glaciation (478000–424000 years ago) in Britain (see Figure 7), providing broad spatio-temporal patterns. Chronological attribution is based on mammalian biostratigraphy, a commonly used tool for distinguishing particular stages of the Pleistocene, as the fluctuating climate of this period gave rise to rapid and geographically distinct species turnover (e.g. mammal assemblage zones (MAZ); Currant & Jacobi Reference Currant and Jacobi2001; Schreve Reference Schreve2004 and references therein). This methodology can be applied at a high level of detail (i.e. assigning deposits to a particular MAZ or marine isotope stage). For our current, broad resolution analysis, however, it is used more simply to identify pre- and post-Anglian species, in each case by combining groups of MAZs. The Anglian Glaciation has been taken as a marker point because of its significant effect on species turnover (Schreve Reference Schreve2004; Breda et al. Reference Breda, Collinge, Parfitt and Lister2010), so that temporal differences in the appearance and disappearance of the species represented should be easier to distinguish.
Faunal species recognised in the UK North Sea dataset, and their known occurrence in Britain (after Currant & Jacobi Reference Currant and Jacobi2001; Schreve Reference Schreve2004; Breda et al. Reference Breda, Collinge, Parfitt and Lister2010; Lister et al. Reference Lister, Parfitt, Owen, Collinge and Breda2010; Preece & Parfitt Reference Preece and Parfitt2012). Red squares indicate the known first and last appearance dates of species.
Clear patterns emerge from the analysis (Figure 8a). The Great Yarmouth specimens (Figures 4b & 8b) are dominated by post-Anglian species (85%) with only small numbers of pre-Anglian (9%), together with others that are present throughout the Pleistocene (6%), including small numbers of distinctly interglacial species, such as Palaeoloxodon antiquus (straight-tusked elephant). Of the post-Anglian species, 68% belong to Mammuthus primigenius (woolly mammoth), with far smaller percentages of Coelodonta antiquitatis (woolly rhino) and Bos primigenius (aurochs)—both 6%—as well as Rangifer tarandus (reindeer, 3%), with Trichechus rosmarus (walrus) and Megaloceros giganteus (giant deer) at <1% each.
a) Changing proportions along the coastal locations; b) changing proportions from Great Yarmouth and Lowestoft fleets, plus inset chart showing the coastal species from locations with larger sample sizes.

The Lowestoft specimens (Figure 4c & 8b) are also dominated by post-Anglian species (72%), but with higher proportions of pre-Anglian (19%) and Pleistocene (9%) species, and, overall, a larger component of interglacial species. Again, this collection is dominated by M. primigenius (51%), but with slightly higher proportions of other post-Anglian species, such as B. primigenius (9%) and C. antiquitatis (8%). Both areas exhibit broad trends towards post-Anglian species, particularly those in existence towards the latter end of this time-range, dominated by species adapted to open, cooler environments such as those of late MIS 7 (243000–190000 years ago) and MIS 3 (60000–30000 years ago) (Currant & Jacobi Reference Currant and Jacobi2001).
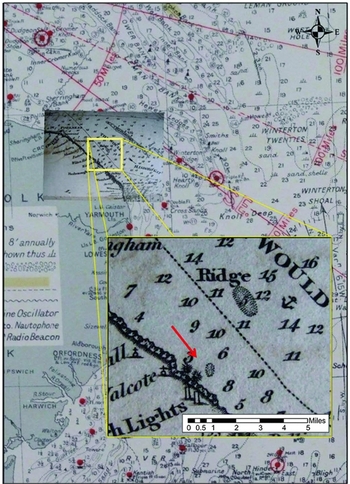
Finds from near-shore locations can also be linked to particular source areas, and reveal the presence of deposits from varied time periods. Sequences off the northern coast of East Anglia are dominated by pre-Anglian species (81% at Happisburgh). Here, a short-lived oyster bed in the 1820s yielded specimens collected by the Reverend Layton (Layton Reference Layton1827), which account for 90% (n=44/49) of those from this area of seabed. Figure 8a shows the dominance of pre-Anglian species within this group, implying that this oyster bed was sited upon submerged fossiliferous deposits of the Cromer Forest-bed Formation. Surviving accounts of the oyster bed place its exact location at “[a]bout three quarters of a mile from shore, opposite Happisburgh” (Reid Reference Reid1890: 174), with a hint of its existence on an 1826 map showing a seabed obstruction at that position (Figure 9). This suggests a relatively discrete area of seabed that is currently under investigation.
Imray, Laurie, Norie & Wilson fishing chart from 1964 with expanded box of an 1826 chart showing the presence of an area of seabed obstruction in the location of the described oyster beds.
Near-shore deposits towards the south (Figure 8a: especially the Tendring Peninsula) are dominated by later Pleistocene species (n=75%), probably Late MIS 7 or MIS 3 from the dominance of M. primigenius and C. antiquitatis (Currant & Jacobi Reference Currant and Jacobi2001). Using locational information from a local trawlerman in combination with geophysical data, these ‘Tendring’ specimens suggest the existence of a discrete area of fossiliferous deposits for further investigation. In addition, smaller numbers of interglacial species, such as P. antiquus, Hippopotamus sp. and Stephanorhinus hemitoechus (narrow-nosed rhinoceros), within the Tendring dataset, demonstrate the likelihood of outcropping Last Interglacial deposits, supported by an OSL date of 116±6.5 kya from a sediment core taken from associated deposits (Dix & Sturt Reference Dix and Sturt2011: 110).
In these two examples, the observed patterns demonstrate that the search for submerged Palaeolithic deposits could be narrowed to specific locations. There are also differencesof scale. Higher-resolution information provides local insights into hominin behaviour or ecologies, while broader evidence addresses longer-term patterning of environmental and archaeological change.
Discussion
In the collection as a whole there is a dominance of post-Anglian fauna, with M. primigenius by far the best represented species (Figure 3). This may be due to biases of size, robusticity or visibility, but it is reinforced by relatively high numbers of other post-Anglian species. These have probably been subject to fewer episodes of glacially related erosion owing to their more recent deposition, and are less deeply buried. This is supported by recent geophysical work on the Dogger Bank, which indicates that large areas of Early Holocene deposits, sometimes only 1m thick (Fitch et al. Reference Fitch, Thomson and Gaffney2005), overlie those from the Late Pleistocene (Gaffneyet al. Reference Gaffney, Thomson and Fitch2007, Reference Gaffney, Fitch and Smith2009). Given the wide geophysical line spacing and necessary extrapolation for the creation of these deposit models, it is possible that outcropping deposits yielding these specimens are being missed by these analyses.
Within this broad post-Anglian group there is scope for further refinement, as several species appear at different points, forming part of a common assemblage type. Eight species are post-Anglian (Figure 3), all of which (aside from B. primigenius and S. hemitoechus) could be associated with mammoth steppe (Guthrie Reference Guthrie, Hopkins, Matthews, Schweger and Young1982, Reference Guthrie2001; Kahlke Reference Kahlke1999; Currant & Jacobi Reference Currant and Jacobi2001), and with the periglacial environments that prevailed in the southern North Sea throughout the Late Pleistocene (e.g. Mol et al. Reference Mol, Post, Reumer, van der Plicht and de Vos2006; Mol & Post Reference Mol and Post2010). These eight species are similar to van Kolfschoten and Laban's (Reference van Kolfschoten and Laban1995) third faunal group from the Dutch North Sea, ‘Late Pleistocene terrestrial’. Some of these species (C. antiquitatis, M. primigenius) have, however, also been found within coombe rock deposits of MIS 8 age (c. 300000–244000 years ago) in the Ebbsfleet Valley (Bridgland Reference Bridgland1994), making their association with the Late Pleistocene less conclusive, but nevertheless placing them within the broad period of mammoth steppe environments.
Despite the dominance of younger species, the relatively high frequency of pre-Anglian fauna (22%, n=97) also demonstrates the survival of much older material, a picture also seen in the Dutch groups (‘Late Early Pleistocene/early Middle Pleistocene terrestrial’: van Kolfschoten & Laban Reference van Kolfschoten and Laban1995). The deeper burial of deposits from these earlier periods, however, means that their potential for outcropping is reduced but, with more detailed mapping, their potential locations can be refined. All of the species (other than the Early Pleistocene S. etruscus) belong within the early Middle Pleistocene.
The heavily trawled Brown Bank (historically exploited by Lowestoft trawlers during the summer) and the Eurogeul are dominated by Late Pleistocene mammoth steppe material (Mol et al. Reference Mol, Post, Reumer, van der Plicht and de Vos2006; Mol & Post Reference Mol and Post2010). In the same vicinity, Dutch trawlers throughout the 1960s and 1980s were recovering large quantities of fauna dominated by early Middle and Late Pleistocene species, with only a few Early Pleistocene species—M. meridionalis and Anancus arvernensis—both early forms of mammoth so far not seen in the UK data (van Kolfschoten & Laban Reference van Kolfschoten and Laban1995).
As they were collected from approximately the same areas of seabed, the UK specimens from off Lowestoft show similarities when compared with the specimens from van Kolfschoten and Laban (Reference van Kolfschoten and Laban1995): a dominance of M. primigenius and other Late Pleistocene species, and good representation of pre-Anglian species (Table 1). The greater diversity of species in the Dutch data probably reflects the history of the UK collections, which contain many of the same mammals at genus level that are not yet identified to species. The higher numbers of early Middle Pleistocene species within the UK data could result from the exploitation of seabed outcrops close to the East Anglian coastline, recovering species associated with the Cromer Forest-bed Formation.
Species list of all UK fauna, showing how the Lowestoft data compare with the spatially comparable Brown Bank data (van Kolfschoten & Laban Reference van Kolfschoten and Laban1995).

This species patterning may be due to the presence of Pleistocene outcrops underneath (and between) mobile sand banks in the southern North Sea. This raises the issue of sediment accumulation and movement both burying and exposing relevant deposits on the seafloor; future work may be key to identifying the location of these deposits.
Ongoing work in the Dutch sector—drawing on relationships with modern trawlers to improve spatial resolution—supports the inference from the UK data that areas of intact Pleistocene deposits survive in the southern North Sea. Further direct investigation of these deposits and their archaeological potential is now crucial.
The Quaternary geological record of the southern North Sea forms an important part of this research. Understanding the nature of its formation and the processes that have affected, and continue to affect, the deposits will be key to refining our knowledge of both faunal and archaeological assemblages. This area of research is not, however, within the scope of this paper; for reviews on the geology of the area see Cohen et al. (Reference Cohen, Gibbard and Weerts2014 and references therein).
Ecological patterning
Taxonomic evolution has been used throughout this analysis to provide a broad chronological framework for the groups of specimens (see Figure 7). The current level of research into submerged Palaeolithic landscapes does not, however, permit us to appreciate the finer aspects of dynamic ecologies, which should form a vital aspect of future, more targeted work. Today, we have a coarse picture derived from large-bodied, mainly herbivorous mammals that fall into the categories of either cold-stage or warm-stage fauna, with the former dominating.
The relatively low numbers of P. antiquus specimens, despite their broad temporal range and large, robust bones, suggests that interglacial deposits are poorly represented. This is supported by the relatively small proportions of other representative interglacial species such as Castor fiber (European beaver), whose presence indicates riparian, woodland habitats, and S. hemitoechus. Higher sea levels during interglacials may have been responsible for the relative paucity of interglacial deposits on the seabed.
The prevalence of M. primigenius is also significant from an ecological perspective. M. primigenius, alongside C. antiquitatis, is present during the interglacial of MIS 7 (Figure 7) where it is associated with a temperate climate but open environments (Candy & Schreve Reference Candy and Schreve2007). Its dominance in this analysis is, therefore, not necessarily indicative of glacial conditions, but of the expansion of the open, mammoth steppe from MIS 8 onwards.
One unusual feature that has been noted here and elsewhere (Mol et al. Reference Mol, Post, Reumer, van der Plicht and de Vos2006) is the abundance of C. antiquitatis from the southern North Sea. This species is relatively common, given its restricted temporal range, especially within the tightly confined Tendring dataset. Here, there is also a high proportion of Rhinoceros sp. remains (unidentified to species level). It will be interesting to see if these specimens ultimately fall into the C. antiquitatis category.
The high frequency of C. antiquitatis within two southern North Sea datasets may indicate that there was something particular about the habitats in these areas that C. antiquitatis found preferable, but that is as yet unknown. They were a grazing species adapted to seasonal variability (Kahlke & Lacombat Reference Kahlke and Lacombat2008), exploiting open grasslands as well as glacial tundra steppe, e.g. Ariendorf 1 (Turner Reference Turner1997), and were most prolific throughout MIS 3 (Kahlke & Lacombat Reference Kahlke and Lacombat2008). Did certain habitats that existed in what is now the southern North Sea epitomise these types of environment more than the surrounding landscapes? Further work on the environmental signature of deposits related to the faunal specimens is needed to address issues such as this, and will become easier once specific seabed locations have been identified. As ecological indicators, these individual specimens offer only a coarse-grained indication of their environments. As another strand of chronological evidence, however, the prevalence of C. antiquitatis supports the dominance of later Pleistocene, mammoth steppe-adapted species.
The picture of the seabed presented by these specimens is complex, with patches of deposits representing a range of periods and environments. The sporadic occurrences of interglacial species are significant, as the broad-scale mapping of Quaternary deposits would not lead us to expect them. Given that large-scale deposit models rely on widely spaced geophysical lines, with only occasional cores for groundtruthing, this pattern is likely to be picking up on small fragments of seabed deposits that are currently being missed.
Conclusions
This research has demonstrated that before embarking on expensive and time-intensive archaeological investigations of the seabed, it is possible to establish the broad record of the offshore zone through engagement with extant museum collections. Historical research in tandem with conventional faunal identification not only releases an extensive (>1100 specimens) and hitherto largely unacknowledged resource, but also enables a broad spatially and temporally constrained record to be constructed. While currently working at a relatively coarse resolution in terms of biostratigraphical analysis, even at this coarse level, patterns are emerging: the dominance of cold-stage, post-Anglian species reflects the more recent formation of these deposits, yet the signals of warm-stage species, both pre- and post-Anglian in date, provide hints of a complex and fragmentary landscape often missed by geophysical approaches alone. The identification of several refined seabed locations demonstrates the potential of this method to locate these fragments, with ongoing work looking to investigate the deposits directly through groundtruthing by divers. Analysis of recovered specimens for anthropogenic evidence, such as cut marks, will then be used to bring the archaeological picture into greater focus.
As this study has shown, there can be no doubt about the enormous potential of the offshore archaeological record for Palaeolithic research.
Acknowledgements
Thanks must go to several people, in particular to Simon Parfitt for his help with accessing and analysing collections. Also to Sophie Stevens, David Waterhouse, David Butcher and Les Brand for their help with collections, locations and trawling histories. Finally, thanks to the AHRC for funding this doctoral research, and to Peter Hoare and anonymous reviewers for their helpful comments.
Supplementary material
To view supplementary material for this article, please visit http://dx.doi.org/10.15184/aqy.2016.129


 Open access