

The rapid growth of the aquaculture industry over the last 30 years and the concomitant increasing demand for compound aquaculture feeds have adversely influenced both commodity prices and raised sustainability issues concerning utilisation of natural resources from industrial fisheries such as fishmeal and fish oil(Reference Wurts1, 2). As a consequence, a substantial number of studies have been carried out to elucidate the nutritional value of alternative nutrient sources, such as vegetable proteins(Reference Gatlin, Barrows and Brown3) and oils(Reference Corraze and Kaushik4, Reference Turchini, Torstensen and Ng5), animal by-products(Reference Bureau, Harris and Cho6, Reference El-Haroun, Azevedo and Bureau7) or single-cell organisms(Reference Kiessling and Askbrandt8–Reference Aas, Hatlen and Grisdale-Helland10), as replacements for fishmeal or fish oil in commercial aquaculture diets. Although many of these alternatives have proven to be competitive substitutes to fishmeal or fish oil in terms of price cost, some may raise nutritional, safety or ethical concerns(Reference Gatlin, Barrows and Brown3, Reference Tacon and Metian11–Reference Salta, Panagiotidis and Teliousis13) regarding their use in the fish feed industry.
The natural diet of most aquacultured carnivorous fish species typically has a protein- and lipid-rich nutritional profile, abundant in essential amino acids and fatty acids and practically devoid of carbohydrates or anti-nutrients. Thus, introduction of dietary vegetable raw materials containing relatively high amounts of carbohydrates and possibly associated anti-nutrients may pose a challenge to the carnivorous nature of the digestive processes in these species(Reference Hemre, Mommsen and Krogdahl14, Reference Stone15). In contrast, several studies on gilthead sea bream (Sparus aurata) have reported excellent starch digestibility coefficients(Reference Couto, Enes and Peres16–Reference Venou, Alexis and Fountoulaki18), as well as presence and activity of the major enzymes of the glycolytic pathway(Reference Enes, Panserat and Kaushik17, Reference Enes, Panserat and Kaushik19–Reference Couto, Enes and Peres21), indicating a possible efficient utilisation of dietary starch for energy purposes. However, an apparently prolonged postprandial hyperglycaemia and accumulation of glycogen in muscle and liver tissues(Reference Enes, Panserat and Kaushik17, Reference Enes, Panserat and Kaushik19, Reference Couto, Enes and Peres21, Reference Peres, Goncalves and Oliva-Teles22) suggest an imbalance between digestive/glycogenetic and glycogenolytic/glycolytic activity associated with feeding high-carbohydrate diets to this species. Studies on dietary carbohydrate utilisation in gilthead sea bream have focused on effects of starch origin, processing and inclusion levels on carbohydrate digestibility, growth performance, feed conversion or nutrient retention efficiencies(Reference Couto, Enes and Peres16, Reference Venou, Alexis and Fountoulaki18, Reference Adamidou, Nengas and Henry23), while other studies have also assessed the regulatory effects of dietary digestible carbohydrate on activity of liver enzymes involved in glycolysis, gluconeogenesis, glycogenesis, lipogenesis and amino acid catabolism(Reference Enes, Panserat and Kaushik17, Reference Enes, Panserat and Kaushik19–Reference Couto, Enes and Peres21, Reference Meton, Mediavilla and Caseras24–Reference Panserat, Medale and Blin29). However, as dietary carbohydrate, besides fuelling the glycolytic pathway, can precede de novo lipogenesis, glycogenesis or, as recently found in rainbow trout (Oncorhynchus mykiss), donate carbon backbones for protein synthesis(Reference Felip, Ibarz and Fernández-Borràs30), it is difficult to quantitatively conclude on the fate of dietary carbohydrates. Similarly, studies on the key enzymes of carbohydrate metabolism typically examine enzyme activity as an indicator of metabolite fluxes, but does not quantify end products or determine their origin.
The technique of using stable isotopes in nutritional studies dates back to almost 80 years(Reference Schoenheimer and Rittenberg31) and makes it possible to trace the fate of various compounds in the animal body, assuming that the tracer behaves functionally similar to the tracee, but still can be distinguished from the tracee by measurement. In fish, isotope-labelled carbohydrates have been previously administered to Atlantic cod (Gadus morhua)(Reference Hemre and Kahrs32), rainbow trout(Reference Felip, Ibarz and Fernández-Borràs30, Reference Brauge, Corraze and Medale33), Atlantic halibut (Hippoglossus hippoglossus)(Reference Fraser, Lyndon and Houlihan34) and Atlantic salmon (Salmo salar)(Reference Hemre and Storebakken35) as a single oral bolus or administered intraperitoneally, allowing researchers to determine the metabolic fate of carbohydrates and estimate synthesis rates of their derived metabolites. More recently, 2H-labelled water has also been employed as a tracer in a study investigating glucose metabolism of European seabass (Dicentrarchus labrax)(Reference Viegas, Mendes and Leston36).
The purpose of the present study was to quantify the magnitude of de novo lipogenesis and glycogenesis from dietary starch in gilthead sea bream using 13C-labelled starch. To achieve this, gilthead sea bream were fed four diets formulated to be similar in digestible protein (DP) and digestible energy (DE), but gradually increasing the proportion of DE supplied from fat (fish oil) with DE from starch (wheat starch) enriched with uniformly labelled 13C starch. The gradual 13C enrichment of liver and whole-body glycogen and lipid pools over a period of 30 d was used to estimate starch utilisation and quantify deposition rate of starch carbon for lipogenesis, and to determine the overall significance of dietary starch in liver and whole-body glycogen and lipid pools including their turnover rates.
Materials and methods
Culture conditions and fish
Gilthead sea bream, with an average individual mass of approximately 75 g, were stocked in a recirculated aquaculture system comprising twelve fibre glass tanks with a volume of 800 litres each at a stocking density of twenty-nine fish per tank (BioMar research facility, The North Sea Research Centre, Hirtshals, Denmark). The tanks were designed to quickly and efficiently remove faeces and uneaten feed pellets from tank water via a central bottom drain. Externally mounted swirl separators made it possible to collect and quantify uneaten feed pellets. The trial facility was supplied with filtered North Sea water with a salinity of 34 g/l, and temperature was kept at 24°C throughout the experiment. Water quality was monitored daily, maintaining O2 saturation between 80 and 100 %, ammonium below 1·0 mg/l, nitrite below 1·0 mg/l and nitrate below 100 mg/l. The pH was adjusted to 7·0 using sodium bicarbonate when necessary. Tanks were supplied with system water at a flow rate of 1200 litres/tank per h. A 14 h light–10 h dark photoperiod was maintained throughout the trial.
In parallel to the 13C enrichment trial, another twelve tanks of the same recirculated aquaculture system were stocked with gilthead sea bream, with an individual mass of approximately 200 g at a stocking density of fifty fish per tank. The sole purpose of these fish was to determine apparent digestibility coefficients (ADC) of macronutrients and stable carbon isotopes (13C and 12C) of the diets.
Experimental diets
Four diets were prepared using the Allix2 feed formulation software (A-systems S.A.) (Table 1). The four diets named A, B, C and D were formulated to contain 60, 120, 180 and 240 g starch/kg feed, respectively. In all diets, 0·7 % of the starch was replaced by uniformly 13C-labelled (>98 % 13C) starch (Cambridge Isotope Laboratories, Inc.). Fish oil and cellulose were used to balance dietary energy levels. The diets were supplemented with a vitamin and mineral premix, as well as monocalcium phosphate. Guar gum was added (5 g/kg) to enhance pellet stability and accurately quantify feed waste, and yttrium oxide (Y2O3) was added (0·3 g/kg) as an inert marker enabling indirect measurements of nutrient and stable isotope digestibility. Diets were prepared at the Danish Technological Institute using a twin screw extruder (Contina 37; Werner & Pfleiderer) to produce 3 mm pellets. Following extrusion, diets were dried, vacuum coated with fish oil and cooled.
Diet formulation and chemical composition of experimental diets

EAA, essential amino acids; GE, gross energy; DE, digestible energy.
* Fishmeal: TripleNine Fish Protein, Esbjerg, Denmark; fish oil: South American (Peru); wheat starch: Cargill, Belgium; cellulose: Vitacel R200, Rettenmaier und Söhne GmbH, Germany; guar gum: HV200, LCH A/S, Frederiksberg, Denmark; 13C-labelled starch: Cambridge Isotope Laboratories, Inc., Algal starch (U-13C, 98 %+), catalogue no. CLM-1699-0, Andover, MA, USA; vitamin and mineral mix is estimated to meet the requirements according to the US National Research Council recommendations(62).
† Each of the four diets was produced in a 13C-enriched version (adding 13C-labelled starch) and a non-enriched version (adding wheat starch) in order to determine 13C atom % excess of experimental diets.
‡ GE (MJ/kg) was calculated as the sum of the dietary content of protein, lipid and nitrogen-free extract (NFE), multiplied by their respective energetic values upon complete oxidation(Reference McArdle, Katch and Katch63): GE = (P diet× 23·66)+(L diet× 39·57)+(NFEdiet× 17·58), where P diet, L diet and NFEdiet refer to the dietary protein, lipid and NFE content (%), respectively. NFE was calculated as the sum of dietary protein, lipid, ash and water deducted from 100 % (by difference).
§ DE (MJ/kg) content was calculated as the dietary gross energy, but with the apparent digestibility coefficients (ADC) of each nutrient multiplied into their respective terms:  $$DE = ( P _{diet}\times 23\cdot 66\times ADC_{protein}) + ( L _{diet}\times 39\cdot 57\,\,\times ADC_{lipid}) + ( S _{diet}\times 17\cdot 58\times ADC_{starch}) $$, where S diet is the dietary starch content, and ADCprotein, ADClipid and ADCstarch are the ADC of protein, lipid and starch, respectively.
Experimental procedures
The trial comprised three consecutive feeding periods of 10 d each (thirty feeding days in total), feeding each of the four experimental diets to three replicate tanks (i.e. twelve tanks in all). Six randomly chosen fish were removed from each of the twelve tanks at start-up (day 0), euthanised using 250 mg/l tricaine methanesulfonate (MS-222), weighed and immediately frozen in liquid N2. The fish were pooled at tank level and stored at − 20°C until analysis, constituting the initial fish samples. Remaining fish in each tank were weighed, and the four experimental diets were subsequently fed to triplicate tanks for 10 d at a daily ration adjusted according to the expected biomass in each tank (approximately 1·3 %/d). Fish were fed from 08.00 to 14.00 hours using automatic belt feeders, and any uneaten feed was collected daily to calculate the actual feed intake (FI). At the end of the feeding period, fish were starved for 24 h (day 11) and six randomly chosen fish were removed from each tank (day 12), euthanised, weighed and immediately frozen in liquid N2. The fish were pooled at tank level and stored at − 20°C until analysis, constituting fish samples after 10 d of isotopic enrichment. The same procedures were followed during feeding period 2 (days 13–22) and 3 (days 25–34), yielding a total of 4 × 12 fish samples throughout the trial. The five remaining fish in each tank at the end of the trial (day 34) were weighed, euthanised and discarded.
ADC of dietary macronutrients and stable carbon isotopes (13C and 12C) were determined using the stripping/inert marker method(Reference Austreng37) with yttrium as the inert marker. The ADC determinations were carried out on larger (200 g) fish in order to obtain sufficient quantities of faeces for chemical analysis, and also because larger fish are easier to handle, reducing the risk of contaminating samples with mucus, urine and scales. The four experimental diets were fed to triplicate tanks for 3 weeks, applying a feeding ration of 1·5 % of the estimated biomass per d. The final meal was administered 18 h prior to stripping, when the fish were anaesthetised using MS-222 (50 mg/l) and a gentle bi-lateral pressure was applied to the hindgut in order to provoke defecation. Faeces obtained from fish within each tank were pooled and immediately frozen at − 20°C.
All studies were carried out in accordance to EC directive 86/609/EEC for animal experiments(38).
Sample preparation and chemical and isotopic analysis
Feed samples
Feed samples were homogenised prior to analysis using a Krups Speedy Pro homogeniser. Crude protein was determined according to the International Organisation for Standardisation (ISO)(39), crude fat according to Bligh & Dyer(Reference Bligh and Dyer40) and DM and ash according to Kolar(Reference Kolar41). Yttrium and P were determined according to ISO(42) and Danish Standards(43), while amino acids were determined according to the European Commission(44) and ISO(45). Starch analyses were carried out according to the method by Bach Knudsen(Reference Bach Knudsen46). Aliquots of the homogenised feed samples were lyophilised and finely ground using a mortar and pestle prior to determination of 13C isotope enrichment and elemental carbon.
Faecal samples
Faecal samples were lyophilised prior to analysis using a Christ Beta 2-16 freeze dryer (Martin Christ Gefriertrocknungsanlagen GmbH). Faecal protein was determined by elemental analysis, according to the method described in the section ‘isotopic analysis’, assuming that protein equals 6·25 × N. Faecal lipid was determined according to Bligh & Dyer(Reference Bligh and Dyer40). Faecal starch was determined using a BioVision Starch assay kit (catalogue no. K647-100, Tecan GENios micro plate reader (Austria) fitted with a 570 nm colorimetric filter) and yttrium was determined according to ISO(42) and Danish Standards(43). Aliquots of the faeces samples were lyophilised and finely ground using a mortar and pestle prior to determination of 13C isotope enrichment and elemental carbon and nitrogen.
Fish samples
Fish sampled initially (1 × 12 samples) and by the end of each feeding period (3 × 12 samples) were partly thawed and fractionated into livers, viscera (excluding liver) and carcass. Tissues were kept at or below 0°C during fractionation in order to avoid enzymatic degradation of glycogen, and the different fractions were immediately refrozen at − 20°C prior to further analysis. Liver samples were homogenised in a frozen state using a mortar and pestle, and frozen carcass and viscera fractions were pooled at tank level and homogenised for 60 s using a Tecator 1094 homogeniser (Tecator AB). An aliquot of each sample was further homogenised for 30 s using a Büchi Mixer B-400 (BÜCHI Labortechnik AG). The two fractions (livers and carcass/viscera) were chemically and isotopically analysed separately according to the procedures described later. In the following, the designation ‘whole fish’ and associated metabolite pools refer to the summed whole body mass contribution of the two fractions (i.e. livers and carcass/viscera) multiplied by their respective analytical values. Crude protein, crude fat, DM and ash of the two fractions were determined as described for feed samples, while glycogen was determined using a BioVision glycogen assay kit (catalogue no. K646-100/Tecan GENios micro plate reader (Austria) fitted with a 570 nm colorimetric filter). Isolation of glycogen was done according to Good et al. (Reference Good, Kramer and Somogyi47). Isolated glycogen samples were subsequently lyophilised prior to determination of 13C isotope enrichment and elemental carbon. Lipid samples for 13C isotope enrichment and elemental carbon analysis were obtained during the lipid extraction process of the Bligh & Dyer procedure(Reference Bligh and Dyer40).
Isotopic analysis
Feed samples, isolated liver glycogen and lipid and isolated carcass/viscera glycogen and lipid samples were all analysed for 13C isotope enrichment and elemental carbon, while faecal samples were analysed for 13C isotope enrichment and elemental carbon and nitrogen. Prior to isotopic analysis, aliquots of all samples were packed and weighed into tin capsules (Standard Weight Pressed Tin Capsules 5 × 3·5 mm, catalogue no. D1002; Elemental Microanalysis Limited) using an analytical microbalance (Mettler Toledo MT5; Mettler Toledo Inc.). All carbon isotope and elemental carbon and nitrogen analyses were carried out using a Thermoquest EA1110 CHNS-O elemental analyser coupled to a Thermo Scientific Delta V advantage isotope ratio mass spectrometer via a Thermo Scientific ConFlo IV module.
Calculations
Stable 13C isotope enrichment (δ13C, ‰) of samples was calculated as:
 $$\begin{eqnarray} \delta ^{13}C = (( R _{sample} - R _{standard})/( R _{standard}))\times 1000, \end{eqnarray}$$
where R sample is the 13C:12C ratio of the sample and R standard is the 13C:12C ratio of the reference standard calibrated against the international standard V-PDB (Pee Dee Belemnite).
The 13C atom percent excess (APE, %) of the samples was determined as the difference between the atom percentage (13C atm%) of the enriched sample and the unenriched sample (‘blank’), as shown below:
 $$\begin{eqnarray} APE\,[^{13}C] = ^{13}C\,atm\%_{sample} - ^{13}C\,atm\%_{blank}. \end{eqnarray}$$
Atomic percentages were calculated as:
 $$\begin{eqnarray} ^{13}C\,atm\% = (100\times AR\times (( \delta ^{13}C/1000) + 1))/(1 + AR\times (( \delta ^{13}C/1000) + 1)), \end{eqnarray}$$
where AR is the absolute 13C:12C ratio of V-PDB (0·0112372), as given by Craig(Reference Craig48).
Deposition rate of lipid derived from starch (LDR, mg/kg biomass per d) was calculated as:
 $$\begin{eqnarray} LDR = \,((mg\,lipid\,synthesised\,from\,starch( t _{ i } - t _{0})/kg\,biomass\,( t _{ i }))/ t _{ i } - t _{0}), \end{eqnarray}$$
where mg lipid synthesised from starch = (g carbon of starch origin found in whole-body lipid fraction (t i)/% carbon in whole-body lipid fraction (t i)) × 1000.
The carbon content of the whole-body lipid fraction was determined from the MS analysis, while the amount of carbon deriving from starch found in the lipid fraction of the fish was determined as:
 $$\begin{eqnarray} g\,lipid\,C_{(starch\,origin)} = (g\,lipid\,^{13}C\,in\,excess/\% ^{13}C\,enrichment\,level\,of\,dietary\,starch), \end{eqnarray}$$
where
 $$\begin{eqnarray} Lipid\,^{13}C\,in\,excess = (g\,biomass\,( t _{ i })\times \%\,whole\hyphen fish\,lipid\,content\,( t _{ i })\times \%\,carbon\,in\,whole-fish\,lipid\,( t _{ i })\times \%APE_{lipid}\,( t _{ i })) \end{eqnarray}$$
and
 $$\begin{eqnarray} ^{13}C\,enrichment\,level\,of\,dietary\,starch = (\%\,APE_{diet}/((\%\,dietary\,starch\,content\times \%\,carbon\,content\,of\,dietary\,starch)/\% carbon\,in\,feed)). \end{eqnarray}$$
Recovery of starch carbon in whole-fish lipid fraction (RSCL, %) was calculated as:
 $$\begin{eqnarray} RSCL = g\,lipid\,C_{(starch\,origin)}/g\,digestible\,starch\,carbon\,intake. \end{eqnarray}$$
Statistical analysis
Data on specific growth rates, feed conversion ratios, FI, hepatosomatic indices, viscerosomatic indices, ADC and the chemical composition of whole fish and livers were subjected to one-way ANOVA analysis, assessing significant differences among means using Duncan's multiple range test(Reference Duncan49). A t test was used for testing differences between means in the ADC of the two carbon isotopes. A probability of P< 0·05 was considered significant in all analyses. Data on LDR and RSCL of whole fish were subjected to two-way ANOVA analysis to test for main effects of, and interactions between, diet and isotopic enrichment period, respectively. Significant differences found in main effect (when not interacting with other main effects) were subsequently assessed using Duncan's multiple range test. Regression analysis of temporal increase in APE in liver lipid and glycogen and in whole-fish glycogen pools was performed using a two-parameter exponential rise to maximum equation:
 $$\begin{eqnarray} y = a \times (1 - \,exp\,( - b \times x )), \end{eqnarray}$$
where y is the 13C APE, x is enrichment time and a and b are constants. Regression analysis of the temporal increase in whole-body lipid APE gave a better fit when employing a linear regression:
 $$\begin{eqnarray} y = b + a \times x , \end{eqnarray}$$
where y is the 13C APE, x is enrichment time and a and b are constants. All statistical analyses were performed using the WinSTAT® for Microsoft® Excel, version 2009.1 software package (R. Fitch Software).
Results
Diets and dietary 13C enrichment
The composition and chemical analysis of the experimental diets are shown in Table 1. The crude protein content of the diets was very similar (458–462 g/kg). The lipid content decreased from 218 g/kg in diet A to 139 g/kg in diet D, and the crude starch content increased from 54 g/kg in diet A to 236 g/kg in diet D. Data from the stable isotope analyses are presented in Table 2. The dietary carbon content ranged from 45·2 to 47·9 %. The δ13C values of the non-enriched diets ranged between − 21·7 and − 21·5 ‰, while δ13C values of the enriched diets were measured as 16·4, 48·2, 87·8 and 113·9 ‰ for diets A, B, C and D, corresponding to 13C APE of 0·04, 0·08, 0·12 and 0·15 %, respectively. The measured 13C enrichment of starch carbon was 0·83, 0·67, 0·70 and 0·64 % for diets A, B, C and D, respectively.
Elemental carbon and stable carbon isotope analysis of the four experimental diets (Mean values and standard deviations, n 3)

APE, atom percent excess.
13C enrichment of whole fish and livers
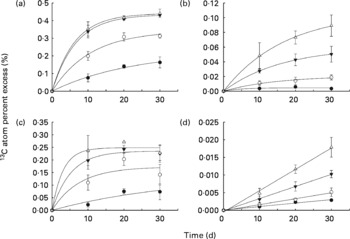
Isotope enrichment of the liver glycogen and liver lipid pools and of the whole-body glycogen and lipid pools are presented in Fig. 1, while the associated regression equations are presented in Table 3. The regression equations fitted the data very well, with coefficients of determination (r 2) ranging between 0·828 and 1·000. The curves in Fig. 1(a)–(c) display saturation kinetics, moving asymptotically towards a value deduced from the equation constant a (hereafter referred to as APElim (t→ ∞)). The theoretical maximum enrichment (TME) value any given APElim (t→ ∞) could possibly approach equalled the 13C enrichment of the starch fraction of the corresponding diet (Table 3), and would only occur if dietary starch was the sole carbon contributor to that metabolite pool. Also, deduced from these equations, the theoretical time, in days, it would take APE to reach 95 % of their respective APElim (t→ ∞) was designated t 95 % (Table 3) and indicated how fast the 13C enrichment of a given metabolite pool reached an equilibrium, which in turn indicated the turnover of that metabolite pool (i.e. low t 95 % values indicated high turnover and high t 95 % indicated low turnover). Liver glycogen 13C APE values rose exponentially towards an APElim (t→ ∞) of 0·226, 0·343, 0·435 and 0·441 % (Fig. 1(a)), corresponding to 27·2, 51·0, 62·3 and 68·8 % of the TME for fish fed diets A, B, C and D, respectively. Furthermore, the regression analysis predicted that fish fed diets A, B, C and D would reach t 95 % in 67, 32, 20 and 19 d, respectively, of feeding on the enriched diets.
13C atom percent excess (%) measured in (a) liver glycogen pool, (b) liver lipid pool, (c) whole-body glycogen pool and (d) whole-body lipid pool, measured after 10, 20 and 30 d of dietary 13C starch enrichment. Associated regression analyses are presented in Table 3. Values are means and standard deviations represented by vertical bars (n 3). ●, Diet A; ○, diet B; ▾, diet C; Δ, diet D.
13C atom percent excess (APE) regression equation coefficients and constants calculated from regression analysis of liver glycogen and lipid pools and whole-body glycogen and lipid pools

NA, not available.
* APElim(t→ ∞) refers to the 13C APE value asymptotically approached by a metabolite pool when enrichment time goes towards infinity.
† t 95 % refers to the theoretical time (in d) it would take APE of a metabolite pool to reach 95 % of APElim (t→ ∞). Calculated as t 95 %= ln(0·05)/ − b, where b is the equation constant as given in the table.
‡ TME refers to the theoretical maximum 13C enrichment value any given APElim (t→ ∞) could possibly approach, equalling the 13C enrichment of the starch fraction of the corresponding diet.
Liver lipid 13C APE values rose exponentially towards APElim (t→ ∞) values of 0·005, 0·021, 0·060 and 0·107 % (Fig. 1(b)), corresponding to 0·6, 3·1, 8·6 and 16·7 % of the TME for fish fed diets A, B, C and D, respectively. Regression analysis on liver lipid APE predicted that fish fed diets A, B, C and D would reach t 95 % in 15, 44, 48 and 51 d, respectively, of feeding on the enriched diets.
Whole-body glycogen pool APE increased exponentially towards 0·137, 0·172, 0·235 and 0·248 % (Fig. 1(c)), corresponding to 16·5, 25·6, 33·7 and 38·8 % of the TME for fish fed diets A, B, C and D, respectively. Regression analysis of whole-body glycogen APE predicted that fish fed diets A, B, C and D would reach t 95 % in 103, 23, 16 and 9 d, respectively, of feeding on the enriched diets.
The whole-body lipid 13C APE values all increased linearly with time fed on the enriched diets (Fig. 1(d)), and the rate of enrichment was directly related to the dietary starch content, ranging from 0·0029 (diet A) to 0·0179 % (diet D) after 30 d of feeding.
Feed intake, growth and feed conversion ratio
Results on FI, feed conversion and growth are presented in Table 4. The fish accepted all diets well, and the accumulated feed waste during the three feeding periods was approximately 2·2 % of the total amount of feed fed to each tank, irrespective of dietary treatment. No mortality occurred throughout the trial. No significant differences in specific growth rates (ranging from 1·19 to 1·29 %/d), feed conversion ratios (ranging from 1·03 to 1·09) and FI (ranging from 1·28 to 1·33 %/d) were found among the dietary treatments.
Specific growth rate, feed conversion ratio, daily feed intake and apparent digestibility coefficients (ADC) of macronutrients and stable carbon isotopes (Mean values and standard deviations, n 3)

SGR, specific growth rates; FCR, feed conversion ratios; FI, feed intake; NA, not available.
a,bMean values within a row with unlike superscript letters were significantly different (P< 0·05; Duncan's multiple range test).
* SGR calculated according to Hopkins(Reference Hopkins64) as: SGR = ln(biomass(end)/biomass(initial))/(days in trial) × 100.
† FCR = feed consumed/biomass gained.
‡ FI = feed consumed/expected biomass.
§ The ADC of nutrient X: ADC(X)= 1 − ((I diet× X faeces)/(I faeces× X diet)), where I diet and I faeces is the yttrium concentration recovered in the diet and faeces, respectively, and X faeces and X diet is the concentration of X (protein, lipid, starch or carbon isotope) recovered in the faeces and diet, respectively(Reference Maynard and Loosli65).
∥ P value is based on a t test comparing the ADC of the two carbon isotopes.
Digestibility of macronutrients and carbon isotopes
The ADC of the diets, as derived from large fish, are shown in Table 4. The protein ADC ranged from 84·8 (diet C) to 91·6 % (diet D), with fish fed diet D having a significantly higher protein digestibility than fish fed the remaining diets. Lipid ADC ranged from 87·0 % in diet A to 90·7 % in diet C, with no significant differences between dietary treatment groups. The apparent digestibility of starch was significantly higher in fish fed diets A and B (99·3 and 99·6 %, respectively) than in fish fed diets C and D (97·3 and 96·5 %, respectively). There was no difference in the apparent digestibility of the two carbon isotopes (68·2 and 69·2 % for 12C and 13C, respectively) determined in the enriched diet A. Based on the study of Windell et al. (Reference Windell, Foltz and Sarokon50), it was assumed that the ADC derived from larger fish applied to the smaller fish from this trial as well.
Chemical composition of whole fish and livers
The chemical composition of whole fish and livers at the end of the experiment is presented in Table 5. In whole fish, no significant effects of dietary treatment were seen in the content of crude protein, crude lipid, DM or ash. In contrast, the whole-body glycogen content differed significantly between all dietary treatments, equalling 1·8, 2·5, 3·4 and 4·3 g/kg for fish fed diets A, B, C and D, respectively. There were no significant differences in the content of crude lipid, DM or ash in the liver. The liver protein content was inversely related to the dietary starch content, ranging from 144·4 g/kg in fish fed diet A to 109·5 g/kg in fish fed diet D. Fish fed diets A and B differed significantly from each other and from fish fed diets C and D. The liver glycogen content increased with an increasing dietary starch content, being significantly lower in fish fed diet A (59·0 g/kg) than in fish fed diets C and D (98·8 and 112·6 g/kg, respectively), while fish fed diet B (77·9 g/kg) had a significantly lower liver glycogen content than fish fed diet D.
Chemical composition of whole fish and livers (Mean values and standard deviations, n 3)

HSI, hepatosomatic index; VSI, viscerosomatic index.
a,b,c,dMean values within a row with unlike superscript letters were significantly different (P< 0·05; Duncan's multiple range test).
* HSI = (weight(liver)/weight(whole body)) × 100.
† VSI = (weight(viscera)/weight(whole body)) × 100.
Hepatosomatic and viscerosomatic indices
The hepatosomatic index ranged from 1·1 to 1·7 %, increasing significantly from diets A and B to diets C and D, respectively. There were no significant differences in the viscerosomatic index between dietary treatments (Table 5).
Recovery of carbon originating from starch in whole-body lipid
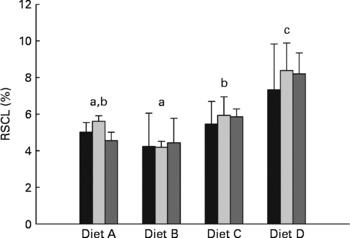
The percentage of carbon from dietary starch recovered in the lipid pool of whole fish (RSCL) is presented in Fig. 2. The two-way ANOVA indicate that RSCL was significantly affected by dietary treatment (P< 0·0001), but not by the duration of the dietary enrichment period (P= 0·598). A multiple comparison analysis subsequently showed that RSCL was significantly lower in fish fed diet B (4·3 %) than in fish fed diets C (5·7 %) and D (8·0 %). Furthermore, RSCL was significantly lower in fish fed diet A (5·1 %) than in fish fed diet D, while fish fed diet C had significantly lower RSCL than fish fed diet D.
Percentage of digested starch carbon recovered in lipid carbon fraction of whole fish (RSCL, %) after being fed the enriched diets for 10 (■), 20 (![]() ) and 30 d (
) and 30 d (![]() ). Values are means and standard deviations represented by vertical bars (n 3). Two-way ANOVA showed significant differences between dietary treatments (P< 0·0001), while there were no significant differences between enrichment periods (P= 0·598) and there were no interaction between dietary treatment and enrichment period (P= 0·947). a,b,cMean values with unlike letters differed significantly among dietary treatments (P< 0·05; Duncan's multiple range test).
). Values are means and standard deviations represented by vertical bars (n 3). Two-way ANOVA showed significant differences between dietary treatments (P< 0·0001), while there were no significant differences between enrichment periods (P= 0·598) and there were no interaction between dietary treatment and enrichment period (P= 0·947). a,b,cMean values with unlike letters differed significantly among dietary treatments (P< 0·05; Duncan's multiple range test).
Deposition rate of lipid synthesised from starch
The deposition rate of lipid synthesised from starch (LDR) is presented in Fig. 3. The LDR ranged from 18·7 to 123·7 mg/kg biomass per d in fish fed diets A and D, respectively. The two-way ANOVA analysis showed that LDR was significantly affected by dietary treatment (P< 0·0001), but not by the duration of the dietary enrichment period (P= 0·557). The subsequent multiple comparison analysis between dietary treatments showed an increase in LDR with increasing dietary starch, with all dietary treatment groups being significantly different.
Deposition rate of lipid derived from starch (LDR, mg/kg per d) in fish fed diets containing 6 (diet A), 12 (diet B), 18 (diet C) and 24 % (diet D) starch over three 10 d feeding periods. Values are means and standard deviations represented by vertical bars (n 3). Two-way ANOVA showed significant differences between dietary treatments (P< 0·0001), while there were no significant differences between enrichment periods (P= 0·557) and no interaction between dietary treatment and enrichment period (P= 0·950). a,b,c,dMean values with unlike letters above bars were significantly different among dietary treatments (P< 0·05; Duncan's multiple range test). ■, Day 10; ![]() , day 20;
, day 20; ![]() , day 30.
, day 30.

Discussion
The purpose of the present study was to quantify the magnitude of de novo lipogenesis and glycogenesis from dietary starch, when increasing the proportion of DE supplied by starch in diets that were otherwise similar in DP and DE. A secondary objective was to determine the overall importance of dietary starch in glycogen and lipid metabolism.
Simple, high-quality raw material matrices were applied to assure highest possible nutrient quality and avoid possible undesired effects on FI, growth performance and nutrient utilisation of anti-nutrients associated with certain vegetable raw materials(Reference Gatlin, Barrows and Brown3). Furthermore, the DP:DE ratio of the diets was close to what is considered optimal for feed efficiency and nutrient retention(Reference Santinha, Medale and Corraze51), and the essential amino acid composition complied with general recommendations for this species(Reference Kaushik52, Reference Peres and Oliva-Teles53).
The study clearly demonstrated both de novo lipogenesis and glycogenesis from dietary starch (regardless of inclusion level), as evident from the continuous increase in 13C APE of glycogen and lipid pools of both liver and whole fish tissues (Fig. 1(a)–(d)).
Of the four metabolite pools analysed, the liver glycogen pool displayed the highest enrichment response, with APElim (t→ ∞) values increasing from 27·2 (diet A) to 68·8 % (diet D) of their respective TME and t 95 % values decreasing from 76 to 19 d with increasing starch levels. The magnitude of the 13C APE response, as well as the relatively low t 95 % values observed in this metabolite pool, confirms a rapid and efficient cascade of metabolic events leading to glycogenesis. Furthermore, the decrease in t 95 % associated with an increasing dietary starch inclusion level indicates that turnover in this metabolite pool was stimulated by dietary starch. These results support the general perception that both starch digestion(Reference Couto, Enes and Peres16–Reference Venou, Alexis and Fountoulaki18) and the following liver glucose phosphorylation(Reference Enes, Panserat and Kaushik17, Reference Enes, Panserat and Kaushik19, Reference Enes, Panserat and Kaushik20, Reference Caseras, Meton and Vives27, Reference Panserat, Medale and Blin29) (glucose → glucose-6-phosphate) are very efficient in gilthead sea bream, even at high dietary starch inclusion levels. The observation that the regression curves for diets C and D (Fig. 1(a)) almost coincided may indicate a near maximum liver glycogen synthesis from dietary starch when including 18–24 % starch in the diet.
The enrichment of the whole-body glycogen pool showed APElim (t→ ∞) values increasing from 16·5 to 38·8 % of their respective TME, while t 95 % values decreased from 103 to 9 d when feeding diets A to D, respectively. Hence, a very rapid whole-body glycogen turnover (t 95 %= 9 d) is apparent at high dietary starch levels (diet D). Interestingly, almost two-thirds of the whole-body glycogen and approximately one-third of the liver glycogen must have originated from sources other than dietary starch, even when feeding the high-starch diet (diet D). Similar results were obtained by Viegas et al. (Reference Viegas, Mendes and Leston36) for European seabass, finding that as much as 98 % of the blood glucose production could be attributed to gluconeogenesis in both fasted and fed fish. The liver glycogen content was much higher than the whole-body glycogen content (Table 5). Combined with the 13C APE enrichment kinetics in the two pools (Fig. 1(a) and (c)), it therefore appears that hepatically synthesised glycogen contributed significantly to the whole-body glycogen pool, which in addition must have received significant amounts of glycogen from other metabolic processes. Such results might be explained by an apparent lack of gluconeogenesis regulation by dietary carbohydrates in gilthead sea bream, expressed as fructose-1,6-biphosphatase and glucose-6-phosphatase activities, as described earlier(Reference Enes, Panserat and Kaushik17, Reference Enes, Panserat and Kaushik19, Reference Enes, Panserat and Kaushik20, Reference Meton, Mediavilla and Caseras24, Reference Caseras, Meton and Vives27). Combined with glycogenesis from dietary carbohydrates, this appears to produce glycogen at rates that exceed the glycolytic capacity of the fish, causing increases in both hepatosomatic indices and liver glycogen content, as observed in the present and in previous studies when feeding high-carbohydrate diets(Reference Hemre, Mommsen and Krogdahl14, Reference Enes, Panserat and Kaushik54, Reference Enes, Panserat and Kaushik55).
In contrast to the liver and whole-body glycogen pools, the t 95 % of the liver lipid pool appeared to be directly related to dietary starch inclusion level, indicating a reduction of turnover with increasing dietary starch level. However, considering the very weak 13C APE response and relatively low r 2 of the regression for fish fed diet A, the associated t 95 % value (i.e. 15 d) should probably be disregarded, leaving the t 95 % range between 44 and 51 d for fish fed diets B and D, respectively.
Similar to the whole-body glycogen pool, hepatically synthesised lipid from starch seemed to be directed towards the whole-body lipid pool. This was apparent from the approximately five-fold higher 13C APE found in the liver lipid pool compared with the whole-body lipid pool, and the linear enrichment kinetics seen in whole-body lipid, which indicate a passive storage function in the latter. After 30 d of dietary 13C starch enrichment, a maximum of 2·8 % of the whole-body lipid carbon pool was of starch origin (calculated from the regression coefficients given in Table 3), corresponding to approximately 8·7 % of the total whole-body lipid deposited during the 30 d. Thus, a relatively small proportion of the whole-body lipid deposition could be attributed to lipogenesis from dietary starch, even at high dietary carbohydrate levels. This is also apparent when considering the low efficiency (4·2–8·4 %) with which starch carbon was recovered in the whole-body lipid fraction of the fish (RSCL; Fig. 2). Hence, more than 90 % of the digested starch must have been used for purposes other than lipogenesis, regardless of dietary treatment. Interestingly, the RSCL seemed to increase when increasing the dietary starch content (Fig. 2), meaning that the actual amount of starch carbon recovered in the lipid fraction of fish fed diet D compared with the fish fed diet A was approximately eight-fold higher. This is also apparent from Fig. 3, which shows that the deposition rate of lipid (LDR) originating from starch increased from 18·7 to 123·7 mg/kg biomass per d when dietary starch increased from 6 to 24 %. This confirms that de novo lipogenesis from dietary carbohydrates was subject to regulation based on the dietary carbohydrate level, consistent with earlier studies which found a strong correlation between dietary carbohydrate level and enzyme activity related to lipogenesis(Reference Meton, Mediavilla and Caseras24, Reference Fernandez, Miquel and Cordoba28, Reference Enes, Panserat and Kaushik54, Reference Enes, Panserat and Kaushik56, Reference Enes, Peres and Couto57) (i.e. the activity of glucose-6-phosphate dehydrogenase). Despite the fact that de novo lipogenesis from dietary carbohydrates was indeed active and apparently subject to nutritional control, the contribution to the overall lipid deposition appeared to have been modest in the present study. Hence, Fig. 4 presents lipid budgets of the four dietary treatment groups. The figure shows that the maximum contribution to lipid deposition from dietary starch was 12·3 g of lipid out of a total deposition of approximately 150 g when gaining 1 kg of biomass (fish fed diet D). The figure also shows that when feeding the highest starch levels (diet D), the total lipid deposition exceeded the sum of digested lipid and deposition from de novo synthesised lipid from starch. Thus, fish fed diet D would not even theoretically have been able to cover their total lipid deposition from dietary lipid and starch sources combined. Consequently, this lipid ‘deficit’ must have originated from de novo lipid synthesis, presumably using protein as a carbon donor. This agrees with the stimulating effect of excess dietary protein on glucose-6-phosphate dehydrogenase activity found by Enes et al. (Reference Enes, Panserat and Kaushik17) and the inherently poor protein retention reported for this species compared with species like salmonids.
Lipid budget when accreting 1 kg of biomass (lipid deposited or digested, g) in fish fed diets containing 6 (diet A), 12 (diet B), 18 (diet C) and 24 % (diet D) starch. Values are means and standard deviations represented by vertical bars (n 3). ■, Total lipid deposition; ![]() , lipid digested;
, lipid digested; ![]() , lipid of starch origin deposited.
, lipid of starch origin deposited.

The overall growth and feed performance results, as well as the daily FI, were not significantly affected by dietary treatment, despite the fact that dietary DE increased by 1 MJ/kg (approximately 5·6 %) from diet A (17·9 MJ/kg) to diet D (18·9 MJ/kg). As increasing levels of dietary starch has been shown to negatively affect feed efficiency(Reference Couto, Enes and Peres21), this may have masked any effects that the slightly increased DE levels may have had on performance results in the present study. In addition, the growth period (30 d of feeding, corresponding to approximately 45 % biomass increase) may have been too short to demonstrate significant differences in these parameters.
Fish fed diet D showed significantly better protein ADC than fish fed the remaining diets, which might have been an effect of the lower dietary cellulose content of this diet, although negative effects of dietary cellulose on protein digestibility have not been reported for other species fed diets with cellulose inclusion levels up to 20 %(Reference Dias, Huelvan and Dinis58–Reference Lekva, Hansen and Rosenlund60). The very high starch ADC observed in the present study (96·5–99·6 %) and the inverse relationship between starch ADC and dietary starch level has been reported previously in both gilthead sea bream and European seabass(Reference Couto, Enes and Peres16–Reference Venou, Alexis and Fountoulaki18, Reference Enes, Panserat and Kaushik54). Ideally, analyses on dietary and faecal nutrient compositions used for ADC assessments should be carried out using identical protocols for both types of samples. However, the scarce amount of faecal matter available for analyses precluded use of the Kjeldahl method(39) for protein analysis and the Bach Knudsen method(Reference Bach Knudsen46) for starch analysis on faecal samples. Thus, faecal starch content was determined using a BioVision starch assay kit and faecal protein was determined using elemental analysis.
Prior to the present study, the fish had formed part of a feeding trial, where they had been fed four diets similar to the experimental diets used here, except for the addition of 13C starch. Thus, fish had grown from an average weight of approximately 25 to 75 g (unlabelled diets; pre-study) and further from 75 to 100 g (labelled diets; present study), corresponding to a quadruplication of body weight on these diets. Despite this, whole-body protein, lipid, ash and DM did not differ significantly among fish fed the four experimental diets. Thus, the increasing dietary starch inclusion level did not affect the body composition, which is more or less in accordance with earlier findings(Reference Couto, Enes and Peres21). Yet, some studies have found a positive relationship between dietary digestible carbohydrate and body lipid levels(Reference Enes, Panserat and Kaushik17, Reference Meton, Mediavilla and Caseras24, Reference Fernandez, Miquel and Cordoba28), while others have found body lipid levels to be unaffected by both macronutrient ratios in iso-DE diets(Reference Couto, Enes and Peres21) and dietary energy level(Reference Bonaldo, Isani and Fontanillas61). Only whole-body glycogen content was significantly elevated (from 1·8 to 4·3 g/kg) when increasing the dietary starch level. Liver lipid, ash and DM were not significantly affected by dietary treatment, while liver protein decreased (from 144·4 to 109·5 g/kg) and liver glycogen increased (from 59·0 to 112·6 g/kg) in what resembled a 1:1 substitution of protein with glycogen when increasing dietary starch level. Also, hepatosomatic indices were significantly affected by the dietary treatment, increasing from 1·1 to 1·7 % in fish fed diets A and D, respectively. Similar results have been reported in both gilthead sea bream and other species when increasing digestible dietary carbohydrate intake(Reference Hemre, Mommsen and Krogdahl14, Reference Enes, Panserat and Kaushik54, Reference Enes, Panserat and Kaushik55).
Conclusion
For the first time, long-term oral administration of 13C-labelled starch has been applied to determine the role of dietary starch on glycogenesis and de novo lipogenesis in gilthead sea bream. The study corroborated the earlier reported high ADC of processed/extruded starches(Reference Couto, Enes and Peres16–Reference Venou, Alexis and Fountoulaki18) followed by efficient glycogenesis. Also, endogenously produced glycogen from other metabolic processes (e.g. amino acid catabolism) seemed to contribute significantly to the total glycogen production of the fish, regardless of dietary treatment. This could potentially be attributed to lack of dietary regulation of fructose-1,6-biphosphatase(Reference Enes, Panserat and Kaushik17, Reference Enes, Panserat and Kaushik19, Reference Enes, Panserat and Kaushik20, Reference Meton, Mediavilla and Caseras24, Reference Caseras, Meton and Vives27), continuously diverting non-carbohydrate metabolites of the glycolytic pathway in the direction of glycogenesis. The combined endogenic and dietary contribution to glycogenesis appeared to have caused an accumulation of glycogen in both whole fish and liver tissues, causing hepatomegaly in fish fed high-starch diets. Also, de novo lipogenesis from dietary starch was proven to be active and under apparent nutritional control. However, a maximum of 8·4 % of the digested starch carbon could be recovered in the lipid fraction of the fish, indicating that dietary starch seemed to play only a minor role in the overall lipid budget of gilthead sea bream. Considering the significant contribution of non-carbohydrate metabolites (most likely originating from protein catabolism) to glycogenesis, and the apparent ‘deficit’ in the lipid budget presented, the results strongly hint that dietary protein may play a major role not only for anabolic purposes, but also for short-term (glycogen) and long-term (lipid) energy storage purposes in gilthead sea bream, which in turn could explain the relatively poor protein retention typically found in the this species.
Acknowledgements
The authors would like to thank the technical and laboratory staff at DTU Aqua, Hirtshals, Denmark; BioMar A/S's trial station, Hirtshals, Denmark; and Risø DTU, Roskilde, Denmark for invaluable help during experimentation and analytical work. The work was part of K. S. E.'s PhD study, sponsored by the DTU Aqua and the BioMar A/S, Denmark. Authors responsibilities were as follows: all authors helped to plan the research; K. S. E. was responsible for the biological trials, performed laboratory work and analysed the data; all authors helped to interpret results; K. S. E. wrote the manuscript; all authors helped to proofread the manuscript. There are no conflicts of interest to report.


