


Introduction
Environmental stresses, such as high and low temperatures, drought, salinity, alkalinity, and high CO2 concentrations, are able to influence the growth of plants (Ahuja et al. Reference Ahuja, de Vos, Bones and Hall2010).
Salinity represents one of the main environmental stresses that can affect plant growth and cause crop yield reductions (Negrão et al. Reference Negrão, Schmöckel and Tester2017; Parihar et al. Reference Parihar, Singh, Singh, Singh and Prasad2015). All the primary metabolic processes (photosynthesis, protein synthesis, and lipid metabolism) of a plant are involved in the set of responses to salt stress. Currently, the effects of salinity on plant growth are gaining importance because salinization areas are increasing throughout the world, mainly as a consequence of the overexploitation of water resources and climate change (Akbari et al. Reference Akbari, Alamdarlo and Mosavi2020; Kibria et al. Reference Kibria, Hossain, Murata and Hoque2017; Singh Reference Singh2018). It has been estimated that about 20% of irrigated lands have suffered from an increase in this phenomenon over the last few decades (Machado and Serralheiro Reference Machado and Serralheiro2017). The presence of salt in these areas can be an obstacle to the growth of various crops, such as rice (Oryza sativa L.), because of its toxicity and because of osmotic stress that can alter the water uptake potential/dynamics of plants (Kibria et al. Reference Kibria, Hossain, Murata and Hoque2017).
Rice is known to be sensitive to salt stress and, even though the plant is able to germinate in moderately saline conditions, it is more susceptible during the seedling emergence and early growth stages (Bertazzini et al. Reference Bertazzini, Sacchi and Forlani2018). Previous studies found that seedling growth was reduced at a salinity level of 1.9 dS m−1 for some rice varieties and that values of 3 dS m−1 can reduce rice survival (Bertazzini et al. Reference Bertazzini, Sacchi and Forlani2018; Zeng and Shannon Reference Zeng and Shannon2000). Rice is usually better at tolerating saline conditions in the subsequent vegetative stages, but it still becomes sensitive during the reproductive stage, when high-saline conditions can hinder grain formation (Bertazzini et al. Reference Bertazzini, Sacchi and Forlani2018; Hoang et al. Reference Hoang, Tran, Nguyen, Williams, Wurm, Bellairs and Mundree2016). Moderate salinity levels in water and soil are thus able to cause serious reduction in yield, while very high salinity (>11.5 dS m−1) leads to total failure of a crop (Zeng and Shannon Reference Zeng and Shannon2000).
The effects of salinity on cultivated plants can be intensified by the presence of other limiting factors, such as competition due to the presence of weeds, which are in general less susceptible to environmental stresses than crops, as they are more adaptable to changes (Fogliatto et al. Reference Fogliatto, Vidotto and Ferrero2020; Korres et al. Reference Korres, Norsworthy, Tehranchian, Gitsopoulos, Loka, Oosterhuis, Gealy, Moss, Burgos, Miller and Palhano2016). The higher tolerance of weeds to environmental changes is mainly related to the fact that wild species have not undergone the same level of selection to obtain advantageous traits (Korres et al. Reference Korres, Norsworthy, Tehranchian, Gitsopoulos, Loka, Oosterhuis, Gealy, Moss, Burgos, Miller and Palhano2016). A previous review (Cirillo et al. Reference Cirillo, Masin, Maggio and Zanin2018) highlighted that the majority of the weeds considered in the study showed a higher tolerance to salt, in terms of germination and plant growth, than most of the crops; in fact, it has been found that, for the majority of weeds throughout the world, the level of salinity that can cause a growth reduction of 50% (EC50) is higher than that of crops, with an average EC50 of 16.4 and 10.6 dS m−1 for weeds and crops, respectively (Cirillo et al. Reference Cirillo, Masin, Maggio and Zanin2018; Tanji and Kielen Reference Tanji and Kielen2002).
Barnyardgrass [Echinochloa crus-galli (L.) P. Beauv.] and weedy rice (Oryza sativa L.) are among the principal weeds in rice fields throughout the world (Andres et al. Reference Andres, Fogliatto, Ferrero and Vidotto2015; Vidotto et al. Reference Vidotto, Dalla Valle, Fogliatto, Milan, De Palo, Tabacchi and Ferrero2020). According to some studies, E. crus-galli is considered to be able to cope with high-saline conditions, probably because this species is able to take up potassium more selectively than sodium (Wilson and Read Reference Wilson and Read2006). The salt tolerance of E. crus-galli is generally higher than that of many other crops, such as rice, and other weeds, like O. sativa (Fogliatto et al. Reference Fogliatto, Serra, Patrucco, Milan and Vidotto2019; Hakim et al. Reference Hakim, Juraimi, Hanafi, Selamat, Ismail and Karim2011; Serra et al. Reference Serra, Fogliatto and Vidotto2018). Echinochloa is also one of the genera most prone to developing herbicide resistance; it has been demonstrated that different populations of E. crus-galli have become resistant to eight site-of-action herbicides used in rice throughout the world and, in particular, to acetolactate synthase (ALS) and acetyl-CoA carboxylase (ACCase) inhibitors (Heap Reference Heap2020). Oryza sativa populations have also developed resistance to ALS inhibitors, even though this has occurred more recently, after the introduction of Clearfield® rice varieties tolerant to imidazolinone herbicides (Goulart et al. Reference Goulart, Borba, Menezes and Merotto2014; Sudianto et al. Reference Sudianto, Beng-Kah, Ting-Xiang, Saldain, Scott and Burgos2013). Oryza sativa resistance to imidazolinone herbicides is caused by one or different point mutations in the ALS gene that result in amino acid substitution; the introduction of Clearfield® varieties harboring these mutations has increased the risk of resistant gene flow from these varieties to O. sativa; gene flow has been found to be the predominant source of resistance in O. sativa, while independent mutation is a minor source (Fogliatto et al. Reference Fogliatto, Vidotto and Ferrero2020; Goulart et al. Reference Goulart, Borba, Menezes and Merotto2014).
Many studies have been conducted to determine the level of rice’s tolerance to salt, although only a few studies have been carried out to establish the effect of salinity on weed growth (Chauhan et al. Reference Chauhan, Abugho, Amas and Gregorio2013; Fogliatto et al. Reference Fogliatto, Serra, Patrucco, Milan and Vidotto2019; Hakim et al. Reference Hakim, Juraimi, Hanafi, Selamat, Ismail and Karim2011; Serra et al. Reference Serra, Fogliatto and Vidotto2018). Moreover, the growth behavior of herbicide-resistant and herbicide-sensitive weeds under saline conditions has been investigated even less (Fogliatto et al. Reference Fogliatto, Serra, Patrucco, Milan and Vidotto2019; Serra et al. Reference Serra, Fogliatto and Vidotto2018). Herbicide resistance can induce in some resistant populations a fitness cost, as some resources in the resistant plants are diverted to protect the plants from the effects of the herbicides instead of being used for growth, reproduction, and countering abiotic stresses (Goulart et al. Reference Goulart, Matzenbacher and Merotto2012; Vila-Aiub et al. Reference Vila-Aiub, Gundel and Preston2015). Resistant individuals can exhibit different behavior than susceptible individuals in different environments as a consequence of the fitness penalty (reduced germination, growth, seed production, etc.), and it has been established that fitness costs are usually more evident under adverse environmental conditions (i.e., salinity) (Wu et al. Reference Wu, Zhang, Pan, Wang, Xu and Dong2016).
The present study has been conducted with the aim of evaluating the effect of salinity on the emergence and plant growth of some Italian populations of O. sativa and E. crus-galli.
Limited information is available on weed emergence under saline conditions, as many studies only considered the effect of salt on germination in tests that were often conducted in petri dishes, while in studies focused on weed growth, salt was usually added a few days after emergence in order to have a higher number of emerged plants. As one of the aims of this study was to evaluate the effects of salt on emergence, weeds and rice species were left to germinate and emerge from sand in saline solutions.
This study was also aimed at establishing whether two populations of E. crus-galli known to be resistant to ALS-inhibiting herbicides would respond differently to saline conditions compared with three herbicide-sensitive populations. The study also compared the growth behavior in response to salinity of the conventional rice variety ‘Baldo’ and the imazamox-tolerant rice variety ‘CL80’.
Materials and Methods
Weed Populations, Rice Varieties, and Salt Concentrations
The study was conducted on five E. crus-galli populations, three O. sativa populations, and two rice varieties. Seeds from E. crus-galli populations were collected in August 2016 from Italian rice fields located in different zones of the main area of rice cultivation in Italy (between Piedmont and Lombardy) that have similar climatic conditions; the fields had a history of repeated applications of the ALS-inhibiting herbicide penoxsulam. Three E. crus-galli populations (named s1, s2, and s3) were found to be sensitive to penoxsulam in previous greenhouse and laboratory tests (unpublished data), while two (named r1 and r2) were found to be resistant as a result of a target-site mutation (Trp-574-Leu). The same populations showed the following germination levels without salt in petri dishes: 90%, 95%, 88%, and 85%, respectively for populations s1, s2, s3, and r.
Three O. sativa populations (wr1, wr2, and wr3) were also collected in 2016 from different Italian paddy fields, also located in the main Italian rice area, and proved sensitive to the main ALS-inhibiting herbicide imazamox used in rice cultivation (data not shown). The same O. sativa populations, in a study carried out in petri dishes, showed the following germination levels without salt: 93%, 92%, and 95%, respectively for wr1, wr2, and wr3.
The present study was also conducted on the Baldo rice variety, one of the most frequently cultivated varieties in the Mediterranean Basin, which is characterized by high commercial importance, and on the imidazolinone (imazamox)-tolerant rice variety CL80 as a representative of the Clearfield® varieties cultivated in Italy. Germination level without salt assessed in petri dishes was 97% in Baldo and 89% in CL80.
The following salt (NaCl) concentrations were considered: 0 (control), 50, 100, 150, 200, and 250 mM, corresponding to an Electrical Conductivity (EC) of about 0.5, 5.9, 10.6, 15.9, 21.3, and 26.6 dS m−1, a range that comprises some of the possible concentrations that can be found in European rice-cultivation areas (Badia Reference Badia2000; Gay et al. Reference Gay, Maraval, Roques, Gunata, Boulanger, Audebert and Mestres2010; Isla et al. Reference Isla, Aragüés and Royo2003).
Whole-Plant Bioassay
The trials were carried out during the spring of 2017 (March to June) in a greenhouse at the Department of Agricultural, Forest and Food Sciences of the University of Turin (Italy).
The weed populations and the rice varieties were sown in alveolar trays with 20 holes (2.7 by 2.7 by 5.8 cm each) arranged in five columns by four rows. The trays were kept in the greenhouse at an average daily temperature of 25 C and a photoperiod of 12 h. The trays were filled with fine river sand, and three seeds were sown per hole.
One tray hosted the E. crus-galli populations for each salt concentration and another tray hosted the O. sativa populations and the rice varieties. Each column of the alveolar tray hosted either one weed population or a rice variety. The column occupied by a weed population or a rice variety was attributed randomly to each tray. Each alveolar tray was considered as a replicate, and three replications were conducted for each salt concentration. Plants were kept in the same trays for the duration of the test.
After seeding, the trays were placed into rectangular plastic containers, each filled with 2 L of solution characterized by different saline concentrations. The solutions were prepared using tap water and different proportions of NaCl to obtain the desired salt concentrations. The following NaCl quantities per liter of water were added: 2.9, 5.8, 8.8, 11.7, and 14.6 g to obtain 50, 100, 150, 200, and 250 mM NaCl concentrations, respectively. The nutrient solution, Hoagland’s No. 2 Basal Salt Mixture (powder for tissue culture, product no. H2395, Sigma-Aldrich, 3050 Spruce Street, St Louis, MO 63103, USA), was added to the 2 L of solution in each tray at a dose of 3.2 g. An aliquot of 250 ml of tap water was added to the solution in the trays three times a week, starting from 7 d after the beginning of the test, to compensate for losses in the solution due to evaporation and/or adsorption and to restore the correct EC values. The pH was measured every day for the duration of the study. At the beginning of the test, the pH was equal to 6.6, while the value increased and stabilized at 7.75 during the trial. The entire study was repeated twice, with the second study conducted about 20 d after the first one ended. The average daily temperature of the greenhouse for both studies was about 25 C with a 12-h daylength.
Seedling Development
Plant Emergence
The number of E. crus-galli, O. sativa, and rice plants that emerged was recorded for each salt concentration at 15 d after sowing. No other seedlings emerged from the substrate after this date. The number of plants that had emerged on the 15th day was then expressed as percentage of emergence.
Plant Height, Shoot, and Root Weight
Plant height was measured from the ground to the apex of the longest leaf at about 40 d after sowing, when plants had reached the 5-leaf stage. The measurements for each population/cultivar, treatment, and replicate were carried out on four plants randomly selected from each column in the alveolar tray. The shoot and root fresh weight of all the plants from each weed population and rice variety were then measured at the same growth stage (5 leaves) by removing the plants from the trays and cutting the shoots from the roots. Sand residues were carefully removed before the roots were weighed.
Chlorophyll and Carotenoid Extraction
On the same day as the plant growth assessment, chlorophyll a, chlorophyll b, and carotenoid were extracted from each weed population and rice variety for each salt concentration. The extraction was conducted on 0.2-g samples of leaves collected from all the replicates of each population/variety, to which 10 ml of 80% acetone had been added, and the samples thus obtained were finely ground for a minute using a homogenizer. The samples were then stored for 24 h in darkness at 4 C (Guo et al. Reference Guo, Yang, Zhu and Gan2017). Spectrophotometric measurements of chlorophyll a, chlorophyll b, and carotenoid content were performed on supernatant samples obtained after centrifugation for 10 min at 2,000 × g. Wavelengths of 662, 645, and 470 nm were used for chlorophyll a, chlorophyll b, and carotenoids, respectively. The amount of these three photosynthetic pigments was expressed as milligrams per gram of seedling fresh weight and determined using the Lichtentaler and Wellburn formulas (Zhan et al. Reference Zhan, Fontana, Tibaldi and Nicola2009).
Statistical Analyses
The analyses of the E. crus-galli populations were conducted separately, while O. sativa and rice were instead analyzed together, as they belong to the same species.
Plant Emergence
The emergence data were first analyzed to check whether they could be represented by a single model (the three-parameter log-logistic regression model in Equation 1) after pooling the data of the repeated experiments. The data were first fit as a pooled data set and then as two separate data sets. ANOVA was conducted to verify the presence of significant differences between the two analyses (P ≤ 0.05). Given that no differences were found, the emergence data of the two subsets were analyzed as a single data set.
The percentage of emerged plants at 15 d after sowing was fit against the salt concentration, according to a three-parameter log-logistic regression model (Equation 1):
 $$Y = {d \over {1 + \exp \left\{ {b\left[ {\log \left( x \right) - \log \left( e \right)} \right]} \right\}}}{\rm{\;}}$ $
where Y is the plant emergence, x is the NaCl concentration expressed in mM, d is the upper limit, and b is the relative slope at the point of inflection, e. Model fitting was performed using the drm function of the drc add-on package of the open-source program R (R Core Team 2019; Ritz et al. Reference Ritz, Baty, Streibig and Gerhard2015).
The salt concentrations required to reduce emergence by 50% (EC50) compared with the values observed at 0 mM NaCl were calculated from the fitted model using the ED function of the drc package.
These EC50 values were used to carry out pairwise comparisons between the populations and varieties through calculation of the sensitivity index (SI) (Ritz et al. Reference Ritz, Cedergreen, Jensen and Streibig2006) (Equation2):
 $${\rm{SI}} = {{{\rm{E}}{{\rm{C}}_{50}}\left( A \right)} \over {{\rm{E}}{{\rm{C}}_{50}}\left( B \right)}}$ $
where A and B indicate the comparison of two different populations/varieties. The significance of SI (P ≤ 0.05) of each comparison was obtained using the EDcomp function of the drc package. The function EDcomp compared the relative potencies for arbitrary doses (in this case the EC50) between fitted dose–response curves (Ritz and Streibig Reference Ritz and Streibig2016). Moreover, to check similarity between curves, a pairwise comparison (P ≤ 0.05) between curve parameters was carried out using the function CompParm of the drc package. This function tests the null hypothesis that the ratio between parameters is 1, meaning that the two parameters are not significantly different.
Seedling Development and Chlorophyll and Carotenoid Contents
An ANOVA series was conducted separately for each growth parameter to determine the significance of the effect of population, salt concentration, and their interaction on each considered growth parameter and on chlorophyll and carotenoid contents. The interaction was significant for the majority of the considered parameters for both Echinochloa spp. and O. sativa, the only exception was plant height for both species and shoot weight for O. sativa (P ≤ 0.05). Because of the significance interactions, a further ANOVA series was conducted separately for each weed population and rice variety to evaluate any differences in growth and in the chlorophyll, chlorophyll a/b ratio, and carotenoid contents for the different NaCl concentrations. No differences were found between the two experiments, and the data were pooled (P ≤ 0.05).
Each measured parameter of each population/variety was also expressed as a percentage difference relative to the control (0 mM concentration). A further ANOVA series was then carried out on the percentage differences of each measured parameter for each NaCl concentration to assess the differences among populations/varieties (P ≤ 0.05). The Levene test was performed to check the homogeneity of variances, and the percentage data were arcsin transformed whenever the ANOVA assumptions were violated. ANOVA was performed using the R statistical program; the means were then separated through the Tukey honest significant difference (HSD) post hoc test included in the agricolae package of R.
Results and Discussion
Echinochloa crus-galli
Seedling Development
Plant Emergence
The regression analysis carried out on plant emergence for different salt concentrations established that emergence decreased in all E. crus-galli populations for increasing salt levels, albeit at different magnitudes (Figure 1). The percentages of emerged seedlings were already different at 0 mM, with population s2 showing the highest emergence rate, that is, about 86%, and population r2 the lowest, with an average emergence value of about 27%. The emergence rates of populations s1, s3, and r1 in the control (0 mM) were 50%, 55.5%, and 55.6%, respectively. The different initial rate of emergence between populations was also visible when parameter d (upper asymptote) was compared across the curves (Table 1). In fact, parameter d for population s2, which had the highest emergence rate, was significantly different compared with all the other populations; moreover, populations r1 and r2 also differed in their initial emergences. The CompParm function also highlighted that parameter b, which is the curve slope, was different between all the resistant populations and populations s2 and s3. Parameter e, the point of inflection of the curve, was instead similar for all curves (Table 1). The most similar curves were those of populations s1 and s3 and those of populations s1 and r1, as they showed nonsignificantly different curve parameters and SI values, which is also a comparison between emergence in a specific point of the curve (Table 1).
Dose–response emergence curve with the average data points of the different Echinochloa crus-galli populations against the salt concentration. Curve parameter estimates (Equation 1): s1 (b = 1.94, d = 55.85, e = 287.76), s2 (b = 1.52, d = 89.91, e = 222.71), s3 (b = 1.13, d = 89.91, e = 282.58), r1(b = 3.96, d = 67.67, e = 196.55), r2 (b = 6.85, d = 94.64, e = 123.58). The salt concentration required to reduce emergence by 50% (EC50) is shown below the graph. Only the significant pairwise comparisons between EC50 (SI index) are shown (Equation 2).

Curve parameter (Equation 1) and sensitivity index (SI) (Equation 2) comparison between Echinochloa spp. populations (estimate and P-values).

* Significant comparisons at P ≤ 0.05.
All populations showed an increase in emergence, compared with the control, for 50 mM, probably due to a hormetic effect of the salt; this increase was moderate in some populations, such as in s2, which only showed a 3% increase (88.8% emergence vs. 86.1% at 0 mM), while it was more pronounced in others, such as in population r2, which displayed a 70% increase in emergence (47.2% emergence vs. 27.7% at 0 mM). However, at 100 mM, only population r1 showed an increase in emergence, that is, of about 20% compared with the control (66.7% emergence vs. 55.5% at 0 mM), while all others showed a reduction in emergence. The decrease in emergence was even more notable for higher salt rates; in fact, about 30% emergence reduction or higher was observed in populations s1 and s3 compared with the control, while population r2 showed the greatest reduction (80%).
The NaCl concentration required to reduce emergence by 50% ranged from 123.58 mM NaCl (population r2) to 287.76 mM (population s1). It was observed, from a pairwise comparison of the SIs, that population r2 was affected significantly more than the sensitive populations (s1, s2, and s3) (Table 1).
Echinochloa crus-galli is one of the most common and problematic weeds for rice production throughout the world, and previous studies demonstrated that the species is quite tolerant to salinity (Chauhan et al. Reference Chauhan, Abugho, Amas and Gregorio2013; Cirillo et al. Reference Cirillo, Masin, Maggio and Zanin2018; Hakim et al. Reference Hakim, Juraimi, Hanafi, Selamat, Ismail and Karim2011; Serra et al. Reference Serra, Fogliatto and Vidotto2018). Although most plants can cope with salinity during germination, they are generally more sensitive at the emergence and early growth stages (Läuchli and Grattan Reference Läuchli, Grattan, Jenks, Hasegawa and Mohan Jain2007). A previous study conducted on Italian ALS inhibitor–resistant and ALS inhibitor–sensitive E. crus-galli populations found that germination occurred up to 400 mM NaCl, although with lower values, that is, about 13% (Serra et al. Reference Serra, Fogliatto and Vidotto2018). Moreover, in the same study, values of up to 90% were recorded for the germination of sensitive populations for up to 250 mM NaCl, while an average germination of 70% was observed for resistant populations (Serra et al. Reference Serra, Fogliatto and Vidotto2018). Previous studies also found a high tolerance of the Echinochloa genus during germination for two populations of Echinochloa glabrescens Munro ex Hook f. collected in the Philippines, which showed a germination of more than 60% for 200 mM NaCl, with an EC50 value of between 250 and more than 300 mM (Opeña et al. Reference Opeña, Chauhan and Baltazar2014). These values were similar to those found by Serra et al. (Reference Serra, Fogliatto and Vidotto2018) and had the same magnitude as the values found in this study for the emergence of sensitive populations.
In this study, values of between 36% and 44% were observed for the emergence of sensitive populations for the highest salt level, while percentages lower than 20% were recorded for the resistant populations. Thus, emergence seems to be affected more by salinity than germination, as observed in the germination test conducted previously on the same populations; in addition, the emergence of herbicide-resistant populations was reduced to a great extent by high salt concentrations compared with the sensitive ones, as already observed for germination in a previous study (Serra et al. Reference Serra, Fogliatto and Vidotto2018).
Plant Height, Shoot, and Root Weight
Echinochloa crus-galli seedling development was hampered by the salinity conditions, as seedling emergence occurred for NaCl concentrations above 150 mM, but this was followed by the total desiccation of the plants. However, population r2 was already affected at 150 mM NaCl, as the seedlings were able to emerge at this concentration but were unable to grow.
Variability in plant heights among the populations was already observed in the control, in which the height ranged between about 20 cm (population s1) and almost 43 cm (population r1) (Table 2). Increasing salt concentrations did not significantly change the plant height in population s1 or r2, while a general decrease in height was observed in the other populations. Increase in plant height was observed at 50 mM, compared with 0 mM, in all the sensitive populations, with increased values that ranged between about 5% (populations s2 and s3) and about 49% (population s1). The resistant population r2 showed a 38% plant height decrease at 50 mM, and thus an absence of hormesis can be hypothesized; plant heights in population r1 were only slightly reduced (decreased by about 10%). Only population s1 still showed an increase in plant height at 100 mM compared with the control (about 38%), while all the other populations behaved similarly to one another, that is, their height was reduced. Apart from r2, all the other populations showed a more marked height reduction for the highest salt concentration (150 mM), which was more moderate in populations s1 and s2.
Plant height and shoot and root weight of the different Echinochloa crus-galli populations and the percentage difference of these growth parameters for each salt concentration compared with the control.

a Lowercase letters refer to a comparison of the plant height and shoot and root weight of E. crus-galli for NaCl concentrations within the same population.
b The plant height and shoot and root weight variations of E. crus-galli among populations are indicated in lowercase letters in italics, lowercase letters in bold, and uppercase letters for 50, 100, and 150 mM concentrations, respectively. Different letters indicate significantly different values, according to Tukey’s honest significant difference test. Where no letters are present, the comparison was not significant.
Shoot weight was affected more than plant height by increasing salt concentrations, as weight reductions occurred (Table 2). Population s1 showed a higher tolerance to salt, and it was the only one to show an increase in shoot weight at 50 mM (63% increase compared with the control); population r1 did not show any reduction in weight for this salt concentration. All populations showed similar weight reduction at 100 mM, that is, above 70% compared with the control, apart from population s1, which only showed a reduction of about 14%. Population r1 showed an intermediate behavior, with a weight reduction of about 46%. Apart from population r2, which failed to grow, no significant differences in weight reduction were observed among the populations for 150 mM, with reduction values between 62% in population s1 and 88% in population s3, compared with the control.
Root weight also reflected the higher salt tolerance observed for population s1 and the lower salt tolerance observed for population r2. A probable hormetic effect was observed for 50mM in population s1, whose root weight increased by about 54% compared with 0 mM, while the other populations showed a moderate (s2, r1, and r2) or a more marked (s2) root weight decrease. All populations showed a root weight reduction at 100 mM, which was moderate in populations s1 (about 36%) and r1 (about 46%), but more evident in all the others, reaching even higher reduction values than 80% (populations s3 and r2). As already observed for the shoot weight, the root weight decrease was similar among all populations for 150 mM NaCl.
In general, seedling growth (plant height, shoot and root weight) was affected more by salinity at 150 mM in the ALS inhibitor–resistant population r2, which was not able to mature, compared with the sensitive populations, as already observed for emergence; in fact, even though no significant differences were found between resistant and sensitive populations at 50 mM and 100 mM, growth was completely hampered in r2 at the high salt concentration. Among the sensitive populations, s1 was the most tolerant to salt, showing the smallest reduction for all parameters. However, these differences were only detectable up to 100 mM NaCl.
Reductions in plant height and in the biomass of E. crus-galli for increasing salinity levels were observed in previous studies (Chauhan et al. Reference Chauhan, Abugho, Amas and Gregorio2013; Hakim et al. Reference Hakim, Juraimi, Hanafi, Selamat, Ismail and Karim2011; Serra et al. Reference Serra, Fogliatto and Vidotto2018). A study carried out on E. crus-galli seeds, collected in environments with different degrees of salinity, showed that the seeds were able to germinate up to 1.5% NaCl, while once they emerged, they only survived about 20 d at a concentration of about 1% NaCl (Rahman and Ungar Reference Rahman and Ungar1990). A previous study of ours confirmed these results and highlighted that E. crus-galli demonstrates a lower tolerance at the early seedling stage than at the emergence and germination stages (Serra et al. Reference Serra, Fogliatto and Vidotto2018). Plant weight was affected more than height, as a generally more marked reduction was observed in the case of shoot and root weight for increasing salt levels; this was already observed in the same species in a previous study in which plant height was found to be more tolerant to salt than biomass (Wilson and Read Reference Wilson and Read2006). A moderate reduction in plant height in response to salt allows E. crus-galli to be competitive in saline environments, even when the plant biomass is reduced, and it has been demonstrated that most of the competitive ability of this species is due to its fast growth and ability to shade other plants as a result of its height (Pearcy et al. Reference Pearcy, Tumosa and Williams1981; Wilson and Read Reference Wilson and Read2006). Moreover, the allocation of resources toward plant height instead of biomass may be an adaptation of this species to abiotic stresses that permits the species to succeed in difficult environments (Wilson and Read Reference Wilson and Read2006).
In this study, the root weight reduction in all populations showed a similar trend to that of the shoot weight reduction. Such a similarity was also observed in another study on the same species; however, in that study, E. crus-galli was still able to produce roots at 24 dS m−1 EC, while in present experiment, no plants survived after 150 mM NaCl, which could approximately correspond to 15 dS m−1 EC (Chauhan et al. Reference Chauhan, Abugho, Amas and Gregorio2013; Government of South Australia 2015).
Chlorophyll and Carotenoid Content
The chlorophyll a content increased in all populations as the salt level increased, except in population r2, which showed a moderate reduction, with a maximum of 3%, compared with the control (Table 3). The greatest increase in chlorophyll a (about 40% compared with the control) was observed in population s1 for all salt concentrations, followed by population r1, while populations s2 and r1 showed intermediate values with a more moderate increase. The chlorophyll a content increased slightly in population s3, reaching a maximum of 5% for 150 mM NaCl. The chlorophyll b content displayed an even greater increase for higher salt concentrations compared with the control. The only exception was population s3, which showed reduction in the chlorophyll b content of about 20% for 50 and 100 mM and about 40% for 150 mM NaCl compared with the control. All the other populations showed a marked increase in chlorophyll b content for 50 mM compared with the control, with values above 90% in populations s1 and s2. Populations s1 and r1 showed a further increase for 100 mM, that is, above 100%, compared with the control, while populations s2 and r2 showed lower values. Apart from populations s3 and r2, the chlorophyll b content was still higher for 150 mM in all the other populations than that observed at 0 mM NaCl, albeit with lower values than observed with the other salt concentrations.
Chlorophyll a, chlorophyll b, chlorophyll a/b ratio, and carotenoid content of the different Echinochloa crus-galli populations and the percentage difference of these values for each salt concentration compared with the control. a
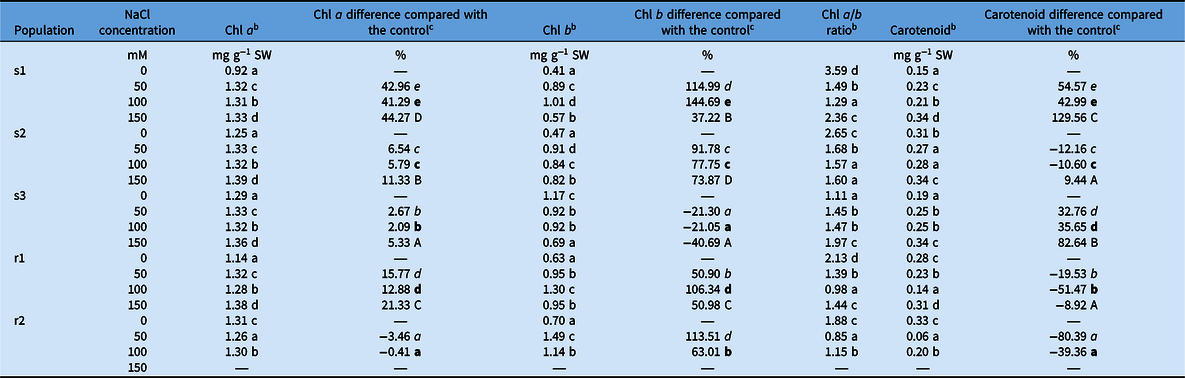
a Abbreviations: Chl, chlorophyll; SW, shoot fresh weight.
b Lowercase letters refer to the comparison of the E. crus-galli chlorophyll a, chlorophyll b, chlorophyll a/b ratio, and carotenoid content for the NaCl concentrations within the same population.
c The E. crus-galli chlorophyll a, chlorophyll b, and carotenoid content variations among populations are indicated in lowercase letters in italics, lowercase letters in bold, and uppercase letters for 50, 100, and 150 mM concentrations, respectively. Different letters indicate significantly different values according to Tukey’s honest significant difference test. Where no letters are present, the comparison was not significant.
Carotenoid content showed a more variable behavior among the populations; decrease in carotenoid content was in fact observed for increasing salt rates for populations s2, r1, and r2, while an increase was detected for populations s1 and s3 compared with the control. A more pronounced decrease was displayed by the ALS inhibitor–resistant populations for all salt concentrations, while population s1 showed the highest increase in carotenoid content, that is, an increase of more than 100% for 150 mM.
Salinity can affect photosynthesis by inducing stomatal closure and a reduction in carbon assimilation, thereby resulting in growth limitation in the short term (Acosta-Motos et al. Reference Acosta-Motos, Ortuño, Bernal-Vicente, Diaz-Vivancos, Sanchez-Blanco and Hernandez2017; Parida and Das Reference Parida and Das2005). In the long term, salinity can cause the accumulation of salt in the leaves and a reduction in the chlorophyll and carotenoid contents (Acosta-Motos et al. Reference Acosta-Motos, Ortuño, Bernal-Vicente, Diaz-Vivancos, Sanchez-Blanco and Hernandez2017). In our study, the photosynthetic pigments increased in the majority of the populations under salt stress, so it is probable that the salinity stress did not last long enough to cause a reduction in the pigment content, as this is generally a long-term response to salt (Acosta-Motos et al. Reference Acosta-Motos, Ortuño, Bernal-Vicente, Diaz-Vivancos, Sanchez-Blanco and Hernandez2017; Stepien and Johnson Reference Stepien and Johnson2009). However, not only were the chlorophyll and carotenoid contents not reduced under saline conditions, they also showed an increase, thus indicating the tolerance of E. crus-galli to salt; a rise in chlorophyll under saline conditions is considered a marker of salt tolerance in plants, as observed in other salt-tolerant species (Acosta-Motos et al. Reference Acosta-Motos, Diaz-Vivancos, Álvarez, Fernández-García, Sanchez-Blanco and Hernández2015; Ashraf and Harris Reference Ashraf and Harris2013; Stepien and Johnson Reference Stepien and Johnson2009).
In our study, population r2 displayed a reduction in both chlorophyll a and carotenoid contents, thus confirming it was the most sensitive to salt. Another indicator of salt tolerance is the high chlorophyll a/b ratio, which is known to be an indicator of health and nonstressed plants (Duarte et al. Reference Duarte, Santos, Marques and Caçador2013). In our study, most populations showed a decreasing value for the chlorophyll a/b ratio as the salt concentration increased up to 100 mM (Table 3); only population s3 showed an increase in this ratio at increasing salt concentrations, while a more variable behavior was shown by population r2. This could indicate that even though such plants have a certain degree of salt tolerance, salinity induced stress and slowed down photosynthesis, as also demonstrated by the reduction in seedling weight.
Carotenoid content was reduced more compared with chlorophyll content in presence of salt; a reduction in carotenoids has been found to be caused by both oxidation due to ROS and destruction of carotenoids due to salt (Abdel Latef et al. Reference Abdel Latef, Abu Alhmad, Kordrostami, Abo–Baker and Zakir2020). However, populations s1 and s3 showed an increase in carotenoid content for increasing levels of salt, thus demonstrating they were less sensitive to salinity; the high carotenoid content in these populations could have protected the chlorophyll, thereby preventing its photo-oxidation (Toscano et al. Reference Toscano, Trivellini, Cocetta, Bulgari, Francini, Romano and Ferrante2019).
Oryza sativa (Weedy Rice and Rice)
Seedling Development
Plant Emergence
Seedling emergence of O. sativa and rice was affected more by salinity than E. crus-galli emergence was. Plant emergence for 0 mM NaCl was quite similar for all the O. sativa populations and Baldo, with values of about 90% or above; only CL80, the variety tolerant to imazamox, displayed values of about 60% (Figure 2). The comparison of parameter d of the curve showed an initial different emergence among all rice and O. sativa populations, including Baldo, and the CL80 resistant variety (Table 4). Slope was instead more similar between curves, and the only detected differences were between CL80 and both populations wr2 and wr3. The point of inflection e of the curves was different between populations, as differences were found between population wr1 and all the other populations and rice varieties and between wr3 and Baldo. The most similar curves, showing nonsignificant differences between parameters and SI, were wr2 versus wr3 and wr2 versus Baldo (Table 4).
Dose–response emergence curve with the average data points of the different Oryza sativa (weedy rice) populations and rice varieties against the salt concentration. Curve parameter estimates (Equation 1): wr1 (b = 9.40, d = 87.14, e = 195.80), wr2 (b = 9.40, d = 87.14, e = 160.19), wr3 (b = 8.49, d = 89.73, e = 173.01), Baldo (b = 4.81, d = 87.12, e = 146.49), CL80 (b = 3.08, d = 60.89, e = 140.04). The salt concentration required to reduce the emergence by 50% (EC50) and the significant pairwise comparisons between EC50 (SI index) are shown below the graph (Equation 2).

Curve parameter (Equation 1) and sensitivity index (SI) (Equation 2) comparison between Oryza sativa populations/varieties (estimate and P-values).

* Significant comparisons at P ≤ 0.05.
Emergence was quite similar to that of the control for 50 mM NaCl. A more marked emergence reduction occurred for 100 mM compared with the control, particularly in the CL80 variety, which showed a 30% decrease in emergence, and an even more marked decrease occurred for 150 mM. Population wr1 displayed the highest emergence percentage for 200 mM, with an average emergence value of about 43%, while the lowest rate of emergence was recorded for Baldo (about 17%), CL80, and wr2, with about 19% of germination, which corresponds to a reduction of about 80% compared with the control. All the O. sativa populations and rice varieties showed an emergence reduction of at least 90% for the highest NaCl concentration, compared with the control. A slightly higher emergence was recorded in the Baldo variety (8% emergence) for this salt rate, while emergence did not occur in the wr2 O. sativa population.
The NaCl concentration required to reduce emergence by 50% (EC50) was between 140 mM for CL80 and 195 mM for the wr1 population. A pairwise comparison between EC50 values (SI index) showed that wr1 had a significantly higher EC50 than all the tested O. sativa populations and rice varieties, thus suggesting a higher tolerance to salt. Moreover, both rice varieties showed a significantly lower value of EC50 than the wr3 O. sativa population.
Oryza sativa and rice showed a higher sensitivity to salt than E. crus-galli, as demonstrated by the lower EC50 values. Moreover, similar values for emergence reduction were recorded for a salt concentration of 250 mM in E. crus-galli, but for lower concentrations in rice and O. sativa, that is, for values between 150 and 200 mM (Figures 1 and 2). Previous studies also demonstrated that a moderate level of soil salinity (between 40 and 100 mM) still permits rice to grow, but some weeds, such as E. crus-galli, can germinate and even grow better than rice under these conditions (Chauhan and Johnson Reference Chauhan and Johnson2009). Another study graded O. sativa as moderately tolerant to salinity, while E. crus-galli was classified within the salt-tolerant species, as its germination was about 30% for salt concentrations of 240 mM (Hakim et al. Reference Hakim, Juraimi, Hanafi, Selamat, Ismail and Karim2011). A previous study on the sensitivity of Italian O. sativa populations and rice varieties to salt showed that CL80 was affected more by salt, in terms of germination, than other herbicide-sensitive O. sativa populations and the conventional Baldo rice variety, which was the least affected by salt (Fogliatto et al. Reference Fogliatto, Serra, Patrucco, Milan and Vidotto2019). In this study, the Baldo variety was less tolerant to salt, in terms of emergence, compared with germination, as the wr1 O. sativa population showed a higher emergence rate for increasing salt levels. This was also demonstrated by the higher EC50 displayed by wr1 compared with all other O. sativa and rice varieties, including Baldo. The CL80 variety was confirmed to be salt sensitive, even at emergence, as it showed the highest emergence reduction across all salt concentrations. A certain variability in salt tolerance among rice varieties was demonstrated in previous studies, and the Baldo variety was classified as moderately sensitive or tolerant to salt according to the varieties to which it was compared (Bertazzini et al. Reference Bertazzini, Sacchi and Forlani2018). Apart from the abovementioned study on germination, which highlighted a high level of sensitivity to saline conditions in the CL80 variety, no information regarding the sensitivity of this variety to salt is available (Fogliatto et al. Reference Fogliatto, Serra, Patrucco, Milan and Vidotto2019).
Plant Height, Shoot, and Root Weight
Oryza sativa and rice were observed to be sensitive to salt, as they were only able to develop seedlings for a concentration of 50 mM NaCl. After emergence, seedlings were not able to survive at higher salt levels, thus demonstrating the high sensitivity of O. sativa to salt at early seedling stages compared with emergence (Table 5).
Plant height and shoot and root weight of the different Oryza sativa populations (weedy rice) and rice varieties and the percentage difference of these growth parameters for each salt concentration compared with the control.

a Lowercase letters refer to the growth parameter variations among populations for 50 mM. Different letters indicate significantly different values, according to Tukey’s honest significant difference (HSD) test. Where no letters are present, the comparison was not significant.
* Significant differences of the growth parameters, according to Tukey’s HSD test, between the two NaCl concentrations (0 mM and 50 mM) for each population/rice variety.
The difference in plant height between the control and 50 mM NaCl was only significant for the CL80 variety, for which salt reduced the height by about 35% compared with the control (Table 5). Population wr2 showed a slight reduction in height (about 3%) with salt, while all the other populations were slightly stimulated, with Baldo and wr3 recording the largest increases. The reduction in shoot weight due to salt was again only significant for CL80 (about 66% reduction compared with the control). All the other populations and Baldo showed a more moderate weight reduction, while population wr3 did not display any shoot weight reduction compared with the control. Root weight was affected more by salt than shoot weight, as a significant root weight decrease was observed for both rice varieties and wr2. The highest root weight reduction was observed for CL80 (about 51% reduction) and wr2 (about 48% reduction), while population wr3 was affected the least (about 8% reduction). In general, at the seedling stage, O. sativa population wr3 seemed to be able to better tolerate saline conditions when compared with the resistant CL80, as it showed a significantly greater plant height and lower root and shoot weight reduction. Population wr3 also showed a lower root weight reduction compared with wr2, in contrast to what was observed for emergence, in which population wr1 was the most tolerant. As already observed for emergence, among all populations and varieties, CL80 was the most sensitive to salt.
A lower tolerance of rice to salinity, compared with E. crus-galli, was found in previous studies in which rice was not able to develop seedlings at a high salt level, as rice is more sensitive to salt at emergence and in the early growth stages (Aslam et al. Reference Aslam, Qureshi and Ahmed1993; Chauhan et al. Reference Chauhan, Abugho, Amas and Gregorio2013; Korres et al. Reference Korres, Burgos, Travlos, Vurro, Gitsopoulos, Varanasi, Duke, Kudsk, Brabham, Rouse and Salas-Perez2019). When comparing the differences in salt tolerance between rice and O. sativa, it was found that the latter required higher salt levels than rice to achieve a 50% reduction in dry weight, thus highlighting an advantage of the weed over the crop in saline environments (Cirillo et al. Reference Cirillo, Masin, Maggio and Zanin2018; Tanji and Kielen Reference Tanji and Kielen2002). In our study, regarding growth parameters, we found more variable behavior: CL80 was found to be more sensitive than the O. sativa population wr3 and Baldo, which showed an intermediate tolerance, and was similar to that of some O. sativa populations.
Plant height of rice and O. sativa was not significantly reduced by salt, except for CL80, which appeared to be highly sensitive to salinity. Previous studies conducted on different rice varieties with low salt concentrations showed either a reduction in plant height for the most sensitive varieties or no change in plant height in the case of more tolerant varieties, thus highlighting a wide variability among genotypes (Bertazzini et al. Reference Bertazzini, Sacchi and Forlani2018; Hakim et al. Reference Hakim, Juraimi, Hanafi, Ali, Ismail, Selamat and Karim2014a; Motamed et al. Reference Motamed, Asadi, Rezaei and Amiri2008). In our study, we confirmed both results, as only the most salt-sensitive variety showed a height decrease.
The shoot and root weight were reduced more in the presence of salt, and this can be attributed to reduced photosynthesis and turgor, salt toxicity, and a disruption in mineral nutrition (Bertazzini et al. Reference Bertazzini, Sacchi and Forlani2018; Hakim et al. Reference Hakim, Juraimi, Hanafi, Ismail, Rafii, Islam and Selamat2014c). Some studies found that root and shoot weight were reduced by salt to a similar extent; in our study, we found a greater reduction in root weight. A previous study found that the rate of Na+ accumulation in rice was higher in roots than in shoots, and this resulted in a reduction in root biomass (Hakim et al. Reference Hakim, Juraimi, Hanafi, Ismail, Rafii, Islam and Selamat2014c).
Chlorophyll and Carotenoid Contents
Chlorophyll content showed variable behavior in the presence of salt, depending on O. sativa population and rice variety (Table 6). In fact, chlorophyll a content increased at 50 mM in populations wr2, wr3, and Baldo compared with the control, while it was reduced at a greater extent in wr1 and CL80. The wr1 O. sativa population showed the greatest reduction in chlorophyll, about 80%, followed by CL80, which recorded a reduction of about 50%. Baldo showed the greatest increase in the presence of salt (about 68%). A similar trend was noted for chlorophyll b content for all populations and rice varieties, with reduced or increased values similar to those for chlorophyll a; the only exception was population wr3, which had a reduction (about 16% decrease) in chlorophyll b content. Carotenoid content decreased to a great extent in population wr1, that is, a reduction of more than 70% was observed in the presence of salt, and this was followed by CL80, with a reduction above 67%. Carotenoid content in populations wr2, wr3, and Baldo increased as salinity increased, with the highest value being recorded for Baldo (about 78% increase, compared with the control).
Chlorophyll a, chlorophyll b, chlorophyll a/b ratio, and carotenoid content of the different Oryza sativa (weedy rice) populations and rice varieties and the percentage difference of these values for each salt concentration compared with the control. a

a Abbreviations: Chl, chlorophyll; SW, shoot fresh weight.
b Lowercase letters refer to the chlorophyll and carotenoid content variations among populations for 50 mM. Different letters indicate significantly different values according to Tukey’s honest significant difference (HSD) test. Where no letters are present, the comparison was not significant.
* Significant variations of the chlorophyll, chlorophyll a/b ratio, and carotenoid content, according to Tukey’s HSD test, between the two NaCl concentrations (0 mM and 50 mM) for each population/rice variety.
The higher sensitivity to saline conditions of O. sativa and rice compared with E. crus-galli was also confirmed by the chlorophyll and carotenoid contents, which often showed a decrease in the presence of salt, in particular in the most sensitive O. sativa population (wr1) and rice variety (CL80); similar results were found in a previous study that showed a greater reduction of photosynthetic pigments in O. sativa than in E. crus-galli (Hakim et al. Reference Hakim, Juraimi, Hanafi, Ismail, Rafii, Aslani and Selamat2014b). Concerning the growth parameters (plant height, shoot and root weight), CL80 was more sensitive to salt than all other O. sativa and rice varieties; this sensitivity was also confirmed by the low photosynthetic pigment content. However, population wr1, which showed an intermediate sensitivity to salt in the growth parameters, recorded the highest chlorophyll and carotenoid content reduction, thus highlighting a greater sensitivity, which would probably also have been observed in seedling growth if the salt conditions had lasted longer. Baldo and wr3 were once again confirmed to be the most tolerant to salt when photosynthetic pigments were considered.
The chlorophyll a/b ratio rose for increasing salt concentrations in all O. sativa populations and Baldo, while it did not vary at 50 mM compared with 0 mM in CL80 (Table 6); as a high ratio is an indicator of a healthy plant, this confirmed the higher salt sensitivity of CL80 (Duarte et al. Reference Duarte, Santos, Marques and Caçador2013). Even though population wr1 displayed the greatest pigment reduction, it also recorded a high chlorophyll a/b ratio; this behavior could probably be explained by the fact that during the degradation of chlorophyll b due to salt, to prevent further damage, chlorophyll b may be converted to chlorophyll a, which is the primary photosynthetic pigment (Ashraf and Harris, Reference Ashraf and Harris2013). The increase or moderate decrease in the chlorophyll content in salt-tolerant rice varieties observed in this study, as opposed to a marked decrease for salt-sensitive rice varieties, was also found in previous studies, thereby highlighting a high variability in salt response within Oryza sativa species (Kibria et al. Reference Kibria, Hossain, Murata and Hoque2017).
This study has highlighted a different tolerance to salinity of the tested species; E. crus-galli was found to be more tolerant than both O. sativa and rice. The level of tolerance varied according to the considered growth stage, and it was higher at emergence and lower at the seedling stage. The two weed species and rice were able to emerge up to 250 mM NaCl, while E. crus-galli was only able to grow for concentrations of up to 150 mM NaCl at the seedling stage, while rice and O. sativa only developed seedlings up to 50 mM. Previous studies found that salinity tolerance at the seedling stage was not correlated with salinity tolerance at other growth stages in rice (Ferdose et al. Reference Ferdose, Kawasaki, Taniguchi and Miyake2009; Kakar et al. Reference Kakar, Jumaa, Redoña, Warburton and Reddy2019). A further demonstration of this finding is the behavior of population wr1, which was the most salt tolerant at emergence, but not at the seedling stage.
In some cases, relatively low concentrations of salt can stimulate plant growth, acting as a hormetic effect (Calabrese Reference Calabrese2013). In our study, hormesis was observed in E. crus-galli emergence and in the plant height of almost all populations for 50 mM NaCl. This phenomenon was less evident in O. sativa and rice, even though it was observed in some populations for 50 mM in terms of emergence (wr1 and wr2) and plant height (wr1, wr2, and Baldo). This phenomenon was reported in previous studies; in China, for example, some weed species were stimulated to germinate in soil taken from coastal areas with a moderate level of salinity (Bai et al. Reference Bai, Huang, Gao, Lu, Wang and Zhao2014).
Wide variability in response to salt was not only found for the different species but also among populations within the same species. The tested populations of both E. crus-galli and O. sativa responded variably to salt, in terms of growth parameters. Baldo and CL80 demonstrated different salt tolerance, as CL80 was observed to be more sensitive than Baldo. Wide growth variability has been demonstrated for both E. crus-galli and O. sativa, even under nonsaline conditions, as weeds are generally characterized by wide phenotypic plasticity, as well as genetic variability, in response to different environmental conditions (Chauhan and Johnson Reference Chauhan and Johnson2009; Fogliatto et al. Reference Fogliatto, Vidotto and Ferrero2011, Reference Fogliatto, Vidotto and Ferrero2012).
This study also aimed to establish whether ALS inhibitor–resistant and ALS inhibitor–sensitive E. crus-galli populations and rice varieties responded differently to salinity. The ALS inhibitor–resistant E. crus-galli population r2 was affected more by salt, in terms of emergence, seedling growth, and carotenoid content, but this was less evident in the other resistant population r1; a behavior similar to that of r2 was observed for CL80, which is tolerant to an ALS-inhibiting herbicide. Even though only a few resistant populations were tested, the study highlighted a common behavior in response to salt in two out of three herbicide-resistant populations (r2 population for E. crus-galli and CL80); this behavior is probably caused by a fitness penalty that may be associated with herbicide resistance, even though specific studies are needed to confirm this hypothesis (Keshtkar et al. Reference Keshtkar, Abdolshahi, Sasanfar, Zand, Beffa, Dayan and Kudsk2019). Greater growth performance and higher competitive ability of herbicide-sensitive populations were also reported in a previous germination study on O. sativa and rice, while similar competitive ability was observed when comparing E. crus-galli populations resistant and sensitive to propanil and clomazone (Bagavathiannan et al. Reference Bagavathiannan, Norsworthy, Jha and Smith2011; Fogliatto et al. Reference Fogliatto, Serra, Patrucco, Milan and Vidotto2019). However, previous studies carried out with other species that are resistant to different herbicides found a higher growth performance and tolerance to salt in resistant populations (Shrestha et al. Reference Shrestha, deSouza, Yang, Sosnoskie and Hanson2018). A study conducted on junglerice [Echinochloa colona (L.) Link] found that glyphosate-resistant biotypes were more competitive, germinate better, and produce more biomass under moisture and saline conditions than sensitive populations (Shrestha et al. Reference Shrestha, deSouza, Yang, Sosnoskie and Hanson2018). Therefore, a lower growth performance of resistant populations in response to diverse environmental stresses cannot be generalized, and it may vary for different species, different populations within a species, and different herbicides and their related modes of action (Shrestha et al. Reference Shrestha, deSouza, Yang, Sosnoskie and Hanson2018).
This study highlighted that Baldo performed better under high salt concentrations than CL80; thus the availability of salt-tolerant rice varieties is particularly important, as the majority of the rice areas throughout the world are located near coastal areas and river deltas where salinity problems are more common (Formentin et al. Reference Formentin, Sudiro, Perin, Riccadonna, Barizza, Baldoni, Lavezzo, Stevanato, Sacchi, Fontana, Toppo, Morosinotto, Zottini and Lo Schiavo2018). Moreover, some weeds can be more competitive than others in saline environments (Fogliatto et al. Reference Fogliatto, Vidotto and Ferrero2020); according to our study, E. crus-galli is favored more than O. sativa under saline conditions, and thus more efforts should be made to control this weed. Populations resistant to ALS inhibitors showed variable behavior, with some populations that tolerate salt (such as the E. crus-galli r1 population) and others that can be more sensitive to salt (such as the E. crus-galli population r2 and the CL80 rice variety).
Acknowledgments
This research received no specific grant from any funding agency or the commercial or not-for-profit sectors. No conflicts of interest have been declared.


 Open access