Introduction
The results of a medical imaging process are often the basis for clinicians to decide for the appropriate therapy. Methods, such as magnetic resonance imaging (MRI), ultrasound and computed tomography (CT), which is a very well developed application of X-ray, are widespread and successfully used in many different applications. The presented brain imaging measurement system is an application of electromagnetic tomography (EMT), which mainly visualizes the differences in the electrical properties of materials, namely permittivity, which influence the electromagnetic waves. This differs from the analysis of material and proton density, which is investigated by CT or MRI setups. Therefore, EMT is a complementing imaging technique, which provides the benefit of determining tissue properties, such as ischemia and blood oxygenation in a completely noninvasive way.
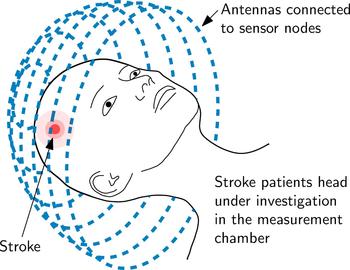
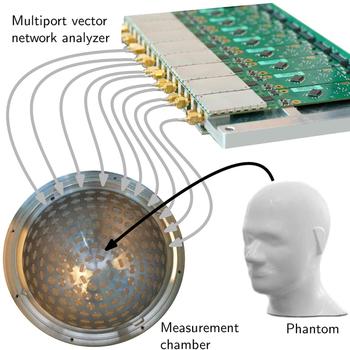
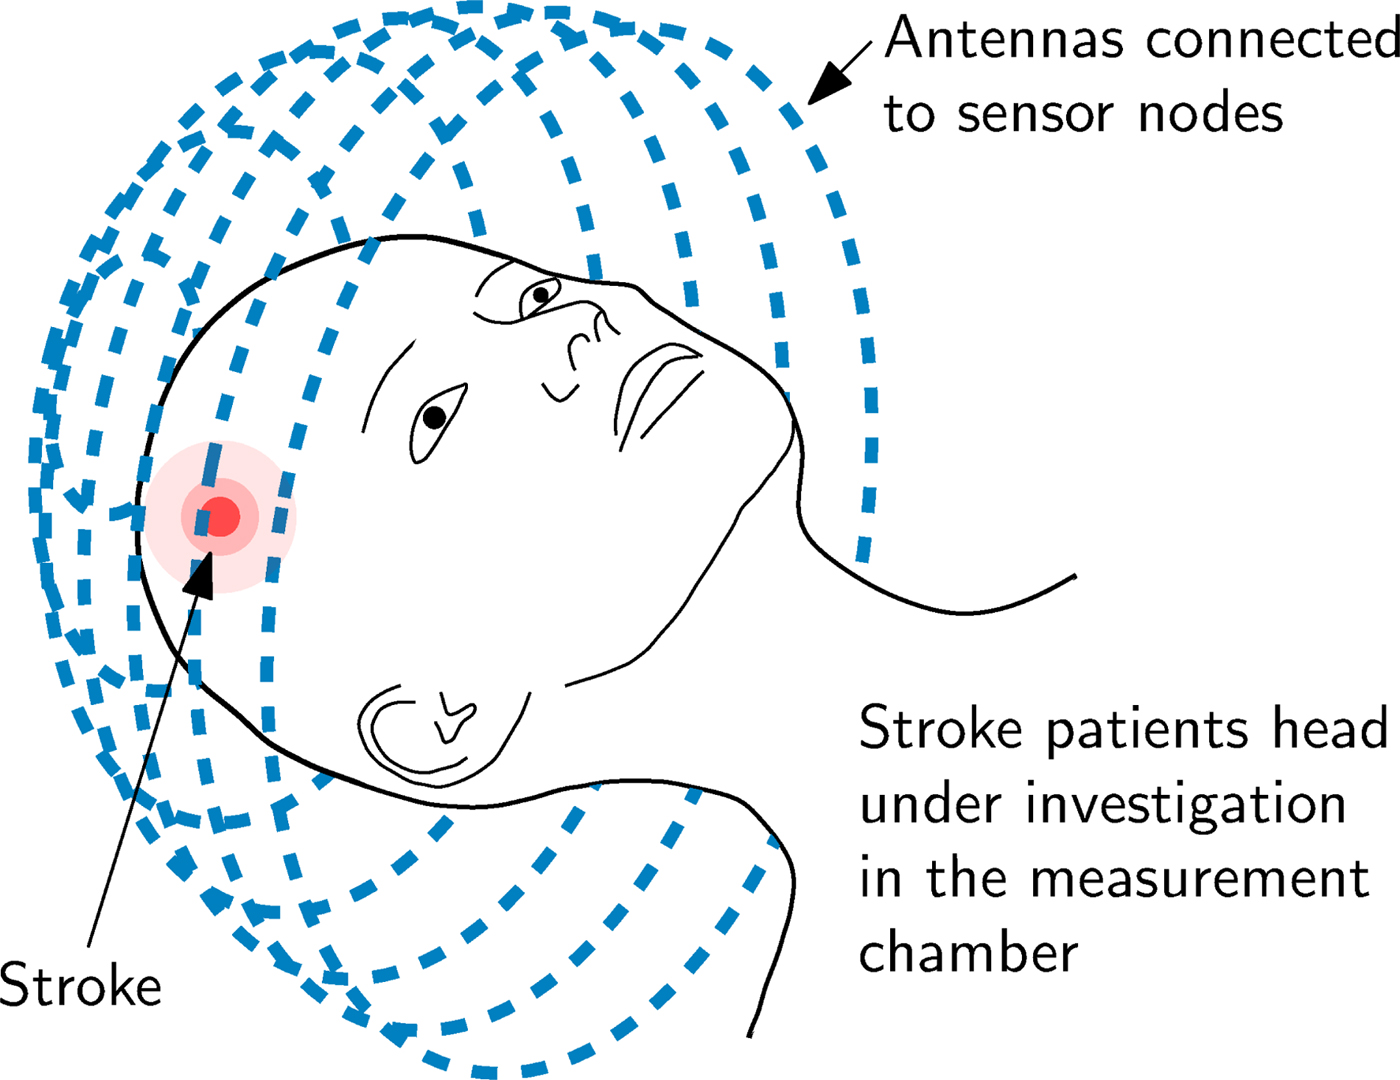
The principle of an EMT setup for brain imaging is sketched in Fig. 1. The measurement setup includes a large number of T X and R X antennas and sensor nodes which are located around the subject under test (SUT). The sensor nodes are capable of sampling the phase and magnitude of electromagnetic waves. During measurements, an electromagnetic wave is transmitted at one antenna position and received at all other positions, sampling the influence of the SUT inside the measurement chamber on the phase and the magnitude of the transmitted electromagnetic wave.
An EMT system mainly consists of the arrangement of T X and R X antennas placed around the SUT, in this case on a sphere (which is called measurement chamber) around the human head.
The measurement data serves as input to an algorithm, which is solved iteratively. The quality of the result of the imaging process depends on the measurement data in terms of signal-to-noise ratio (SNR) and measurement accuracy. Especially in this case, as the spatial resolution of the resulting image is limited by the measurement frequency, which should not exceed 1 GHz, because of the high losses of the human head.
Altogether, the mentioned requirements set the list of system performance parameters. It is designed to measure signals of power levels down to − 150 dBm with high accuracy. The necessity of being capable to measure such low signal levels is the high attenuation of the human head and the output power limitation of 0 dBm, which is considered as being inherently safe in medical applications. In addition, the presented system keeps the measurement duration short, because of its capabilities of dealing with hundreds of antennas simultaneously.
A benefit of EMT systems compared to stationary imaging devices is the compact form factor or even portable design. Since antennas and electronics are small and no moving parts are involved, it is envisioned to apply the imaging system to the patient affected by stroke very early after occurrence. This is our main motivation to built such a multiport vector network analyzer (MPVNA) system: a reliable and especially early examination of the patient can be life-saving. Brain cells are irreparably damaged from the beginning of the bleeding. The presented system offers the capability to not only localize the affected area, but also to distinguish between ischemic (i.e. caused by a blood clot) or hemorrhagic (i.e. caused by bleeding) stroke [Reference Hopfer, Planas, Hamidipour, Henriksson and Semenov1], which is one of the most valuable informations to clinicians due to the differing medication in these two cases. In both cases the permittivity ε of the affected area of the brain differs from that of healthy cerebral matter. This results in a contrast Δε that is made visible in the reconstructed image. To provide as much information about the brain as possible, very low contrast levels must be resolved.
Especially the benefit of being capable to provide information about the condition of the brain much sooner and completely noninvasive have attracted the attention of several research groups worldwide. One of the first measurement setups was proposed in [Reference Semenov, Svenson, Boulyshev, Souvorov, Borisov, Sizov, Starostin, Dezern, Tatsis and Baranov2] in 1996, consisting of a chamber with 64 antennas which are connected to a measurement system. This system was built up with a switching system to cover all antennas and a quadrature phase detector, connected to an analog-to-digital converter (ADC) which was used for sampling the data to a computer. This 2D-system was further evolved to a 3D-system [Reference Semenov, Svenson, Bulyshev, Souvorov, Nazarov, Sizov, Pavlovsky, Borisov, Voinov, Simonova, Starostin, Posukh, Tatsis and Baranov3] where the receiver is mechanically positioned instead of using a switching system. This improves measurement performance due to the missing switching system and its introduced losses. Similar multi-antenna systems have been used for first clinical studies of breast imaging [Reference Meaney, Paulsen, Chang, Fanning and Hartov4,Reference Meaney, Fanning, Li, Poplack and Paulsen5] as well, which is another very popular application of EMT systems. Later systems, as presented in [Reference Semenov, Kellam, Williams, Quinn and Nair6], use vector network analyzer (VNA)s and external switching matrices to perform measurements of multi-antenna setups. Other setups for stroke detection are presented in [Reference Fhager and Persson7], where a modified bicycle helmet represents the measuring chamber and again a VNA and a switching system are used for measurements. This approach is used as well in [Reference Beada'a, Abbosh, Mustafa and Ireland8–Reference Tournier, Bonazzoli, Dolean, Rapetti, Hecht, Nataf, Aliferis, El Kanfoud, Migliaccio, De Buhan, Darbas, Semenov and Pichot10]. The execution of a clinical study of the system in [Reference Semenov, Planas, Hopfer, Hamidipour, Vasilenko, Stoegmann and Auff9] verifies the feasibility of the concept under real-world conditions.
Setups that use switch matrices must cope with insertion losses and isolation imperfections that limit the measurement performance. This would pose a problem especially in our case, because low-level signals must be detected with high accuracy. Therefore, getting rid of a switch matrix was one of the goals of the presented solution.
Several other attempts of removing the VNA and the switching matrix from the setup can be found in literature, e.g. [Reference Mobashsher, Abbosh and Wang11], where only one antenna is moved around the head and the data is measured from different positions of the antenna. For data collection, a compact and portable Agilent VNA is used. Though this leads to a compact system, it also restricts the use cases, due to the complex repositioning mechanics. In order to reduce size even further, the VNA is completely replaced by electronic off-the-shelf components and boards in [Reference Tobon, Attardo, Dassano, Vipiana, Casu, Vacca, Pulimeno and Vecchi12,Reference Pagliari, Pulimeno, Vacca, Tobon, Vipiana, Casu, Solimene and Carloni13], while [Reference Marimuthu, Bialkowski and Abbosh14] uses a software-defined radio (SDR) to keep costs for the measurement setup low and to speedup the measuring process.
This text covers the measurement performance of the system, presents first results [Reference Poltschak, Freilinger, Feger, Stelzer, Hamidipour, Hopfer, Planas, Henriksson and Semenov15] and focuses in more detail on the sensor node hardware and the measurement and reconstruction procedure.
The paper is organized as follows: The section 2 describes the hardware of one sensor node, followed by the measurement performance in the section 3. The measurement system composed of multiple sensor nodes and its application is described in the section 4. The measurement procedure and results are presented in the section 5.
Sensor node hardware
In order to fulfill the required specifications of maximizing SNR and compactness, the hardware was designed as modular distributed measurement system. Each antenna of the measurement chamber is equipped with a sensor node which corresponds to one port of the multiport system. All nodes are connected and synchronized, but operate independently. This allows a flexible and expandable system architecture which can include even hundreds of ports, as further described in the section 4. In the proposed hardware prototype setup, the nodes are realized using off-the-shelf components and custom printed circuit boards (PCB)s.
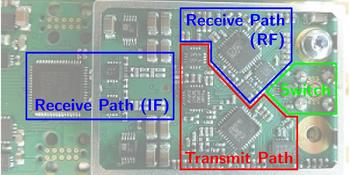
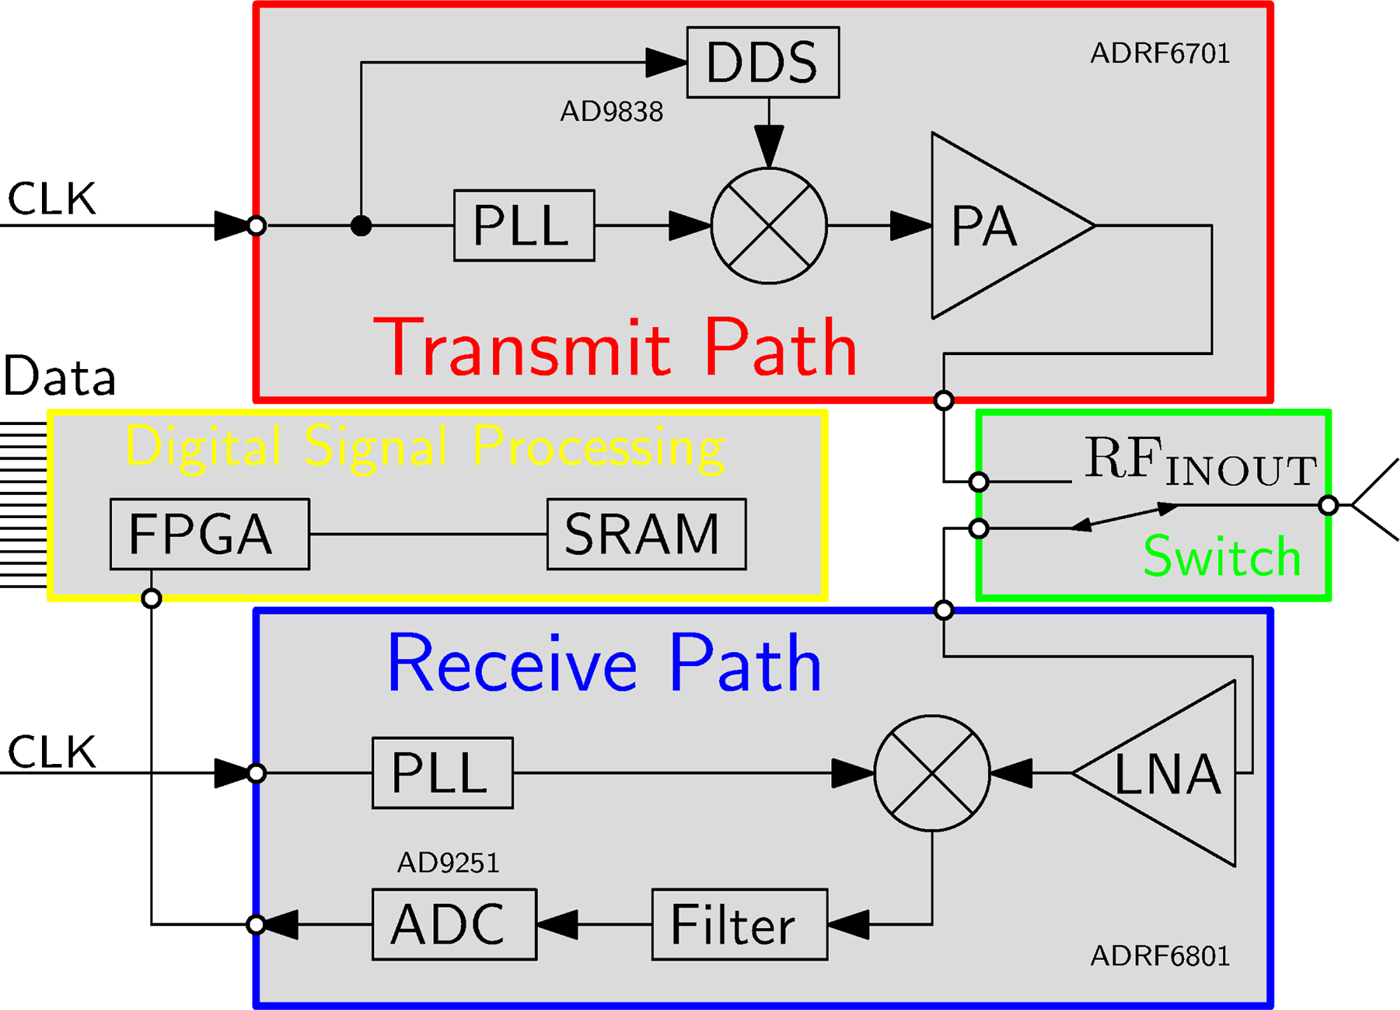
The basic building blocks of one sensor node are shown in Fig. 2 and the hardware realization in Fig. 3.
Block diagram of the hardware architecture of one sensor node.
The hardware realization of one sensor node on a PCB.

The sensor node consists of an RF transmit- and receive- path, separated by an electronic RF-switch, as shown in Fig. 2. The transmitter combines a phase-locked loop (PLL), which operates in the desired frequency range around 1 GHz, a frequency mixer and a power amplifier. A direct digital synthesizer (DDS) is used as signal generator for the baseband modulation signal which serves as input to the upconverting mixer. The DDS enables a programmable choice of modulation frequency, which allows to choose a frequency that is not influenced by spurious signals of other components of the sensor node. The modulation frequency is chosen in the range from 3–100 kHz, because it is preferable to enlarge the separation to DC for the reason of noise sources (e.g. 1/f noise) and a relatively low modulation frequency leads to relaxed requirements for the ADC in the receive path. The receive path covers a high gain low-noise amplifier (LNA), a PLL and a mixer. The down-converted baseband signal at the output of the mixer is filtered by an analog filter chain and converted by an ADC. The PLLs of all sensor nodes are synchronized by using the same reference clock signal which is distributed across the entire system. The accuracy of the distribution is a crucial factor for the stability of the phase result of the measurement. A varying time delay in between the reference clock signal of the transmitter PLL and the receiver PLL directly maps to a phase shift in the measurement data. Evaluated at the present measurement frequency of 1 GHz, a time shift of one of the reference signals of 2.7 ps ends up in a phase shift of the measurement result of approximately 1°. Further presented measurements were collected after a warmup time, which ensures that the phase error of the 1 GHz signal due to reference clock signal shift is smaller than 1°.
Besides the analog RF-signal part of the sensor node, it is additionally equipped with digital signal processing hardware. Signal processing algorithms are realized within the field-programmable gate array (FPGA), making the port PCB a smart sensor node capable of data evaluation directly at each port. A Goertzel algorithm, implemented as fixed point IIR filter of second order [Reference Sysel and Rajmic16,Reference Freilinger, Poltschak, Feger, Stelzer, Hamidipour, Hopfer, Planas, Henriksson and Semenov17], processes the sampled data. These distributed computations reduce the load of the data interface and the duration of one measurement cycle.
The external connection of one sensor node only consists of a digital data - and synchronization interface.
Measurement performance
The performance of the measurements is judged and compared alongside the results of commercially available VNAs in terms of the lowest detectable signal and variance over multiple measurements.
The measurements were carried out using an electronically switched attenuator. To cover the dynamic range of the MPVNA from − 40 dBm to − 160 dBm, the measurements were conducted in three batches. The output power was set to 0 dBm on all compared devices, as this ensures safe operation for medical applications.
Figure 4 covers the dynamic range of the MPVNA and the lowest detectable signal value of the system in relation to measurement time. The graph shows the comparison of three of the implemented acquisition times. Alongside the measurement results of the MPVNA, similar measurements using different VNAs are shown.
Comparison of the sensitivity below − 40 dBm for different measurement settings of the VNAs and our MPVNA (two-port system). The mean values of 400 measurements taken at 1 GHz and 0 dBm output power are shown.
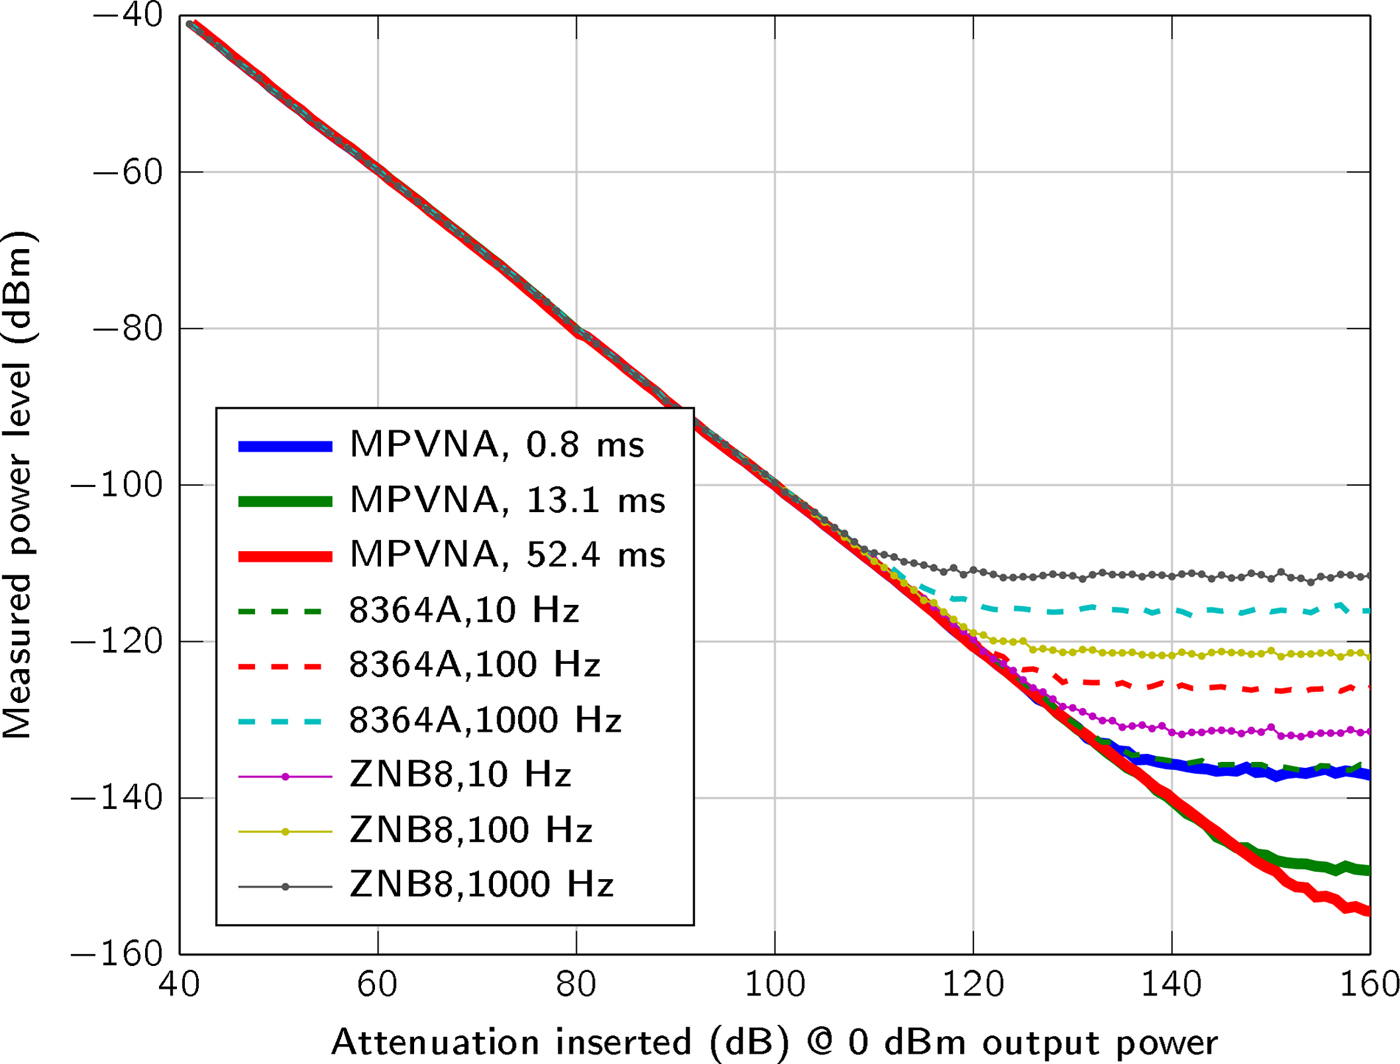
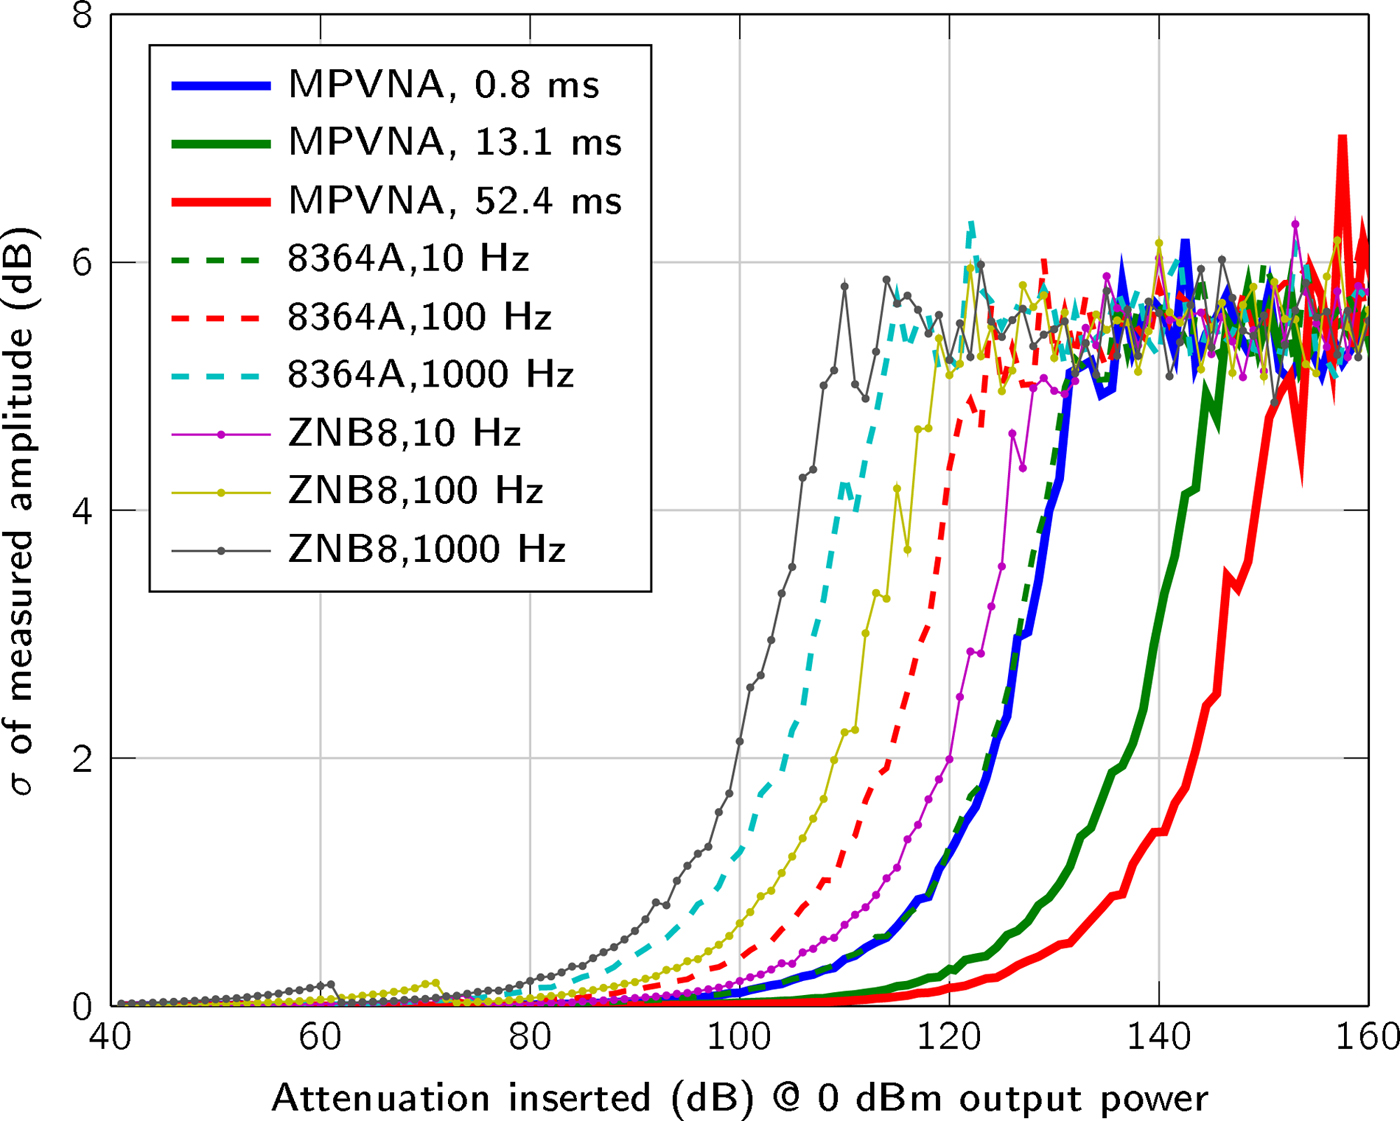
We used a two-port MPVNA system configuration to obtain results that are comparable to those of to the VNAs, an Agilent 8364A (using direct receiver input) and a Rohde & Schwarz ZNB8. As plotted in Fig. 4, the mean value of 400 measurements states the influence of the measurement time, or resolution bandwidth, respectively. It is apparent, that the MPVNA shows the same results using its shortest measurement time, compared to the Agilent 8364A VNA using a relatively narrow resolution bandwidth of 10 Hz and direct receiver input, which means that there was no coupler used on the receive port. Longer measurement times of the MPVNA even show results, which cannot be reached using the VNA. The MPVNA is designed specifically for a narrow-bandwidth operation and captures only transmission measurements, which has further positive influence on the performance. The intended lack of switchable amplifiers provides maximum linearity over the entire dynamic range of 110 dB. The VNAs switch amplification to extend their dynamic range towards higher signal levels. One problem caused by them is the discontinuous course of the variance, as can be seen in between 60 dB and 80 dB attenuation in Fig. 5.
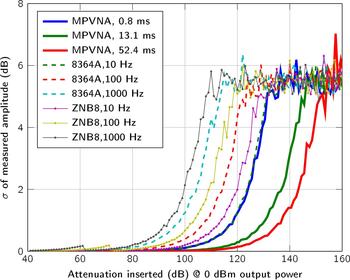
Plot of the standard deviation (N = 400 measurements) of the measured signal amplitude between two ports, with a transmit power of 0 dBm and inserted attenuation from 40 dB to 160 dB between the two ports.
If we compare our system to a multiport VNA system with a switch matrix, the difference in the lowest detectable signal level would become even greater, as the insertion loss of the switch matrix (typically 8 dB for the 256-port matrix [Reference Micronics18] used) has to be considered. The parallel multiport-design of the MPVNA does not suffer from performance degradation due to port extension: imperfect isolation of the switch matrix paths and the switching time.
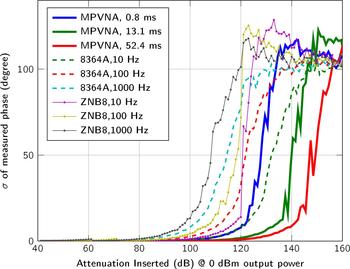
In addition to the sensitivity, the standard deviation  $\sigma = \sqrt {{1 \over N}\sum ^{N}_{n=1}(x_n - {1 \over N}\sum ^{N}_{n=1}x_n )^2}$ of the measurement values, with x n given in dBm for amplitude and in degree for phase, for N = 400 measurements is plotted in Fig. 5 and for the measured phase in Fig. 6.
Plot of the standard deviation (N = 400 measurements) of the measured signal phase between two ports, with a transmit power of 0 dBm and inserted attenuation from 40 dB to 160 dB between the two ports.
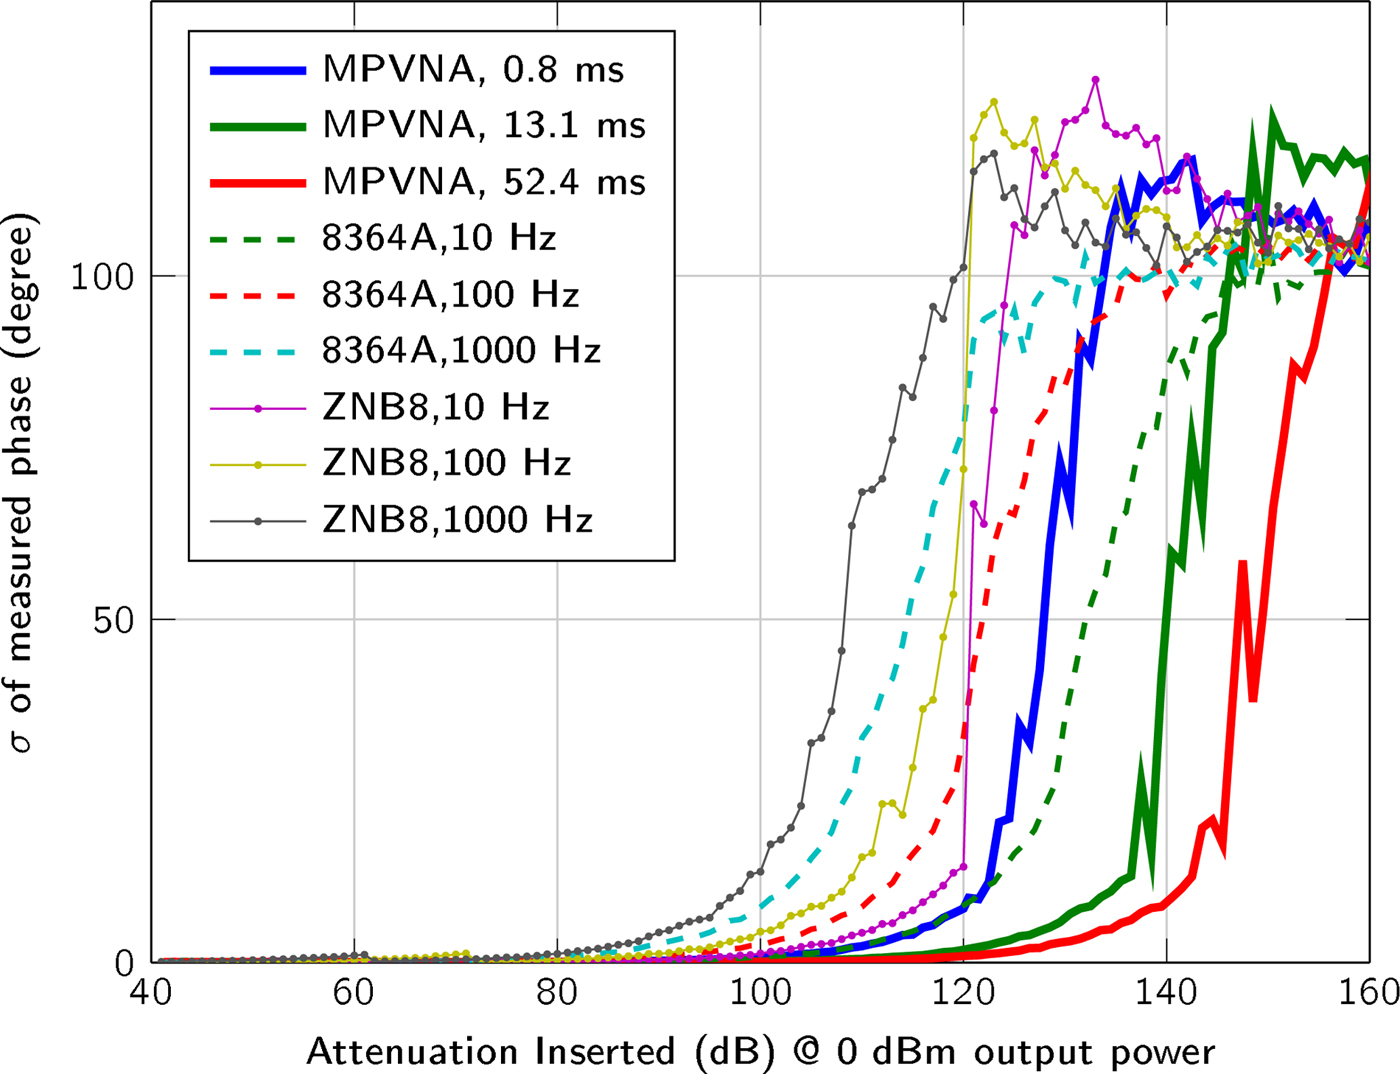
At comparable sensitivities, all investigated systems exhibited standard deviations that can be considered equal. As expected, increasing the measurement time of the MPVNA reduced the standard deviation.
The application envisioned allows the system to be designed to work within a narrow bandwidth around 1 GHz and to capture transmission measurements only. These requirements and the system architecture, which enables multiport measurements without switch matrix, lead to an improved SNR compared to commercially available equipment.
System structure and application
One of the main advantages of the presented system, is the capability of adding ports without performance degradation. Furthermore, this new approach does not require time-multiplexing of the R X-measurements. The MPVNA can measure in parallel, which results in very short total measurement times which are necessary, to prevent distortions from patient movements.
The implemented architecture is structured in sensor nodes, data collection subunits and one master unit, which is connected to a computer, as it is graphically shown in Fig. 7. The data collection subunit is designed to handle up to 16 sensor nodes, but the number of subunits is not limited and can be adapted to fit the application needs. All data collection subunits are connected to the master unit which serves as control for the subunits and sensor nodes and distributes the synchronization signal. It is controlled by the attached computer, which additionally serves as image reconstruction platform.
Block diagram of the modular hardware architecture, including sensor nodes, data collection subunits, a master unit and a computer.
Since full parallelism is guaranteed independently of the number of ports, measurement time remains constant for one transmitter transmitting to an arbitrary number of receivers. The benefit of our architecture in terms of total measurement time is illustrated by an example in Table 1. The total measurement time was estimated by calculating the theoretical measurement time  $t_{\rm {meas}}= {1 \over {\rm RBW}}$ of the VNA in relation to the resolution bandwidth (RBW) used. The use of a switch matrix [Reference Micronics18] for a sequential measurement process was assumed, but the switching time of 5 μs was ignored since it is negligible compared to the measurement time of the VNA. However, the total measurement time of a 200 port measurement using the MPVNA and 0.8 ms measurement time amounts to less than just the omitted switching time of the switch matrix. Potential overhead arising from measurement trigger and control signals is <1 % of the measurement time and, therefore, not considered in the calculation.
Comparison of the total measurement times of a full S-parameter matrix of a conventional VNA with a switch matrix and our MPVNA

The results show that our system clearly outperforms a VNA with switch matrix setup using the described measurement scenario. One reason for this is that the relation between measurement time and number of ports is quadratic in the case of the VNA (in order for all entries of the S-parameter matrix to be considered), whereas it is linear for the MPVNA. For the closest comparable measurement settings (RBW = 1000 Hz and 0.8 ms measurement time), the difference amounts to nearly 10 s for a 100-port measurement. Achieving comparable measurement accuracy means comparing an RBW of 10 Hz to a measurement time of 0.8 ms. This increases the difference in total measurement time to more than 15 minutes, and even to more than an hour for 200 ports.
The improved measurement time for 200 ports was estimated because the prototype spherical measurement chamber comprises 177 ceramic-loaded rectangular waveguide antennas with a dielectric constant of ε′ = 60. Although the first prototype of measurement electronics covers only two data collection subunits and, therefore, the opportunity of measurements with 32 sensor nodes, the platform was prepared to be extended. The first prototype MPVNA can be seen in Fig. 8. It is connected via semirigid RF-cables to a portion of the antennas of the measurement chamber, where an anthropomorphic head phantom (Indexsar IBX-030) was placed, which included a hemorrhagic stroke model. The PCBs are individually shielded, to improve the isolation in between the SMA-ports, such that the leakage signal is lower than the noise floor.
Schematic view of the medical imaging prototype setup. A phantom is placed as SUT inside the measurement chamber, which is equipped with numerous antennas. The MPVNA is connected to the chamber and to a computer (not shown) that controls the hardware and runs a reconstruction algorithm to generate an image of the inside of the phantom.

Measurements, reconstruction and results
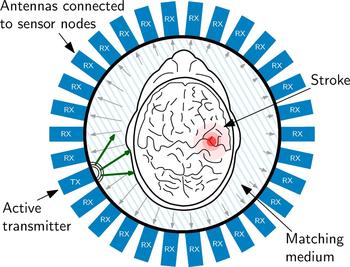
The measurement procedure foresees, that each antenna and sensor node is active as transmitter for the specified measurement time one after the other. During the measurement, the electromagnetic wave is transmitted into the measurement chamber and all other sensor nodes are operating in receiving mode, collecting the phase shifted, and attenuated signals. In the present experiment, 29 receivers are active in parallel. This cycle repeats as long, until all sensor nodes have transmitted. The sensor node configuration of one measurement of the cycle is graphically represented in Fig. 9.
Schematic view of the imaging chamber from the top, the antenna array and the object under test. The transmitted signal is phase-delayed and attenuated according to the SUT placed in the measurement chamber. This characteristic pattern, which is received at all other antenna positions serves as input the reconstruction procedure.
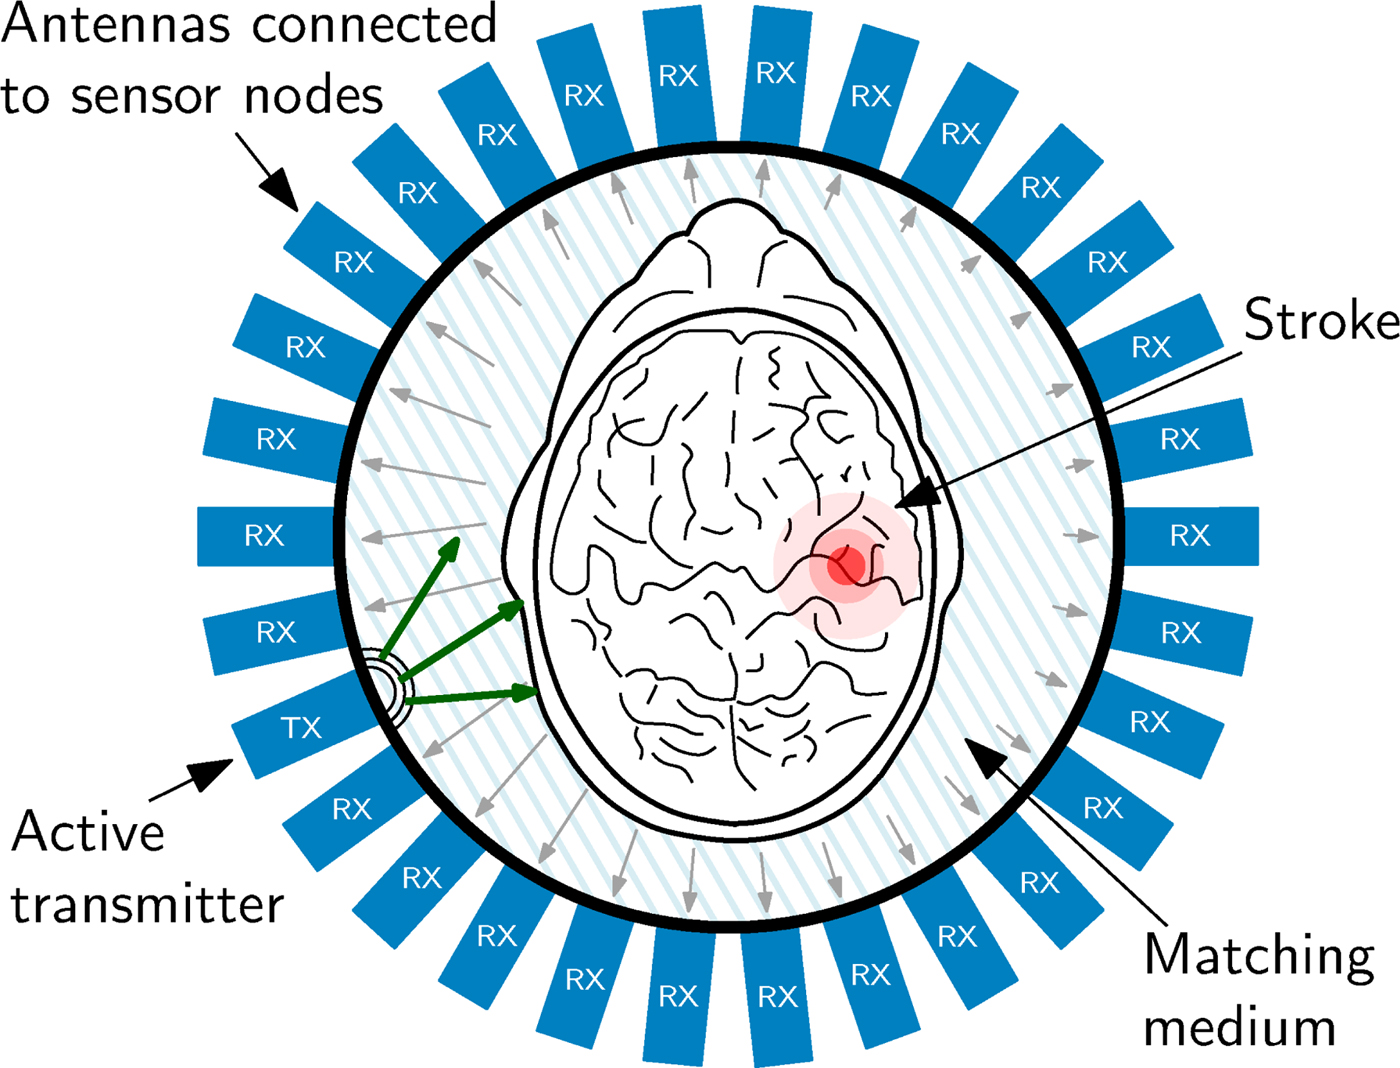
Figure 9 also sketches the effect of the SUT on the electromagnetic wave. The electromagnetic wave propagation depends on the electromagnetic properties of the material of the SUT. The wave is attenuated by the material and scattered by material discontinuities. Therefore, phase and attenuation of the wave sampled at the antennas varies according to the SUT properties. This is sketched in Fig. 9 by the different lengths of the arrows, which symbolize an electromagnetic wave. In order to gain maximum information from the inside of the head, it is of great importance, to match the SUT as carefully as possible to the antennas, because only in this case the maximum of the available signal power can enter the brain. To optimize the transition from the antennas to the phantom in this experiment, the area was filled using a liquid saline solution as matching medium with permittivity ε = 43 + j19, which is close to the values found for skin and brain matter in literature [Reference Mobashsher, Abbosh and Wang11]. It is planned, to use a gel-type matching material for later experiments with volunteers and patients heads.
One measurement process incorporates two measurement cycles, where each of them outputs a complex valued data matrix. One of these measurements is a reference measurement, done with an empty measurement chamber, which means that it was filled with the matching medium only. For the second measurement, the SUT is placed in the chamber. The difference between those two measurements, namely scattered field measurement, serves as input to the image reconstruction algorithm. The procedure of performing a reference measurement of the chamber filled with the matching medium only, also helps to remove systematic errors of the measurement setup.
Based on these results, it is possible to reconstruct the material properties of the SUT using iterative mathematical techniques. During processing, the measured data is compared to the result of a numerical solution. This numerical solution is gained by a simulation of electromagnetic fields, described by Maxwell's equations and solved using the finite-difference time-domain (FDTD) approach. This forward problem describes the measurement setup virtually and usually starts with a test object placed inside the virtual chamber. The simulated electromagnetic field pattern at the antennas, caused by the test object, is compared to the experimental data. Based on this comparison, the structure and dielectric properties of the test object are refined in a next step and, iteratively, the test object converges (in terms of properties) to the real experimental object [Reference Souvorov, Bulyshev, Semenov, Svenson, Nazarov, Sizov and Tatsis19]. In other words, a virtual object is constructed iteratively, which generates the same electromagnetic wave pattern alteration as the physical object. The reconstruction process involves a minimization procedure of a non-linear functional.
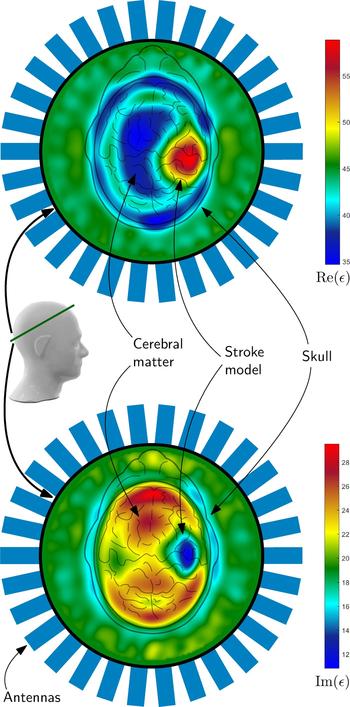
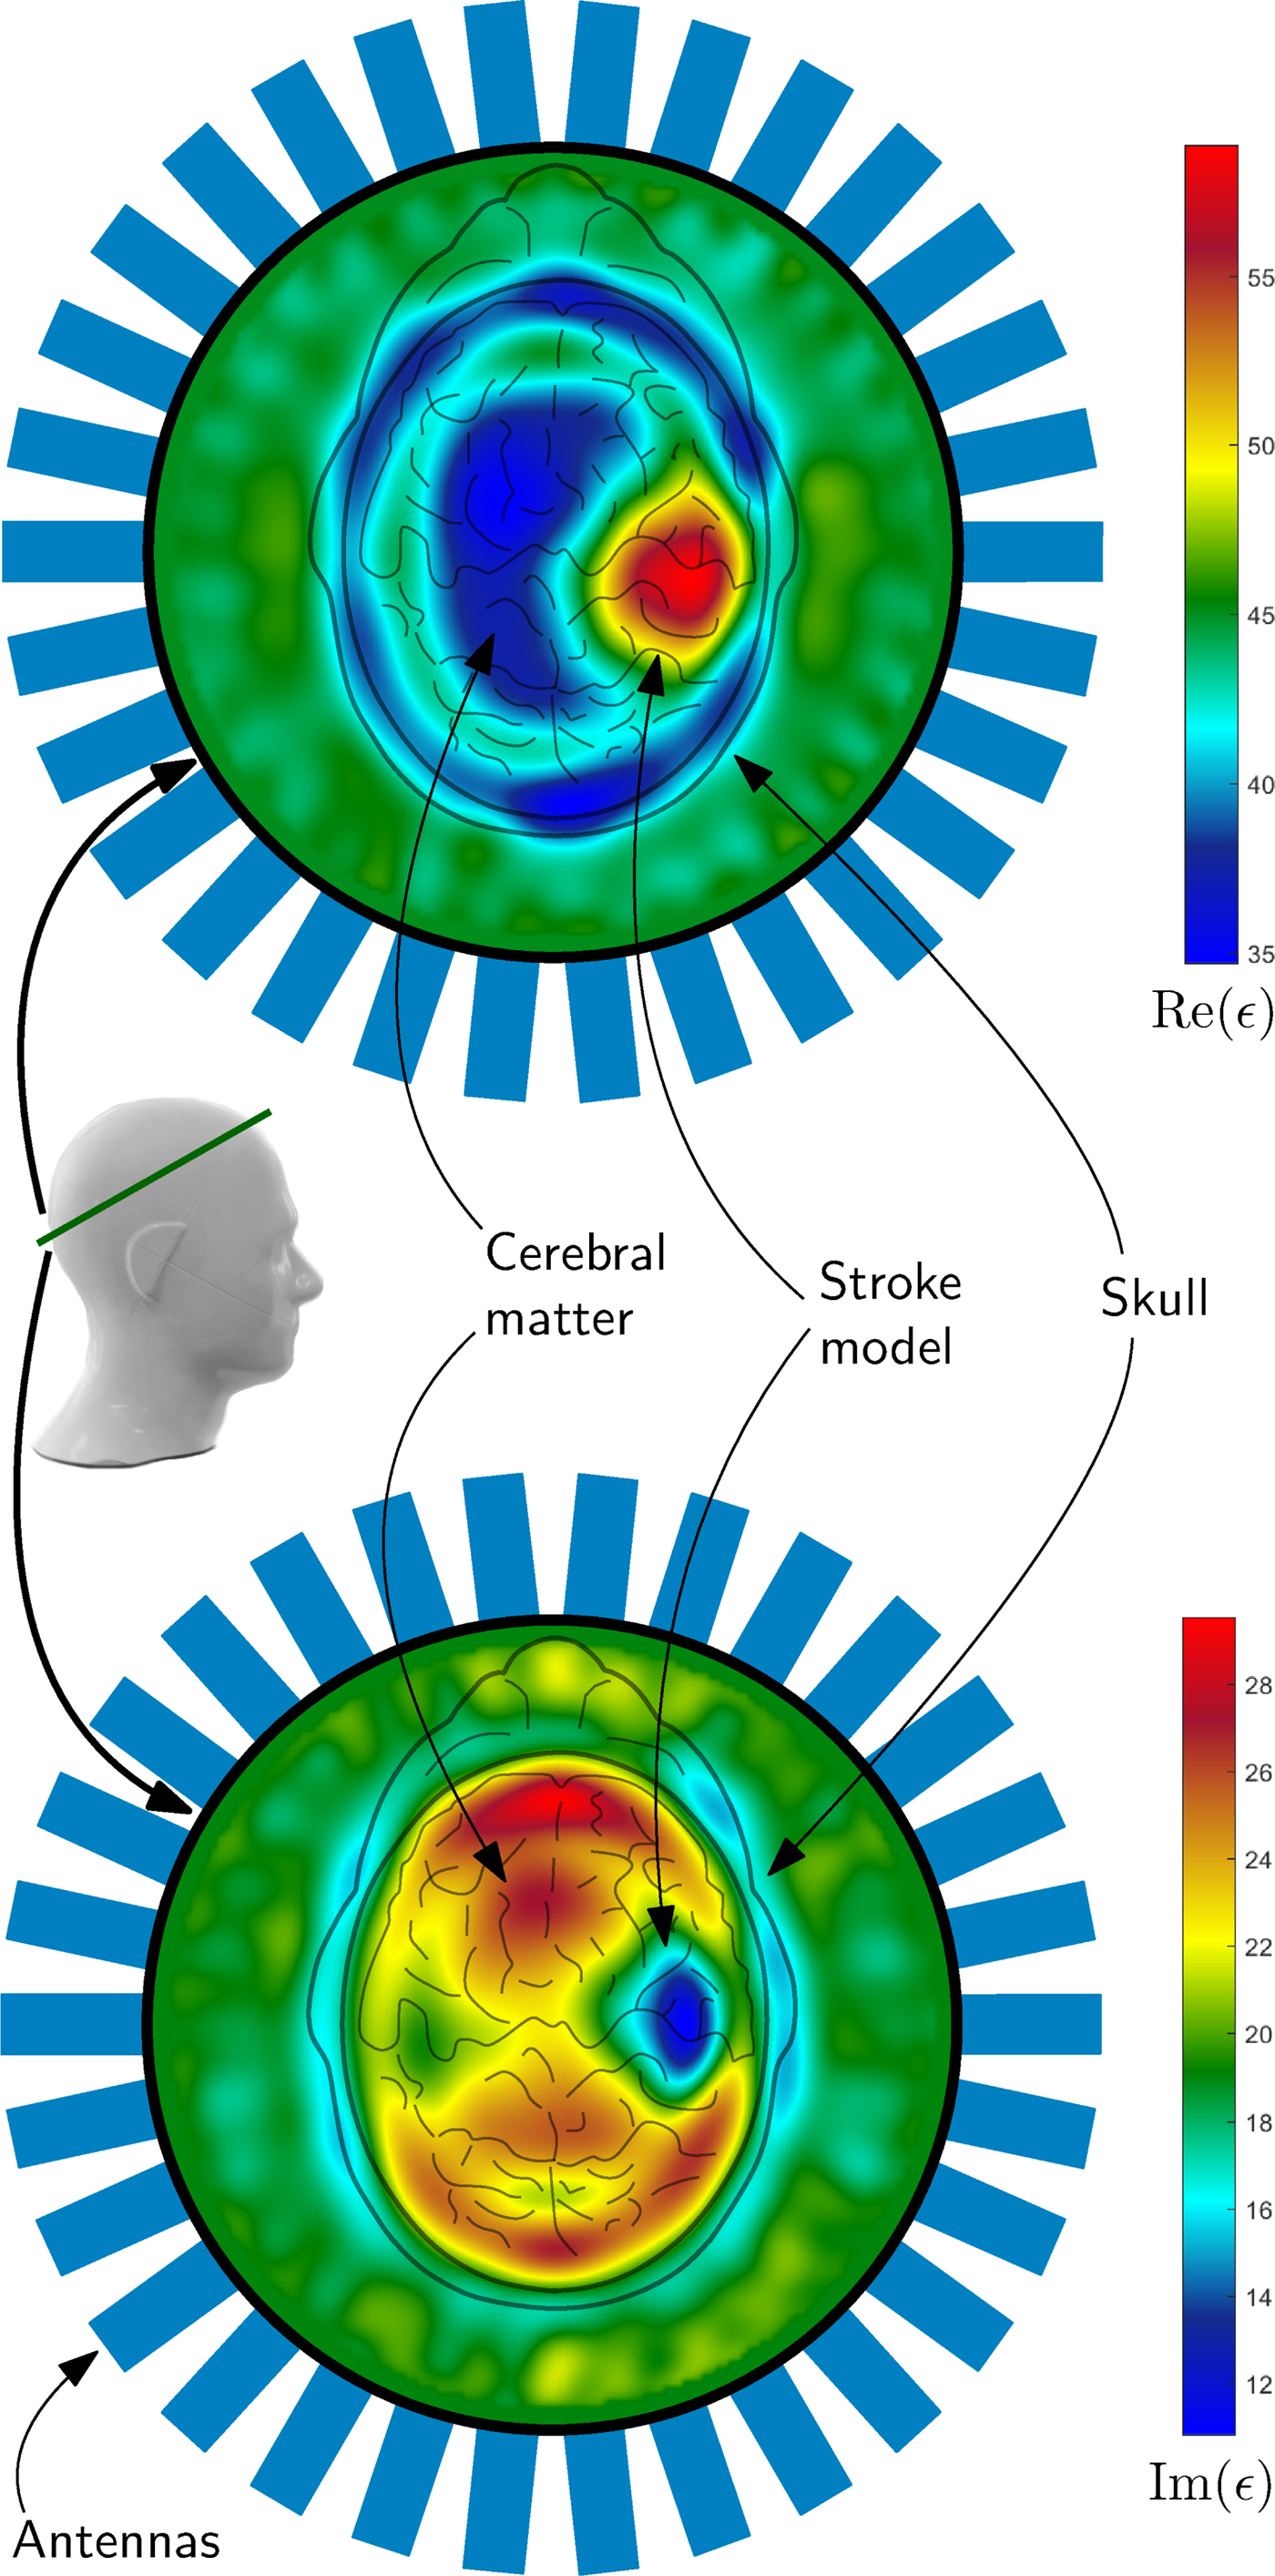
An example of such a reconstruction result can be seen in Fig. 10. The complex valued permittivity is plotted as real part and imaginary part, which takes the conductivity changes in the region of stroke into account. Both plots clearly show the position of the hemorrhagic stroke model, placed on the right side inside the phantom. It can be distinguished between the cerebral matter, the skull and the hemorrhagic stroke model. The permittivity of the matching medium states the correctness of the absolute values of the reconstruction result.
The images show results of the imaging procedure overlayed with the schematic view of the head from above. The 2D-result represent the position of the intersection of the phantom, which is marked with a green line. The reconstructed electromagnetic parameters clearly show the position of the hemorrhagic stroke model as blue (lower image) or red areas (upper image) in the plot. The colors of the plots represent the real (upper plot) and imaginary part (lower plot) of the permittivity. For verification of the correctness of the absolute values, the permittivity of the medium outside the head was measured: ε = 43 + j19.
Conclusion
One of the main characteristics of the presented system is its modular architecture. The concept of parallelization of measurements and data evaluation reduces the total measurement time considerably and has positive effects on the measurement performance. The number of ports which can be used in parallel is literally not limited and can be even more than hundred. The narrow-bandwidth design of the single modules allows optimization of the system parameters for high dynamic range and low variance over multiple measurements. The system is capable of measuring very low power signals - just above thermal noise - with high precision.
The realization as compact device is the preliminary stage before developing a portable device. The presented prototype has proven the concept, and in full extension the system is anticipated to open up new fields of applications due to its compactness. In the presented application of the detection, localization, and classification of stroke, it offers the possibility of shortening the time between the occurrence of stroke, diagnosis, and appropriate treatment. Being noninvasive, it can be used frequently without harm, which additionally enables long-term monitoring of the recovery process. These benefits can help clinicians at the stage of diagnosis and beyond, but it is especially helpful to patients in retaining brain cells and thus has the potential to save lives.
Acknowledgments
This work was supported by the Linz Center of Mechatronics (LCM) within the framework of the Austrian COMET-K2 programme. The authors would like to thank Inras GmbH for providing support for elements of the measurement system.
 Sebastian Poltschak was born in Linz, Austria, in 1988. He received the B.Sc and Dipl.-Ing. (equivalent M.Sc.) degree in Electronics and information Technology from Johannes Kepler University, Linz, Austria, in 2012 and 2014, respectively. He is currently working towards his Ph.D. at the Institute for Communications Engineering and RF-Systems. His research interests are microwave imaging and RF-systems for medical applications.
 Markus Freilinger was born in Rohrbach, Austria, in 1987. He received the Dipl.Ing. (M.Sc.) degree in mechatronics from Johannes Kepler University Linz, Linz, in 2015. From 2015 to 2017 he was working at the Institute for Communications Engineering and RF-Systems, Johannes Kepler University Linz, as Research Assistant. He is currently working at the Engineering Center Steyr, member of the Magna Group.
 Reinhard Feger was born in Kufstein, Austria, in 1980. He received the Dipl.-Ing. (M.Sc.) degree in mechatronics and Dr. techn. (Ph.D.) degree in mechatronics from Johannes Kepler University Linz, Linz, Austria, in 2005 and 2010, respectively. In 2005, he joined the Institute for Communications and Information Engineering, Johannes Kepler University Linz, as a Research Assistant. In 2007, he became a member of the Christian Doppler Laboratory for Integrated Radar Sensors, Johannes Kepler University Linz. He is currently an Assistant Professor with the Institute for Communications Engineering and RF-Systems, Johannes Kepler University Linz. His research topics are radar signal processing, as well as radar system design for industrial and automotive radar sensors.
 Andreas Stelzer received the Diploma Engineer degree in electrical engineering from the Technical University of Vienna, Vienna, Austria, in 1994, and the Dr. techn. degree (Ph.D.) in mechatronics (with honors sub auspiciis praesidentis rei publicae) from the Johannes Kepler University Linz, Austria, in 2000. In 2003, he became Associate Professor with the Institute for Communications Engineering and RF Systems, Johannes Kepler University Linz. Since 2008, he has been a key researcher for the Austrian Center of Competence in Mechatronics (ACCM), where he is responsible for numerous industrial projects. In 2007 he was granted a Christian Doppler Research Laboratory for Integrated Radar Sensors and since 2011 he is full Professor at the Johannes Kepler University Linz, heading the Department for RF-Systems. He has authored or coauthored over 360 journal, conference and workshop contributions. His research is focused on microwave sensor systems for industrial and automotive applications, integrated radar sensor concepts, SiGe based circuit design, microwave packaging in eWLB, RF and microwave subsystems, surface acoustic wave (SAW) sensor systems and applications, as well as digital signal processing for sensor signal evaluation. Dr. Stelzer is a member of the Austrian ÖVE. He has served as an associate editor for the IEEE MICROWAVE AND WIRELESS COMPONENTS LETTERS. Currently he serves as Chair for MTT-27 Wireless-Enabled Automotive and Vehicular Applications. He was recipient of several awards including the 2008 IEEE Microwave Theory and Techniques Society (IEEE MTT-S) Outstanding Young Engineer Award and the 2011 IEEE Microwave Prize. Furthermore, he was recipient of the 2012 European Conference on Antennas and Propagation (EuCAP) Best Measurement Paper Prize, the 2012 Asia Pacific Conference on Antennas and Propagation (APCAP) Best Paper Award, the 2011 German Microwave Conference (GeMiC) Best Paper Award, as well as the EEEfCOM Innovation Award and the European Microwave Association (EuMA) Radar Prize of the European Radar Conference (EuRAD) 2003. He is a member of the IEEE MTT, IM, and CAS Societies and he served as IEEE Distinguished Microwave Lecturer for the period 2014 to 2016.
 Abouzar Hamidipour received the B.Sc. degree from the Iran University of Science and Technology, Tehran, Iran in 2004, the M.Sc. degree from the Sahand University of Technology, Tabriz, Iran, in 2007, and the Ph.D. degree from Johannes Kepler University Linz, Austria in 2014, all in electrical engineering. Since 2014, he is with EMTensor GmbH, Vienna, Austria, where he is pursuing his research on microwave imaging for biomedical applications. His research interests include design and implementation of RFICs and antennas for biomedical and millimeter-wave applications.
 Tommy Henriksson received the M.Sc. degree in electrical engineering and the Licentiate of Engineering degree in electronics in 2003 and 2007, respectively, from Mälardalen University, Västerås, Sweden. He received a joint French-Swedish Ph.D. degree in physics and electrical engineering from the Université Paris-Sud 11, Paris, France, and Mälardalen University in 2009. He investigated noniterative algorithms for eddy-current nondestructive testing of conductive materials, with the Department of Electromagnetic Research, Laboratoire des Signaux et Systèmes, Gif-sur-Yvette, France, in 2010. From 2011 to March 2016, he was a Postdoctoral researcher with the University of Bristol, UK As a member of the microwave imaging team his work focuses on UWB time-domain microwave imaging techniques for solving the inverse scattering problem in medical microwave imaging. Since April 2016, he is working at EMTensor GmbH, Vienna, Austria. His research interests include microwave tomography and radar based imaging for biomedical and industrial applications, electromagnetic interaction of biological tissues, microwave imaging system development and calibration.
 Markus Hopfer was born in Graz, Austria. He received his Ph.D. degree in physics from the University of Graz, Graz, Austria, in 2014. From 2012 to 2015 he was research assistant at the University of Graz, department of theoretical physics, Graz, Austria. Since 2015, he is working at EMTensor GmbH, Vienna, Austria, on image reconstruction and software parallelization. His research interests involve electromagnetic tomographic imaging, algorithm design and high performance computing.
 Ramon Planas was born in Barcelona, Spain. He received his Ph.D. degree in Civil Engineering from the Universitat Politècnica de Catalunya (UPC), Barcelona, Spain, in November 2013. From 2009 to 2014, he was researcher at Centre Internacional de Mètodes Numèrics en l'Enginyeria (CIMNE). Since January 2015, he is working at EMTensor GmbH, Vienna, Austria, on numerical methods for electromagnetic image reconstruction. His research focuses on algorithm design and implementation with special interest in parallelization and high performance computing (HPC).
 Serguei Semenov received the Ph.D. degree in biophysics and radiobiology from the Moscow Biophysical Institute, Moscow, Russia, in 1985. Since 1999, he has been a Professor of physics. In 1990–1994, he was the Director of the Laboratory of Biophysics, Kurchatov Institute of Atomic Energy, Moscow, Russia. In 1994–2005, he was the Director of the Biophysical Laboratory at Carolinas Medical Center, Charlotte, NC, USA. Since 2006, he has a chair in imaging at Keele University, Stoke on Trent, Staffordshire, UK. Since 2012, he is CEO and CTO of EMTensor GmbH, Vienna, Austria. His research interests are EM radiation interaction with biological tissues, biophysics of cardiac excited tissues and tissue malignancies, nonionizing radiation imaging, and tomography.