
The process of td-deletion affects the coronal stops /t, d/ when they occur word-finally following another consonant, for example, in phrases such as best man are realized as bes’ man. The process is possibly the most frequently investigated variable in variationist linguistics (e.g., Fasold, Reference Fasold1972; Guy, Reference Guy and Labov1980, Reference Guy1991a, Reference Guy1991b; Hazen, Reference Hazen2011; Labov & Cohen, Reference Labov and Cohen1967; Raymond, Brown, & Healy, Reference Raymond, Brown and Healy2016; Tagliamonte & Temple, Reference Tagliamonte and Temple2005; Temple, Reference Temple, Jones and Payne2009; Walker Reference Walker2012; Wolfram, Reference Wolfram1969).
The linguistic conditioning of td-deletion is widely reported, with many studies of relatively independent varieties finding similar effects of preceding and following segment, and morphological class. The latter of these variables is arguably the most controversial and has been subject to much debate in the existing literature. Studies of American English consistently report that there is more deletion in monomorphemes, such as mist, than in regular past tense forms, such as missed. This effect, however, has not been reported for British English (Sonderegger et al. Reference Sonderegger, Beltrama, Chatzikonstantinou, Franklin, Kirken, Lee, Nelson, Nicoletto, Penslar, Provenza, Rothfels, Bane, Graff and Riggle2011; Tagliamonte & Temple, Reference Tagliamonte and Temple2005). The present paper revisits the question of the role of morphological class in a large-scale investigation of Manchester English, consisting of almost 20,000 tokens from 93 speakers, representing the entire socioeconomic spectrum of the city. We employ advanced methods of coding and analysis, including forced-alignment, mixed-effects logistic regression, and improved measures of word frequency.
PREVIOUS STUDIES
td-deletion is said to be a stable variable, and studies have, for the most part, failed to find any evidence of change in progress. Social factors do play some role, but this varies from study to study. Males have shown higher rates of deletion in some studies, although this effect is rather small (Tagliamonte & Temple, Reference Tagliamonte and Temple2005; Wolfram, Reference Wolfram1969). Unsurprisingly, deletion is less likely in formal speech and elicitations (Labov & Cohen, Reference Labov and Cohen1967; Wolfram, Reference Wolfram1969). Although many of the earliest studies of td-deletion focused on African-American Vernacular English (henceforth AAVE; Fasold, Reference Fasold1972; Labov, Reference Labov1972; Labov & Cohen, Reference Labov and Cohen1967; Wolfram, Reference Wolfram1969), Tejano and Chicano English (Bayley, Reference Bayley1994; Santa Ana, Reference Santa Ana1996), and Jamaican Creole (Patrick, Reference Patrick1991), ethnicity is rarely studied as an independent variable in td-deletion (although this is reported as a significant factor in Appalachian English [Hazen, Reference Hazen2011]). Generally, AAVE is reported as having higher rates of deletion (particularly prevocalically), which may have an effect on the resulting underlying representation posited by children. This is evidenced in certain plural forms; for example, tests can be realized [tesɪz], whereby the underlying representation must be /tes/, and AAVE speakers may add on the plural suffix [ɪz], as one does after a final sibilant.Footnote 1 Ethnicity has not yet been studied as an independent variable in British English.
Preceding segment is consistently reported as a significant effect in studies of td-deletion. Labov (Reference Labov1989) reported the following hierarchy from most to least deletion: /s/ > stops > nasals > other fricatives > liquids. Other studies have appealed to the sonority hierarchy as an explanatory factor, with more sonorous preceding segments invoking less deletion (Patrick, Reference Patrick1991; Santa Ana, Reference Santa Ana1996; Tagliamonte & Temple, Reference Tagliamonte and Temple2005). Guy and Boberg (Reference Guy and Boberg1997) took a more holistic approach, arguing that preceding segment is subject to the Obligatory Contour Principle (OCP): adjacent segments that share many phonological properties with one another (place/manner of articulation, sonority, voicing) are dispreferred. This would explain why preceding sibilants result in high rates of td-deletion, because, even though they are more sonorous than plosives such as /p, k/, they share the same place of articulation as /t, d/. Temple (Reference Temple, Jones and Payne2009) pointed out the high rates of deletion with a preceding /n/ and /s/, which is likely due to the homorganic place of articulation with the following /t, d/.There is a further complication in British English varieties of preceding sonorants in that glottal replacement is also a potential variant of /t/ in words such as aunt and felt. Tagliamonte and Temple (Reference Tagliamonte and Temple2005) suggested that this should be counted as instances of retention rather than deletion of /t/; such tokens account for 10% of their data. Temple (Reference Temple2013) further noted that the majority of preconsonantal /nt/ clusters in the York data are glottalized, which is responsible for the low rates of deletion observed in postsonorant position in comparison to American varieties.
The effect of following segment shows a resounding consistency across studies with following consonants always promoting higher rates of deletion than following vowels or pause. One well-known reported difference lies in the rates of deletion between following vowel and pause. The majority of varieties show most deletion before a following pause, but Philadelphia (Guy, Reference Guy and Labov1980; Tamminga, Reference Tamminga2016) and Chicano English (Santa Ana, Reference Santa Ana1996) show higher rates before a following vowel. Many studies attempt a more fine-grained analysis of following segment, which usually follows the hierarchy of stops > fricatives > liquids > glides > vowels. Tamminga (Reference Tamminga2018) found that the following segment effect is weaker across strong syntactic boundaries, which she argued is evidence of production planning. She reported that the widely observed deletion-inhibiting effect of a following vowel is weakened across stronger syntactic boundaries, whereas following consonant shows stable effects across different boundary types. Tanner, Sonderegger & Wagner (Reference Tanner, Sonderegger and Wagner2017) also considered factors related to production planning, such as boundary strength, arguing that following pause length can be used as a proxy for a stronger prosodic boundary.
The voicing of the segment is investigated as hetero- versus homovoicing clusters in many studies, and as /t/ vs. /d/ in others. Labov (Reference Labov1989) reported more deletion in homovoiced clusters, that is, hand over aunt. In an update to her 2009 study, Temple (Reference Temple2013) found different effects of preceding consonant and morphological class when /t/-final and /d/-final tokens were analyzed separately. In particular, /n/ showed the lowest rates of deletion with /t/ (3%) and the highest rates with /d/ (32%). More recent studies have argued against the more abstract interpretation of homorganic clusters being treated as the same variable and for an analysis that involves /t/ and /d/ being treated as separate variables (Amos, Kasstan, & Johnson, Reference Amos, Kasstan and Johnson2018).
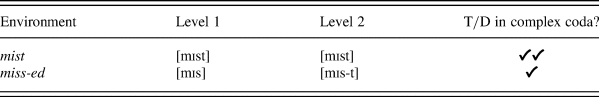
One of the most robust linguistic factors reported for American English is the effect of morphological class (Guy, Reference Guy and Labov1980, Reference Guy1991a, Reference Guy1991b; Wolfram, Reference Wolfram1969). As mentioned, monomorphemic words such as mist are found to delete at higher rates than regular past tense forms such as missed. So-called semi-weak forms, in which the word exhibits both a regular (or weak) past tense t/d and an irregular (or strong) past tense vowel change, such as kept, told, are usually found to have in-between rates of deletion. It is possible that the semi-weak category is not truly an in-between category; Guy and Boyd (Reference Guy and Boyd1990) found an effect of age-grading, in that children analyze such forms as monomorphemic, but adults analyze them as bimorphemic, and the intermediate rate is simply the average of the two groups. In a different approach, Fruehwald (Reference Fruehwald2012) argued for a reinterpretation of semi-weaks as having two underlying representations: with and without td, for example, /kep/ and /kept/ as two competing underlying forms of kept. Underlying /kep/ will clearly surface as 100% deletion, but /kept/ will surface at a past tense rate, hence the intermediate effect. Guy's (Reference Guy1991a, Reference Guy1991b) further work on td-deletion in Philadelphia proposed that monomorphemes such as mist show the highest frequency of rule application because the conditions of td-deletion are met at more levels of the derivation (see Table 1).Footnote 2 Under his cyclic model, Guy (Reference Guy1991a) assumed that rates of application are the same at each level of the derivation. More recently, Turton (Reference Turton2016) revisited this idea and argued that equal rates of application at different levels is not what we would expect considering the diachronic progression of phonological rules. Given the evidence that phonological processes become more integrated with grammatical structure as they age (e.g., Bermúdez-Otero & Trousdale, Reference Bermúdez-Otero, Trousdale, Nevalainen and Traugott2012), we would expect higher, more embedded levels (e.g., Level 1 in Table 1) to show lower rates of application than lower levels (e.g., Level 2 in Table 1), as the process has been active at the lower levels for more time.
Derivation of t/d-deletion, based on Guy (Reference Guy1991a, Reference Guy1991b), taken from Turton (Reference Turton2016)
Tamminga (Reference Tamminga2016) provided further support for the role of the higher organization of the grammar in her study of psycholinguistic effects of persistence, or priming. Working on the premise that one of the most powerful influences in a speaker's choice of variant is likely to be the last option the speaker used, Tamminga found an interesting result: the persistence effect only works for tokens of the kind. Thus, missed can prime laughed, but mist would never prime missed.
Intriguingly, this effect of morphological class found robustly in American English has been argued to be absent in British English. The largest and most systematic study of td-deletion in a variety of British English to date has been Tagliamonte and Temple's (Reference Tagliamonte and Temple2005) exploration of York English. It was based on 1,232 tokens from 38 speakers, with the first 20 tokens from each morphological class and up to three tokens of each lexical word per speaker collected. Their fixed-effects regression analysis showed that, in contrast to previous studies of American English, morphological class did not have a significant effect on the rate of td-deletion. Tagliamonte and Temple suggested that, since the strong prediction of Guy's (Reference Guy1991a, Reference Guy1991b) exponential model is that there should be no cross-dialectal variation in td-deletion in terms of morphological class, that is, monomorphemes versus regular past tense forms, their results from York English “call into question the universality of the morpho-phonological effect and have led [them] to reconsider the possibility that the conditioning of the rule is primarily phonetic/phonological” (p. 282). In other words, the different rates of td-deletion in different morphological categories are not due to higher-level organization of the grammar, that is, morphology, but rather are due to articulatory effects and the influence of the phonological environment.
This idea is explored further in Temple (Reference Temple, Jones and Payne2009), who focused on the role of preceding segment in the same dataset as in Tagliamonte and Temple (Reference Tagliamonte and Temple2005) discussed above. Temple noted that monomorphemic words tend to have a higher proportion of preceding /n/ and /s/, which strongly favor td-deletion, than regular past tense forms, and suggests that the apparent morphological effect noted in previous studies is an artifact of the distribution of favoring and disfavoring phonological contexts across the different morphological categories (p. 150). Interestingly, further studies of td-deletion in British English have failed to find a significant effect of morphological class once other factors, such as phonological environment, were taken into account. For example, Sonderegger et al. (Reference Sonderegger, Beltrama, Chatzikonstantinou, Franklin, Kirken, Lee, Nelson, Nicoletto, Penslar, Provenza, Rothfels, Bane, Graff and Riggle2011) investigated the speech of ten reality TV show contestants (five of whom were from England) on the basis of 5,118 tokens. A small effect of morphological class disappeared once preceding segment was accounted for in the mixed-effects models. In their follow-up study of a larger version of the same dataset, Tanner, Sonderegger & Wagner (Reference Tanner, Sonderegger and Wagner2017) reported the same effect: a small difference in the expected direction that fails to reach statistical significance.
Temple (Reference Temple, Jones and Payne2009, Reference Temple2013, Reference Temple, Celata and Calamai2014) has more recently argued for the consideration of gradient phonetic factors surrounding td-deletion and connected speech processes, alongside the phonological categorical effects. Articulatory studies, such as Browman and Goldstein (Reference Browman, Goldstein, Kingston and Beckman1990), have previously discussed incomplete instances of td-deletion, where the tongue tip gesture is obscured. In fact, Purse and Turk (Reference Purse and Turk2016) argued that, at least for their Electro-Magnetic Articulography (EMA) data of Scottish and Southern British English speakers, articulatorily categorical deletion is rare (see also Purse, Reference Purse2019).Footnote 3 This is in contrast to Lichtman's (Reference Lichtman2010) study of US English (EMA and Microbeam), which finds that all speakers show categorical deletion of some kind.
In their instrumental study of td-deletion in the Audio British National Corpus (BNC), Renwick, Baghai-Ravary, Temple, and Coleman (Reference Renwick, Baghai-Ravary, Temple and Coleman2014) measured deletion in terms of intensity, a gradient measure, with higher intensity indicating more td-deletion. They concluded that the variation in their dataset of 2,036 tokens of td is best explained by the voicing of the cluster and the lexical frequency of the word, and they argue that their results provide little support for the role of morphological class, as predicted by Guy's (Reference Guy1991a, Reference Guy1991b) model. A potential drawback of this technique is whether intensity measures are a reliable acoustic correlate of deletion, particularly on a corpus with varying levels of sound quality such as the Audio BNC.
Another study looking at lexical frequency as an explanatory factor in td-deletion is Guy, Hay, and Walker (Reference Guy, Hay and Walker2008), who argued that lexical frequency can account for most of the variation in their New Zealand data. However, one potential methodological problem is that they used frequency measures derived from their dataset, which has been shown to be statistically problematic in the event of lack of accurate measures for low frequency words (see Fruehwald [Reference Fruehwald2017] and the discussion below). Walker (Reference Walker2012) revisited the issue of the role of lexical frequency in td-deletion through examination of four different corpus methods (including dataset measures) for deriving frequency measures and concluded that frequency measured externally has no significant effect on the process. Similarly, in a recent study of td-deletion in the Buckeye corpus, Kul (Reference Kul2018) reported no significant effect of lexical frequency based on SUBTLEX-US. In any case, it is clear that highly frequent words such as and, just, and went tend to show much higher rates of deletion, but whether a linear trend between lexical frequency and rates of deletion exists is questionable).
METHODOLOGY
The data in this study comes from the speech of 93 informants, aged 8–85, who grew up in ManchesterFootnote 4 and whose parents were also local to the area. Of the speakers, 64 identify themselves as White British, 17 as Pakistani, and 12 as Black Caribbean Mancunians. The sample represents the socioeconomic spectrum of the city, with five socioeconomic levels based on occupation: lower working, upper working, lower-middle, middle-middle, and upper-middle. The informants’ speech was recorded during sociolinguistic interviews (Labov, Reference Labov1981; Tagliamonte, Reference Tagliamonte2006), supplemented with word list reading and minimal pair tests for a number of vocalic and consonantal contrasts. The interviews were transcribed orthographically in ELAN and then were time-aligned with the speech signal using the Force-Alignment Vowel Extraction Suite (Rosenfelder Fruehwald, Evanini, Seyfarth, Gorman, Prichard, & Yuan, Reference Rosenfelder, Fruehwald, Evanini, Seyfarth, Gorman, Prichard and Yuan2014;) developed at the University of Pennsylvania; the FAVE Suite also provided automatic phonemic transcription based on the Carnegie Mellon University dictionary. Although originally created for American English varieties, FAVE has been shown to work with more than sufficient accuracy for British varieties (MacKenzie & Turton, Reference MacKenzie and Turton2013, Reference MacKenzie and Turton2020).
The Handcoder script (Fruehwald & Tamminga, Reference Fruehwald and Tamminga2015) in Praat was used to locate every token of the variable, play it for the analyst, and automate the recording of the coding decisions. The data were coded auditorily by two local students: they coded the realization of the dependent variable and the morphological class of the word, whereas the Handcoder script saved information on the phonological environment, voicing, and timing automatically from the time-aligned phonemic transcription. The use of these methods resulted in a considerable timesaving in comparison with more traditional methods used by previous studies in that the coding of one interview ranged from 10–30 minutes, depending on its duration, as opposed to many hours. Another major advantage of this methodology is that no tokens of the variable were missed by the analyst, even those occurring in fast speech. The tokens selected by the Handcoder script were occurrences of word-final /t, d/ preceded by a consonant, excluding tokens where the following word began with /t/ or /d/, and excluding the word and. This resulted in 19,371 tokens of /t, d/. We follow many previous studies in treating the deletion of /t/ and /d/ as part of the same variable process. At the same time, we acknowledge that the approach taken by some recent studies to treat them separately may offer further insights (e.g., Amos, Kasstan, & Johnson, Reference Amos, Kasstan and Johnson2018).
In terms of exclusions, many studies exclude went or code it separately from other past tense forms (Tagliamonte & Temple, Reference Tagliamonte and Temple2005; Walker, Reference Walker2012), but here we use a mixed-effects model with word as a random effect (although see below for exclusions at the statistical analysis stage). Following /j/ was originally included (e.g., last year), but removed in the analysis stage when it became apparent that distinguishing between deletion and palatalization was unreliable. A following /h/ was also omitted, because it is based on orthography only and not on actual pronunciation. As a variety of British English, the Manchester accent exhibits h-dropping in words like house, help around 30% of the time (Baranowski & Turton, Reference Baranowski, Turton and Hickey2015), so we cannot know for sure whether these following /h/s are actually following vowels without revisiting the data and recoding them.Footnote 5
Although the tokens have been coded and form part of the larger dataset, we have taken the nontrivial decision to exclude /nt/ and /lt/ clusters from our statistical models, based on the complicating factor of possible glottalization of /t/ in this position in British English discussed above. In fact, these clusters are glottaled 82% of the time in our dataset, with glottaling seemingly blocking deletion for the youngest generation. This results in an overall figure of 98% retention in these clusters. We suggest that /nt/ and /lt/ clusters are potentially outside of the envelope of variation for deletion for young Mancunians today. This includes all instances of negation, for example, can't, won't.
The dependent variable is coded categorically as either [t, d] present or absent, that is, deleted. Other variants of /t, d/, such as glottal stop replacement, are classed as present, as are other lenited variants. Although the discussion of categoricity versus gradience with respect to td-deletion referred to in our review of previous research is of great interest, the present study is based on auditory coding of deletion, and thus takes a purely binary approach from the perspective the presence or absence of td, as opposed to using instrumental measures, such as tongue tip raising or intensity. While we acknowledge that not all tokens may reflect a complete lack of tongue tip contact, we also argue that phonological processes show levels of lenition trajectories, and, just because a variant does not show a complete lack of tongue tip gesture, this does not mean that a reduced variant is not the result of a categorical phonological process. Furthermore, the existence of gradience does not entail the absence of categoricity, as has been discussed in detail for td-deletion specifically (Bermúdez-Otero, Reference Bermúdez-Otero2010; Myers, Reference Myers1995).
The independent linguistic variables include preceding and following segment, morphological class (monomorphemic, semi-weak, regular past tense), voicing, and word frequency operationalized as a centered Zipf-scaled whole-word frequency from the SUBTLEX-UK corpus (van Heuven, Mandera, Keuleers, & Brysbaert, Reference van Heuven, Mandera, Keuleers and Brysbaert2014).Footnote 6 This corpus contains 201.3 million words based on film and TV subtitles from BBC broadcasts and has been found to offer an improved measure of word frequency by work in psychology on processing times (Brysbaert & New, Reference Brysbaert and New2009). Due to its correlation with human behavioral measures, as well as its size, SUBTLEX is becoming the choice of corpus for many recent studies in linguistics (Bailey, Reference Bailey2019; Gorman, Reference Gorman2013; Kul, Reference Kul2018; MacKenzie, Reference MacKenzie2017; Nelson & Wedel, Reference Nelson and Wedel2017; Schleef & Turton, Reference Schleef and Turton2018; Seyfarth, Garellek, Gillingham, Ackerman, & Malouf, Reference Seyfarth, Garellek, Gillingham, Ackerman and Malouf2018; Tamminga, Reference Tamminga2016, Reference Tamminga2018). Although critics may claim that subtitles are not representative of real speech, note that commonly used corpora such as CELEX, Brown, or COCA are based on written English and can be outdated in terms of lexical exhaustiveness, resulting in many words having a zero frequency (CELEX does not include the word ‘internet’). Spoken corpora such as the one-million-word spoken component of the BNC (or the newer 11.5 million version) or even local corpus frequency may seem like a better choice, but, because the rates are relatively small, this may cause problems in terms of statistical representativeness and can result in erroneous predictions in statistical models (typically Type I errors). As an example, the word duellist appears twice in SUBTLEX, giving a relative rate of occurrence at around 0.01 per one million words. If this same word were to appear just once in a corpus of one million words, it would be at a relative rate of two tokens per one million, which is 100 times that of the SUBTLEX measure. The statistical upshot of this is demonstrated by Fruehwald (Reference Fruehwald2017), and means that the corpus of choice when investigating word frequency effects must be the one with the best low frequency word estimates, for which SUBTLEX is currently unparalleled.
The external factors tested for include age (continuous between eight and 85), gender (male, female), social class operationalized in terms of five occupational levels,Footnote 7 ethnicity (Black Caribbean, Pakistani, and White British), and style (narratives of personal experience, careful speech, commentary on language, minimal pairs, and word list reading); speaker and word are entered as random effects.
The fully coded dataset of 19,371 tokens of /t, d/ is reduced to 13,825 when excluding the contexts listed above, and restricting the dataset to spontaneous speech (i.e., excluding tokens elicited by word list reading and minimal-pair tests). Graphs are visualized using ggplot2 (Wickham, Reference Wickham2009), and rates of deletion are summarized over speaker and word, to avoid speakers or words that have higher number of tokens than others being more influential in the graphs.
Model Selection
We ran generalized mixed-effects models in R, using the lme4 package (Bates, Mächler, Bolker, & Walker, Reference Bates, Mächler, Bolker and Walker2015) with the bobyqa optimizer. In model selection, we follow Barr, Levy, Scheppers, and Tily (Reference Barr, Levy, Scheepers and Tily2013) in testing our random effects structure, that is, starting off by including the maximal random effects structure as justified by the experimental design and reducing where appropriate. Thus, the most complex model we tested included by-speaker random slopes for morphological class and following segment, two effects which have been shown to vary across varieties and, thus, could potentially vary across speakers. We did not include these as an interaction, as this did not seem appropriate considering the previous literature and our hypotheses. The model was first reduced by uncorrelating the intercept and slope, secondly trying each morphological class and following segment alone (correlated and uncorrelated), and then intercept only (i.e., no slope for speaker) until we found a model that converged. The afex package (Singmann, Bolker, Westfall, & Aust, Reference Singmann, Bolker, Westfall and Aust2016) in R was used to assist us in running likelihood ratio tests between nested models. Our final converging model was an intercept-only model for speaker, which is not unexpected given that there is little interspeaker variation in this dataset: note the standard deviation of speaker is lower than word, when we might expect it to be the other way around for many other sociolinguistic variables.
RESULTS
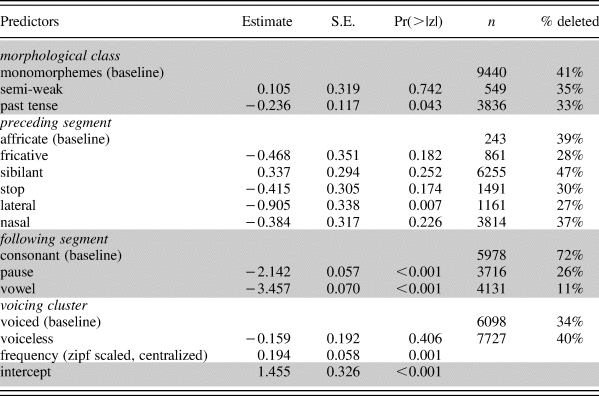
The primary predictors of td-deletion in Manchester, as determined by the best statistical model (Table 2) are the linguistic factors of morphological class, and preceding and following segment. In the following sections, we will address each of these factors in turn, before discussing the external factors, most of which do not achieve statistical significance: speaker gender, social class, ethnicity, and age, as well as the factor of word frequency.
GLMM for best model, including number of tokens for each predictor and rates of deletion for factor levels. Positive numbers reflect more deletion, negative numbers more retention. Random effects of word (sd = 0.68) and speaker (sd = 0.50). AIC = 12480
As mentioned in the methodology, the rates of application in Table 2, as well as the figures below, reflect percentages that have been averaged over speaker and word. In using a mixed-effects model, analysis was not restricted to just a few tokens per speaker per word, as in papers such as Tagliamonte and Temple (Reference Tagliamonte and Temple2005). However, this means that researchers must take caution when presenting and visualizing their results, as averaging over the entire dataset as a whole does not take into consideration influential speakers who may have many more tokens, or highly frequent influential words.
Following segment
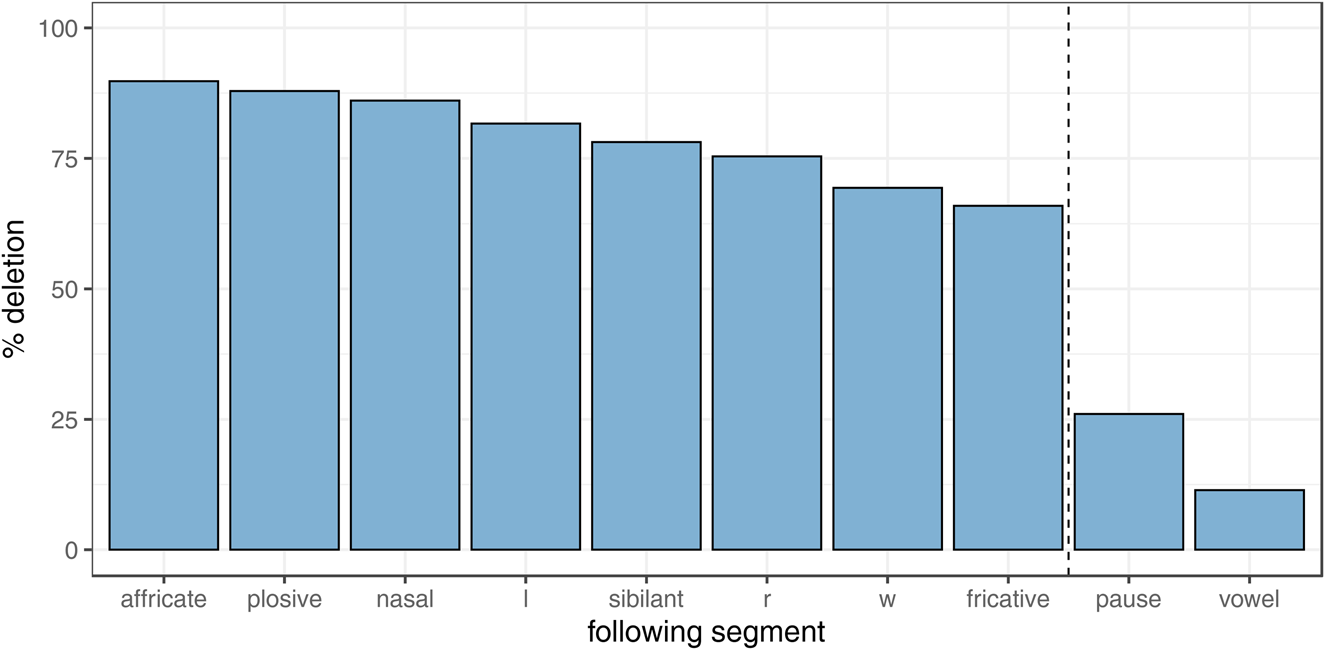
The specific effect of following segment is shown in Figure 1. As expected, a following consonant is most likely to result in deletion, and this factor shows the strongest effect size of deletion versus retention in the dataset. All reported varieties of English show this effect, but we do find variation between dialects in whether a following pause or a following vowel is more likely to prefer deletion (Coetzee, Reference Coetzee2004:218; Guy, Reference Guy and Labov1980). In Manchester, we see that a following pause results in higher rates of deletion than a following vowel, which seems to be the more common patterns across varieties. We include fine-grained categories of following segment in Figure 1 for full detail, but consonants are collapsed into one category in the statistical model.
Deletion rates by following segment. Dotted line separates consonants from pause and vowel.
Preceding segment
Preceding segment effects are shown in Figure 2 and in the final model by their comparison with the baseline of affricate, for example, watched. As in other studies, this shows a clear trend in the Manchester data, in that preceding sibilant, as in lost and passed, strongly favors deletion. As discussed by Guy and Boberg (Reference Guy and Boberg1997), these findings are in line with the Obligatory Contour Principle (OCP; Goldsmith, Reference Goldsmith1976): adjacent segments which share features are dispreferred. As sibilants are the only possible obstruents to precede td, which also share a coronal place of articulation, we would expect most deletion here. Re-leveling the baseline of the model indicates that affricates behave somewhere in between the stops and sibilants, but tending toward sibilants. Plosives, fricatives, and laterals show the lowest rates of deletion. The hierarchy is almost identical to that reported for Labov (Reference Labov1989), although nasals and plosives are reversed. This is understandable given that the preceding nasals are restricted in the glottaling environment here (with –nt/-lt clusters excluded only sonorant plus –d clusters remain), so we might expect to find some differences in weights between our results and other studies.
Deletion and preceding segment.

The effect of preceding segment is intertwined with that of morphological class. The other study we are aware of on td in British English, in addition to Tagliamonte and Temple's (Reference Tagliamonte and Temple2005) exploration of York speech, is Sonderegger et al. (Reference Sonderegger, Beltrama, Chatzikonstantinou, Franklin, Kirken, Lee, Nelson, Nicoletto, Penslar, Provenza, Rothfels, Bane, Graff and Riggle2011) investigation into contestants’ speech in the UK version of the reality TV program Big Brother, which also makes the claim that there is no morphological effect, as once the effect of preceding segment is taken into account, the effect of morphological class falls out. The argument is that, rather than its morphological class being the reason for the deleted /t, d/, it is actually just because most monomorphemic forms are made up of preceding sibilants, such as /s/, which favor deletion (see also Temple, Reference Temple, Jones and Payne2009). Sibilants are rarer in past tense forms, which tend to be made up of other obstruents or sonorants. We can see in our statistical model that this argument does not hold for our dataset, as morphological class remains significant even when preceding segment is accounted for. Next, we discuss the effect of morphological class in detail.
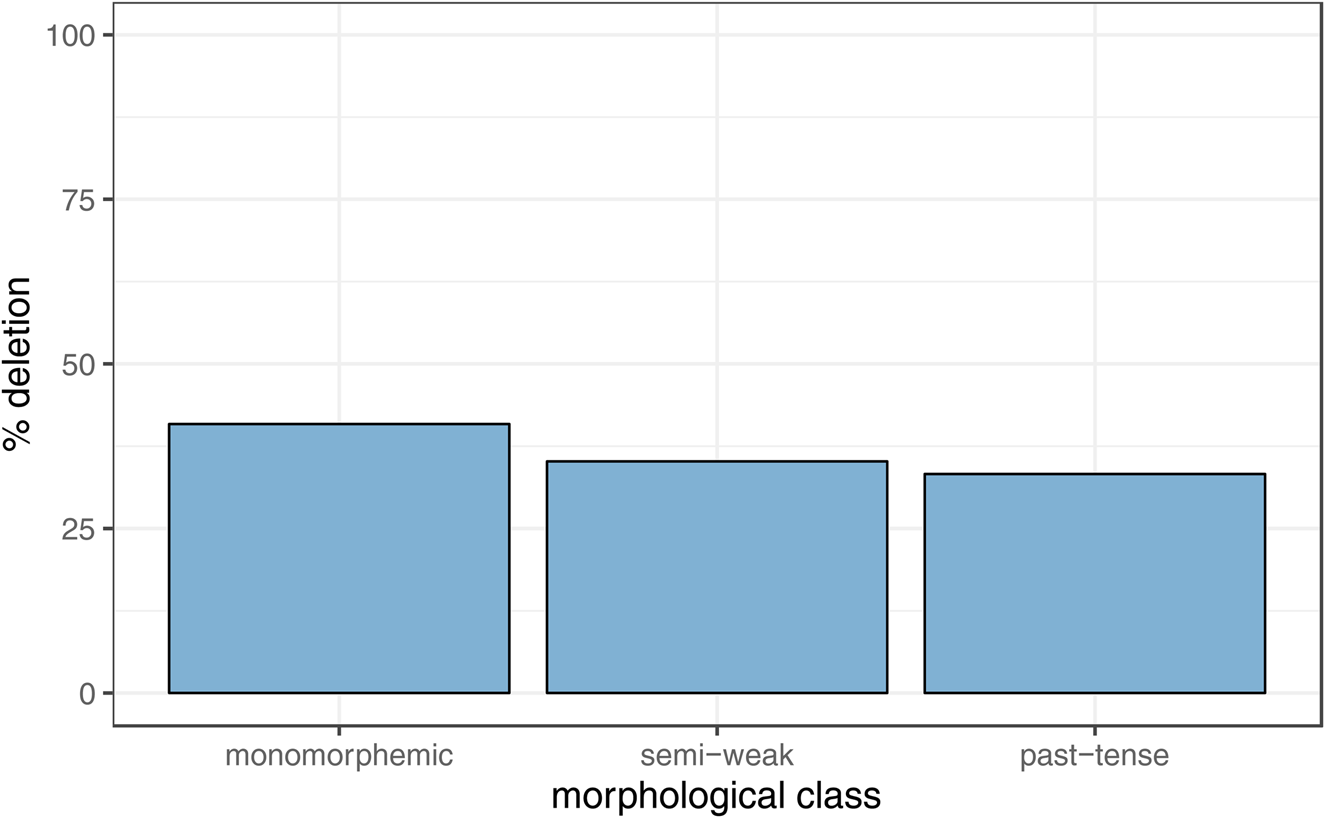
Morphological class
In this dataset, morphological class is a significant predictor of td-deletion, even when preceding segment is included (Table 2), exhibiting the same pattern as reported for varieties of American English: monomorphemes favor deletion, past tense forms disfavor it; this pattern can be seen in Figure 3. The difference between semi-weaks and the other categories is not significant in this dataset (confirmed by re-leveling the baseline category). As far as we know, this is the first published report confirming a significant morphological effect for British English. However, it must be noted that the effect is still smaller than in American English. This is likely due to t-glottaling being an active process in British English, competing with, and as we show in our discussion of age below, blocking t-deletion after sonorants, as in went and melt, for some speakers in Manchester completely. We discuss this effect in greater detail below, alongside social factors conditioning t-glottaling.
Deletion rates across linguistic predictors of morphological class.
Note that Tagliamonte and Temple (Reference Tagliamonte and Temple2005) did find the same effect in York, but it does not come out as significant in their model. Why we find a significant effect and others do not may be due to a variety of reasons. Since the publication of previous works, statistical tools and data collection techniques have advanced far beyond what was possible a decade ago. Thus, we have analyzed almost 14,000 tokens of td from 93 speakers from the same speech community, compared to 1,200 tokens from 38 speakers in York. Note that the York speakers have a much lower rate of deletion overall (26% monomorphemes, 21% semi-weaks, 19% past tense), which may also seem an unusually large difference between two Northern English varieties. This may be due to coding conventions, with the York study excluding many more tokens than the present analysis and restricting the number of tokens per speaker (Taglimonte & Temple, Reference Tagliamonte and Temple2005:286). Mixed-effects models mean we are able to include random effects for speaker and word and do not have to restrict our analyses in ways previous studies had to. However, this explanation does not account for the fact that studies using the large Big Brother corpus (Sonderegger et al. Reference Sonderegger, Beltrama, Chatzikonstantinou, Franklin, Kirken, Lee, Nelson, Nicoletto, Penslar, Provenza, Rothfels, Bane, Graff and Riggle2011; Tanner, Sonderegger & Wagner Reference Tanner, Sonderegger and Wagner2017) also found no significant morphological effect. We suggest that this may be due to the treatment of glottal stop replacement of /t/ in postsonorant clusters. As explained, we have excluded -nt and -lt clusters from the envelope of variation in our study, due to the high rates of glottaling in this environment. In Manchester, these clusters are glottaled at an overall rate of 82%, which alongside 16% realized as [t] results in an almost nonvariable retention rate of 98% for our dataset. As most of these clusters are also monomorphemes (90% of our -lt and -nt tokens are monomorphemic), this means that the inclusion of glottaled tokens, which are coded as retained, has a strong effect in raising the retention rate of monomorphemic td, which, in turn, dampens the difference between that and past tense, the latter of which typically shows higher retention rates. We suggest that previous studies found no significant effect because they may not have fully accounted for the effect these glottal tokens were having on the rates of monomorphemic deletion overall. We return to the evidence of the rise of the glottal stop in these clusters in Manchester below, when we discuss the social effects of age.
Thus far, we have said little on the semi-weak class, other than that it shows no significant difference between either of the two major morphological classes. As mentioned in the review of the existing literature, the semi-weak class has been argued to not truly be an intermediate category, but that speakers are more loosely clustered in their behavior for this class: some speakers treat them all as monomorphemes, others treat them as past tense (Guy & Boyd, Reference Guy and Boyd1990), thus averaging between monomorphemes and past tense forms for the whole cohort. It has also been argued that they could be analyzed as a mixture of past tense and no underlying coronal stop (Fruehwald, Reference Fruehwald2012). We do not find the same distribution here, and closer inspection of individuals shows that semi-weak forms are tightly clustered; speakers tend to behave very similarly for the most part (i.e., there are not two groups of speakers treating semi-weaks differently), and the statistics suggest that semi-weaks are processed the same as past tense for these speakers. However, a closer inspection of the numbers using the same methodology as in Fruehwald (Reference Fruehwald2012) may reveal alternative patterns.
Voicing
Voicing was coded for both the segment itself (/t/ or /d/) and the cluster (hetero- or homovoiced). The combined effect of these categories can be seen in Figure 4. Note that the heterovoicing clusters are absent from most of our analysis; heterovoiced clusters are exclusively /t/: heterovoiced /d/ clusters do not exist. Thus, these are all tokens with preceding sonorants such as /n/ or /l/ and, therefore, are environments in which glottaling can also occur. As discussed above, these tokens have been removed from our statistical model, because they glottal at high rates in Manchester and block deletion. We include the rates of heterovoicing deletion in Figure 3 for comparative purposes.
Deletion rates by voicing of cluster.
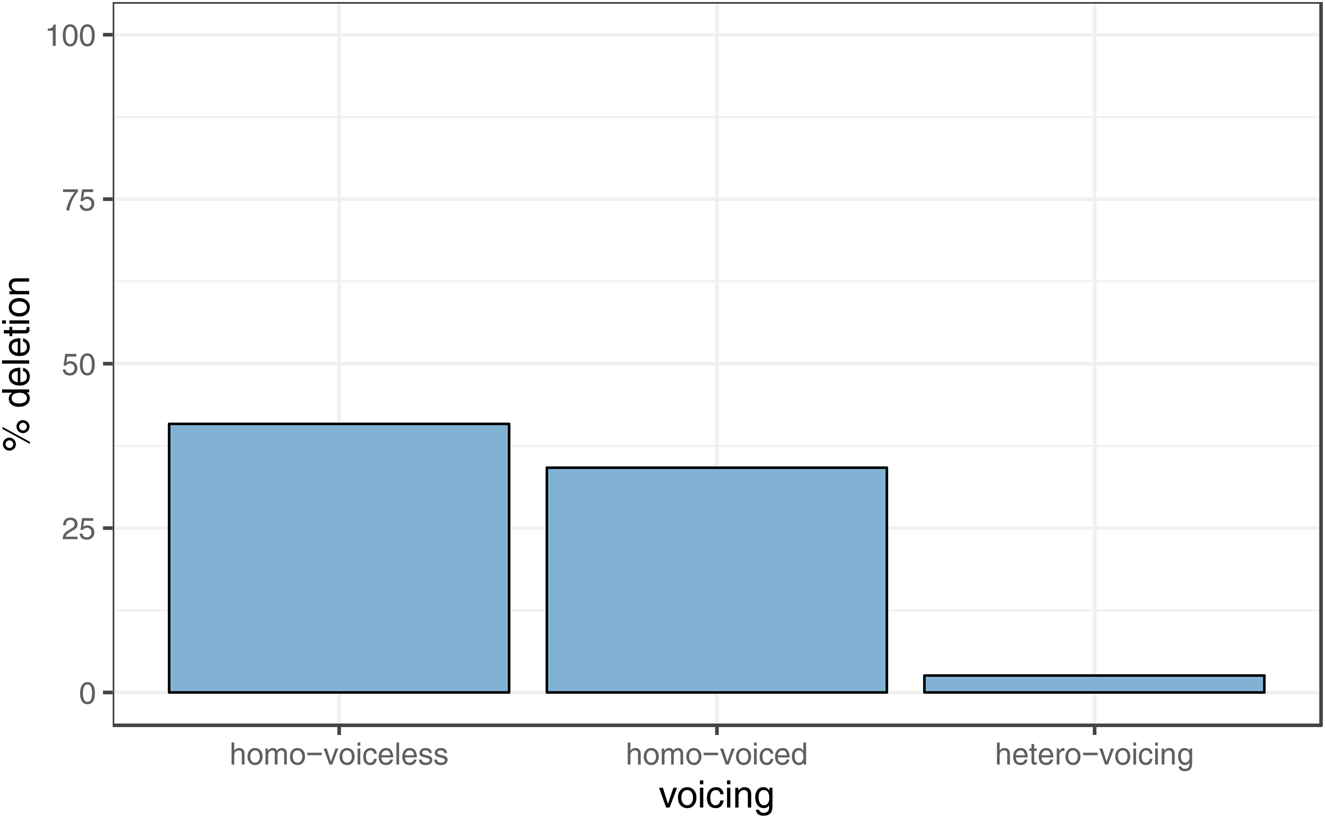
Voicing does not reach significance in our model, which arguably casts doubt on some researchers’ claims that /t/ and /d/ should be treated differently. The previously reported trend of homovoiced clusters deleting at higher rates than heterovoiced clusters is also borne out here, but it should be noted that the blocking of deletion by glottaling of heterovoiced clusters has contributed to much of the rates of application here. At the same time, it is worth pointing out here that the co-occurrence of certain environments across different predictors makes it extremely difficult to disentangle particular effects. For example, in this remaining data, all preceding nasals and laterals only occur with voiced segments, and the vast majority of preceding sibilants and stops are voiceless.
Social factors
The social factors investigated in the model do not show significant conditioning of td-deletion, as the high similarity between the rates in Table 3 demonstrates. Gender and social class show next to no variation between different groups. The rates for ethnicity do trend toward significance when comparing Pakistani speakers (who delete more) with the other two ethnic groups. Given that only 20% of our dataset consists of ethnic minority speakers, we took the decision not to include ethnicity in our final model, but this is something we seek to follow up in later work in Manchester. We know that more recent ethnic minority arrivals seem to participate in newer vowel changes in the unstressed vowel system, but not in older ones (Baranowski & Turton, Reference Baranowski and Turton2016), and their participation in a process such as td-deletion remains to be investigated. Higher rates of deletion in ethnic minority groups have also been reported for North American varieties (Hazen [Reference Hazen2011] in Appalachian English; Wolfram [Reference Wolfram1969] in Detroit), focusing on African-American speakers. In Manchester, however, Black and White speakers show very similar rates.
Rates of deletion across different social predictors.
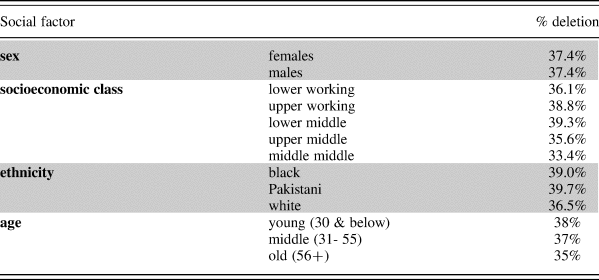
Age, which was tried in the model as a continuous number but is represented in Table 3 as three generations, shows stable numbers, as expected given previous studies of td-deletion. The picture for glottaling in postsonorant position is completely different, however, as seen in Figure 5, with significant differences between generations, and younger speakers showing higher rates of t-glottaling. It is worth noting that these results, that is, the apparent-time rise in t-glottaling, are in complete agreement with the findings of our previous study of t-glottaling in Manchester using the same sample (Baranowski & Turton, Reference Baranowski, Turton and Hickey2015; Bermúdez-Otero, Baranowski, Bailey, & Turton, Reference Bermúdez-Otero, Baranowski, Bailey and Turton2015) but coded independently. The point is that there is the nontrivial methodological issue of reliably distinguishing between t-glottaling and t-deletion after sonorants, as in sent and melt, in auditory analysis—this is not always straightforward. However, the fact that the rise in postsonorant t-glottaling mirrors our previous study of t-glottaling in the same community and that at the same time t-deletion in other positions shows no change in apparent time (Figure 5), consistent with previous studies of td-deletion, gives us added confidence in the accuracy of the coding and the robustness of the results.
Realization of /t/ in -nt and -lt clusters by generation.
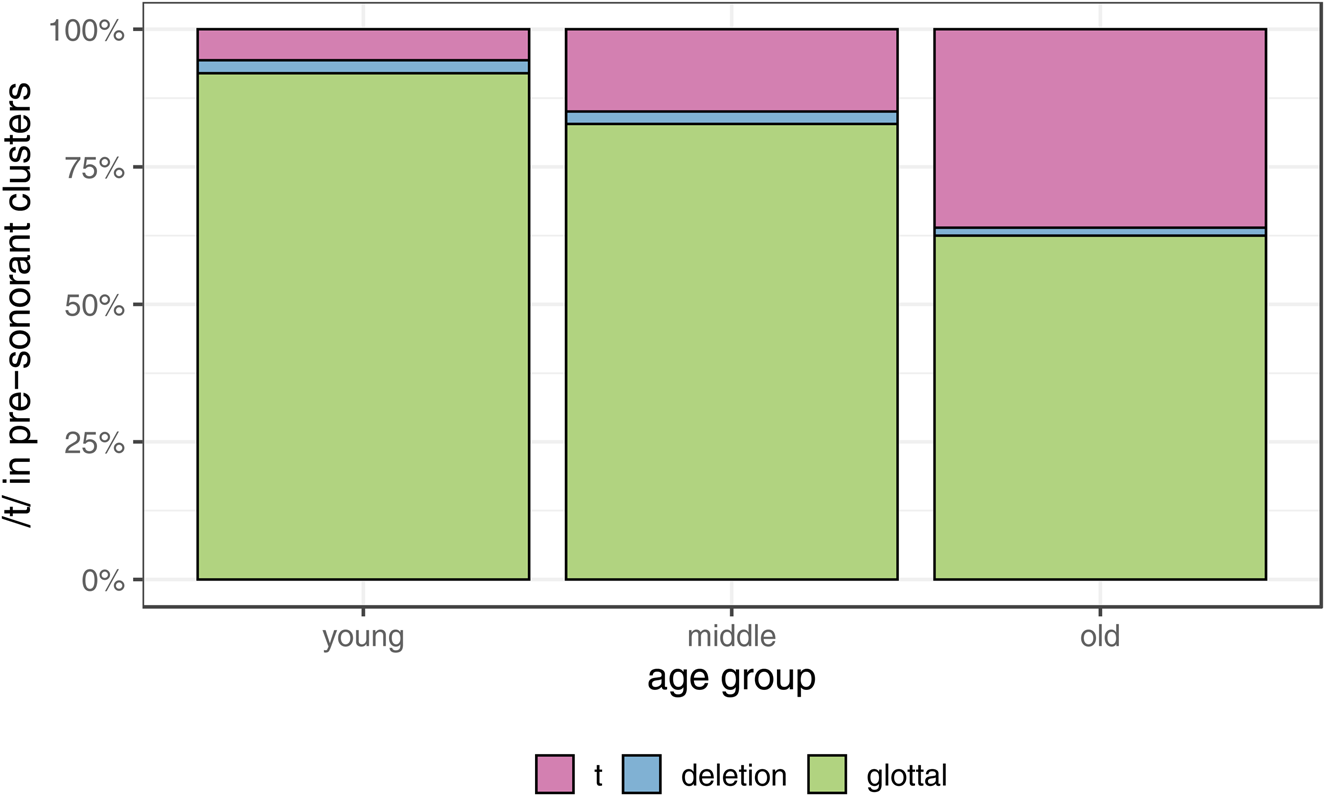
As Figure 5 shows, the glottal variant is the most frequent realization of word-final /t/ in postsonorant position, much more common than t-deletion. In fact, for the youngest generation of Mancunians, glottaling in this position is close to 100%. Importantly, as discussed above, the majority of -nt clusters (with contractions excluded) are found in monomorphemic words, such as hint and hunt (as noted by Temple [Reference Temple2013], whose glottaling rate of 75% is not much lower than our 82%). This means that in Manchester, and in British English more generally, the presence of glottaling will result in lowering t-deletion rates in monomorphemes in particular, which will in effect dampen the effect of morphological class seen so clearly in American English. As we have argued, this is likely the reason why previous studies of td-deletion in British English, particularly ones using much smaller datasets than ours, were not able to find a significant effect of morphological class.Footnote 8
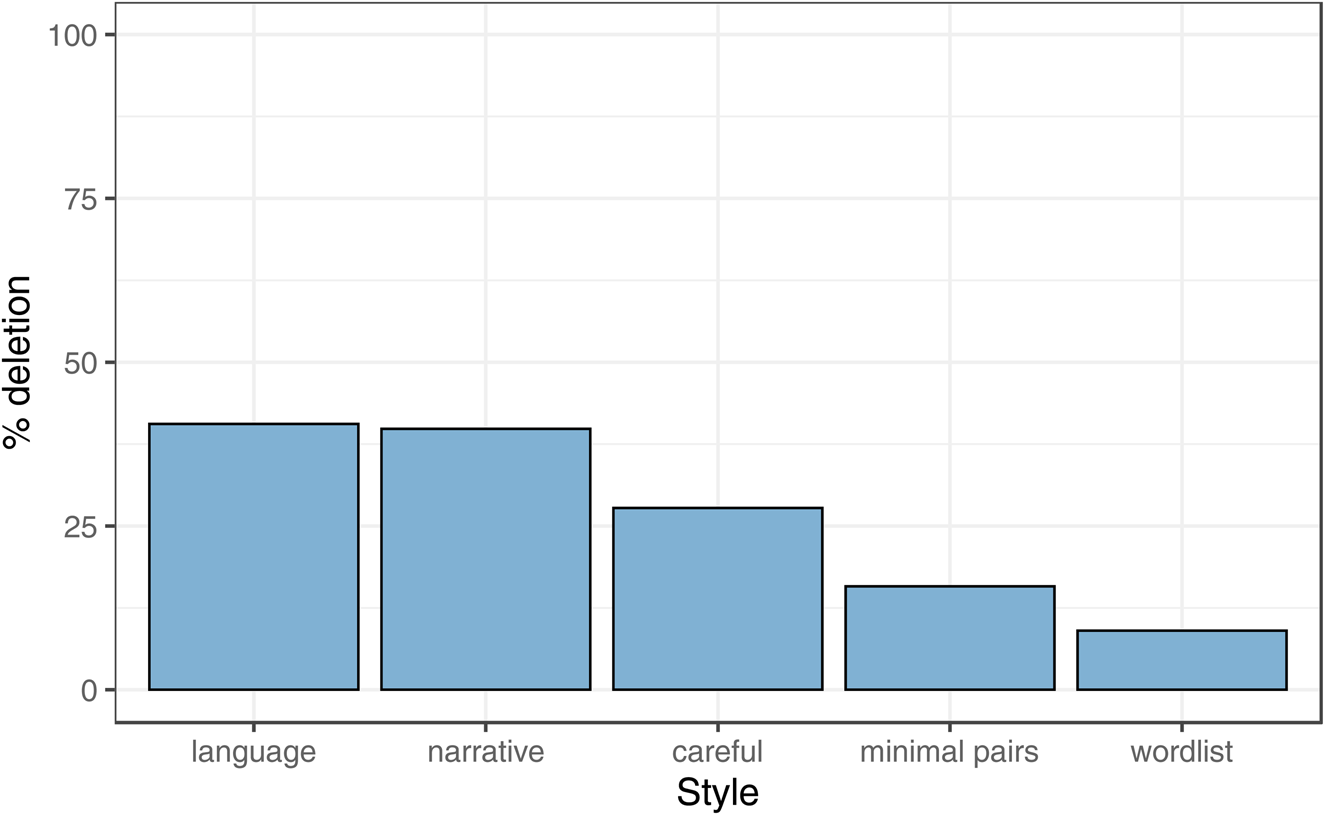
Style
Elicited tokens such as wordlist and minimal pairs were not included in our statistical regression analysis, and Figure 6 demonstrates why this is important: rates are considerably lower in formally elicited speech styles, for example, wordlist style exhibits deletion only 10% of the time. It also makes sense that the minimal pair test is not the most formal (as defined by the amount of attention paid) category here, as minimal pairs are designed to target sounds other than /t, d/ (e.g., first~thirst) and so speakers may not be paying most attention to the td. This also raises questions for those who have reported full deletion in articulatory studies to be extremely rare (Purse & Turk, Reference Purse and Turk2016), as to whether laboratory speech is the best environment to monitor td-deletion. Nevertheless, laboratory speech does give us a unique insight into the gestures associated with categorical and gradient deletion and provides an important key to our empirical and theoretical understanding of the variable, as in, for example, Purse's (Reference Purse2019) Electro-Magnetic Articulography (EMA) study. Still, researchers eliciting formal data in this way should be aware that they may not be getting the best access to this variable in terms of rates of application.
Deletion across different speech styles (language refers to contexts where speakers are specifically discussing language).
Word frequency
Table 2 shows that word frequency (Zipf transformed, centered in models) has a significant effect on td -deletion, with more frequent words favoring deletion. However, Figure 7 shows this effect is not linear in that it is skewed by the most frequent words. Each point in Figure 7 is the rate of deletion for a specific word in a given speaker, and the larger the point, the greater the number of tokens. The trend toward high frequency words deleting more is led by the high frequency words just and first deleting at high rates of over 50% for almost all speakers. The discussion as to whether td-deletion is higher in more frequent words has been the topic of debate in the literature (Guy et al., Reference Guy, Hay and Walker2008; Walker, Reference Walker2012). It is clear that some highly frequent words show almost categorical rates of deletion before a following consonant, which is why, for example, and is usually left out of analyses. Guy (Reference Guy, Bayley and Lucas2007) argued for an approach whereby highly frequent words, such as and, have two underlying representations, with and without t/d. In another approach, such as listener design (Lindblom, Reference Lindblom, Hardcastle and Marchal1990), speakers hyperarticulate highly frequent words to the point where their utterances are still recoverable, and our data are compatible with such models.
Deletion rates by frequency from SUBTLEX UK (Zipf-scaled).
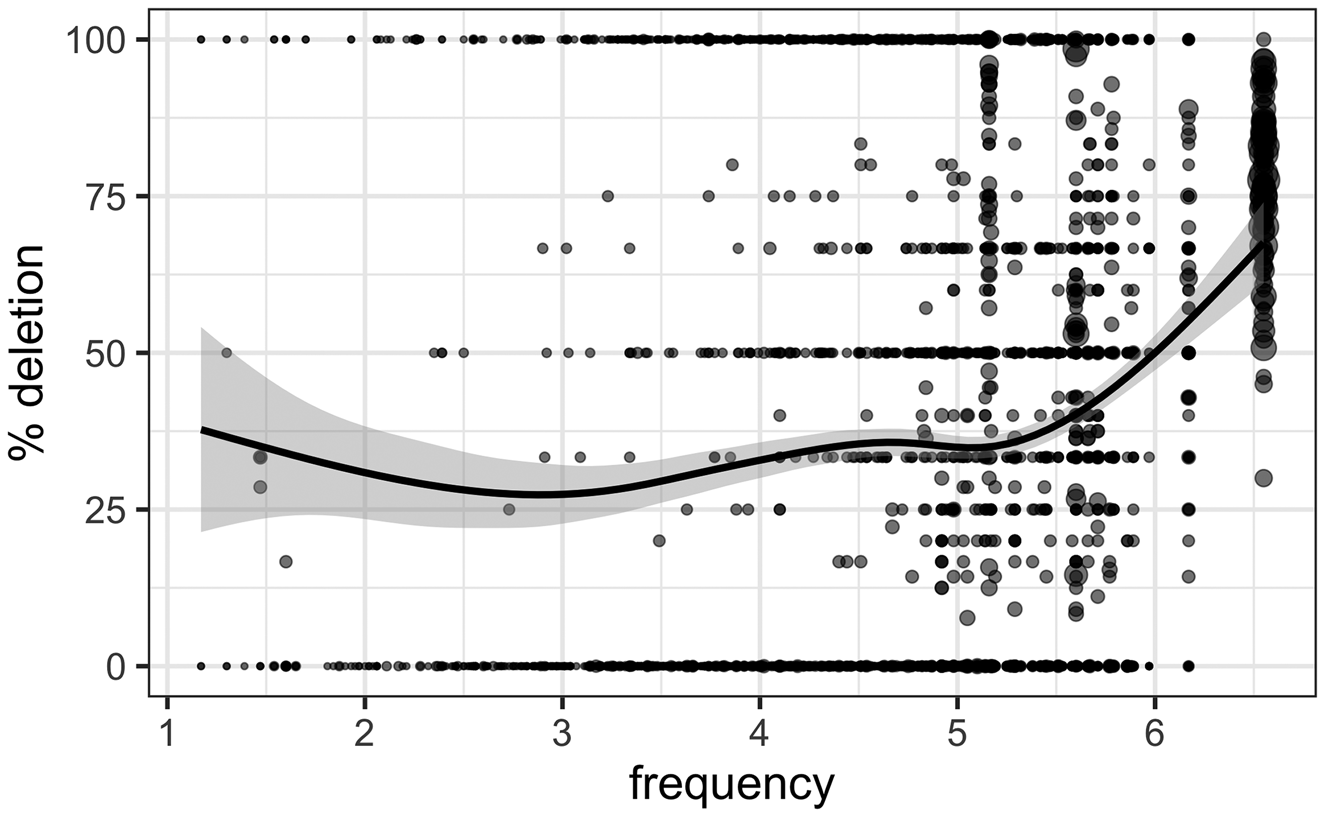
An important aspect to this debate is whether we should be using lemma frequencies or whole word forms. We have used the whole word form here, which we take directly from SUBTLEX without looking at the frequency of the lemma. In fact, when we run separate models on each morphological class (e.g., monomorphemes only, past tense only), frequency is only significant in monomorphemes; it is not significant for past tense and semi-weaks. This is an indicator that we may need to think more carefully about the morphological status of td itself and whether it is a suffix or part of the whole word. Nevertheless, although the factor of frequency is significant in our model (Table 2), morphological class remains significant. We conclude that the predictors responsible for the main patterns of variation in our dataset seem to be structural ones, such as adjacent sounds and morphological class.
CONCLUSION
This paper presents the first evidence of the morphological effect in British English td-deletion, an effect which has been replicated many times for American English but has so far been argued to be absent in British varieties. This is also the first major follow-up study to the only comprehensive investigation of td-deletion conducted in a British English variety (Tagliamonte & Temple, Reference Tagliamonte and Temple2005). The finding of the significant effect of morphological class in Manchester has important theoretical implications. It provides support for the role of the higher organization of the grammar, that is, morphology, in td-deletion, as argued by Guy (Reference Guy1991a, Reference Guy1991b) and provides evidence against the claim that the morphological effect found in American English is purely an artifact of the different morphological categories having different rates of preceding sounds, favoring or disfavoring deletion, as argued by Tagliamonte and Temple (Reference Tagliamonte and Temple2005) and Temple (Reference Temple, Jones and Payne2009, Reference Temple, Celata and Calamai2014).
This study confirms the presence of T-glottaling in postsonorant position as a major realization of /t/ in British English and stresses its importance in our understanding of the role of morphology in td-deletion. As glottal stops are the main variant of /t/ in -nt and -lt clusters, being close 100% for the youngest generation, they are responsible for the lowering of T-deletion rates in this position. As postsonorant /t/ occurs particularly commonly at the end of monomorphemes, the high glottaling rates result in the dampening of the morphological effect seen so clearly in American English, where there is a greater difference between monomorphemes and past tense forms. A careful consideration of the effects of T-glottaling as well as relatively large datasets may be needed for the morphological effect to emerge in explorations of td-deletion in British English.
The following and preceding segment effects are significant and similar to those found in previous studies of td-deletion. A following consonant promotes deletion, whereas a following vowel inhibits it, with a following pause showing intermediate rates. The role of preceding segment is the same as those found in most previous studies when we account for removing preceding /n/s in -nt clusters, with preceding sibilants strongly favoring deletion, and the effect being consistent with the Obligatory Contour Principle.
The voicing of the segment is not significant in our dataset, suggesting that the deletion of /t/ and /d/ is part of the same variable process once the glottal condition is taken into consideration. At the same time, further work is needed in order to tease apart the role of voicing, glottaling, and the co-occurrence of certain consonants in voiced versus voiceless contexts. Although word frequency comes out as significant in our model, its effect is not linear, and, on closer inspection, it seems to be driven by a few outliers, that is, high-frequency words just and first. Crucially, the morphological effect remains significant even when word frequency is included in the model, suggesting that the primary factors responsible for the variation in our dataset are structural ones, such as adjacent sounds and morphological class. Finally, similar to most previous studies, social factors such as speaker gender, social class, and age are not significant in our dataset.
The results also highlight the vast differences in rates of application in different styles of speech, with formal elicitations showing much lower rates of deletion. Therefore, it is not surprising that recent reports of laboratory speech have found categorically deleted variants to be a rare occurrence (Purse, Reference Purse2019). In addition, we would argue that it is not surprising that td-deletion may not always involve a categorical lack of tongue-tip contact given what we know about the progression of phonological rules and morphosyntactic structure. If td was categorically deleted, we might expect higher occurrences of deleted forms being posited as the underlying form in acquisition, as we see for some AAVE speakers. That is, we would expect the plural of tests to be [tesɪz] more often, as [tes] would be stabilized by the next generation as the underlying representation. However, a process whereby the tongue tip gesture was lenited rather than fully deleted may be more plausible given that this reanalysis does not occur for the vast majority of dialects. Speakers can reconstruct the “correct” form given that the input is lenited rather than deleted. Given the limitations on articulatory studies (i.e., very few speakers and tokens) and the difficulty acquiring tongue-tip data in an inexpensive and uninvasive manner, the answers to such questions are not easily obtained. However, we would again stress that the presence of gradience in no way entails the absence of categoricity, as has been shown by many studies of articulatory phonetics (Ellis & Hardcastle, Reference Ellis and Hardcastle2002; Scobbie, Reference Scobbie1995; Turton, Reference Turton2014; Zsiga, Reference Zsiga, Connell and Arvaniti1995).
Finally, the results highlight the importance of the methodological innovations available to researchers today that were not available only a decade ago. This includes forced-alignment, which, along with Praat scripting, allows the researcher to analyze vast numbers of tokens in a relatively short time, making the coding not only more efficient but also more accurate. Mixed-effects regression allows us to take into account the role of individual speakers and individual words. In addition, the availability of large-scale corpora, such as the SUBTLEX corpus, allows us to obtain word frequency measures that reflect spoken language use much more accurately than more traditional resources. This, in combination with the latest statistical tools, allows us to consider the role of lexical frequency in language variation and change in more nuanced ways, although we note that the role of lemma versus word frequency remains to be investigated.
In conclusion, this study demonstrates that calls for dismissing the role of morphophonology in td-deletion on the basis of the lack of this effect in British English have been premature and that further large-scale studies may uncover similar patterns.
ACKNOWLEDGMENTS
This research was funded by the UK Economic and Social Research Council (ESRC, grant ES/I009426/1, Maciej Baranowski PI) and through a University of Manchester Research Support Fund grant. We are grateful to Louise Middleton for her help with coding. We thank Ricardo Bermúdez-Otero, Josef Fruehwald, Bill Labov, and Meredith Tamminga for their expert advice on the topic and two anonymous reviewers for their considered suggestions and shared expertise on the variable. Thanks to the audiences at NWAV 44 and LAGB 2016 for their comments.


 Open access