

Ischaemic heart disease (IHD) is one of the major causes of morbidity and mortality worldwide( 1 , 2 ). Diet is recognised as one of several modifiable lifestyle factors for the prevention of IHD( 1 , Reference Van Horn, McCoin and Kris-Etherton 3 , 4 ).
During the past decades, research on diet–disease associations has focused on measurements of overall quality of diets and dietary patterns as opposed to the traditional approach in dietary research with focus on single nutrients and foods( Reference Ocké 5 – 8 ). This change in research focus is justified by the notion that people eat composite diets and meals with nutrients and foods in combination.
Several dietary scores and dietary quality indices have been developed to assess adherence to different healthy food patterns and national Food-Based Dietary Guidelines (FBDG)( Reference Hu 6 , Reference Schwingshackl and Hoffmann 9 , Reference Waijers, Feskens and Ocké 10 ). Some of the most commonly used are The Mediterranean diet score indicating compliance with the traditional dietary pattern followed by Mediterranean populations, and the American Healthy Eating Index (HEI), which assesses adherence with the Dietary Guidelines for Americans( Reference Guenther, Casavale and Reedy 11 ). Both observational and intervention studies have shown a protective effect on the development and mortality of CVD with a higher compliance to the Mediterranean diet and the Dietary Guidelines for Americans( Reference Sofi, Macchi and Abbate 12 – Reference Onvani, Haghighatdoost and Surkan 16 ).
The Mediterranean diet score and the American HEI are considered most suitable for the Mediterranean countries and the Americans and for countries with similar food cultures, respectively. In the Nordic countries, including Denmark, a different food culture exists with a dietary pattern relatively abundant in certain fruit and vegetables (especially berries, cabbages, root vegetables and legumes), potatoes, whole-grain cereals, dairy and meat products( Reference Mithril, Dragsted and Meyer 17 ). The Danish food culture and food preferences were included as an integrated part in the development of the current Danish FBDG when translating the scientific evidence regarding the association between diet and risk of diseases into quantified FBDG( Reference Tetens, Andersen and Astrup 18 ).
In Denmark, two dietary quality indices have been developed to measure adherence to the Danish FBDG from 2005( Reference Toft, Kristoffersen and Lau 19 , Reference Knudsen, Fagt and Trolle 20 ). One is the Dietary Quality Score (DQS), which is based on a forty-eight-item FFQ, and uses a three-point scoring system for each of four food groups: fish, fruit, vegetables and fats. The DQS has been found to be inversely associated with serum lipids, homocysteine and absolute risk of IHD in men and women aged 30–60 years( Reference Toft, Kristoffersen and Lau 19 ). The other, the Diet Quality Index (DQI), is based on dietary data from a 7-d pre-coded food diary, and uses a sum of six scores of food and nutrients based on the 2005 FBDG relating to dietary intake( Reference Knudsen, Fagt and Trolle 20 , Reference Biltoft-Jensen, Matthiessen and Rasmussen 21 ). In continuation of the update of the Danish FBDG in 2013, an updated version of the DQI was applied to reflect the changes in the FBDG( Reference Tetens, Andersen and Astrup 18 , Reference Sørensen, Matthiessen and Holm 22 ). The updated DQI is based on five food and nutrient indicators, including whole grain, fish, fruit and vegetables and energy % from saturated fat and from added sugar( Reference Knudsen, Fagt and Trolle 20 , Reference Sørensen, Matthiessen and Holm 22 ).
The objective of this study was to investigate associations between adherence to the current Danish FBDG assessed by a DQI and selected cardiometabolic risk factors in a Danish adult population with a minimum of one self-rated risk factor of IHD.
Methods
Study design
The study was based on baseline data from the study Diet and Prevention of Ischemic Heart Disease – a Translational Approach (DIPI) (www.DIPI.dk), which included a 6-month randomised, single-blinded parallel, dietary intervention study in a real-life setting, with a 6-month follow-up. The study was designed to assess the effects of dietary substitution guidelines specifically aimed at the prevention of IHD on dietary intake and IHD risk factors in the general adult Danish population. This paper reports on the baseline cross-sectional data.
This study was conducted according to the guidelines laid down in the Declaration of Helsinki and was approved by The Capital Region of Denmark Ethics Committee (Journal no. H-1-2013-110) and by the Danish Data Protection Agency (Journal no. 2013-54-0571). Written informed consent was obtained from all study participants, and they received a small remuneration of about 34 GBP for their participation in the study. The study was registered at ClinicalTrials.gov (registry name ‘DIPI’, ID no. NCT02062424).
Study participants
Potential participants were identified using a unique personal identification number assigned to all Danish citizens in the Civil Registration System( Reference Pedersen 23 ). In total, 5000 men and women born in 1949–1984 and living in a defined area of the greater Copenhagen were invited by letter to participate in the study. The number of invited participants was based on previous experience of a low response rate when recruiting participants for long-term interventions. Overall, 334 responded on the invitation and were thus screened from a self-administered questionnaire including questions on the inclusion and exclusion criteria. The potential participants were asked in the questionnaire to measure and report their height in metres, weight in kg, their waist circumference (WC) 2 cm above their belly button and whether or not they were physically active for more than 15 min/week. Furthermore, the self-administered questionnaire included questions on the exclusion criteria; see below. After screening, the eligible participants were invited to an information meeting, which included an introduction to the web-based dietary assessment software. Of the eligible participants who participated in the information meeting, 100 % agreed to participate and provided informed consent.
The inclusion criteria were age between 30 and 65 years, and a minimum of one self-rated risk factor of IHD – that is overweight or obesity (BMI ≥ 25) – WC ≥80 cm for women and ≥94 cm for men, and/or physical inactivity defined as being moderately physically active in leisure time for 15 min or less per week.
The exclusion criteria were current smoking, pregnancy or plans to become pregnant within the next 12 months, breast-feeding, history of CVD, type 2 diabetes, chronic disease/disorders that could affect the results of the study (the chronic diseases that the subjects reported were evaluated by the clinical physician in charge), drug abuse within the past 12 months, regular alcohol consumption >21 units/week for men or >14 units/week for women, allergies or intolerance of the food groups included in the dietary guidelines, consumption of dietary supplements with high doses of nutrients that could have a potential effect on IHD risk factors (e.g. fish oils) and/or no access to a computer and internet.
Measures
Dietary intake and calculation of diet quality index
The study participants recorded their dietary intake using a web-based dietary assessment software for 7 consecutive days( Reference Biltoft-Jensen, Bysted and Trolle 24 ). The web-based dietary assessment software was originally developed and validated for children aged 8–11 years and slightly customised to fit the adult study population of the DIPI study( Reference Biltoft-Jensen, Bysted and Trolle 24 , Reference Biltoft-Jensen, Trolle and Christensen 25 ). At least 4 d of food reporting had to be completed by the study participant for inclusion of the study participants in the analysis( Reference Biltoft-Jensen, Matthiessen and Rasmussen 21 ).
The dietary assessment software was structured according to a typical Danish meal pattern covering breakfast, lunch, dinner and three in-between meals. The participants could estimate the amount consumed by selecting the closest portion size among four different digital images in eighty photograph series. Internal checks for frequently forgotten foods (spreads, sugar, sauces, dressings, snacks, candy and beverages) were included. Furthermore, the participants reported the intake of nutritional supplements and whether a day represented usual or unusual intake, including reasons for unusual intakes such as illness. If a participant failed to report for a day, the participant was reminded by an email the next day( Reference Biltoft-Jensen, Bysted and Trolle 24 ).
Intakes of food items, energy and nutrients were calculated for each study participant as an average of 7 d using the software system General Intake Estimation System (GIES) version 1.000.i6 (National Food Institute, Technical University of Denmark) and the Danish Food Composition Databank version 7.0 (National Food Institute Technical University of Denmark, 2009).
Adherence to the Danish FBDG was evaluated based on a DQI published earlier and updated to the current Danish FBDG( Reference Knudsen, Fagt and Trolle 20 , Reference Sørensen, Matthiessen and Holm 22 ), including intake of whole grain (min 75 g/10 MJ per d), intake of fish (min 350 g/10 MJ per week), intake of fruit and vegetables (min 600 g/10 MJ per d), energy from saturated fat (max 10 E%) and energy from added sugar (max 10 E%). The DQI was based on intake adjusted to 10 MJ, as this is the unit for the FBDG( Reference Tetens, Andersen and Astrup 18 ).
A DQI for each study participant was calculated – adapted from( Reference Knudsen, Fagt and Trolle 20 ) – as the ratio of the actual intake and the recommend intake of each of the five guidelines included in the index. For example, if a study participant had an intake of 60 g/10 MJ perd whole grain, the score was 60/75=0·8. For the included guidelines with an upper limit of a recommended intake, the DQI was calculated as 1−((intake−recommended)/recommended), and thus for a study participant with an intake of 13 % energy from added sugar the DQI was calculated as 1−((13–10)/10)=0·7.
In contrast to the original DQI, we did not have a maximum score in individuals with an intake exceeding the cut-off values( Reference Knudsen, Fagt and Trolle 20 ). The total score was calculated as the sum of the five scores, a higher score meaning a higher degree of compliance with the FBDG.
Under- and over-reporters
Under- and over-reported energy intake (EI) was defined as a ratio of reported mean EI:BMR and classified by cut-offs suggested by Black( Reference Black 26 , Reference Goldberg, Black and Jebb 27 ). Under-reporters (UR) were defined as EI:BMR ≤1·05 and over-reporters (OR) were defined as EI:BMR ≥2·28, using a physical activity level of 1·55 (data not shown).
Assessment of cardiometabolic risk factors
Blood samples
Fasting blood samples from venepuncture were analysed for concentrations of TAG, total cholesterol, HDL-cholesterol, high-sensitivity C-reactive protein (hsCRP), glucose, HbA1c and insulin. The blood samples were collected and handled according to the hospital routines. TAG, total cholesterol, HDL-cholesterol and glucose were measured in plasma by Reflection Spectroscopy at 540 nm and hsCRP was measured in plasma by Reflection Spectroscopy at 660 nm (Apparatus Vitros 5.1 FS; Ortho-Clinical Diagnostics). HbA1c was measured in plasma with HPLC (D-100; Bio-Rad). Fasting plasma insulin was measured using the sandwich ELISA analysis principle (ADVIA Centaur XP; Siemens). VLDL-cholesterol was calculated from TAG, using the equation plasma VLDL-cholesterol=plasma TAG×0·45, and LDL-cholesterol was calculated using the Friedewald equation( Reference Friedewald, Levy and Fredrickson 28 ).
The homoeostatic model assessment (HOMA) was used to estimate insulin resistance (HOMA-IR). HOMA-IR was calculated using the formula HOMA-IR=(glucose (nmol/l)×insulin (mU/ml)/22·5), using fasting values( Reference Matthews, Hosker and Rudenski 29 ).
Anthropometric measurements (height, weight and waist circumference)
Height was measured to the nearest 0·5 cm, on a wall-mounted stadiometer (SECA). Body weight was measured in kg and trunk fat was registered on a fat analysis weight (Tanita BC 418 MA). The subjects had to be fasting. Waist and hip circumference was measured twice, with an anthropometric tape (SECA 201), and the average was reported.
BMI was defined as weight in kg divided by squared height in metres (kg/m2).
Blood pressure and heart rate
Seated blood pressure (BP) and heart rate (HR) were measured in duplicate after 5 min of rest in the subjects’ left arm, using an electric sphygmomanometer according to standardised procedures. The subjects had to empty their bladder before the measurement and were not allowed to converse during the measurement, nor have their legs crossed. If the diastolic BP differed more than 5 mmHg, further measurements were done, until at least in two measurements the diastolic BP differed≤5 mmHg. The average value of the two BP and HR measurements was calculated.
Assessment of background questionnaires
Lifestyle questionnaires were used to obtain information about the participant’s education level (primary school/high school, associate degree, under-graduate, graduate) and the level of physical activity at leisure time (extremely active, moderately active, sedentary or inactive). The question about the level of physical activity was based on one question about the study participants’ physical activity during leisure time in the past 6 month and was based upon the Danish National Health Profile( 30 ).
Statistical analysis
For a parallel design, statistical power calculations based on evidence from previous similar studies( Reference Estruch, Martínez-González and Corella 31 – Reference Goff, Cowland and Hooper 33 ) were used to estimate that sixty-two subjects in each intervention arm were sufficient to detect a difference of 0·25 mmol/l LDL-cholesterol (sd 0·49) (α=0·05, β=0·8). To allow for a drop-out of 20 %, the number of participants was set to a total of 225. Self-rated weight (kg), WC and BMI from the screening self-administered questionnaire were compared with weight, WC and BMI measured at baseline by a paired t test. Baseline characteristics and dietary intake of the study participants were summarised for men and women using medians and 80 % central range for continuous variables and proportions for categorical variables.
Linear regression analyses were used to evaluate the association between DQI and cardiometabolic risk factors. Three models were applied; a simple model adjusted for sex and age (<50 or ≥50) (model 1a), a multivariate model further adjusted for education (primary school/high school, associate degree, under-graduate or graduate) and physical activity at leisure time (extremely active, moderately active, sedentary or inactive) (model 1b), and a final multivariate model adjusted as model 1b plus BMI (model 2). Furthermore, sensitivity analysis excluding UR and OR was made to investigate the impact of UR and OR on the associations between DQI and cardiometabolic risk factors.
All the models were tested for statistically significant interactions between DQI and sex and DQI and age. These interactions were tested to investigate whether the associations were different for men and women and for participants <50 years of age or 50 years of age or above. If an interaction was significant, the DQI estimates for men and women and DQI estimates by age were given. To check the model assumptions, the standardised residuals of the final models were examined for normality, variance homogeneity and linearity. BMI, waist:hip-ratio, hsCRP, VLDL-cholesterol, TAG, glucose, insulin and HOMA-IR were all logarithm10 transformed to normalise the distribution and to improve variance homogeneity. For the above-mentioned variables, which were log-transformed, the estimates and 95 % CI are presented as percent difference.
The statistical analyses were carried out using RStudio (version 0.99.441 – © 2009–2015; RStudio, Inc.). Statistical significance was established at P<0·05.
Results
Baseline characteristics of study participants
A total of 222 participants met the inclusion and exclusion criteria and were enrolled into the study, which was 67 % of the initially screened potential study participants. Significant differences (P<0·05) in weight and WC were found between self-reported and measured at baseline. The participants’ self-reported weight and WC were higher than the measured weight and WC at baseline. However, no difference in BMI was found. In all, 17 % of the women and 7 % of the men did not meet the inclusion criteria when measured at baseline (data not shown). For three participants, a full baseline examination was missing, and they were therefore excluded. Of the remaining 219 study participants, those who were taking cholesterol-lowering (n 5) and/or BP-lowering (n 3) medications were excluded from the statistical analysis of the association between DQI and lipid biomarkers and DQI and BP, respectively. In addition, biochemical analysis of hsCRP was not possible in fifteen study participants; therefore, for the statistical analysis of the association between DQI and hsCRP, the number of participants was 204. Furthermore, it was not possible to get sufficient blood from one of the study participants for the biochemical analysis of the glycaemic biomarkers, and thus for the statistical analysis of the association between DQI and glycaemic biomarkers (n 218).
Baseline characteristics of the 219 study participants included in the statistical analysis are presented in Table 1. Of the 219 study participants, ninety were men and 129 were women. The median age of the study participants was 51 years (10th–90th percentile (p10–p90) 37–61).
Table 1 Baseline characteristics of the study participants divided by sex (Medians and 10th–90th percentiles (p10–p90); percentages and numbers)
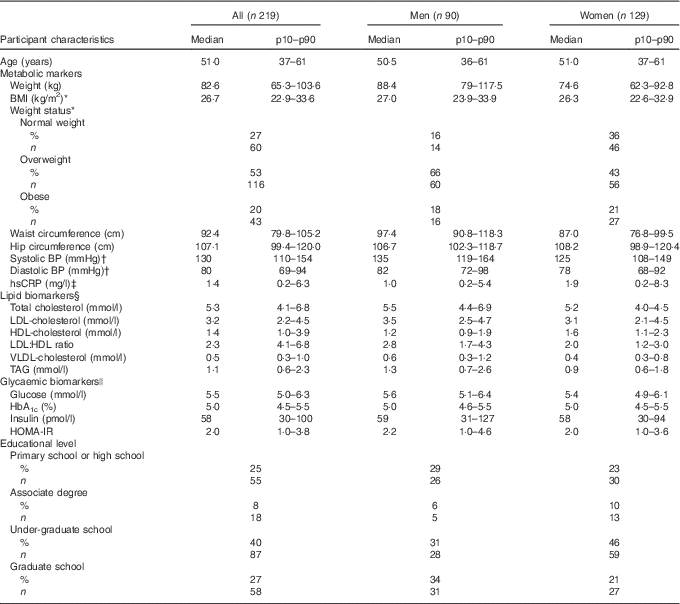
BP, blood pressure; hsCRP, high-sensitivity C-reactive protein; HOMA-IR, homoeostatic model of insulin resistance.
* BMI is calculated as weight in kg divided by the square of height in m (kg/m2). 18·5–25 kg/m2: normal weight, 25–30 kg/m2: overweight, >30 kg/m2: obese.
† All; 216, men; eighty-nine, women; 127, after exclusion of those using BP-lowering medication.
‡ All; 204, men; eighty-seven, women; 117, due to lack of hsCRP in biochemical analyses.
§ All; 214, men; eighty-five, after exclusion of those using cholesterol-lowering medication.
|| All; 218, women; 128, as it was not possible to draw enough blood to the glycaemic biomarker analysis from one of the female study participants.
Diet quality index, total energy intake and dietary composition
For the whole study population the median DQI was 4·5 (p10–p90 3·0–6·5). The median DQI score was higher for women than for men. Furthermore, the median individual DQI score for added sugar was higher than the median DQI scores for whole grain, fish, fruit and vegetables and saturated fat. Median total EI for men was 10·1 MJ (p10–p90 7·2–13·7) and for women it was 7·8 MJ (p10–p90 5·2–10·5) (Table 2). Medians (p10–p90) of the Diet Quality Index score (DQI), energy (MJ/d), diet composition (g/10 MJ per d) and energy contribution (E%) of macronutrients and dietary fibre (g/MJ) of the study population divided in tertiles of the DQI are presented in the online Supplementary Table S1.
Table 2 Overall Diet Quality Index (DQI) score and DQI scores for individual components, energy (MJ/d), diet composition (g/10 MJ per d) and energy contribution (E%) of macronutrients and dietary fibre (g/MJ) of the study participants (Medians and 10th–90th percentiles (p10–p90))
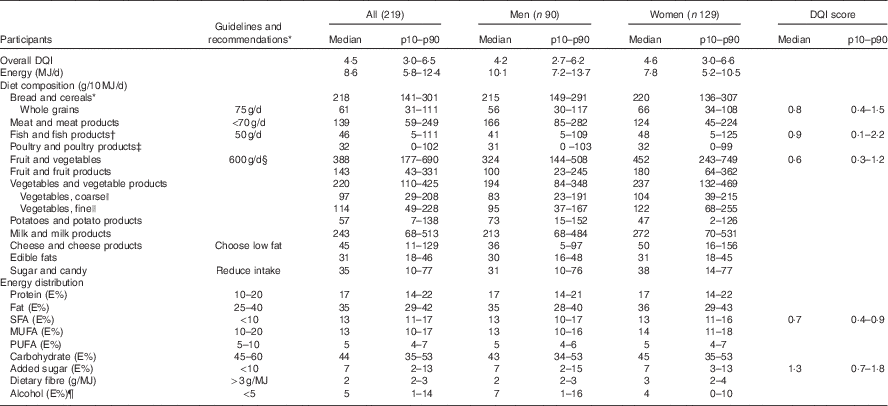
* Guidelines and recommendations according to the official Danish Food-Based Dietary Guidelines( Reference Tetens, Andersen and Astrup 18 ) and the Nordic Nutrition Recommendations, 2012( 8 ).
† All; n 201, men; eighty-three, women; 118 after exclusion of those who did not eat fish.
‡ All; 180, men; seventy-six, women; 104 after exclusion of those who did not eat poultry.
§ Eat 6 a day – equivalent to about 600 g of vegetables and fruit. At least half should be vegetables.
|| Vegetables are classified from type of food groups (e.g. all types of cabbage, root vegetables and onions are classified as coarse vegetables and all vegetables with a high water content like tomatoes and salad are classified as fine vegetables).
¶ All; 194, men; eighty-one, women; 113 after exclusion of those who did not drink alcohol.
Association between Dietary Quality Index and cardiometabolic risk factors
Table 3 summarises the associations between DQI and cardiometabolic risk factors in the study population. In the following section, only results from model 1b will be presented.
Table 3 Linear regression of the associations between adherence to the Danish Food-Based Dietary Guidelines (FBDG) assessed by a diet quality index (DQI) and cardiometabolic risk factors in a Danish adult population with minimum one self-rated risk factor for Ischaemic heart disease (β-Coefficients per unit DQI and 95 % confidence intervals)
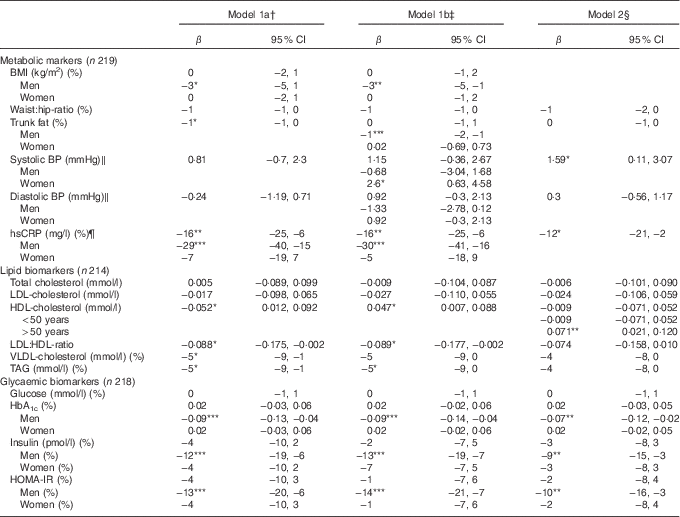
BP, blood pressure; hsCRP, high-sensitivity C-reactive protein; HOMA-IR, homoeostatic model of insulin resistance.
*P<0·05, ** P≤0·01, *** P=0·001.
† Simple linear regression model adjusted for sex and age.
‡ Multiple linear regression analysis adjusted for sex, age, education, physical activity at leisure time.
§ Multiple linear regression analysis adjusted for sex, age, education, physical activity at leisure time and BMI.
‖ n 216, after exclusion of those using BP-lowering medication.
¶ n 204 due to lack in biochemical analyses of hsCRP.
We found an inverse association between DQI and the lipid risk factors – LDL:HDL ratio and TAG (−0·089 per unit DQI; 95 % CI −0·177, −0·002 and −5 % per unit DQI; 95 % CI −9, 0, respectively) – and a positive association between DQI and HDL-cholesterol (0·047 mmol/l per unit DQI; 95 % CI 0·007, 0·088). For men only, we found an inverse association between DQI and BMI (−3 % per unit DQI; 95 % CI −5, −1), trunk fat (−1 % per unit DQI; 95 % CI −2, −1), hsCRP (−30 % per unit DQI; 95 % CI −41, −16) and the glycaemic risk factors, HbA1c (−0·09 % per unit DQI; 95 % CI −0·14, −0·04), insulin (−13 % per unit DQI; 95 % CI −19, −7) and HOMA-IR (−14 % per unit DQI; 95 % CI −21, −7). Furthermore, we found a positive association between DQI and systolic BP in women (2·6 mmHg per unit DQI; 95 % CI 0·6, 4·6).
Under- and over-reporters
Overall, 21 % of the participants were classified as UR and 1 % as OR. Of those classified as UR, 89 % were overweight or obese, 46 % of the UR were men and all of the OR were men.
The associations between DQI and most of the variables included were the same whether UR and OR were included in the analysis or not. However, for the metabolic markers BMI, trunk fat, systolic BP and hsCRP, the interaction between DQI and sex was no longer significant when excluding UR and OR. Except for BMI, the association between DQI and these metabolic markers was now significant for the whole study population (trunk fat: −1 % per unit DQI; 95 % CI −2, −0·4, systolic BP: 1·7 mmHg per unit DQI; 95 % CI 0·08, 3·36, and hsCRP −23 % per unit DQI; 95 % CI −32, −12). Furthermore, the metabolic markers waist:hip-ratio changed from being non-significant to significant (−1 per unit DQI; 95 % CI −2, 0). In addition, the observed positive association between DQI and HDL-cholesterol was only significant in study participants aged 50 years or above when excluding UR and OR from the analysis (0·09 mmol/L per unit DQI; 95 % CI 0·034, 0·045).
Discussion
In the present study, a higher adherence to the current Danish FBDG, assessed by a DQI, was associated with a more beneficial cardiometabolic risk profile in a Danish adult population with a minimum of one self-rated risk factor for IHD. The main findings were the inverse associations between the DQI and the lipid risk factors: LDL:HDL ratio and TAG and the positive association with HDL-cholesterol. For the male study participants, an inverse association between DQI and BMI, trunk fat, hsCRP and the glycaemic risk factors, HbA1c, insulin and HOMA-IR was observed. Furthermore, we found a positive association between DQI and systolic BP in women.
When we controlled for the effect of BMI on cardiometabolic risk factors, the associations between DQI and trunk fat, LDL:HDL ratio and TAG were attenuated and no longer statistically significant, suggesting that BMI could be an important factor in CVD prevention. Of that notion it is important to further investigate whether the association of higher adherence to the Danish FBDG and a more beneficial cardiometabolic risk profile is due to the effect of the Danish FBDG, expressed by DQI, on BMI and body composition, including trunk fat, or whether the association is independent. We only found an inverse significant association between DQI and BMI in men, suggesting that a higher DQI score (indication of a higher adherence to the Danish FBDG) is only associated with a lower BMI in men and not women. The fact that DQI and BMI was only associated in men and not in women could be explained by the higher number of normal-weight women than men, and the higher number of overweight men than women. Moreover, the sex-specific association between DQI and systolic BP and DQI and hsCRP was no longer present when we controlled for the effect of BMI. Here a positive association between DQI and Systolic BP and an inverse association between DQI and hsCRP were seen for the whole study population. Additionally, in the sensitivity analysis excluding UR and OR, a non-sex-specific significant association between DQI and trunk fat, systolic BP and hsCRP was observed. These results suggest that the observed sex-specific associations between DQI and the metabolic biomarkers BMI, trunk fat, systolic BP and hsCRP found in the analysis, including UR and OR, could be explained by dietary report errors. However, the results of the sensitivity analysis should be interpreted with caution, because of potential power issues when removing UR and OR from the analysis.
The inverse relationship between BMI and CRP is well recognised, and, moreover, it has been recognised that with increased adiposity CRP is further elevated( Reference Timpson, Nordestgaard and Harbord 34 ). The link between these risk factors is supported by the results of the present study, where an inverse association between DQI and BMI, trunk fat and hsCRP was found in men.
In addition, when controlling for the effect of BMI, the observed positive association between DQI and HDL-cholesterol was only significant in study participants aged 50 years or above, suggesting that BMI is a more important mediator for HDL-cholesterol levels for people less than 50 years of age. However, genetic studies have lately challenged the common concept of raising HDL-cholesterol as a marker for CVD risk reduction, and further studies are need to investigate the role of HDL-cholesterol in CVD prevention( Reference Zanoni, Khetarpal and Larach 35 , Reference Arsenault and Després 36 ).
A main advantage of this study is the detailed assessment of the dietary data with the habitual diet measured during a 7-d consecutive dietary record using a validated method used for the past two decades in the Danish National Survey of Dietary Habits and Physical Activity( Reference Biltoft-Jensen, Matthiessen and Rasmussen 21 , Reference Pedersen, Christensen and Matthiessen 37 ). In addition, this study uses a DQI based on five food and nutrients from the Danish FBDG relevant for IHD risk, and thus a relatively easy way to measure adherence to the overall current FBDG. A limitation of this study is the observational design of the cross-sectional study, as this design does not allow conclusions on cause and effect relationships. Therefore, extrapolation of the results should only be made with caution as the study participants resided in areas of Greater Copenhagen with a relatively higher level of education compared with the general Danish population( Reference Pedersen, Christensen and Matthiessen 37 ).
The sex-specific results with an inverse association in men only between DQI and the cardiometabolic risk factors BMI, trunk fat, hsCRP, HbA1c, insulin and HOMA-IR are in line with two cohort studies using the HEI( Reference Frazier-Wood, Kim and Davis 38 , Reference Drewnowski, Fiddler and Dauchet 39 ). The cross-sectional study by Drewnowski et al.( Reference Drewnowski, Fiddler and Dauchet 39 ) including 5081 men and women, middle-aged French citizens with low CVD risk, investigated the association between the HEI and cardiovascular risk factors. Here an inverse association between the HEI and BMI was found in men only. Furthermore, Frazier-Woods et al. observed in another cross-sectional study containing 9797 adults men and women, with at least one CVD risk factor, that in men only the HEI score was inversely associated with insulin, HOMA-IR, HDL-cholesterol, TAG and CRP( Reference Frazier-Wood, Kim and Davis 38 ). In contrast to our results, when Frazier-Wood et al. adjusted for BMI, the results were no longer significant. This strengthens the importance of BMI as an important factor in CVD prevention( Reference Frazier-Wood, Kim and Davis 38 ).
The sex-specific differences in the results in the present study could be accounted for by alcohol intake of those of the study participants who drank alcohol (n 194), as the men in the study drank more alcohol than the women. The median alcohol intake of the women was 3·9 E%, whereas the men had a median alcohol intake of 6·5 E%. It could be that men with a higher adherence to the Danish FBDG, expressed by a higher DQI score, also had a lower alcohol intake equivalent to the Danish recommendations of max seven drinks per week, corresponding to approximately 1 drink/d. A recent meta-analysis of 84 prospective cohort studies found that alcohol consumption of 2·5– 14·9 g/d (about ≤1 drink/d) was associated with a lower risk of cardiovascular mortality, compared with abstaining from alcohol( Reference Ronksley, Brien and Turner 40 ). This is supported by the findings of the present study, where we found that a higher DQI score was associated with a more beneficial cardiometabolic risk profile.
One other cross-sectional study by Toft et al. investigated the association between adherence to Danish FBDG, assessed by a DQS and CVD risk factors( Reference Toft, Kristoffersen and Lau 19 ). In this cross-sectional study including 6542 healthy men and women aged 30–60 years, it was found, in line with the findings of the present study, that higher adherence to the Danish FBDG 2005 was associated with a more beneficial CVD risk factor profile. In agreement with our results, Toft et al. also found that the DQS was inversely associated with TAG, but in contrast to our results the DQS was inversely associated with total cholesterol and LDL-cholesterol. However, Toft et al. did not find a positive association between the DQS and HDL-cholesterol like in the present study.
Furthermore, our results are supported by the findings of another cross-sectional study by Babio et al. investigating adherence to a traditional Mediterranean diet (using a 14-point score) and risk of metabolic syndrome, which is a cluster of common CVD risk factors, including central obesity, hyperglycaemia, low HDL-cholesterol levels, hypertension and hypertriglyceridaemia( Reference Babio, Bulló and Basora 41 ). The traditional Mediterranean diet investigated by Babio et al. is characterised by a food pattern high in fruit, vegetables, grains and unsaturated fat and low in saturated fats( Reference Schwingshackl, Schwedhelm and Galbete 42 ). This food pattern is comparable with the five food and nutrient indicators of the DQI used in this present study to investigate adherence to the Danish FBDG. Babio et al. found that a higher adherence to a traditional Mediterranean diet was associated with lower odds of having metabolic syndrome. In addition, Babio et al. found that subjects in the fourth quartile of the Mediterranean diet adherence, when compared with subjects in the lowest quartile of adherence to the Mediterranean diet, had 47 and 54 % lower odds of having low HDL-cholesterol levels and high TAG levels, respectively. However, in contrast to the low-risk middle-aged study participants of the present study, Babio et al. included 808 elderly high cardiovascular risk participants of the Reus PREDIMED Centre.
BP is known to be a variable measurement, and it can be hard to measure accurately. The surprising and unexpected finding of a positive association between the DQI and systolic BP is not in line with previous studies. In a meta-analysis of seventeen randomised controlled trials investigating the effect of dietary patterns on BP in adults, it was found that healthy dietary patterns such as the Nordic diet, the Mediterranean diet and the Dietary Approaches to Stop Hypertension decreased systolic and diastolic BP( Reference Ndanuko, Tapsell and Charlton 43 ).
When comparing the results of the previously mentioned studies and the results of the present study, it is important to be aware of differences between first and foremost the study populations, as some were middle-aged with low CVD risk( Reference Drewnowski, Fiddler and Dauchet 39 ), and some older with features of the metabolic syndrome and therefore were at high CVD risk( Reference Babio, Bulló and Basora 41 ), all of which can have an effect on the results on cardiometabolic risk factors. Moreover, awareness of the different methods of dietary assessment is important, as it could play a role for the accuracy of estimating dietary intake( Reference Toft, Kristoffersen and Lau 19 , Reference Frazier-Wood, Kim and Davis 38 , Reference Drewnowski, Fiddler and Dauchet 39 , Reference Babio, Bulló and Basora 41 ). Furthermore, the DQI used in the present study include various factors of more or less importance for cardiometabolic risk factors. In particular, the score of whole-grain intake included in the DQI is of importance, as a high whole-grain intake is associated with lower risk of CVD( Reference Aune, Keum and Giovannucci 44 ). In addition, looking at the individual scores of the five food and nutrients included in the DQI, the median score for added sugar was higher than the other median individual scores for whole grains, fish, fruit and vegetables and saturated fat, indicating a higher compliance to this specific dietary guideline of a reduced sugar intake.
Using a dietary index approach enabled us to describe associations between food and nutrient intake in individuals with dietary patterns more or less compliant with the current Danish FBDG and cardiometabolic risk factors. Overall, the present cross-sectional study adds to the growing body of evidence that adherence to different national FBDG and diets rich in fruit, vegetables, whole grains, legumes and fish and low in meat and sweets are associated with a better cardiometabolic risk profile.
In conclusion, higher adherence to the current Danish FBDG, assessed by a DQI comprising of five components, was associated with a more beneficial cardiometabolic risk profile in a Danish adult population with a minimum of one self-rated risk factor for IHD. The DQI was inversely associated with BMI, trunk fat, hsCRP and glycaemic biomarkers in men.
The results substantiate the use of the DQI to measure adherence to the current Danish FBDG and associations with cardiometabolic risk factors, and indicate that adherence to the Danish FBDG may be beneficial for prevention of CVD. The results of this study further highlight the need to conduct sex-stratified analyses on CVD risk in this particular target group.
Acknowledgements
The authors would like to thank research assistant Lise Schiff, research assistant Mia Smedmann Lausten and project coordinator Majken Ege for assisting with study materials, coordination and data collection, and senior adviser Tue Christensen for processing the dietary data. Also a special thanks to the staff at the study site at Gentofte Hospital, Denmark, for good collaboration during the data collection periods. Last but not least the authors would like to thank all the study participants for participating in the DIPI randomised controlled trial.
This work is part of the project Diet and Prevention of Ischemic Heart Disease – a Translational Approach study (DIPI), which is supported by the Danish Council for Strategic Research (contract 0603-00488B). The Danish Council for Strategic Research had no role in the design, analysis or writing of this article.
The author contributions are as follows: J. L. A., K. O. and I. T. formulated the research question; J. L. A., C. H. and I. T. contributed to the study design; J. L. A. performed the statistical analyses; J. L. A., C. H., E. W. A., K. O. and I. T. were all involved in the interpretation of the data and critical revision of the manuscript; J. L. A. drafted the manuscript and all authors approved the final version.
None of the authors has any conflicts of interest to declare.
Supplementary material
For supplementary material/s referred to in this article, please visit https://doi.org/10.1017/S0007114517003695


