

Previous studies have shown the interactions between dietary nutrients and gut microbiota, as diets could modulate the composition and functions of commensal microbiota, whereas microbial metabolites could influence host metabolism and immunity( Reference Tremaroli and Backhed 1 , Reference Round and Mazmanian 2 ). Breast milk contains a variety of nutrients and bioactive factors that could affect intestinal microbiome and non-specific immunity in newborns( Reference Cacho and Lawrence 3 , Reference Chen, Xu and Chen 4 ). Many studies have reported on the metabolic effects of milk-derived proteins, anti-bacterial peptides and immunological factors( Reference Cacho and Lawrence 3 , Reference Leon-Sicairos, Lopez-Soto and Reyes-Lopez 5 ), but few have examined lipid-related molecules such as ethanolamine (Etn) that potentially affect gastrointestinal (GI) health and microbiota composition in infants after weaning( Reference Zhou, Xiong and Wang 6 – Reference Nawrocki, Wetzel and Jones 8 ).
Etn primarily occurs as head group of phosphatidylethanolamine (PE), the second most abundant phospholipid in mammalian cells. The free form of Etn presents at varying concentrations in body fluids (e.g. breast milk), respectively( Reference Wishart, Jewison and Guo 9 – Reference Kaval and Garsin 11 ). Etn cannot be synthesised de novo in mammals. Instead, it has to be obtained from the diet or sloughed intestinal epithelial cells as free Etn or PE. Etn concentration in blood of newborns and adults is 52·3 µm (range 26·2–91·9 µm) and 16 µm (0–11·5 µm)( Reference Wishart, Jewison and Guo 9 , Reference Kaval and Garsin 11 ). Mammalian cells maintain intracellular Etn concentrations through low- and high-affinity uptake systems and internal recycling of PE( Reference Cacho and Lawrence 3 , Reference Zhou, Xiong and Wang 6 , Reference Garsin 7 ). Etn can be utilised for de novo PE synthesis in intestinal cells through the cytidine phosphoethanolamine pathway( Reference Selathurai, Kowalski and Burch 12 ). Etn, as an important component of milk, enhances the proliferation of epithelial cells( Reference Nawrocki, Wetzel and Jones 8 , Reference Yang, Xiong and Wen 13 ).
Certain intestinal bacteria including several pathogenic species such as Clostridium, Enterococcus, Escherichia and Salmonella catabolise Etn as a major carbon and/or N source with the aid of Etn utilisation proteins (EutR)( Reference Garsin 7 , Reference Moore and Escalante-Semerena 14 , Reference Lundgren, Sarwar and Pinto 15 ). These species harbour Eut operons and are able to sense Etn through EutR( Reference Anderson and Kendall 16 – Reference Luzader, Clark and Gonyar 18 ). Changes in Etn availability not only alter the colonisation of Etn-utilising bacteria, but also had a significant bearing on the virulence of pathogenic bacteria( Reference Kendall, Gruber and Parker 17 , Reference Anderson, Clark and Adli 19 ). For instance, a 1-µm concentration of Etn is required to activate virulence gene expression in enterohaemorrhagic Escherichia coli in vitro. In fact, Etn detection may act as a general mechanism by which bacteria sense the intestinal and possibly other host-associated environments( Reference Kendall, Gruber and Parker 17 , Reference Patel and Witt 20 ).
For mammalian neonates, weaning is a critical transition period that is characterised with increased risk of enteric infections( Reference Cummins and Thompson 21 ). Previous studies showed that weaning is often accompanied by the disturbance of enteric bacteria and inflammatory response( Reference Minton 22 – Reference Labus, Hollister and Jacobs 24 ). Prolonged enteric inflammation owing to the presence of pathogens can damage intestinal epithelia, compromise nutrient absorption and subsequently lead to malnutrition and growth retardation in early childhood( Reference Lunn 25 , Reference Russ, Barnett and McNabb 26 ). Weaning changes Etn availability to both host intestinal epithelial cells and gut microflora. The effect of dietary supplementation of Etn on host intestinal integrity and gut microbiome in post-weaning mammalian animals is largely unknown. The virulence and metabolism of pathogens such as Escherichia and Salmonella is dependent on Etn( Reference Kendall, Gruber and Parker 17 , Reference Patel and Witt 20 ). Our previous studies also showed that Etn could enhance the proliferation of enterocytes and improve the growth performance of weaned piglets( Reference Yang, Xiong and Wen 13 , Reference Yang, Xiong and Li 27 ). On the basis of previously published research, we hypothesised that Etn could influence host metabolism by modulating the composition and functions of commensal microbiota in weaned rats. Therefore, the objective of this experiment was to investigate whether Etn shapes gut microbiota composition and intestinal functions during the period of weaning using rat as a model.
Methods
Animals and experimental design
Experimental procedures were reviewed and approved by the Animal Care and Use Committee of the Chinese Academy of Sciences( Reference Yin, Yao and Liu 28 ). Male Sprague–Dawley rats (n 40, 21 d old) were obtained from Hunan SJA Laboratory Animal Co. and maintained in a specific pathogen-free facility at Hunan Normal University for over 2 weeks. Animals were stratified by body weight and randomly assigned to one of four groups, including the control group without Etn supplements (A), and three treatment groups that were supplemented with 250, 500 and 1000 μm Etn (99·0 %; Sigma-Aldrich; CAS: 141-43-5) in drinking water for a 14-d period (B, C and D). Animals were fed individually with free access to drinking water during the study.
Animal management and sample collection
Feed and water intake were recorded daily. The body weight was recorded at the beginning of the experiment and on days 7 and 14. Growth performance was calculated as average daily gain (ADG), average daily water intake, average daily feed intake (ADFI) and feed:gain ratio. Animals were euthanised at the end of the experiment; the colon contents were collected and snap-frozen in liquid N2 until DNA extraction. The mid-jejunum was collected, rinsed with ice-cold PBS and divided into two segments. One segment (approximately 1–2 cm) was fixed with 4 % formaldehyde in phosphate buffer and stored at 4°C for analysis of mucosal morphology. The other was used for collecting the mucosa. The mucosa cell layers were scraped off and rapidly frozen in liquid N2.
Mucosal morphology
Jejunal segments of the small intestine preserved in 4 % formaldehyde mixed with glutaraldehyde were embedded in paraffin and sectioned at the thickness of 5 μm. Tissue sections were stained with haematoxylin–eosin( Reference Xiong, Yang and Wang 29 ). Villus height (VH) and crypt depth (CD) were measured under a light microscope at 40× magnification using an image processing and analysis system (Leica Imaging Systems). A minimum of ten well-oriented, intact villi were measured from the crypt mouth to the villous tip, and all measurements were made (villous height and CD) in 10-µm increments. Intraepithelial lymphocytes (IEL) and goblet cells (GC) per 100 epithelial cells along an intact villous were counted, and the count was repeated five times for each section in each rat.
Analysis of antioxidative index and cytokine expression in mucosa of the small intestine
Jejunal mucosa was homogenised in 0·9 % ice-cold saline solution using an IKAT8 Ultra-Turrax tissue homogeniser (Merck) and then centrifuged at 3000 g at 4 °C for 10 min. The supernatant was collected for measurement of cytokines, secretory Ig (SIg)A and antioxidant capacity. The concentrations of cytokines (IL-1β, IL-2, IL-6 and IL-10) and sIgA were measured using commercial ELISA kits (Cusabio Biotech Co.) according to the manufacturer’s instructions. The antioxidant capacity was determined by measuring catalase, malondialdehyde (MDA), superoxide dismutase (SOD), alkaline phosphatase (ALP), glutathione peroxidase (GSH-px) and total antioxidation capacity (T-AOC) using commercial assay kits (Nanjing Jiancheng Bioengineering Institute). Jejunal mucosal cytokines, SIgA and antioxidant indices were normalised with the protein concentration of each sample.
Microbiota analysis using 16S RNA high-throughput sequencing
The colon contents of eight rats from each group were randomly chosen for microbiota analysis. Total bacterial DNA was extracted from approximately 0·25 g of colon contents using a QIAamp DNA Stool Mini kit (Qiagen). The diversity and composition of bacterial community was determined by high-throughput sequencing of the microbial 16S rDNA gene. The V4 hypervariable region of 16S rRNA gene was PCR-amplified using 515F (5'-GTGCCAGCMGCCGCGGTAA-3') and 806R (5'-GGACTACHVGGGTWTCTAAT-3') primers, Illumina adaptors and molecular barcodes. Paired-end sequencing was performed on an Illumina HiSeq2500 platform (Novogene). Raw 16S data sequences were screened and assembled using QIIME version 1.7.0( Reference Caporaso, Kuczynski and Stombaugh 30 ) and FLASH software packages. UPARSE version 7.0.1001( Reference Edgar 31 ) was used to analyse these sequences and define operational taxonomic units (OTU). High-quality sequences were aligned against the SILVA reference database (https://www.arb-silva.de/) and clustered into OTU at a 97 % similarity level using the UCLUST algorithm (https://drive5.com/usearch/manual/uclust_algo.html). Each OTU was assigned to a taxonomic level with the Ribosomal Database Project classifier program version 2.20 (https://rdp.cme.msu.edu/). The assembled HiSeq sequences obtained in the present study were submitted to NCBI’s Sequence Read Archive (SRA, no. PRJNA414306).
Metagenomic prediction and metabolic phenotype analysis
Functional metagenomes of all samples were predicted using PICRUSt version 1.1.0( Reference Langille, Zaneveld and Caporaso 32 ). OTU were selected against the Greengenes version 13_5 database according to instructions provided for the Genome Prediction Tutorial for PICRUSt( Reference Labus, Hollister and Jacobs 24 , Reference Mukherjee, Chettri and Langpoklakpam 33 ). Metagenomes were predicted from the copy number-normalised 16S rRNA data in PICRUSt using the predict_metagenomes.py script against the functional database of Kyoto Encyclopedia of Genes and Genomes (KEGG) Orthology. Functional categories at different levels were computed with the script categorize_by_function.py and visualised with the script plot summarize_taxa_through_plots.py. Functional differences within groups were evaluated using linear discriminant analysis (LDA) effect size (LEfSe) and a specific analysis was performed with the Galaxy server( Reference Mukherjee, Chettri and Langpoklakpam 33 ). The output files from the PICRUSt analysis were uploaded to the Statistical Analysis of Metagenomic Profiles version 2.1.3 software on Microsoft Windows for further statistical analysis and graphical depiction of all predicted functional data sets( Reference Parks, Tyson and Hugenholtz 34 ). BugBase was used to predict organism-level microbiome phenotypes based on 16S RNA data sets and mapping files according to the tutorial documentation( Reference Ward, Larson and Meulemans 35 ).
Statistical analysis
Statistical analyses were performed using SPSS software (SPSS Inc.). α and β diversity were analysed with QIIME version 1.7.0 (http://qiime.org/1.7.0/) and displayed with R version 2.15.3 software (https://www.r-project.org/). For PICRUST results, differences among groups were compared by one-way ANOVA and the Tukey–Kramer multiple comparisons test. Data are presented as means, and P<0·05 were considered statistically significant and 0·05<P<0·1 was considered as tending towards significance. Phenotypic differences were compared with the Mann–Whitney U test with false discovery rate correction.
Results
Effect of ethanolamine on growth and intestinal morphology in weaning rats
Rats receiving 250 μm Etn tended to have greater ADFI (P=0·052) than control animals (Table 1). However, no differences were observed for ADG, F:G ratio among the four groups. Supplementation of Etn did not affect morphology of small intestine in terms of VH, CD and/or VH:crypt ratio. Weaned rats supplemented with 500 or 1000 μm Etn had higher lymphocyte counts than those in the 250-μm Etn group (P=0·011), but not different compared with those in the control group. There were no differences observed in the number of GC among groups.
The effect of ethanolamine (Etn) on growth performance and the morphology of small intestine of weaned ratsFootnote * (Least square means with their standard errors; n 8/group)
ADFI, average daily feed intake; ADWI, average daily water intake; ADG, average daily gain; F:G, feed:gain ratio; VH, villus height; CD, crypt depth; VH:CD, villus height:crypt depth ratio.
a,b Mean values within a row with unlike superscript letters are significantly different (P<0·05).
* Data were analysed by one-way ANOVA followed by Tukey’s multiple comparisons test.
Effect of ethanolamine on antioxidant capacity and mucosal immunity in weaned rats
Weaned rats administered 500 μm Etn had higher levels of SOD in the jejunal mucosa compared with those in the control or 250 μm Etn groups (P=0·004) (Table 2). Rats receiving 500 μm Etn had higher levels of GSH-px (P=0·007) and ALP (P=0·040) compared with those in the control group, but there was no difference in comparison with the other two Etn-supplemented groups. The concentrations of CAT, MDA, T-AOC, cytokines and sIgA in the jejunal mucosa were not different among groups.
Effect of ethanolamine on the small intestine’s mucosal antioxidant capacity and cytokines of weaned ratsFootnote * (Least square means with their standard errors; n 8/group)
CAT, catalase; MDA, malondialdehyde; SOD, superoxide dismutase; ALP, alkaline phosphatase; GSH-px, glutathione peroxidase; T-AOC, total antioxidant capacity; sIgA, secreted Ig.
a,b Mean values within a row with unlike superscript letters are significantly different (P<0·05).
* Data were analysed by one-way ANOVA followed by Tukey’s multiple comparisons test.
Ethanolamine alters the composition of colonic microbiota of weaned rats
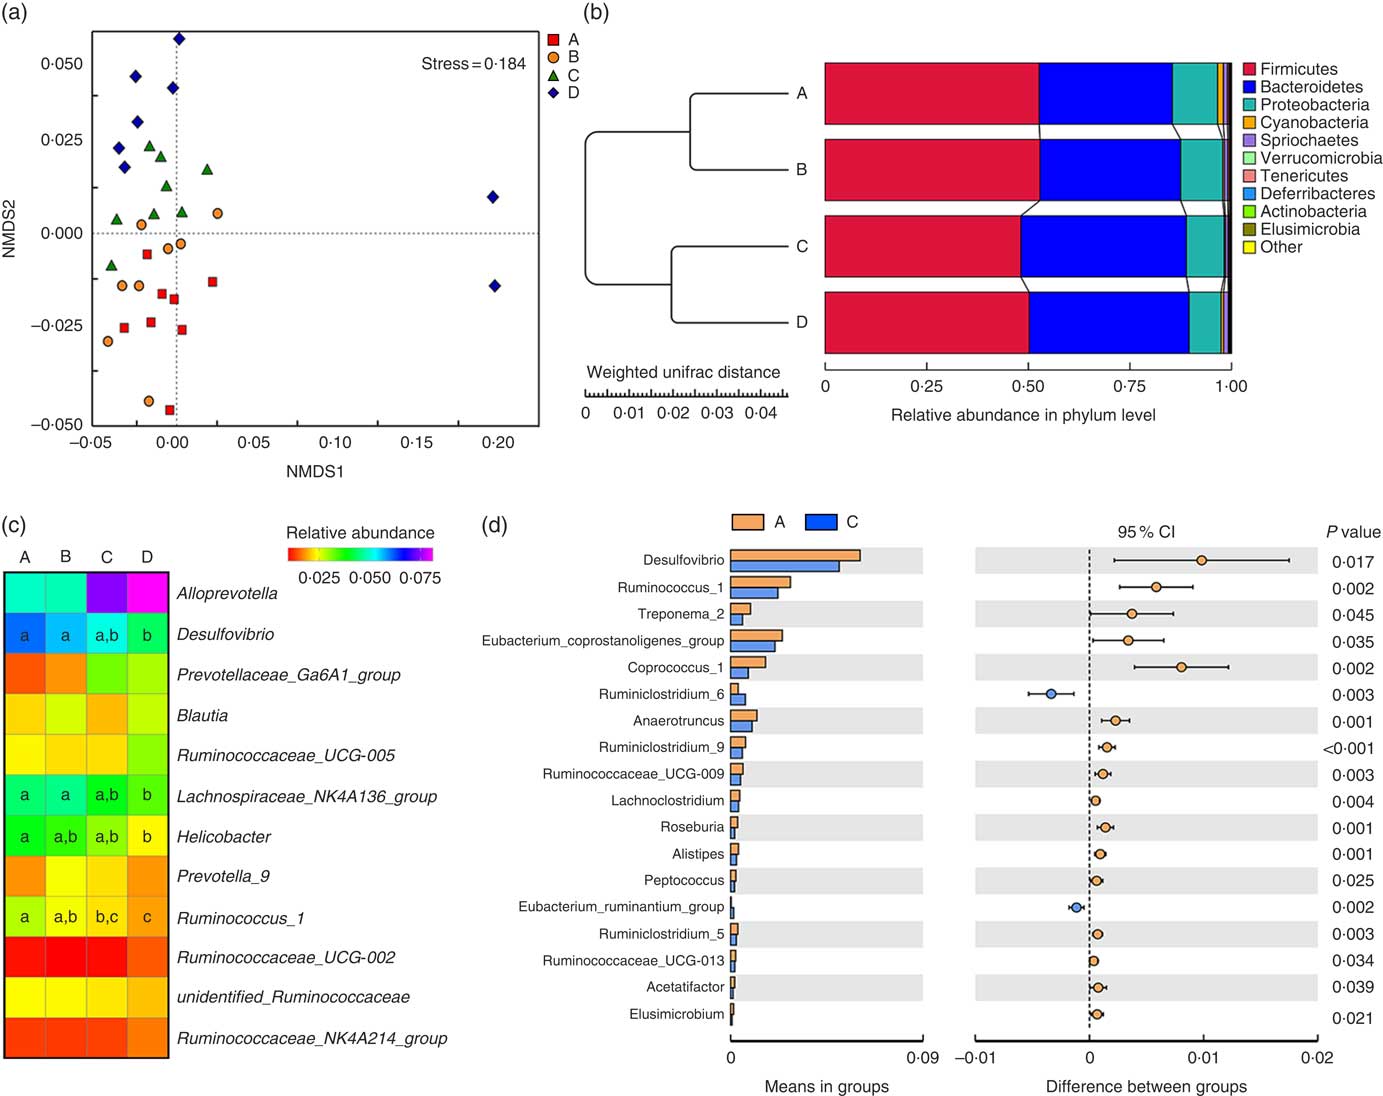
Weaned rats administered 1000 µm Etn had lower Simpson’s index (P≤0·05) compared with those in the control and 250-μm Etn-treated group, whereas no differences in Shannon, Chao1 and ACE diversity were observed among groups (P<0·05) (online Supplementary Table S1). The compositional differences were identified between Etn-treated and control groups by principal coordinate analyses using the Bray Curtis distance parameter (online Supplementary Fig. S1a) and Adonis results could be found in the online Supplementary Table S2. The non-metric multi-dimensional scaling plots of β diversity showed that there were differences at the phylum level of microbial composition among the Etn treatment groups (Fig. 1(a) and Table 3).
Ethanolamine (Etn) influences colonic microbiota composition in weaning rats. (a) Non-metric multi-dimensional scaling (NMDS2) plots of β diversity. (b) Pair-group method with arithmetic mean plot with weighted unifrac distance of β diversity. (c) The change in the relative abundance of predominant genera as a response to increased ethanolamine levels. (d) Etn shaped distinct different microbiota in genus level from the control group at a concentration of 500 μm.
Ethanolamine alters colonic microbiota community compositionFootnote *
a,b Mean values within a row with unlike superscript letters are significantly different (P<0·05).
* Data were analysed with the t test and are presented as the relative abundance of specific taxonomic groups.
Firmicutes, Bacteroidetes and Proteobacteria were the most abundant phyla, and there were no differences in the relative abundance of Firmicutes among the four groups (Fig. 1(b)). Bacteroidetes was more prevalent in the 500- and 1000-µm groups than in the other groups; however, Proteobacteria, Elusimicrobia and Tenericutes were lower abundant in those groups compared with the control and 250-μm Etn groups (Table 3). Rats in the 500-μm Etn group also had lower abundance (P<0·05) of Spirochaetes compared with rats in the other groups. Within the predominant genera (top twelve most abundant genera), the relative abundance of Desulfovibrio and Lachnospiraceae_NK4A136_group, Helicobacter and Ruminococcus_1 were significantly lower in Etn-treated groups (250, 500 or 1000 µm) compared with the control group (Fig. 1(c)). A comparison of the composition of control and 500 μm groups at the genus level revealed 18 OTU whose abundance was altered by 500 μm Etn; only Ruminiclostridium_6 and Eubacterium_ruminantium_group were relatively higher in the group treated with 500 μm Etn, whereas others were more abundant in the control group (Fig. 1(d)). Helicobacter ganmani, Clostridium leptum, E. coli and Ruminococcus flavefaciens are the most abundant species in present study, and there were no significant differences in the species among the four groups (online Supplementary Fig. S1b and Table S3).
Changes in metabolic functions of colonic microbiota driven by ethanolamine
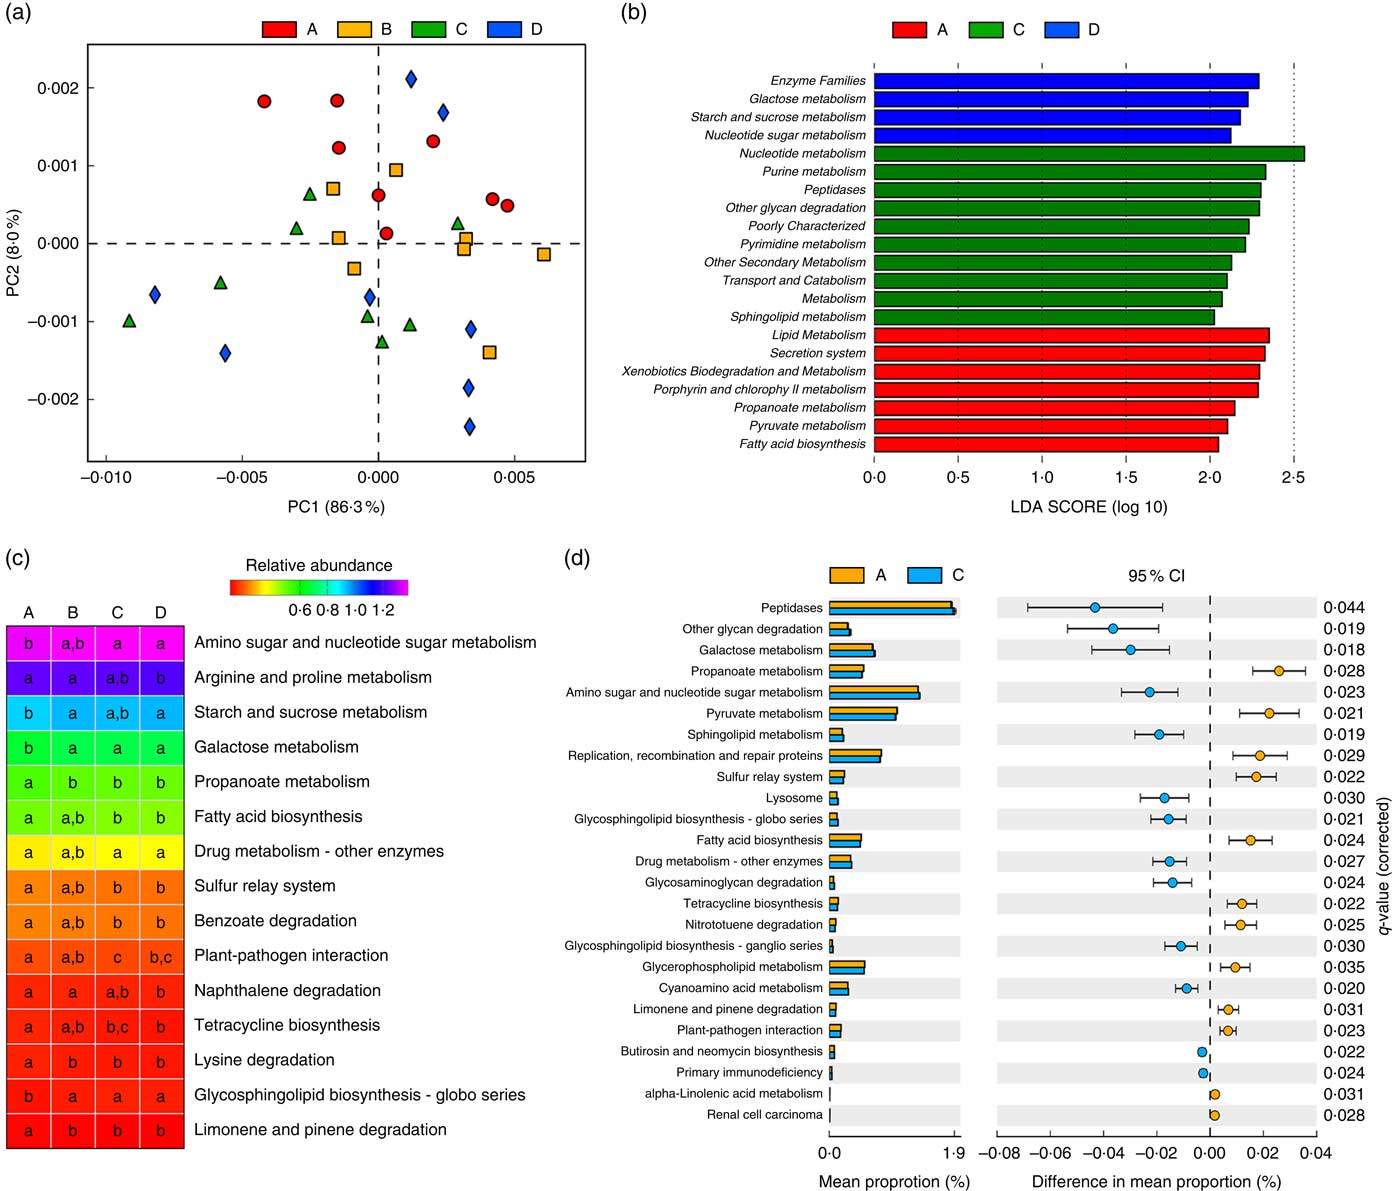
Owing to the significant changes in the composition of gut microbiota, functional annotations of the microbiota were performed using PICRUSt. In the KEGG taxonomy level 3, twenty functional profiles that significantly differed among groups were taken into investigation (online Supplementary Table S4). A principal components analysis of functional profiles revealed that Etn modulated microbial function in a dose-dependent manner (Fig. 2(a)), which was consistent with the compositional differences described above (Fig. 1(a) and (b)). There were no functional differences between control and 250-μm Etn groups by LEfse (LDA score=2) analysis at KEGG taxonomic levels 2 and 3. However, Etn altered microbial metabolism and cellular processes at concentrations of 500 or 1000 μm compared with the control group (Fig. 2(b)). Major metabolic functional pathways (at KEGG Level 3) were altered by different levels of Etn. Arginine and proline metabolism and fatty acid biosynthesis were decreased at a 1000-μm Etn dose, whereas galactose metabolism and glycosphingolipid biosynthesis were enhanced (Fig. 2(c)). As revealed above, there did exist distinct differences in microbial structure of colonic microbiota driven by 500 μm when compared with the control group (Fig. 1(d)). Correspondingly, significant functional differences between the control and 500-μm Etn groups were found, including galactose and sphingolipid metabolism, lysosome and fatty acid biosynthesis and other important metabolic pathways or cellular events (Fig. 2(d)).
Predictive functional profiling of microbiota at different ethanolamine (Etn) concentrations. (a) Principal components (PC) analysis plot of functional profiles upon Etn supplementation. (b) LEfse analysis at different Kyoto Encyclopedia of Genes and Genomes (KEGG) taxonomic levels (linear discriminant analysis (LDA) score=2); there were no functional differences between A and B (250 μm). (c) KEGG pathways (at level 3) altered by different Etn concentrations. (d) Functional differences between rats treated with 500 μm Etn and controls. Data were analysed with Welch’s t test followed by a Tukey multiple comparisons test with Benjamin false discovery rate P value correction.
Ethanolamine alters the metabolic phenotype of colonic microbiota of weaned rats
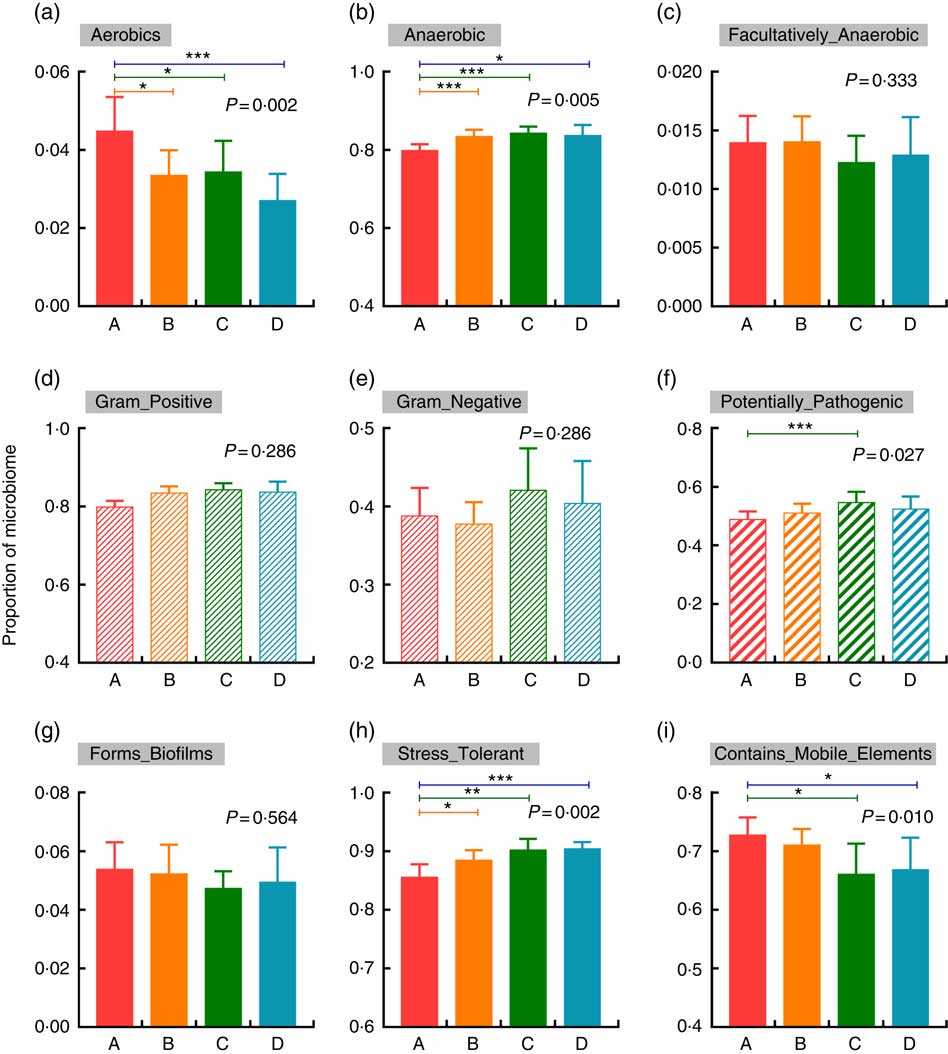
BugBase was used to verify the impacts of increased Etn on microbial metabolic phenotypes. In comparison with the control group, treatment with 250, 500 or 1000 μm Etn decreased and increased the proportions of aerobic and anaerobic bacteria, respectively (P<0·05; Fig. 3(a) and (b)). There were no differences in counts of facultative anaerobic bacteria, biofilm formation and the abundance of gram-positive and gram-negative bacteria among the four groups (Fig. 3(c)–(e), (g)). Moreover, 500-μm Etn treatment increased the proportion of potentially pathogenic species (Fig. 3(f)). In addition, stress tolerance was increased and the prevalence of mobile elements was decreased at concentrations of 500 or 1000 μm Etn relative to controls (Fig. 3(h) and (i)).
Changes in the metabolic phenotype of microbiota by increased ethanolamine (Etn) concentrations. (a–c) Oxygen utilisation. (d–e) Gram bacterial classification. (f) Pathogenic risk. (g) Biofilm formation. (h) Oxidative stress tolerance. (i) Mobile genetic element content. Results are from BugBase and the relative abundances of discrete phenotypes were compared with pair-wise Mann–Whitney U tests with false discovery rate correction. * P<0·05, ** P<0·01, *** P<0·001.
Discussion
Etn is present in the blood and breast milk of mammals, and breast-feeding increases the accumulation of Etn in the GI tract of infants( Reference Wishart, Jewison and Guo 9 , Reference Kaval and Garsin 11 ). Our previous study showed that Etn, as an important component of milk, enhanced the proliferation of intestinal epithelial cells and promoted intestinal development and growth performance of weaned piglets( Reference Yang, Xiong and Wen 13 , Reference Yang, Xiong and Li 27 ). However, the effects of Etn on intestinal function and microbiota of mammals need to be further elucidated.
This study showed that there was no significant change on growth performance of weaned rats in response to Etn supplementation. The different response to Etn treatment on growth outcome between pig and rats could be because of animal species. Another possible explanation is that the breakdown of PE, which derived from ingested food and the turnover/exfoliation of intestinal epithelial cells, may cause the different response with regard to growth performance( Reference Nawrocki, Wetzel and Jones 8 , Reference Patel and Witt 20 ). ALP is dependent on epithelial cell differentiation, and it is considered a key marker enzyme of cell differentiation in mature mammals( Reference Buddington 36 , Reference Hodin, Chamberlain and Meng 37 ). A previous study showed that the gene expression of small intestinal ALP and catalytic affinity was decreased after weaning in pigs( Reference Lackeyram, Yang and Archbold 38 ). The intestinal VH or VH:CD ratio is a useful criterion to estimate the nutrient digestion and absorption of the small intestine. Although the morphology was unchanged among the four groups, the activity of ALP increased in the 500-uM Etn group compared with the other groups. This result indicated that Etn did not affect the digestion and absorption of small intestine, which is consistent with the growth performance; however, it may promote the maturation of the enterocyte of weaned rats( Reference Nawrocki, Wetzel and Jones 8 , Reference Kaval and Garsin 11 , Reference Patel and Witt 20 ).
Weaning-associated stress factors could disrupt oxidative balance and cause oxidative injury to the intestinal epithelium( Reference Yin, Wu and Xiao 39 ). SOD and GSH-px are main antioxidant enzymes that neutralise superoxide anion( Reference Cand and Verdetti 40 ). The present study showed that the activities of both enzymes in the jejunal mucosa were increased in response to Etn treatment, suggesting enhanced endogenous antioxidant capacity in enterocytes. Cytokines play an important role in the immune activation and inflammatory response. The expression of IL-1β and IL-6 was up-regulated in the small intestine immediately post weaning (0–2 post weaning) and returned to preweaning levels in the following 2–8 d( Reference Pie, Lalles and Blazy 41 ). We did not observe differences in cytokines or sIgA concentrations in jejunal mucosa among groups. Intestinal IEL are part of the mucosal immune system and have been considered to serve a critical role in the mucosal immune system by performing a variety of regulatory functions, including cytokine production and so on( Reference Van Kaer, Algood and Singh 42 , Reference Li, Zhang and Zhou 43 ). Although the number of IEL on the jejunal mucosa in the 500 or 1000μm Etn group were the highest, there was no significant difference in comparison with that of the control group. This result was consistent with our finding on the cytokine expressions of jejunal mucosa and sIgA, which collectively suggested that Etn treatment did not induce enteric inflammation in weaned rats.
The interactions between the mammalian host and the microbiota have a significant impact on health and disease. Etn is an essential component of cell membranes and has profound signalling activity within mammalian cells by modulating inflammatory and intestinal physiology( Reference Anderson, Clark and Adli 19 ). Etn treatments did not have significant impacts on microbial richness but altered microbial diversity and community structure. As in most mammals, the gut microbiome is dominated by four bacterial phyla: Firmicutes, Bacteroidetes, Actinobacteria and Proteobacteria( Reference Ley, Hamady and Lozupone 44 ). In the present study, the identified phylotypes include ten bacterial divisions, and it was dominated by two major phyla: Firmicutes (48–52 %) and Bacteroidetes (32–40 %). Etn-treated groups had a higher proportion of Bacteroidetes and lower proportion of Proteobacteria and cyanobacteria. A Previous study showed the higher numbers of Bacteroides in overweight women than in normal-weight women, suggesting a link between obesity and microbiota( Reference Collado, Isolauri and Laitinen 45 ). Metabolic pathways of colonic microbial communities involved in nutrient harvest were enriched in response to Etn treatment in the present study, which may indicate that gut microbiota should play a significant role in energy metabolism( Reference Srikumar and Fuchs 46 , Reference Kinross, Darzi and Nicholson 47 ).
This study also showed that the abundance of bacteria (e.g. E. coli) that can utilise Etn decreased with the increase of Etn doses, which was different in contrast to previous reports( Reference Kendall, Gruber and Parker 17 , Reference Srikumar and Fuchs 48 ). In addition, Etn altered the composition of colonic microbiota including the Spirochaetes, Tenericutes and Elusimicrobia taxa when it was supplemented at 500 and 1000 μm. Rats in the 500-μm Etn group had the lowest abundance of Spirochaetes than rats in the other groups, which is an enteric pathogen that causes intestinal disorder in a variety of animal species. The present study also highlighted that Etn treatment enhanced intestinal antioxidant defence of microbiota in weaned rats, which may be consistent with the decreased antioxidant capacity of jejunum. Microbial density increases both from the proximal to the distal gut (in the jejunum up to 104 cells/g, and in the colon up to 1012 cells/g)( Reference Pie, Lalles and Blazy 41 ). We speculated that the Etn may also affect the jejunal microbiome, which expands the host’s own biochemical and metabolic capacity. Although the beneficial dosage of Etn is 500 μm, this study also showed that Etn treatments increased the risk of potential pathogens at 500 μm. This result indicted that Etn’s dual role, as a C/N source and a signalling molecule, is beginning to emerge. Further research needs to be conducted to explore the effects of Etn on the function of host-specific microbiota.
In conclusion, we demonstrated here that Etn treatment improved intestinal antioxidant capacity and increased the intestinal cell differentiation marker enzyme activity. In addition, Etn increased anaerobic microbe populations and oxidative stress tolerance of colonic microbiota in weaning rats. These results indicate that suitable Etn supplementation may be helpful for the development of infant’s intestine by altering gut microbiome and mucosal antioxidant capacity. Additional studies are needed to further clarify the effects of Etn on function of host-specific microbiota and the role of Etn in altering host–microbial interactions.
Acknowledgements
The authors thank Shanghai E.K.M Biotechnology Company for material assistance.
This work was supported by grants from the National Natural Science Foundation of China (31572420; 31330075).
The authors’ contributions were as follows: J. Z., X. X. and Y.-L. Y. designed the study; J. Z., L.-J. Z. and K.-X. W. performed the experiments and collected samples; J. Z. and X. X. analysed the data and wrote the manuscript; and Y.-L. Y., X. X., P. J. and J. Z. revised the manuscript.
The authors declare that the research was conducted in the absence of any commercial or financial relationships that could be construed as a potential conflict of interest.
Supplementary material
For supplementary material/s referred to in this article, please visit https://doi.org/10.1017/S0007114518001101


