


Malnutrition refers to a deficiency or excess intake or imbalance, or altered utilisation of nutrients, which comprises undernutrition, overweight/obesity and micronutrient-related malnutrition(1). Every country is affected by one or more forms of malnutrition, and combating it in all its forms is a global challenge. In 2022, under the age of 5 years, an estimated 148 million children had low length for age z score (LAZ), 45 million had low weight for length/height z score (WLZ) and 37 million were overweight or obese(2). In India, as per the National Family Health Survey (NFHS-5; 2019–2021), the prevalence of stunting was 35·5 %, wasting 19·3 % and underweight 32·1 %(3).
Growth measurements with normal growth patterns were considered the gold standard for the health and well-being of children(Reference McDowell, Fryar and Ogden4). Nutritional assessment and classification include anthropometric measurements, food and nutrient intake, biochemical data, medical tests and physical examination findings(Reference Kesari and Noel5). Major anthropometric measurements include height; weight; head circumference (HC); body circumferences like waist, arm, hip and limbs; and skinfold thickness(Reference Casadei and Kiel6). These anthropometric measurements are often used as indices like BMI, WLZ, weight for age z score (WAZ), LAZ, etc., for estimating and comparing the burden of malnutrition. Even though anthropometry is widely used to assess malnutrition, none of its indices can be considered a gold standard. Each has its own advantages and limitations, and should be interpreted in the context of the overall pattern of anthropometric failure. Their main value lies in how well they predict mortality and morbidity in different settings(Reference Kerac, McGrath and Connell7,Reference Myatt, Khara and Collins8) .
Growth Monitoring and Promotion(9) has existed even in low- and middle-income countries since the mid-1980s(Reference Liu, Long and Garner10) to improve individual child nutrition and health and eventually to reduce child mortality. WLZ has been used as an indicator to identify and diagnose acute malnutrition in hospital settings. However, being expensive and requiring rigorous training makes WLZ a complex measurement in a community setting and is prone to intra- and inter-observer inaccuracies(Reference Myatt, Khara and Collins8,Reference Kapil, Pandey and Bansal11) . Furthermore, in low- and middle-income countries, assessment or identification of malnutrition using WLZ/WAZ/LAZ for studies is cumbersome due to low resource availability. Moreover, the portable instruments with high precision are quite expensive(Reference Haque, Choudhury and Farzana12). In addition, these indices, WLZ and mid-upper arm circumference (MUAC), identify a different group of eligible children for treatment for acute malnutrition based on the existing cutoffs of diagnosis(Reference Grellety and Golden13), and they document a different value of the burden of the condition. Moreover, MUAC is less dependent on body proportions, and even children with the same WLZ may fall below the cutoff points of MUAC if they are younger or shorter, which supports increasing MUAC cutoffs for programmatic reasons(Reference Grellety and Golden13–Reference Briend, Maire and Fontaine15).
In this analysis, we aimed to identify the prevalence of undernutrition using the composite index of anthropometric failure (CIAF)(Reference Nandy, Svedberg and Preedy16) in children based on different anthropometric measurements and the concordance between various forms of malnutrition (stunting, wasting, underweight and low MUAC as per WHO definitions(17)) among children in the age group 5–19 months. As the WHO defines acute malnutrition as either a WLZ ≤ –2 sd of the median or a MUAC < 125 mm, we further explored the utility of applying these criteria individually or in a stepwise approach. We also estimated the ideal cutoff values for MUAC and mid-upper arm circumference z score (MUACZ) to utilise the MUAC/MUACZ as an initial screening tool for identifying children with acute malnutrition.
Participants and methods
Here, we present the findings of a secondary analysis from a community-based open-label age-stratified randomised pre-proof-of-concept (pre-POC) trial(Reference Marconi, Sinha and Apte18). We pre-screened children aged 5–19 months to identify children with moderate acute malnutrition by a door-to-door survey. Based on the predefined inclusion and exclusion criteria published elsewhere(Reference Marconi, Sinha and Apte18), children aged 6–18 months were recruited for the pre-POC study. The pre-POC study assessed the acceptability of a novel supplementary food labelled microbiota-directed complementary food (MDCF) in treating children with non-complicated moderate acute malnutrition (MAM) and the feasibility of conducting a larger proof-of-concept trial in India. The study was conducted in three different geographical localities (Vellore, Pune and Delhi) in India between December 2022 and September 2023. The trial was approved by the institutional research ethical committees from the participating sites, and the trial was registered at the Clinical Trial Registry of India(19) (CTRI/2023/01/048716).
The clinical trial included children with non-complicated MAM, and the current secondary analysis used the pre-screening data from the Vellore site, which identified eligible children for the pre-POC study. Vellore city is divided into four administrative zones with ∼500 000 population spanning around 87·915 sq. km. The study was conducted in low to middle-socio-economic neighbourhoods in and around zones three and four, covered under the health and demographic surveillance system (HDSS) established by Christian Medical College Vellore. Weight and length were measured as eligibility criteria for the clinical trial. In addition, we collected MUAC and HC at the time of pre-screening for this specific secondary analysis. We included all the participants with available written consent from their parents for anthropometric measurements and weight, recumbent length, MUAC, date of birth and sex available from the pre-screening data.
Anthropometric measurements
The trained field team conducted house-to-house visits to identify eligible children. Anthropometric measurements such as weight, recumbent length, MUAC and HC were measured after obtaining written informed consent from the parents of the children. The weight was measured using a digital scale (Seca 354)(20) accurately up to 10 g, calibrated every morning using standard weights and length using an infantometer (Seca 417)(21) accurately up to 0·1 cm. MUAC and HC were measured using a non-stretch Teflon Seca 212(22) measuring tape accurately up to 0·1 cm. Before the study, the team was trained and standardised for their procedures according to the WHO guidelines(23). Anthropometric measurements were conducted independently by a field team of two research assistants, and the average of their measurements was accepted if the discrepancies between the first and second reader’s values were within specified limits (less than 0·7 cm for length, 0·5 cm for MUAC HC and 50 g for weight); otherwise, the measurements were repeated.
Statistical analysis
Categorical variables were presented as counts and percentages and continuous variables as mean (sd). We used a 95 % CI, and a P-value < 0·05 was considered statistically significant. Children with data available on weight, length, MUAC, date of birth and child sex were included in the analysis, as MUAC and HC were not mandatory to collect as per the pre-POC study protocol. WLZ, WAZ, LAZ and MUACZ were calculated using the WHO 2006 growth standards using Stata Macro(24). Even though the MUACZ score index is not programmatically relevant, we intend to include them as well as an additional anthropometric index, considering the potential of using MUACZ score tapes(Reference Miller, Mallory and Escobedo25,Reference Aydın, Dalgıç and Kansu26) . Primarily, we calculated the burden of different forms of malnutrition and anthropometric deficits and assessed the concordance between these measurements using a Venn diagram. Mean anthropometric values in various categories of the CIAF(Reference Nandy, Svedberg and Preedy16), an index proposed by Svedberg in 2000 that identifies all under-nourished children, be they stunted, wasted/or underweight, were calculated. A test of linear trend analysis was performed across the age groups. We also presented sensitivity, specificity and positive and negative predictive values for MUAC and MUACZ scores in identifying malnutrition assessed by WLZ, WAZ and LAZ. The agreement of MUAC and MUACZ scores with WLZ/WAZ/LAZ was estimated using the kappa statistic(27). An ideal cutoff to be used for MUAC and MUACZ scores in identifying malnutrition assessed by WLZ, WAZ and LAZ was evaluated using the receiver operator characteristic curve(Reference Hoo, Candlish and Teare28). The data were analysed using STATA version 18·0(29), and data visualisation was done using R Studio (packages-pROC, ggplot2, VennDiagram)(30).
Results
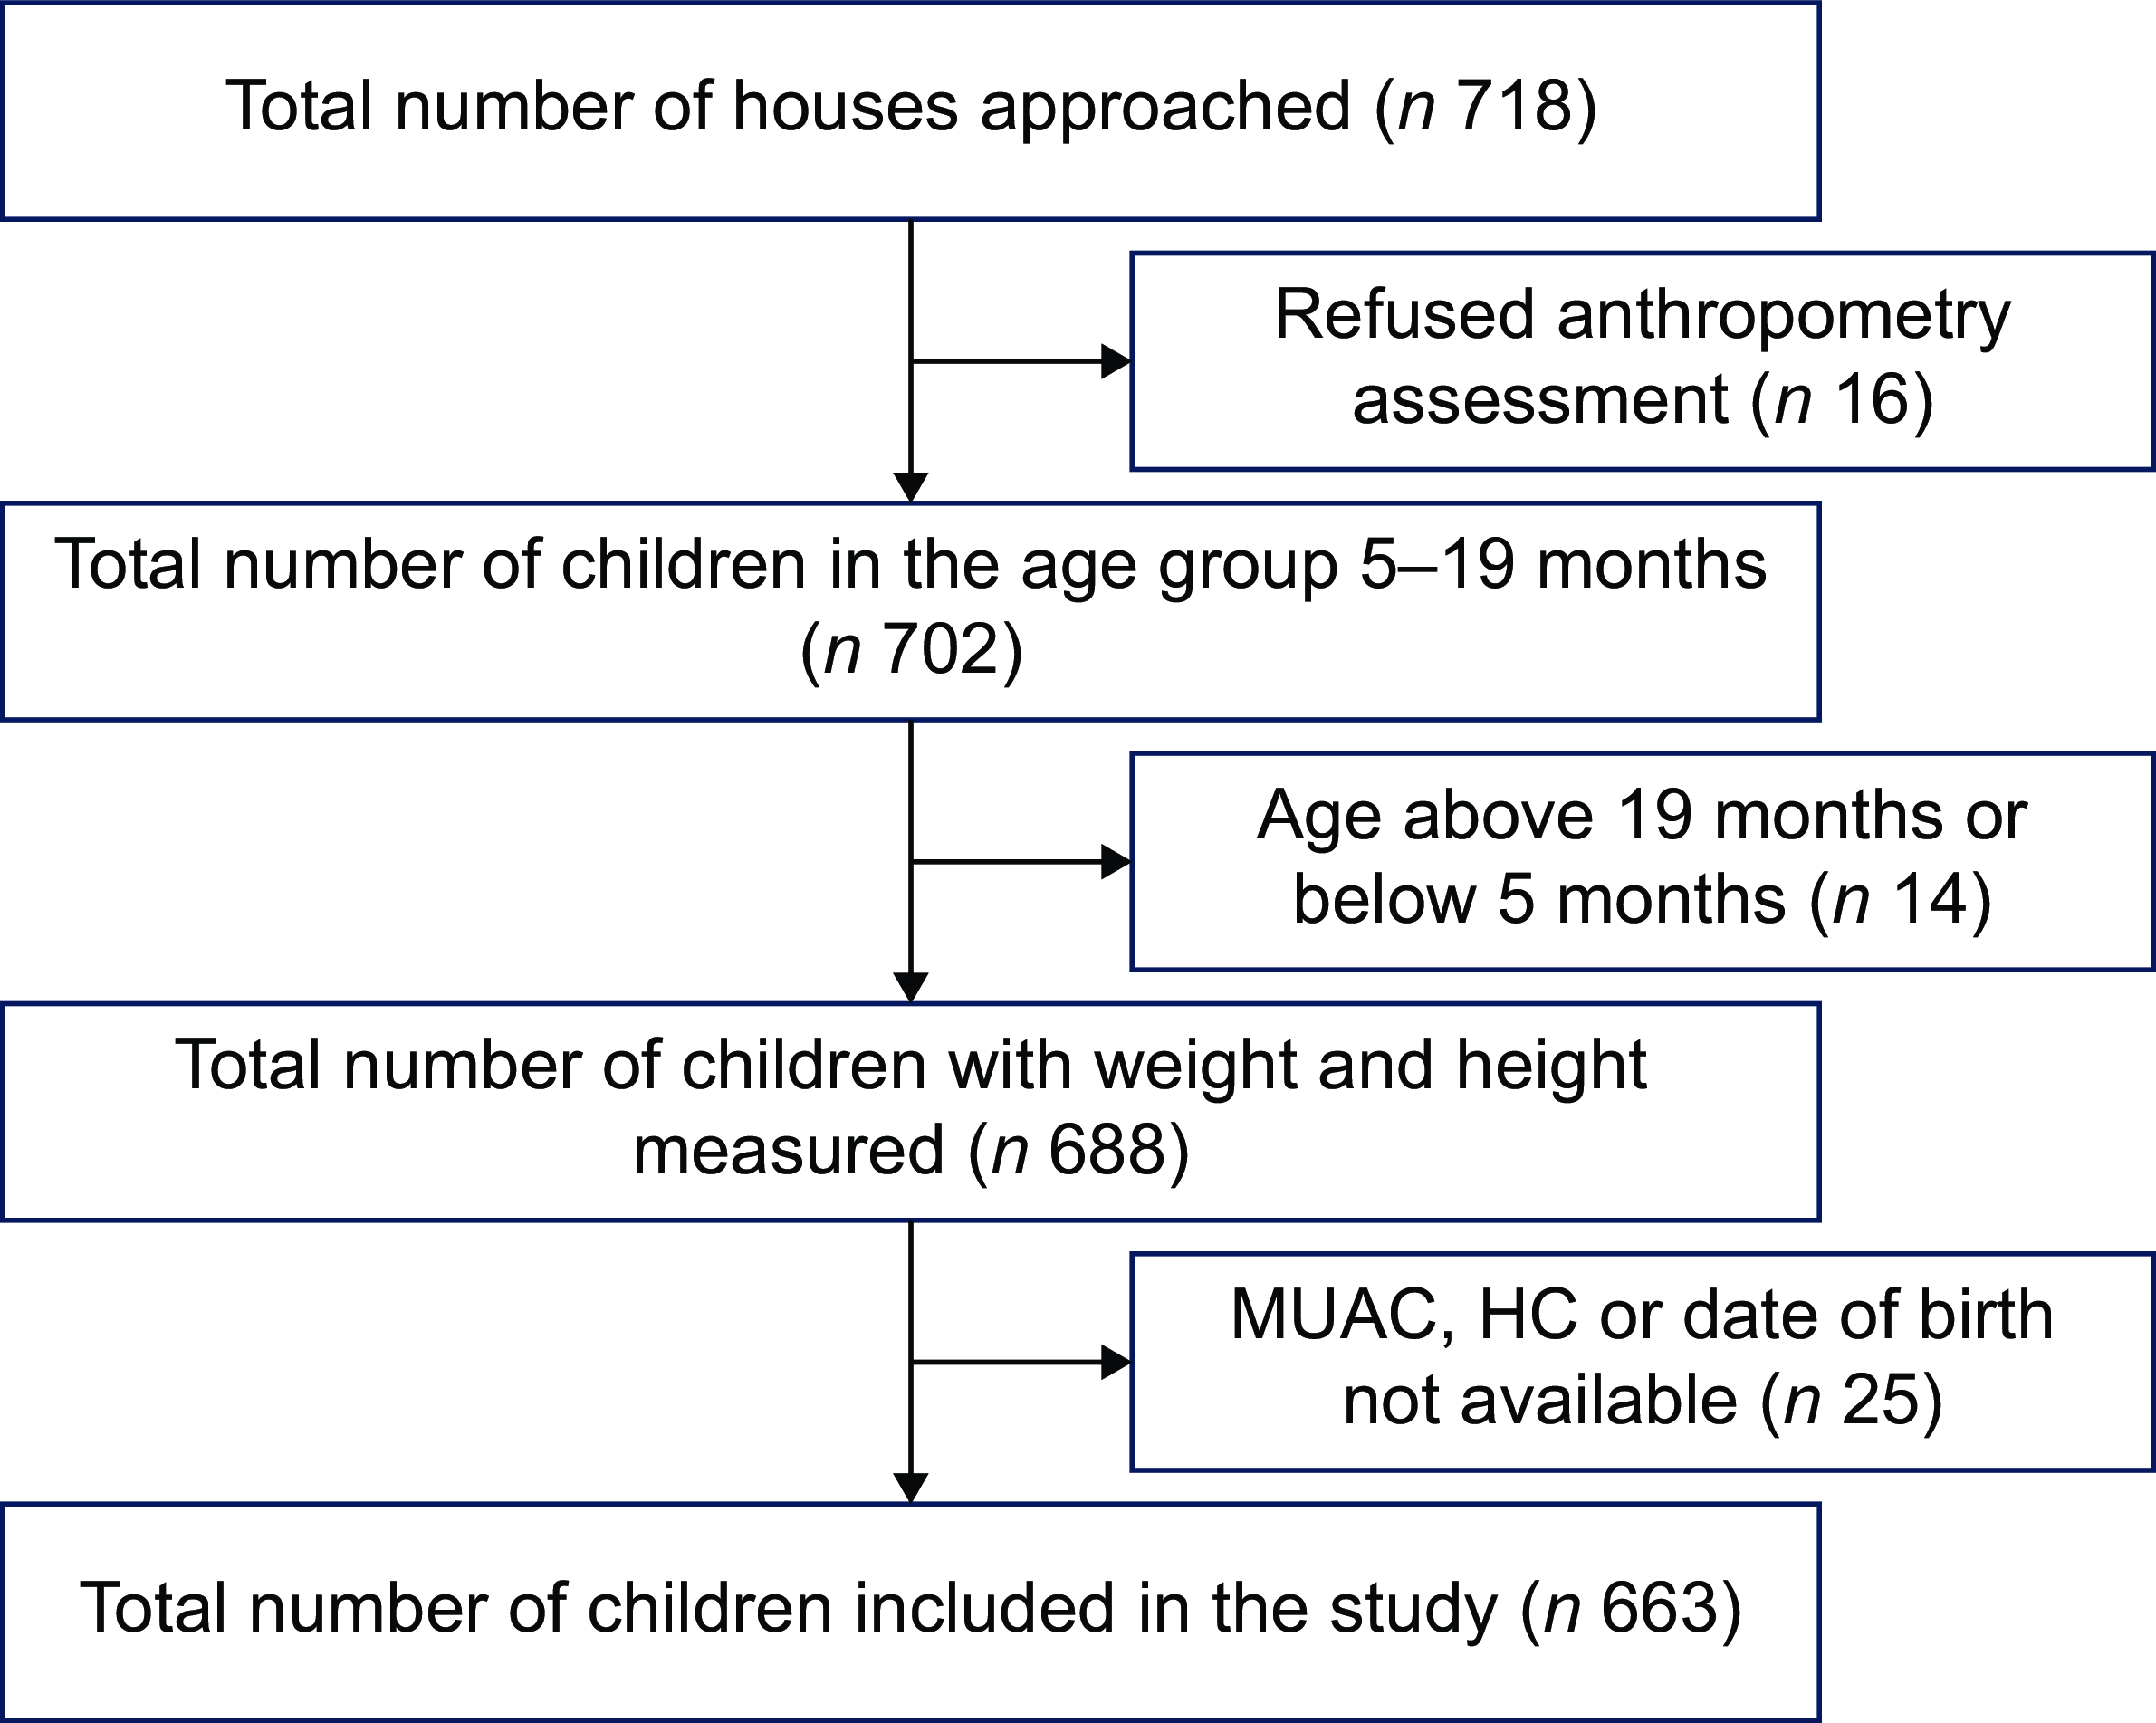
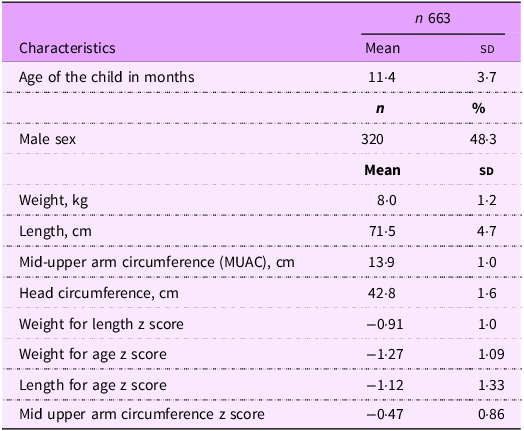
A total of 688 children were pre-screened in the study, of which 663 (96·4 %) had MUAC and HC data measured, collected and included in the analysis (Fig. 1). The mean and sd age for the participants screened was 11·4 (3·7) months, and nearly half of them were females (51·7 %). The mean and sd weight for the participants was 8·0 (1·2) kg, and the length was 71·5 (4·7) cm. The descriptive statistics for all other anthropometric indices are given in Table 1.
Study flow diagram. MUAC, mid-upper arm circumference; HC, head circumference.

Characteristics of the children pre-screened during the pre-proof-of-concept study

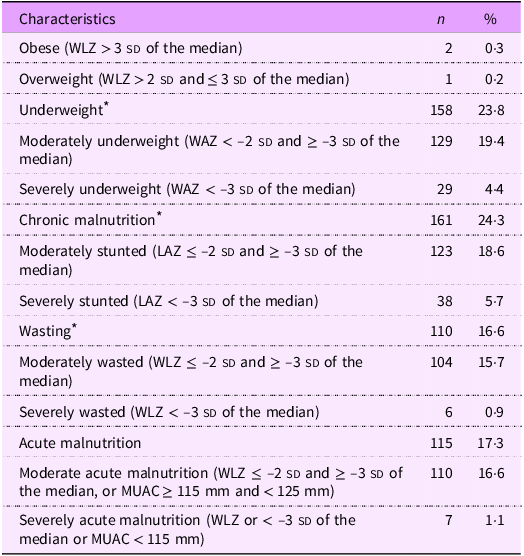
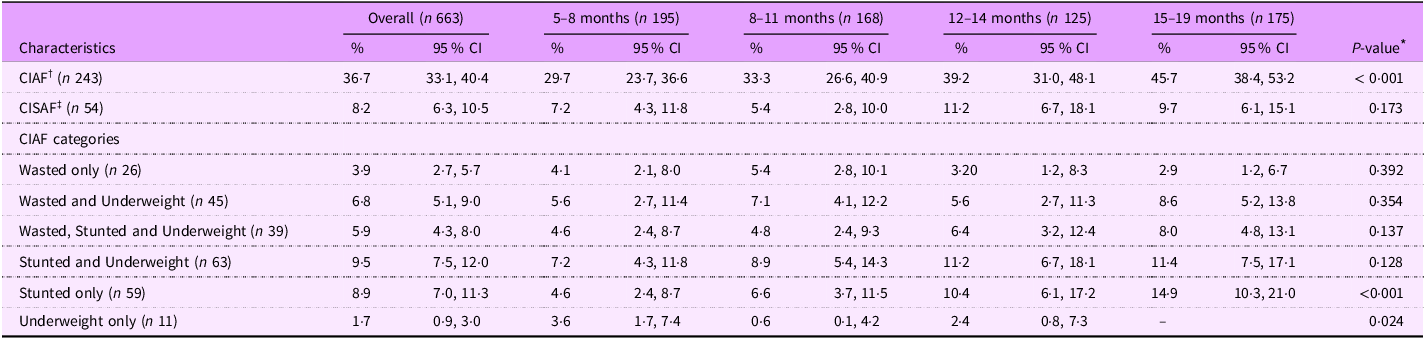
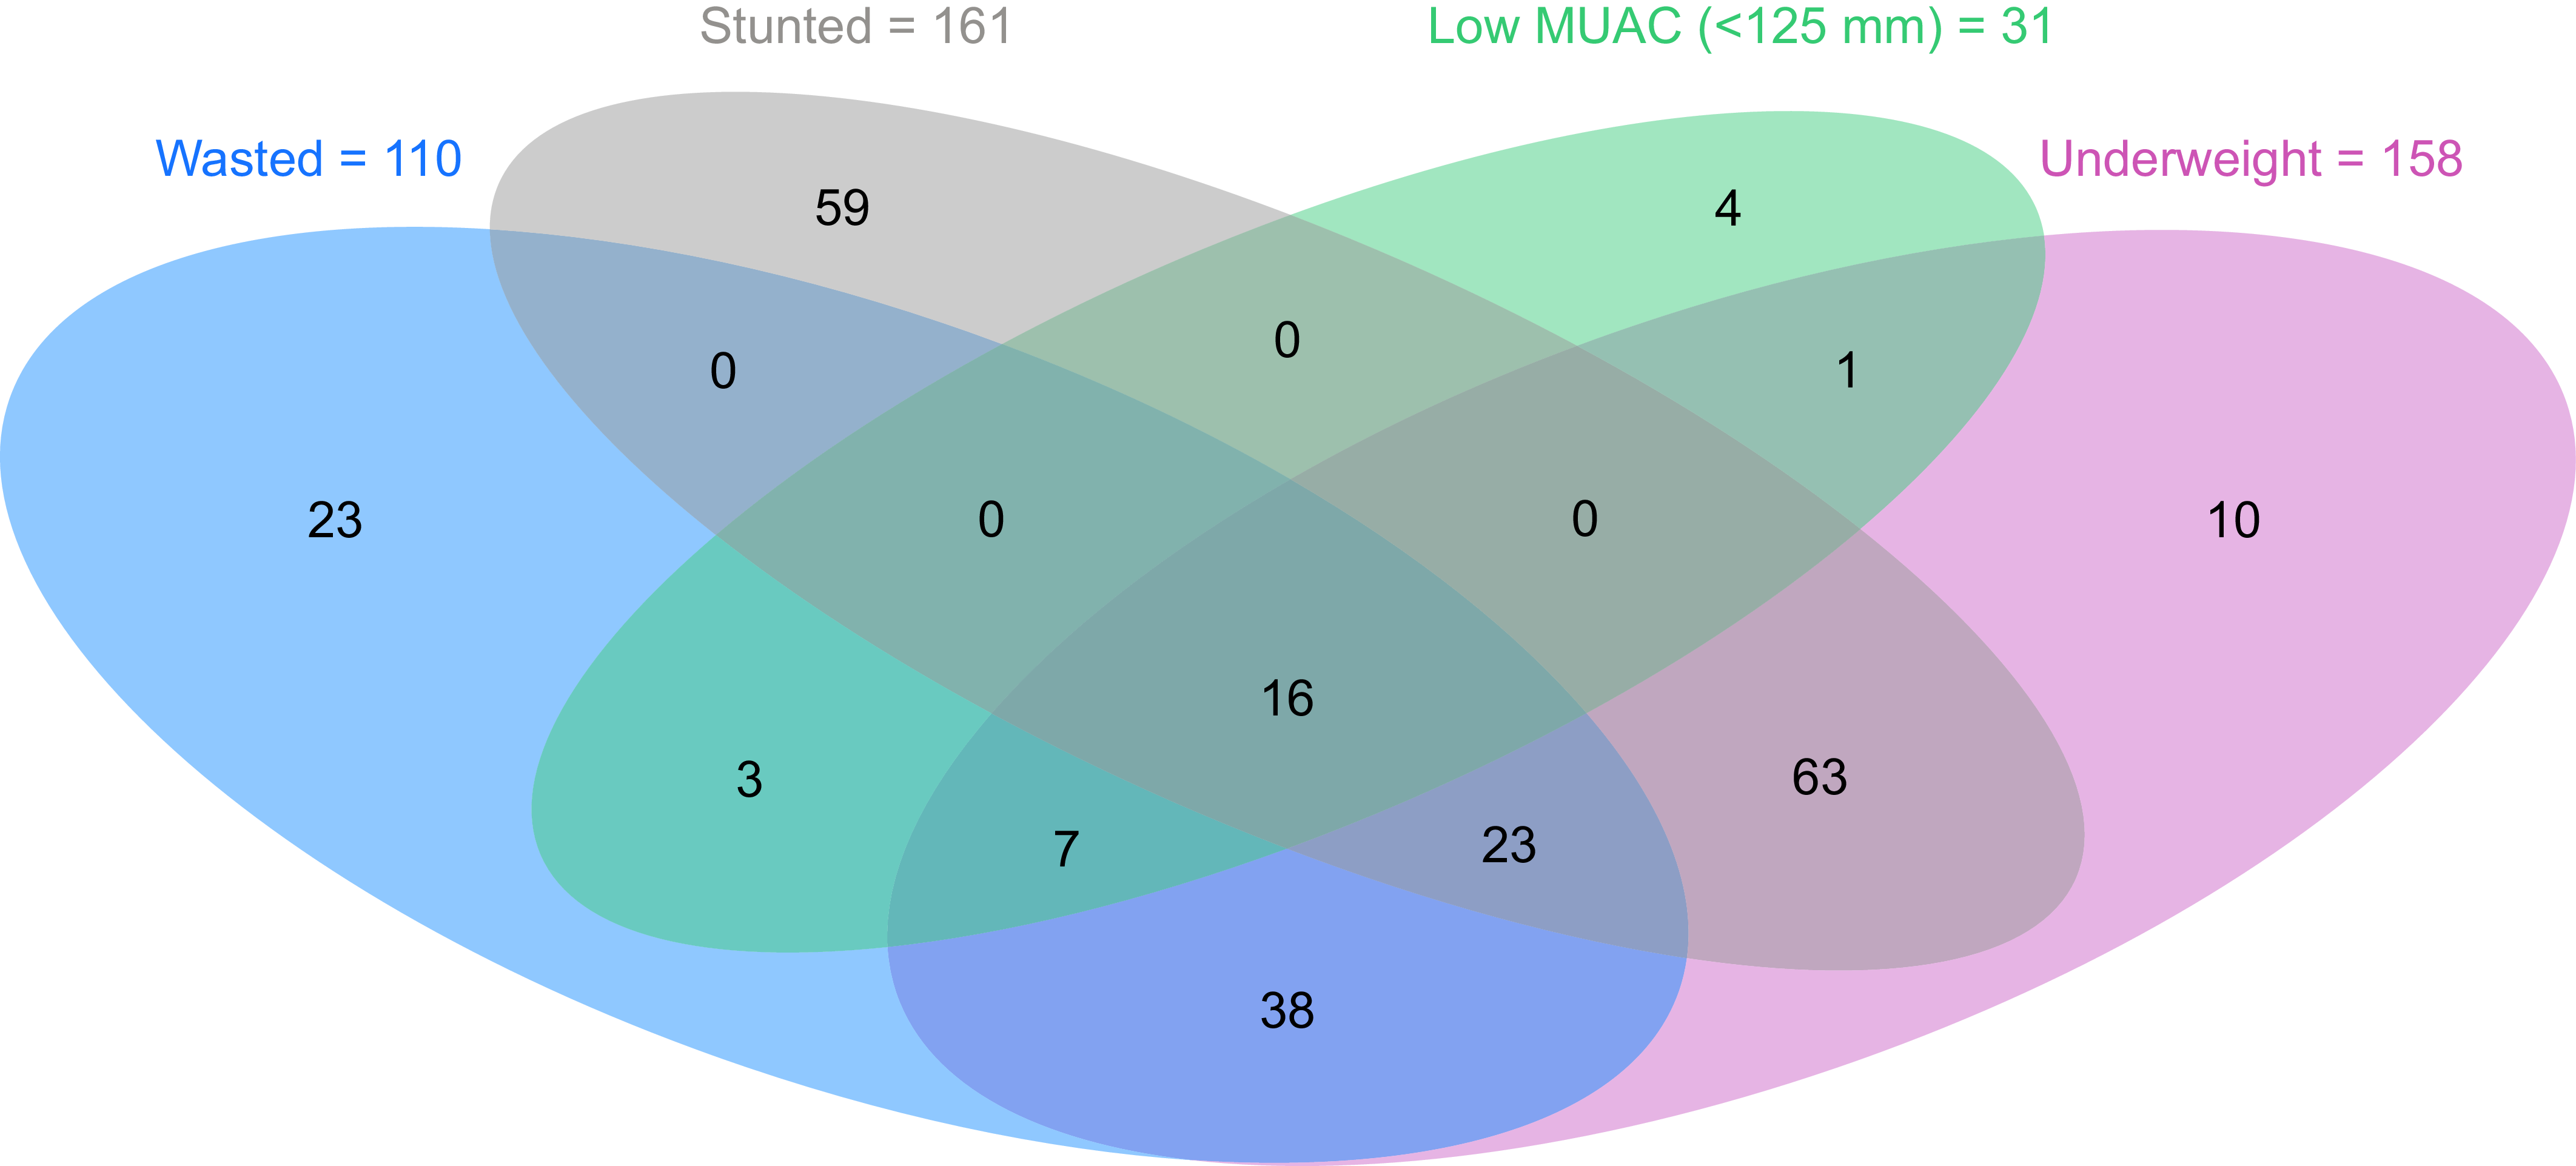
Table 2 shows the prevalence of different forms of malnutrition among recruited participants. The prevalence of wasting was 16·6 % (110/663), of which ∼1 % (6/663) was severe wasting. Similarly, the prevalence of stunting and being underweight among the study participants was 24·3 % and 23·8 %, respectively. Over one in every three children had some anthropometric deficit demonstrated as CIAF (36·7 %), and more than 8 % had severe anthropometric deficits. Multiple anthropometric deficits (i.e. wasted and underweight, stunted and underweight, wasted, stunted and underweight) were observed in 22·2 % of the children (95 % CI: 19·2–25·5) (Tables 3 and 4). An age-dependent linear trend in prevalence was observed for CIAF and stunting (Cochran–Armitage test P-value < 0·001). Overall and age-stratified prevalence of individual anthropometric deficits are given in Table 3.
Nutritional status of children pre-screened during the pre-proof-of-concept study as per WHO definitions

WLZ, weight for length z score; WAZ, weight for length z score; LAZ, length for age z score; MUAC, mid-upper arm circumference.
* Includes an aggregate of moderate and severe forms of malnutrition.
Proportion of children in different categories of anthropometric failures by age group among children pre-screened during the pre-proof-of-concept study

* Chi-square for trend (Cochran–Armitage test) P-value.
† CIAF – Composite index of anthropometric failure.
‡ CISAF – Composite index of severe anthropometric failure.
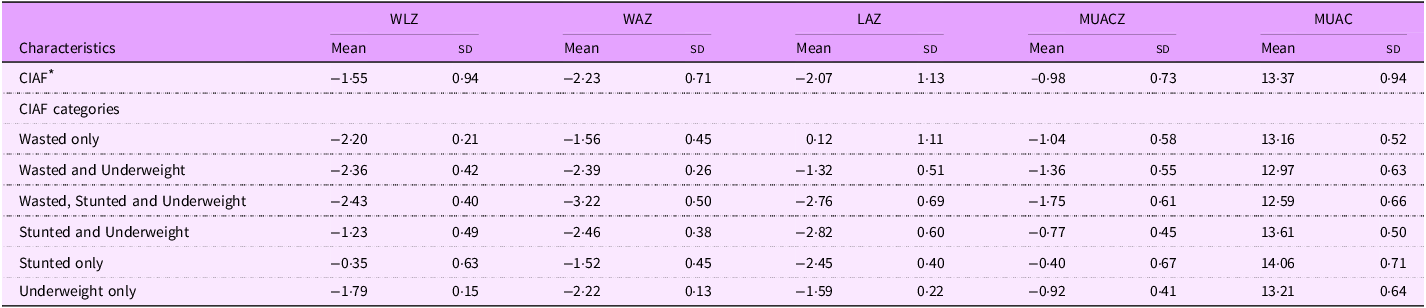
Mean anthropometric z score values in different categories of anthropometric failures among children pre-screened during the pre-proof-of-concept study

WLZ, weight for length z score; WAZ, weight for length z score; LAZ, length for age z score; MUACZ, mid-upper arm circumference z score; MUAC, mid-upper arm circumference.
* CIAF – Composite index of anthropometric failure.
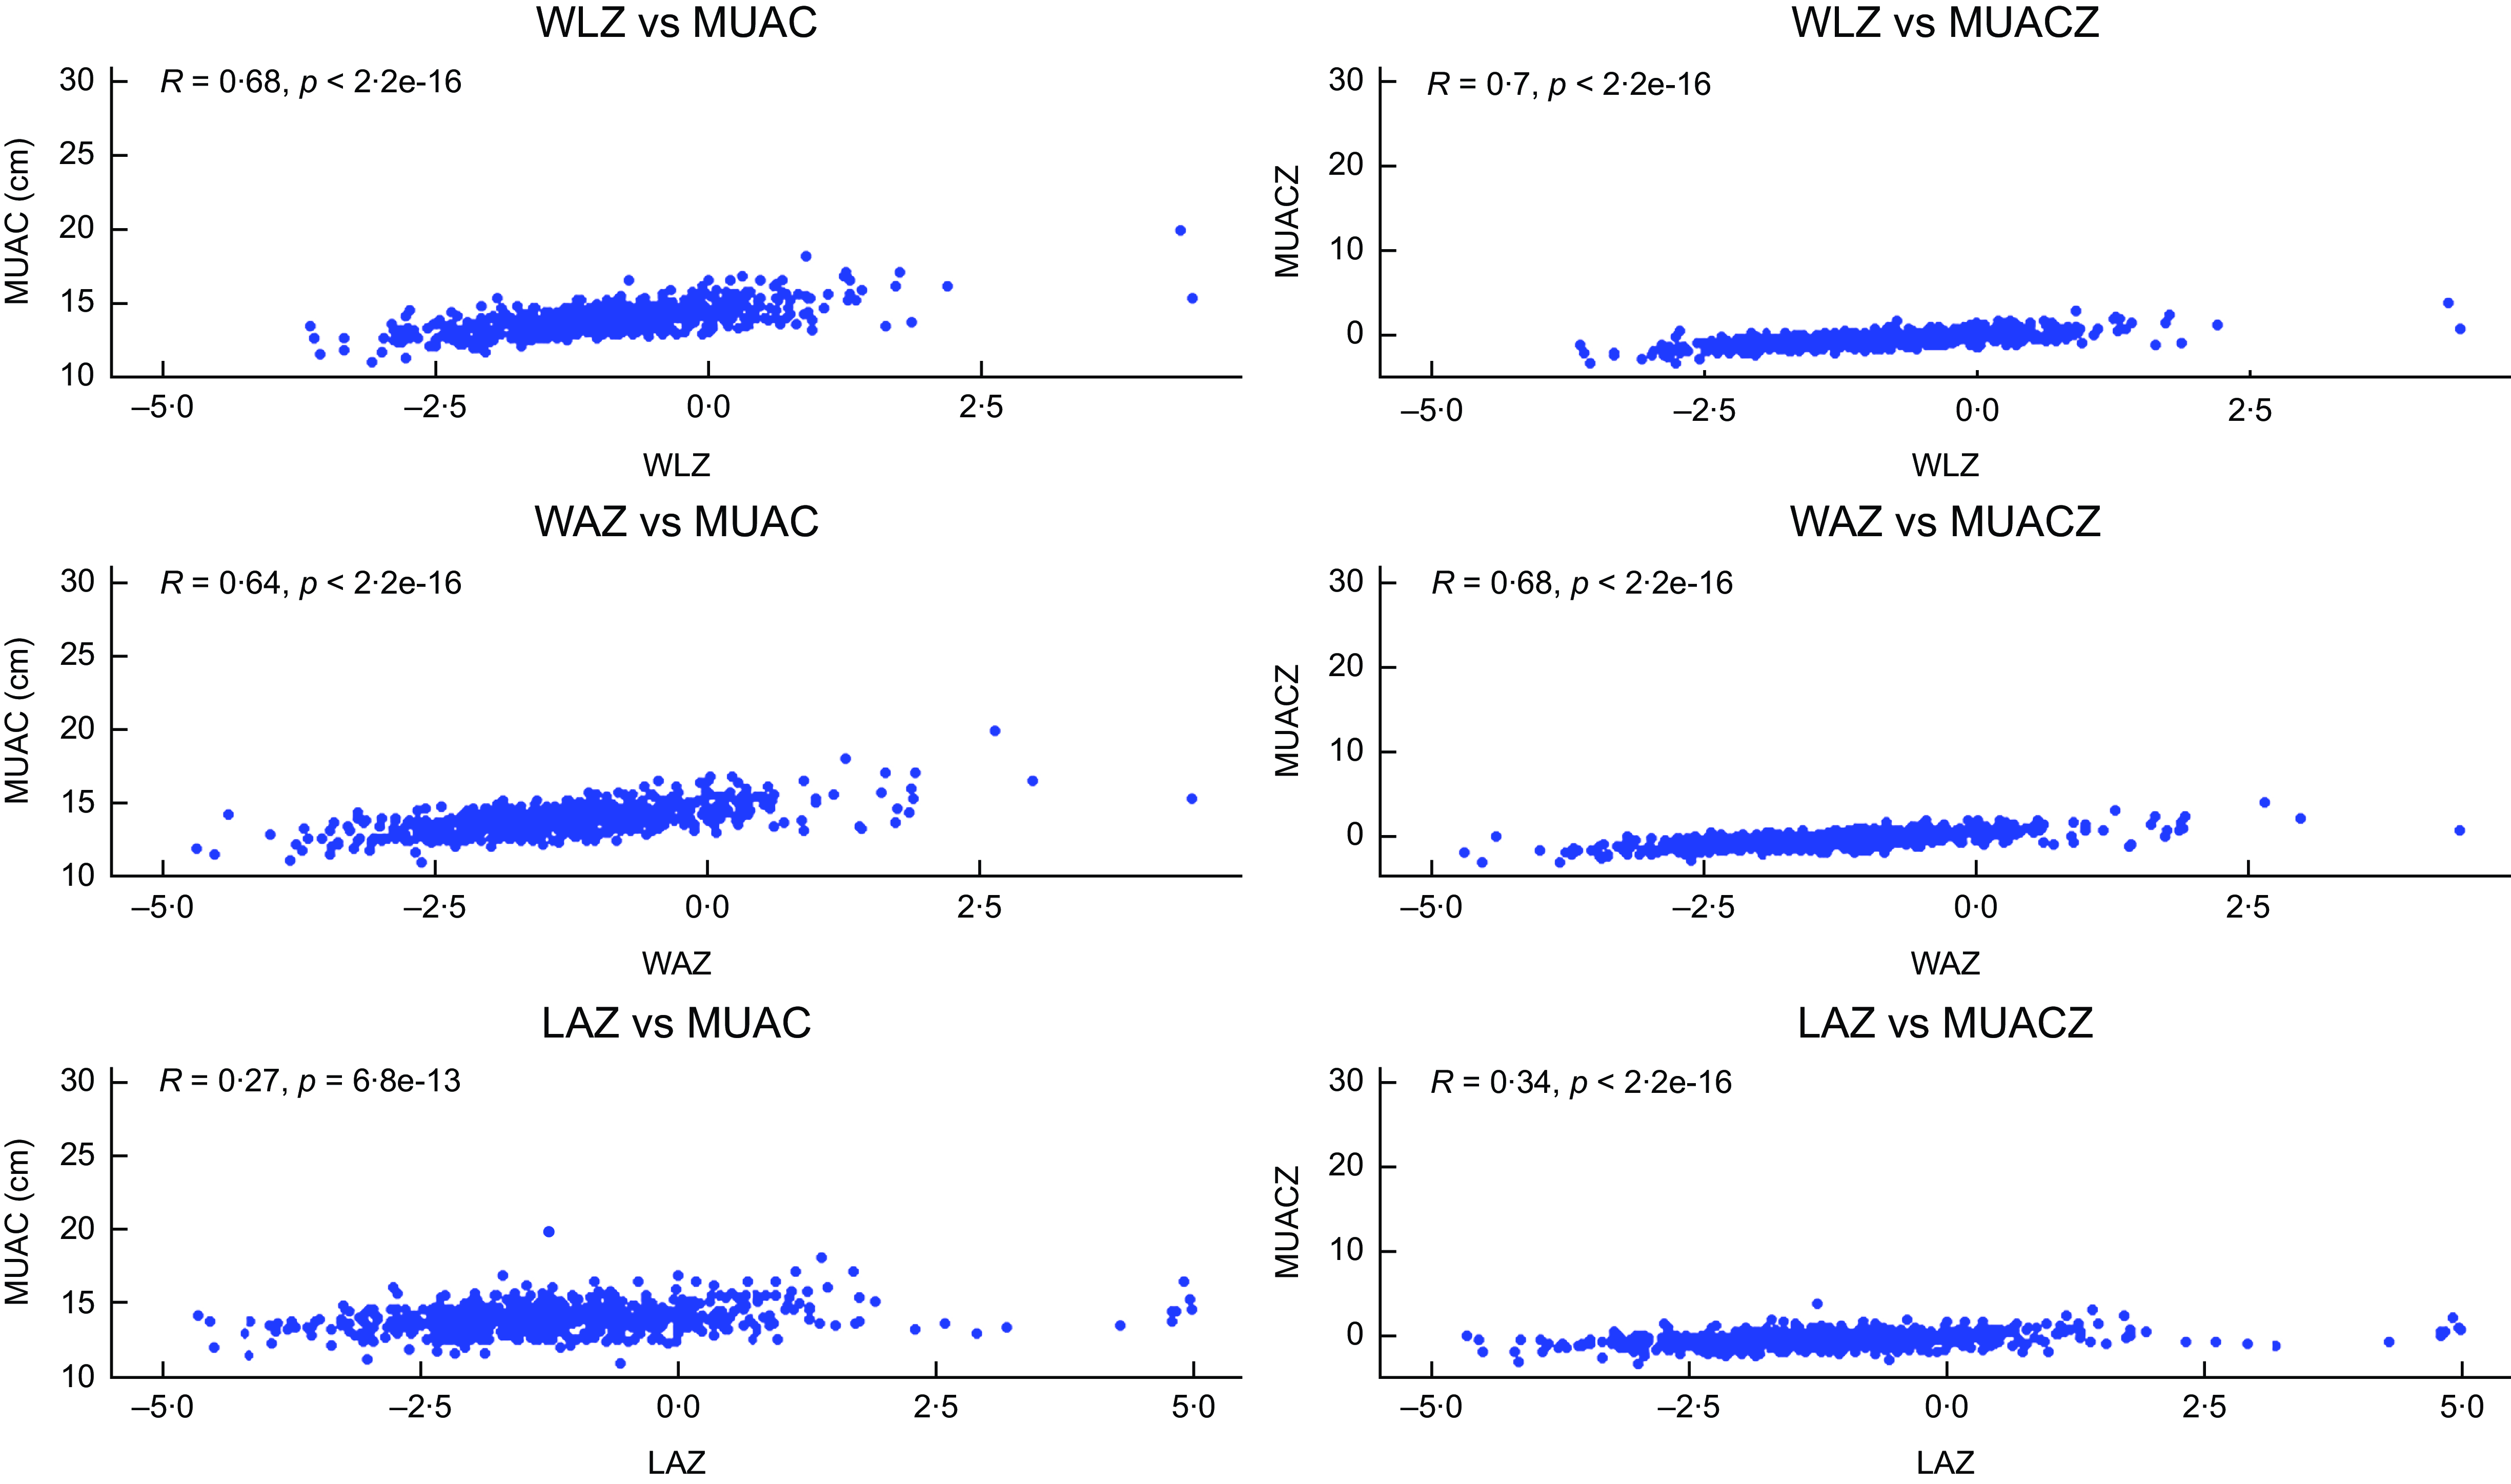
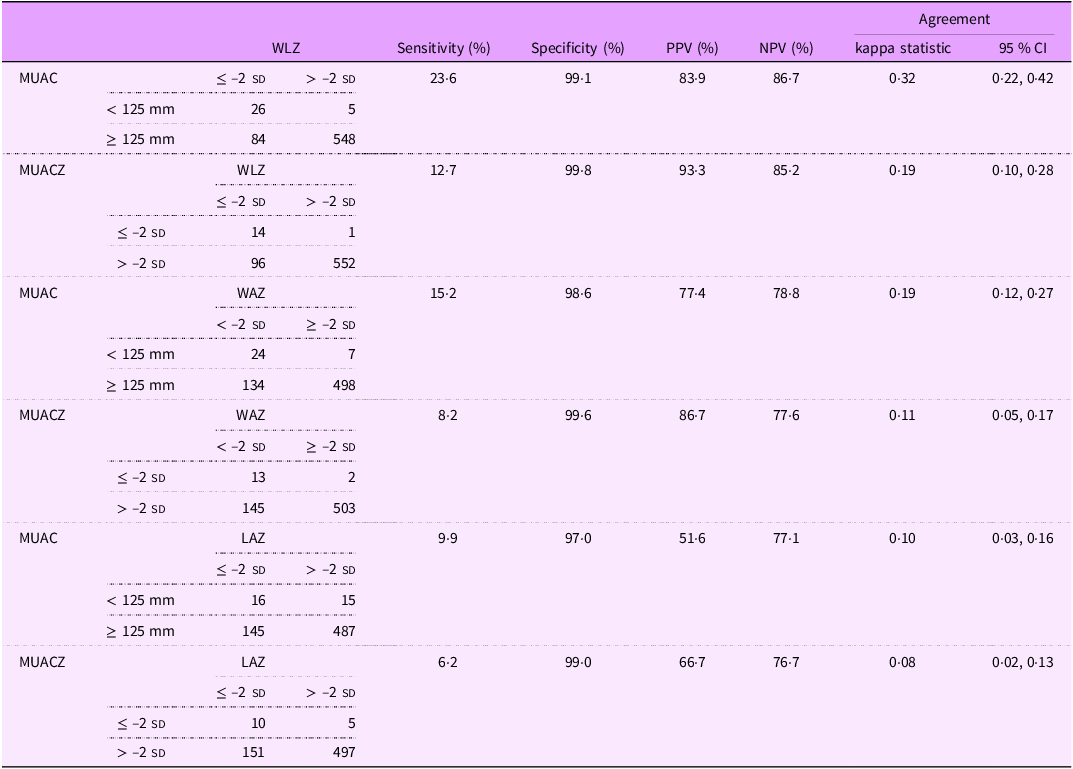
Only sixteen participants were identified to be wasted, stunted, underweight and MUAC < 125 mm. Overlaps between different anthropometric indicators are shown in Fig. 2. The correlation coefficient (r) (Fig. 3) between MUAC and MUACZ with WLZ and WAZ was strong (MUAC v. WLZ = 0·68; MUACZ v. WLZ = 0·70; MUAC v. WAZ = 0·64; MUACZ v. WAZ = 0·68), whereas the correlation was weak for LAZ (MUAC v. LAZ = 0·27; MUACZ v. LAZ = 0·34). The inter-rater reliability between MUAC with different anthropometric indices is given in Table 5, with a maximum agreement of 32 % between WLZ and MUAC < 125 mm (sensitivity = 23·6 % and specificity 99·1 %). The agreement between MUACZ ≤ –2 sd and any anthropometric indices is very poor, with a value of less than 20 %. The sensitivity, specificity, positive predictive value, negative predictive value and agreement for different anthropometric indices with MUAC and MUACZ are given in Table 5.
A Venn diagram showing the overlap of different malnutrition indicators among children pre-screened during the pre-proof-of-concept study. A Venn diagram illustrating the overlap between different anthropometric indicators of malnutrition. Each coloured oval represents children identified as malnourished by a specific measurement, while the overlapping areas show the number of children classified as malnourished by more than one indicator. MUAC, mid-upper arm circumference.

Correlation between different anthropometric indices across three pairs of indices among children pre-screened during the pre-proof-of-concept study. A correlation plot of MUAC and MUACZ with WLZ, WAZ and LAZ. The value of R indicates the correlation coefficient, ranging from –1 (perfect negative correlation) to +1 (perfect positive correlation). MUAC, mid-upper arm circumference; MUACZ, mid-upper arm circumference z score; WLZ, weight for length z score; WAZ, weight for length z score; LAZ, length for age z score.

Utility of MUAC and MUACZ as a screening tool to detect malnutrition assessed using WLZ, WAZ and LAZ among children pre-screened during the pre-proof-of-concept study

MUAC, mid-upper arm circumference; MUACZ, mid-upper arm circumference z score; WLZ, weight for length z score; WAZ, weight for length z score; LAZ, length for age z score; PPV, positive predictive value; NPV, negative predictive value.
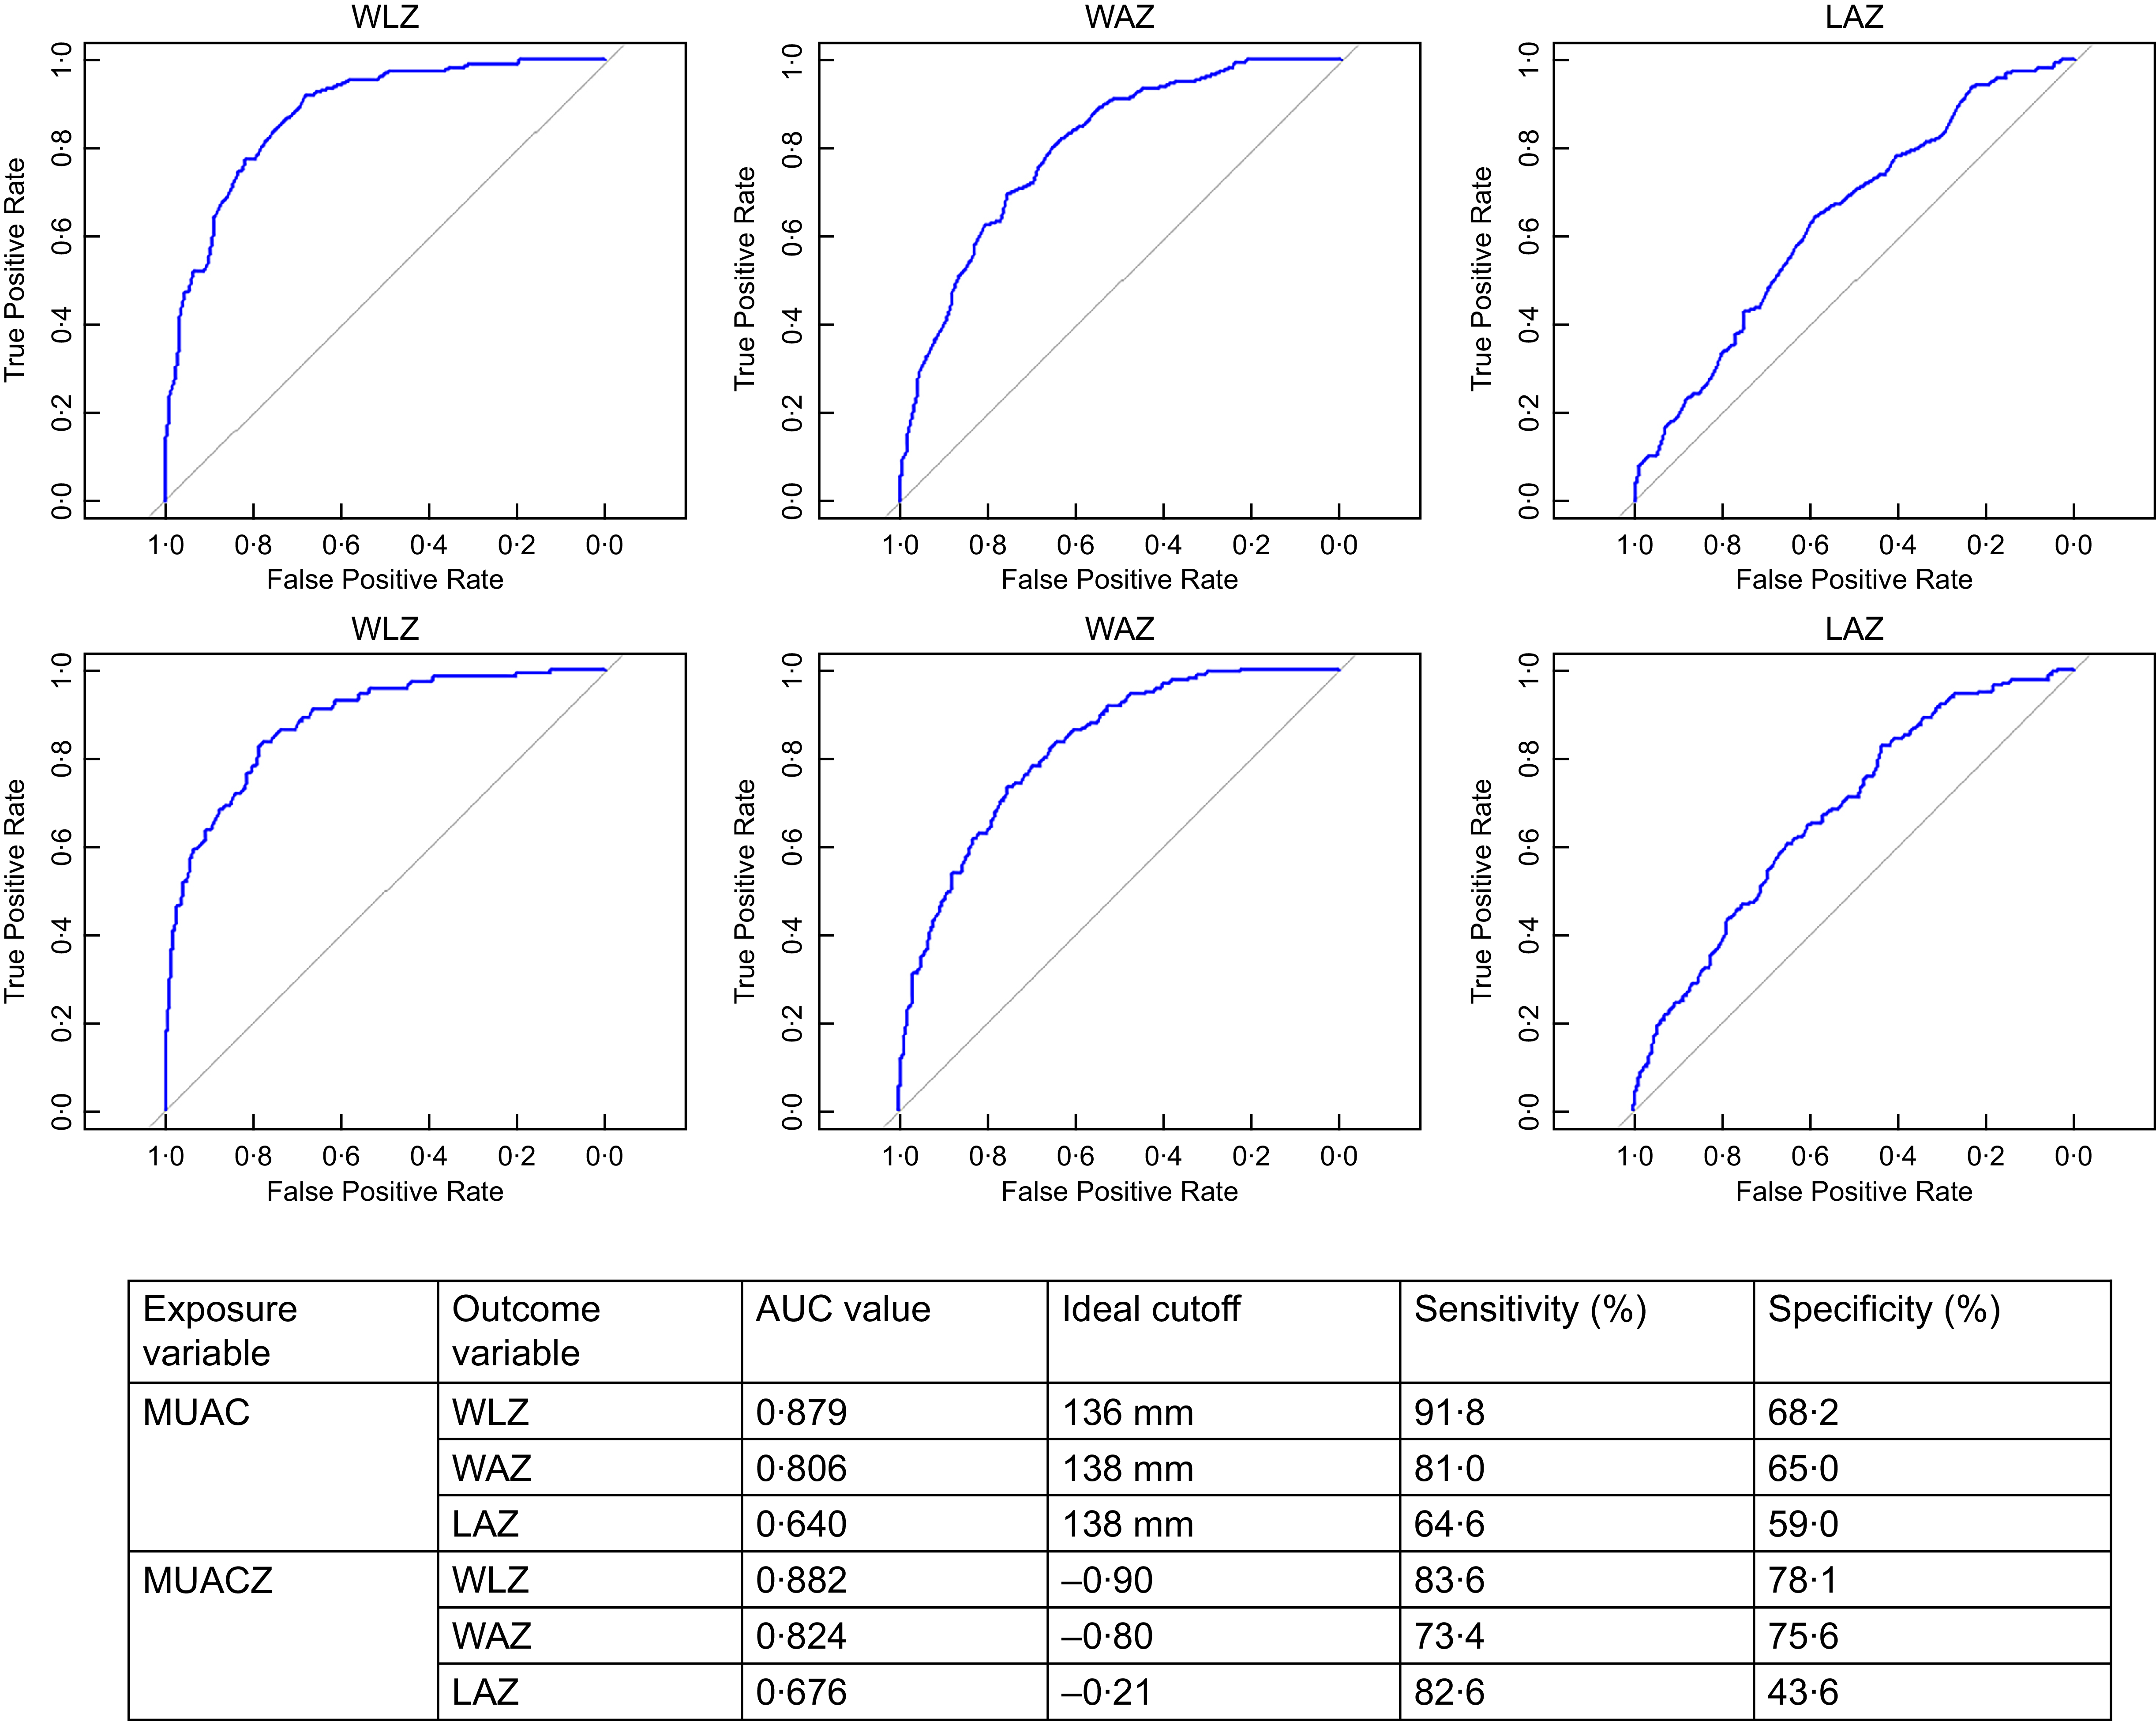
Receiver operator characteristic analysis for the ideal cutoff of MUAC and MUACZ for identifying different forms of malnutrition assessed by WLZ, WAZ and LAZ identified a cutoff of 136 mm for WLZ and 138 mm for WAZ and LAZ. For MUACZ, the cutoffs identified were –0·90, –0·80 and –0·21 for WLZ, WAZ and LAZ (Fig. 4). Both MUAC and MUACZ have shown considerable discrimination in identifying malnutrition, as assessed using WLZ (AUC: MUAC = 0·879; MUACZ = 0·882) and WAZ (AUC: MUAC = 0·806; MUACZ = 0·824). However, the AUC for LAZ showed poor discrimination for both MUAC (AUC = 0·640) and MUACZ (AUC = 0·676). The sensitivity and specificity at ideal cutoffs are given in Fig. 4.
Receiver operator characteristic (ROC) curve for the MUAC and MUACZ threshold values to identify wasting, stunting and undernutrition assessed using WLZ, LAZ and WAZ. ROC curves of MUAC and MUACZ for identifying children classified as malnourished by WLZ, WAZ and LAZ. The AUC demonstrates the discriminatory ability of MUAC and MUACZ against WLZ, WAZ and LAZ, respectively. MUAC, mid-upper arm circumference; MUACZ, mid-upper arm circumference z score; WLZ, weight for length z score; LAZ, length for age z score; WAZ, weight for length z score.

Discussion
Our study is one of the primary studies that estimated the burden of different forms of undernutrition using CIAF categories from urban areas of Vellore in Tamil Nadu. We identified that 36·7 % of the pre-screened children from the study had some form of anthropometric failure, with 8·2 % having a severe form of failure. We also found that WLZ ≤ –2 sd and MUAC < 125 mm identify different sets of children with acute malnutrition, showing only fair agreement between these measurements, highlighting the lack of complete overlap between the two measures. Additionally, the majority of children with low MUAC and WLZ values were also underweight. Our study also suggests using a MUAC value of 136 mm and a MUACZ value of –0·90 as cutoff values for initial community-level screening to identify children with acute malnutrition.
A cohort study from the same study area identified a prevalence of stunting of 14·9 % at 6 months and 30·4 % at 24 months of age(Reference Sarkar, Sivarathinaswamy and Thangaraj31), which was lower at the age of six months and higher at 24 months when compared with the 24·3 % observed in our study. This comparison may not be valid as these results were from a study conducted a decade ago, and our study included children aged 5–19 months. Recent estimates from Vellore(32) also show a similar burden of 30 % stunting, 13 % wasting and 20 % underweight, even though the estimates of stunting in our study were a bit lower. The recently completed NFHS-5 estimates for Tamil Nadu state and Vellore district-specific estimates correspond with our study estimates. The estimated prevalence of stunting was 25 %, wasting was 14·6 % and underweight was 22 % for the whole of Tamil Nadu(33), whereas the respective values from the Vellore district were 29·8 %, 13·1 % and 19·7 %, respectively(34). In contrast, the overall estimates for India were in a higher margin, with a stunting prevalence of 35·5 %, a wasting prevalence of 19·3 % and an underweight prevalence of 32·1 %(35). A study that validated the performance of MUAC for determining moderate acute malnutrition identified similar findings as those we obtained and estimated that a cutoff value of ≤ 13·85 cm is needed for regions in Ethiopia(Reference Lambebo, Mezemir and Tamiru36). Similar results were obtained from studies conducted in Cambodia(Reference Laillou, Prak and de Groot37) and Nepal(Reference Lamsal, Parajuli and Pun38). In contrast to the observations from a study with data from forty-one countries, our study showed a better correlation between WLZ and MUAC/MUACZ(Reference Leidman, Couture and Hulland39).
The study included participants aged 5–19 months from urban wards of Vellore until the required sample size was achieved. A few respondents refused to consent to measurement, but the non-response rates were minimal (2·2 %), owing to the good rapport due to the consistent delivery of healthcare services to the study area by the Department of Community Medicine of CMC Vellore. This would have minimised the overall selection bias. One major strength of this study is that it used CIAF to estimate the burden of malnutrition rather than a single index. Additionally, the team involved in this study was standardised for the procedure of anthropometric measurements, which would have reduced inter-observer variability. The sample size was sufficient to estimate the prevalence by considering a 13·1 % prevalence of wasting from NFHS-5(34) in Vellore with 3 % absolute precision, strengthening the analysis results. The main drawback of this study is the use of a convenience-based geographic area for participant selection. Additionally, the age range of 5–19 months does not align with standard age categories typically examined in similar research (6–24 months; 24–59 months; 6–59 months), potentially limiting the generalisability of the findings. Also, we could not capture the socio-demographic characteristics of all the study participants, considering that this data is from the pre-screening process where only information on anthropometry was captured. Hence, we could not assess the factors associated with the burden of different forms of malnutrition.
Accurately identifying the most appropriate anthropometric indicator for predicting child mortality, morbidity, poor growth and developmental outcomes remains a challenge. Various studies have proposed different indicators, WAZ(Reference Ahmed, Ali and Argaw40–Reference Khara, Myatt and Sadler42), MUAC(Reference Hoehn, Lelijveld and Mwangome41–Reference Walters, Sibson and McGrath43) and WLZ(Reference Walters, Sibson and McGrath43), as effective predictors. Notably, one study comparing WLZ and MUAC in predicting mortality within one year found that MUAC performed better in identifying children at higher risk(Reference Mwangome, Fegan and Fulford44). Given that both MUAC and WLZ are established risk markers for adverse outcomes in children, the aim of our study was not to validate MUAC or MUACZ score against WLZ for identifying acute malnutrition. Rather, we propose a stepwise approach to screening for acute malnutrition, starting with MUAC, followed by WLZ, to improve identification and management of children at risk. This approach can reduce the difficulties in logistics and precision relating to weight and length measurements of all the children for a community-based screening programme. We suggest screening the children based on higher cutoffs of MUAC or MUACZ score and considering measuring weight and length for those falling below the criteria. Moreover, as identified by many previous studies, our study also identified a different set of children to be malnourished while using the WHO criteria for identifying acute malnutrition. This also indicates that anthropometric measurements can only be considered as case definitions, but not as a definitive definition for malnutrition. The concordance between WLZ and MUAC is very low, thereby, this also undermines the premise of using any single method for identifying children with malnutrition for treatment. This also suggests the potential of further research with follow-ups to identify anthropometric measurements that are associated with the risk of adverse outcomes in children.
Conclusion
Using MUAC and WLZ separately identifies different groups of children with acute malnutrition, as identified by previous studies and indicates that anthropometric measurements are not definitive definitions of malnutrition, but they can be used as a case definition. Implementing a stepwise approach, starting with MUAC using higher cutoffs, followed by WLZ, can simplify community-based research that requires WLZ cutoffs as inclusion criteria for participants. Alternatively, using WAZ alone can also be considered, as it identifies children with lower MUAC and WLZ values.
Acknowledgements
We thank Prof. Gagandeep Kang, FRS, for her guidance in conducting the pre-POC study and support in acquiring funding. We would also like to thank all the staff members who have collected the data and all the participants who have consented to data collection.
Financial support
This study was funded by Sun Pharma, Mumbai, through a corporate social responsibility scheme. The funders had no role in the design and conduct of the study; collection, management, analysis and interpretation of the data; preparation, review or approval of the manuscript; and decision to submit the manuscript for publication.
Conflict of interest
There are no conflicts of interest.
Authorship
Dr M.S. and Dr S.M. had full access to the study’s data. They took responsibility for data integrity and accuracy in data analysis. Concept and design: Prof. V.R.M., Prof. S.M.V., S.M. and M.S. Statistical analysis and interpretation: M.S., S.M. and Dr L.H. Drafting of the manuscript: M.S., S.M. and L.H. Critical review of the manuscript for important intellectual content: All authors. Administrative, technical or material support: M.S., S.P., Dr A.V. and Z.M. Supervision: V.R.M., S.M., L.H. and S.M.V. All authors have read and approved the final version of the manuscript
Ethics of human subject participation
This study was conducted according to the guidelines in the Declaration of Helsinki. All procedures involving research study participants were approved by the institutional review board (IRB) of Christian Medical College Vellore, India (IRB Min. No. 2411107 dated 20.11.2024). Written informed consent was obtained from all mothers of the study participants.

 Open access