


1. Introduction
Flow around tandem cylinders represents a basic configuration of flow interference and has been widely studied. Apart from its obvious engineering importance, it encompasses several aspects of fundamental flow physics, such as bluff body separation, shear layer reattachment and the interaction between multiple bodies and their shedding systems.
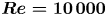
The flow is governed by the Reynolds number,  $Re = U_{0} D/\nu$ and the separation between the cylinders, normally denoted the gap ratio
  $L/D$. Here,
  $U_{0}$ is the inflow velocity, D is the cylinder diameter (for tandem cylinders of equal diameter),
  $\nu$ the kinematic viscosity and L is defined as the centre-to-centre distance between the cylinders. Roughly, there are three fundamental flow regimes for tandem cylinders, as shown in figure 1: (a) no reattachment, commonly called overshoot, where the shear layers from the upstream cylinder bypass the downstream cylinder to roll up in the wake; (b) reattachment, where the shear layers from the upstream cylinder reattach onto the downstream cylinder and shedding of large-scale vortices takes place from the downstream cylinder; and (c) co-shedding, where large-scale vortices are shed from both cylinders.
Schematic overview of the main tandem cylinder flow regimes. According to classification by Zdravkovich (Reference Zdravkovich1987) the regimes are found within the following gap ratio ranges: (a) overshoot/no reattachment  $1.0 \lesssim L/D \lesssim 1.2\unicode{x2013}1.8$; (b) reattachment
  $1.2\unicode{x2013}1.8 \lesssim L/D \lesssim 3.4\unicode{x2013}3.8$; and (c) co-shedding
  $3.4\unicode{x2013}3.8 \lesssim L/D$. Reattachment of the upstream cylinder shear layers can occur either on the front face (upstream side) or on the back face (downstream side) of the downstream cylinder, depending on the gap ratio.

In this study, we deal with tandem cylinders within the reattachment regime, and therefore a more detailed introduction is given of this particular regime, at the expense of the other two. However, thorough reviews of flow around two cylinders are given by Sumner (Reference Sumner2010) and Zhou & Alam (Reference Zhou and Alam2016), which include not only tandem cylinders, but also side-by-side and staggered configurations.
1.1. Tandem cylinders in the reattachment regime
Because the shear layers are very sensitive to the inflow conditions, the reattachment regime is found for a wide variety of combinations of  $Re$ and gap ratio. The nature of reattachment changes with the gap ratio, from alternating, through permanent to intermittent reattachment as the gap is increased (Zdravkovich Reference Zdravkovich1987).
When there is stable alternating reattachment, one shear layer overshoots the downstream cylinder and rolls up, whereas the other reattaches. This regime is seen in the flow visualisations by Ishigai, Nishikawa & Cho (Reference Ishigai, Nishikawa and Cho1972).
The gap ratio at which co-shedding commences is traditionally called the critical spacing,  $L_{c} /D$. However, the change from one flow regime to the next is strongly
  $Re$ dependent, so this spacing varies. Both an increase in
  $Re$ (Xu & Zhou Reference Xu and Zhou2004) and the introduction of free-stream turbulence (FST) (Ljungkrona, Norberg & Sunden Reference Ljungkrona, Norberg and Sunden1991) work to promote transition between regimes at lower gap ratios. The critical spacing typically lies between 3.0 and 5.0 (Okajima Reference Okajima1979; Igarashi Reference Igarashi1981; Xu & Zhou Reference Xu and Zhou2004; Alam Reference Alam2014), which represents an upwards extension of Reference ZdravkovichZdravkovich's (Reference Zdravkovich1987) initial classification of the reattachment regime. It is a testament to the
  $Re$ sensitivity of tandem cylinders that Wang, Alam & Zhou (Reference Wang, Alam and Zhou2018), did not see overshoot flow for
  $Re = 4.27 \times 10^{4}$, even for
  $L/D = 0.5$, when the cylinders touch.
Near the critical spacing, bi-stable flow is found. Here, the flow intermittently jumps between reattachment and co-shedding, and there are two distinct Strouhal numbers ( $St=f_{v}D/U_{0}$, where
  $f_{v}$ is the large-scale vortex shedding frequency) (Igarashi Reference Igarashi1981; Xu & Zhou Reference Xu and Zhou2004).
The reattachment point moves from the back face to the front face of the downstream cylinder as the gap ratio is increased, which results in a change of the flow interactions in the gap. Xu & Zhou (Reference Xu and Zhou2004) proposed that the reattachment regime should be subdivided accordingly. In their proposed categories, the reattachment regime is divided into  $2\leq L/D\leq 3$ where there is a gradual transition from stable overshoot to stable reattachment on the downstream cylinder back face, and
  $3\leq L/D\leq 5$ where there is transition from stable reattachment on the downstream cylinder front face to co-shedding.
The location of the reattachment point can significantly alter the wake structure. Zhou & Yiu (Reference Zhou and Yiu2006) found that reattachment on the back face corresponded with weak vortices with a slow decay rate and less vigorous interactions, compared with the overshoot regime. As the reattachment point moves towards the front face, the boundary layer on the downstream cylinder is given more time to develop, which enhances the vortex strength. Even so, the vortices remained weaker than in the overshoot regime, in which the strength was comparable to that of a single cylinder.
Though there is no vortex shedding from the upstream cylinder within the stable reattachment regime, there is recirculation in the gap. Igarashi (Reference Igarashi1981) describes non-shedding vortices (dubbed quasi-stationary by the author) in the gap for a  $Re$ range of
  $8.7 \times 10^{3} \leq Re \leq 5.2 \times 10^{4}$, at gap ratios between 2 and 3.1. ‘Quasi-stationary’ and ‘quasi-steady’ are used interchangeably about the gap vortices in the literature, and taken to mean the same thing, namely that the vortices develop to somewhat in time, but remain essentially in the same location due to lack of shedding. The fact that they may have some degree of periodicity makes the term ‘quasi-steady’ counter-intuitive to some, and for this reason they will simply be referred to as gap vortices herein. Symmetrical and/or asymmetrical gap vortices were observed by, among others, Lin, Yang & Rockwell (Reference Lin, Yang and Rockwell2002), Wang et al. (Reference Wang, Alam and Zhou2018) and Zhou et al. (Reference Zhou, Alam, Cao, Liao and Li2019).
Within the reattachment regime, the development of the shear layers is of utmost importance, but has received relatively little attention. Xu & Zhou (Reference Xu and Zhou2004) reported a measurement of the shear layer frequency. However, the aim of their study was to characterise a broad range of tandem cylinder regimes, rather than conducting a detailed study of the shear layers. Lin et al. (Reference Lin, Yang and Rockwell2002) discussed the development of the gap shear layers, though primarily with respect to the onset of vortex shedding in the gap. They comment that increased entrainment demands with increasing  $Re$ should lead to a reduction of the critical spacing, and discuss the buffet loading from the gap shear layers as a function of the gap ratio.
1.2. Circular cylinder shear layers at subcritical Reynolds numbers
For circular cylinders in the approximate region  $1000 \leq Re \leq 200\,000$ (Williamson Reference Williamson1996), called the subcritical regime, transition to turbulence initiates in the shear layers. It is triggered by the Kelvin–Helmholtz (K-H) instability, starting out as oscillations of the shear layer which then roll up into discrete vortices when
  $Re$ is increased. The shear layer instability has its own distinct frequency,
  $f_{sl}$, which was first discovered by Bloor (Reference Bloor1964), in range
  $1300 \leq Re \leq 19\,000$. Above this range, transition occurred directly after separation.
1.2.1. Intermittency
When measuring in a fixed point in the near-wake of a single cylinder, the shear layer instability appears intermittent, manifesting itself in the form of random so-called packets of velocity fluctuations. Prasad & Williamson (Reference Prasad and Williamson1997) found that intermittency occurs because the shear layer transition region exhibits random streamwise motion. Thus, the velocity fluctuations correspond to a shortening of the stable shear layer. This had already been observed visually, through particle image velocimetry (PIV), by Chyu & Rockwell (Reference Chyu and Rockwell1996a). Prasad & Williamson (Reference Prasad and Williamson1997) suggested that the cause of the motion was temporal changes in the near-wake three-dimensional structures. An intermittency factor was defined, given as the frequency of occurrence of the velocity fluctuation packets in a fixed point.
The shear layer develops by a convective instability mechanism, meaning that disturbances are transported downstream and amplified. This implies that probes further downstream in the shear layer will experience more and higher-amplitude fluctuations than probes closer to the cylinder. Moreover, the transition region travels upstream towards the separation point as the  $Re$ increases, which also increases the fluctuations seen by a probe in the near-wake. Prasad & Williamson's (Reference Prasad and Williamson1997) findings correspond well with this, showing that the intermittency factor and the amplitude of the fluctuations increased with increasing
  $Re$, as well as when the measurement point was moved downstream. The meandering of the transition region was confirmed by flow visualisations.
Rai (Reference Rai2010) suggested that though intermittency in the measured time trace was indeed accompanied by a movement of the transition region, its cause was not sufficiently explained by Prasad & Williamson's (Reference Prasad and Williamson1997) hypothesis. The root cause was found to be strengthening of the shear layer vortices via vortex stretching, which, in turn, was caused by interaction between the shear layer and the vortices in the recirculation zone. These vortices hail from earlier breakdown events. When they are convected back upstream, some interact with the shear layer, essentially giving it a push or pull in the crossflow direction. The resulting crossflow dislocations serve to amplify the shear layer instability and hasten transition. Weaker recirculation vortices result in smaller amplitude intermittency, a finding which is pertinent to flow in the gap region of tandem cylinders.
1.2.2. Vortex pairing
Vortex pairing, a phenomenon where adjacent vortices interact by rolling around each other and finally combine into a single structure, is widely observed in mixing layers. Pairing was observed for ring vortices in a round jet by Becker & Massaro (Reference Becker and Massaro1968), who noted that the frequency of the coalesced structure was half of that of the initial smaller structures. It follows that vortex pairing is detectable in the frequency spectrum as a peak around one half of the main peak.
The existence of shear layer vortex pairing in bluff body wakes was disputed for a long time. For the case of a circular cylinder, several early studies indicated that the von Kármán vortex shedding inhibits pairing (Unal & Rockwell Reference Unal and Rockwell1988a), and that either external forcing (Peterka & Richardson Reference Peterka and Richardson1969; Chyu & Rockwell Reference Chyu and Rockwell1996b) or von Kármán vortex suppression by a splitter plate (Unal & Rockwell Reference Unal and Rockwell1988b) is needed to obtain it. However, pairing has since been observed in flow visualisations for the subcritical and transitional  $Re$ regimes (Law & Ko Reference Law and Ko2001; Lo & Ko Reference Lo and Ko2001), without the use of forcing or large-scale vortex suppression, and several studies have detected the presence of the subharmonic in the spectra (Cardell Reference Cardell1993; Ahmed & Wagner Reference Ahmed and Wagner2003; Rajagopalan & Antonia Reference Rajagopalan and Antonia2005; Khabbouchi et al. Reference Khabbouchi, Fellouah, Ferchichi and Guellouz2014).
Both Cardell (Reference Cardell1993) and Rajagopalan & Antonia (Reference Rajagopalan and Antonia2005) made observations that for uninhibited flow, the subharmonic was strengthened as  $Re$ was increased. Cardell (Reference Cardell1993) argued that for low
  $Re$ the shear layer instability does not develop sufficiently for the subharmonic to be detected before the shear layer vortices are swallowed by the von Kármán vortices. This could be part of the explanation as to why vortex pairing has not been observed in some studies. For instance, Reference Unal and RockwellUnal & Rockwell's (Reference Unal and Rockwell1988a) highest
  $Re$ was 5500, which is significantly lower than the threshold
  $Re$ for the subharmonic found by Cardell (Reference Cardell1993).
The intermittency phenomenon may shed some light onto why vortex pairing is hard to observe in the velocity spectra for low  $Re$. In the cases where the recirculation vortices are strong enough to trigger early transition, with the corresponding shortening of the stable shear layer, the shear layer has more time to develop before it is entrained in the von Kármán vortex formation. This leads to enhanced pairing. Conversely, the pairing process is cut short by the primary vortices when early transition is not triggered. As the intermittency factor is lower at lower
  $Re$, capturing vortex pairing through measurement in a fixed point becomes correspondingly harder.
1.3. Motivation for the present investigation
Although tandem cylinders have been researched extensively, the main effort thus far has focused on the relation between gap ratio and  $Re$, the effect on St, forces and the phase-lag between the forces on upstream and downstream cylinder, as well as the effect of vortex-induced vibrations. The interaction between the gap vortices and the shear layers, has not been addressed by previous studies, to the best of the authors’ knowledge. Furthermore, although several studies have pointed to the recirculation in the gap and the change of the downstream cylinder wake, the mechanism of interaction between the gap and wake flow within the reattachment regime is not clarified. The aim of the present study is to characterise the development of the gap shear layers, and investigate the interaction between the recirculation in the gap, the gap shear layers and the near-wake of the downstream cylinder. This also includes the effect the inflow from the upstream cylinder has on downstream cylinder flow separation, shear layer development and vortex formation.
A secondary aim is to expand the  $Re$ range of detailed numerical investigations into tandem cylinder flow, as direct numerical simulations (DNS) in this field is thus far limited to
  $Re \lesssim 1000$. DNS can provide flow visualisations with a level of detail that cannot be achieved by any other method, save perhaps tomographic PIV (Hain, Kähler & Michaelis Reference Hain, Kähler and MIchaelis2008) with a very high spatial and temporal resolution (correspondingly onerous in set-up and execution, and, unfortunately, with a limited field of view size). The usefulness of such data cannot be exaggerated as an aid in the effort to increase our understanding of bluff body flows.
2. Numerical method and set-up
The geometry used in the present study consist of tandem cylinders of equal diameter, with the cylinder axis normal to the inflow. The computational domain is shown in figure 2(a). The gap ratio was  $L/D = 3.0$, which is in the middle of the reattachment regime, as defined by Xu & Zhou (Reference Xu and Zhou2004), near the limiting gap ratio where reattachment moves from the back face to the front face of the downstream cylinder. The
  $Re$ was 10 000, which is high enough that stable reattachment on the front face is expected. A single-cylinder case at the same
  $Re$ was computed, for comparison, and the results are provided in Appendix A.
(a) Computational domain and (b) illustration of element size in the boundary layer.

The governing equations are the three-dimensional, incompressible continuity equation and Navier–Stokes equations, which are solved through DNS:
 $$\begin{gather} \frac{\partial u_{j}}{\partial x_{j}} = 0, \end{gather}$$
 $$\begin{gather}\frac{\partial u_{i}}{\partial t} + u_{j} \frac{\partial u_{i}}{\partial x_{j}} ={-}\frac{1}{\rho} \frac{\partial P}{\partial x_{i}} + \frac{\partial}{\partial x_{j}} \left( \nu \left[ \frac{\partial u_{i}}{\partial x_{j}} + \frac{\partial u_{j}}{\partial x_{i}} \right] \right) , \quad i,j = 1,2,3. \end{gather}$$
The simulations were carried out using the MGLET flow solver, which is based on a finite-volume formulation of the incompressible Navier–Stokes equations (Manhart Reference Manhart2004). MGLET uses a staggered Cartesian grid, and introduces solid bodies through an immersed boundary method (Peller et al. Reference Peller, Le Duc, Tremblay and Manhart2006). The immersed boundary is discretised using a ghost-cell method. A third-order low-storage explicit Runge–Kutta time integration scheme is used for time stepping, and the Poisson equation is solved using an iterative, strongly implicit procedure. MGLET has recently been used to explore complex wakes behind three-dimensional bluff bodies (e.g. Jiang, Pettersen & Andersson Reference Jiang, Pettersen and Andersson2019; Dadmarzi et al. Reference Dadmarzi, Narasimhamurthy, Andersson and Pettersen2018).
Uniform inflow velocity  $U_{0}$ was imposed at the inlet
  $x/D = -16$. Periodic boundary conditions were implemented in the spanwise direction, and free-slip boundaries were used for the top and bottom of the domain. A Neumann condition was imposed on the velocity components at the outlet.
In this study, the grid resolution near the solid boundary is the same for single and tandem cylinders. Moreover, the resolution was the same for both upstream and downstream cylinders. Grid refinement was carried out by adding nested grid blocks, where each child block had half the element size of its parent. Within each block, the grid is equidistant. The grid had six levels, and the smallest element size was  ${\rm \Delta} x = {\rm \Delta} y = {\rm \Delta} z = 0.005D$. The most refined grid block had a height of
  $1.92D$ (symmetrical about the
  $y$ axis) and a length of
  $7.2D$, starting at
  $x/D = -0.5$. It spanned the entire domain in the
  $z$ direction. The grid size in the boundary layer of the upstream cylinder is illustrated in figure 2(b). The total number of elements was 682 and
  $987M$ for single and tandem cylinder studies, respectively. The same crossflow and spanwise domain size,
  $20.48D$ and
  $6.4D$, was used for both cases, but the distance from the origin to the outflow was
  $35.2D$ the single-cylinder case, as opposed to
  $44.5D$ for the tandem case.
The spanwise length was chosen in consideration of the three-dimensional behaviour of the flow. In their DNS study of a single cylinder with the same  $Re$ as the present study, Dong et al. (Reference Dong, Karniadakis, Ekmekci and Rockwell2006) use a spanwise length of
  ${\rm \pi} D$. However, Aljure et al. (Reference Aljure, Lehmkuhl, Rodrigues and Oliva2017) found that for a
  $Re$ of 5000, a spanwise length of
  $2{\rm \pi} D$ was needed to correctly capture the three-dimensional phenomena of the flow field. An initial simulation was carried out for a single cylinder with a spanwise length of
  $3.2D$, and the pressure distribution and separation were somewhat affected. Compared with a spanwise length of
  $6.4D$, the shorter cylinder exhibits a slightly increased mean base pressure coefficient (
 $\bar {C}_{pb} = (P - P_{0} ) /(P_{s} - P_{0})$, where
  $P$ is the pressure on the cylinder surface, and
  $P_{0}$ and
  $P_{s}$ are the free-stream and stagnation pressures, respectively) and shorter recirculation length
  $L_{r}$ (defined as the distance from the cylinder base to the point where the mean streamwise velocity turns positive), and the primary separation angle
  $\theta _{1}$ is delayed by approximately 2
 $^\circ$. Based on that result a spanwise length of
  $6.4D$ was chosen.
A grid refinement was carried out for the tandem cylinder case, where the smallest element was reduced to  ${\rm \Delta} x = {\rm \Delta} y = 0.0025 D$,
  ${\rm \Delta} z = 0.005D$, with a corresponding coarsening of the wake. The total number of elements was 2415 million. This resulted in a difference in the order of 4–5% in the spectral peaks,
  $L_{r}$, and
  $\bar {C}_{pb}$ of the upstream cylinder, as well as a 16% decrease in the
  $\bar {C}_{pb}$ of the downstream cylinder. However, the separation points were not affected, and the overall flow regime, with reattachment of the gap shear layers, remained unchanged. Therefore, in order to reduce computational cost while running a long-term simulation, the first grid was chosen.
In order to ensure ample data for statistics, the simulations were run for a long time. The sampling time for the single and tandem cases were  $tU_{0}/D \approx 1650$ and 2406, respectively, which corresponds to roughly 346 and 377 von Kármán vortex shedding cycles. The chosen timestep was
  ${\rm d}t = 0.002$.
Power spectra of the velocity components have been calculated from the time traces taken at various locations in the wake of the single cylinder, and the gap and near-wake of the tandem cylinders. Fast Fourier transform (FFT) was used to calculate the spectra, and they were averaged in the spanwise direction.
At the time these simulations were carried out, MGLET did not support computing drag and lift separately on multiple geometries within the domain. Body forces were presented for the combined geometries. Therefore, the force coefficients are not presented for the tandem cylinders, only for the single-cylinder reference case. In order to compute the separation and reattachment points, the tangential velocity field near the cylinder and its radial derivative were calculated, which gave the approximate point of zero shear stress. The tangential velocity profiles near that location were then investigated to find the velocity turning point, and this was used to adjust the computed estimate.
Throughout this paper, coefficient subscripts U and D refer to the upstream and downstream cylinder, respectively.
3. Results
3.1. Time-averaged flow field
Main statistics are given in table 1. There is good agreement between our results and results from the literature within the reattachment regime, at comparable gap ratios and  $Re$.
$Re$.
Statistical flow parameters, tandem cylinders. Note that Igarashi (Reference Igarashi1981) found bi-stable flow at a gap ratio of 3.09, which is why two St values are included in the table.

The mean gap flow, shown in figure 3, consist of an elongated, bounded recirculation region, with clear indication of large-scale vortex formation. These vortices are formed at the very end of the gap, and there is a rather long region of low velocities in the near-wake of the upstream cylinder. This is clearly shown in figure 4, which depicts the time-averaged contours of the streamwise and crossflow velocities. The base pressure coefficient of the upstream cylinder,  $\bar {C}_{pbU}$, is very similar to the downstream cylinder pressure coefficient at
  $\theta = 0$, which has a value of
  $-$0.55. The same result was found by Igarashi (Reference Igarashi1981), who concluded that it indicated the presence of gap vortices. Another recirculation region is seen in the downstream cylinder wake. This is the result of von Kármán shedding, as we show in § 3.4.
Time-averaged gap and near-wake streamlines for tandem cylinders with gap ratio  $L/D=3.0$ and
  $Re = 10{\,}000$.

Time-averaged streamwise ( $U/U_{0}$) and crossflow (
 $V/U_{0}$) velocity contours in the midplane. The gap region is characterised by recirculation, and there is an almost stagnant region in the immediate wake of the upstream cylinder. The recirculation bubble of the downstream cylinder is short and narrow. The maximum recirculation velocity is
  $U/U_{0} \approx -0.44$ in the gap, and
  $U/U_{0} \approx -0.19$ in the wake.

For the upstream cylinder, the primary separation occurs at  $\theta _{1U} = 85.0^{\circ }$, slightly further upstream compared with the single cylinder (see Appendix A). The recirculation in the gap results in a secondary separation bubble between
  $\theta _{3U} = 137.9^{\circ }$ and
  $\theta _{2U} = 108.1^{\circ }$. It is smaller than for the single-cylinder case, and pushed further towards the primary separation point. This is because the velocity of the backflow is much lower than for a single cylinder, causing the flow to remain attached to the cylinder base longer.
There is clear reattachment of the upstream cylinder shear layers onto the front face of the downstream cylinder, and the reattachment point,  $\theta _{R}$, compares well with the available literature. A noticeable feature of the downstream cylinder is that the subsequent separation occurs on the back face, at
  $\theta _{1D} = 119^{\circ }$, as opposed to a single cylinder in the subcritical regime. This is related to the turbulent inflow from the upstream cylinder, something discussed in detail in § 3.4.1. The delayed separation precludes the formation of a secondary separation bubble.
3.2. Instantaneous flow field in the gap region
The instantaneous flow field reveals the most important features of the gap flow, as shown in figure 5. These are the K-H instability and the associated shear layer vortices (A,B), their breakdown to turbulence (C), formation of large-scale gap vortices (D), a low-velocity stagnation region in the upstream cylinder near-wake (E) and a jet-like flow impinging on the upper shear layer (F). This last feature is important for the development of the shear layer instability and is discussed towards the end of this section.
Snapshot of gap flow at  $tU_{0}/D = 2005.8$, visualised by the normalised spanwise vorticity,
  $\omega _{z} D / U_{0}$. (A) K-H instability, (B) shear layer vortex shedding, (C) breakdown of shear layer vortices, (D) large-scale vortex formation, (E) low-velocity stagnation region and (F) jet-like flow impinging on the upper shear layer. The upstream cylinder shear layers are symmetrically displaced from the gap centreline by
  $\alpha \approx 10^{\circ }$.

The shear layers of the upstream cylinder are laminar upon separating, as expected in the subcritical  $Re$ range, and transition to turbulence starts approximately 1–
 $1.3D$ downstream of the separation point. Here, shear layer vortices start to form. At the end of the gap, these vortices are split up as they impinge on the downstream cylinder, so that part of the shear layer is entrained into the formation of large-scale gap vortices, and the remainder passes close by the downstream cylinder surface.
The shear layer vortices lose much of their coherence as they are convected downstream. Although the gap vortices are quite weak, the backflow in the gap exerts additional shear strain on the oncoming vortices, which increases dissipation and enhances the breakdown process after transition. Figure 6 shows how the shear layer vortices from the upstream cylinder break down while traversing the gap, forming smaller structures. There remains a weak spanwise organisation of these structures until reattachment, that consists of originally well-defined shear layer vortices, now transformed into looser ensembles of small-scale eddies.
Development of shear layer vortices in the gap, visualised by isosurfaces of  $Q = 10$ coloured by the spanwise vorticity, at
  $tU_{0}/D=2406.15$. For clarity, only the outermost part of the flow is included. The upper inset shows small-scale streamwise structures generated by stretching of the shear layer vortices. These have been coloured with the streamwise vorticity, to highlight their orientation. The lower inset shows an example of dislocations in the shear layer vortices.

The K-H instability is two-dimensional, which means that the shear layer vortices are created with an essentially spanwise orientation. Three-dimensionality, however, quickly ensues. The shear layer vortices are organised streamwise in cells of several vortices with a short spanwise length. As a result, a number of dislocations are visible in the gap. One example of this is shown in an inset in figure 6.
In this study, the transition to turbulence starts with the generation and shedding of shear layer vortices. Subsequently, vortex stretching and bending causes formation of streamwise structures in the shear layer, in a similar way to the mode B instability for single-cylinder wakes (Williamson Reference Williamson1996). This corresponds well with the finding of Williamson (Reference Williamson1995), that there are two scales for streamwise vortices in the flow, one for the wake and one for the separated shear layers. Wei & Smith (Reference Wei and Smith1986) also observed streamwise counter-rotating vortices in the shear layers for 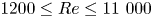 $1200 \leq Re \leq 11\ 000$. Early in the breakdown process, these streamwise vortices appear as loops reminiscent of the classical horseshoe vortices of plane mixing layers. An inset in figure 6 shows these structures, coloured by the streamwise vorticity for clarity. A movie which highlights the development and breakdown of the shear layer vortices is available as supplementary movie 1 is available at https://doi.org/10.1017/jfm.2022.960.
The length of the stable part of the shear layer is significantly longer for the upstream tandem cylinder than for the single cylinder in Appendix A. The gap shear layers are not parallel to each other as they separate, but appear to be pushed away from the gap centreline in opposite directions, as seen in figure 5. The displacement is approximately 10 $^\circ$. Moreover, there is hardly any difference between the instantaneous and time-averaged position of the gap shear layers; their crossflow position is quite stationary. This becomes evident when comparing figure 5 with figures 3 and 4. Altogether, these features indicate that the presence of the downstream cylinder stabilises the shear layers and delays the development of the K-H instability.
Though the time-averaged field shows symmetrical recirculation in the gap, the large-scale gap vortices develop asymmetrically, reminiscent of wake vortices. They are not shed, however, but disintegrate after a cycle of growth, and symmetry reasserts itself temporarily. Analysis of the velocity time trace immediately upstream of the downstream cylinder, given in figure 7, shows a clear spectral peak, demonstrating the periodicity of the gap vortices. Note that because the frequency of the gap vortices is the same as that of the wake vortices, it is marked  $f_{v}$ in the figure.
(a) Crossflow velocity signal at  $z/D = 0$ at a probe located directly upstream of the downstream cylinder, and (b) the corresponding spanwise-averaged spectrum. The spectral analysis clearly demonstrates the periodicity of the gap vortices. The exact position of the probe P4, is shown in figure 8.

An important difference between the gap vortices and vortices developing in an unconstrained wake, is that the streamwise position of a gap vortex does not change appreciably during a cycle. The position is dictated by the gap length. From visual observation, the gap vortices develop in phase, or nearly in phase, with the von Kármán vortices in the wake. However, there is spanwise inhomogeneity, as illustrated in figure 8(a), which results in local phase lag.
Spanwise inhomogeneity of the gap and wake vortices, illustrated by the temporal development of the crossflow velocity. The time signal is extracted at probe (a) P4 and (b) P7, located at  $(x/D,y/D) = (2.4, 0.0)$ and
  $(x/D,y/D) = (0.65, 5.0)$, respectively. The probe locations are illustrated in the inset. (a) shows that the gap vortices are inhomogeneous along the span, with patches of low crossflow velocities throughout the given time interval. The wake vortices in (b) are fairly homogeneous.

One of the benefits of the present well-resolved numerical simulations is that we can follow the small-scale parts of the flow, such as the shear layer vortices, closely. Snapshots of the evolution of some important flow features are provided in figure 9. In the figure, the time between snapshots is approximately 1/3 of the shear layer vortex shedding period.
Development of structures in the gap, visualised by the spanwise vorticity. One part of the lower shear layer rolls up into a large-scale gap vortex, whereas the rest flows past the downstream cylinder. Shear layer vortices, marked by arrows, form in both shear layers and undergo breakdown towards turbulence while traversing the gap. They are still weakly coherent upon reattachment, seen as loose ensembles of smaller structures. The upper shear layer progresses faster towards turbulence than the lower. A pairing event takes place in the upper shear layer, marked by a small circle. The final wavelength,  $w_{2}$ is twice that of the preceding shear layer vortices,
  $w_{1}$.

The snapshot series in figure 9 begins just as the gap vortex from the upper shear layer has disintegrated and the lower shear layer has begun rolling up. Towards the end of the series, in figure 9(h), this vortex has grown distinctly. A sketch of its progression is superimposed. Before disintegration, its diameter will have increased so that it fills the entire height of the gap. This is shown in a supplementary movie 2, which covers the same time interval as Movie 1, and includes the series in figure 9.
In figure 9, we follow the development of two shear layer vortices, marked by arrows, one in the upper and one in the lower shear layer. The lower vortex is about to detach at the beginning of the series, in figure 9(a), and in figure 9(h) entrainment into the large-scale vortex has begun. Although the vortices in the lower shear layer deform significantly as they travel along the gap, it is apparent from these snapshots that they do not undergo full breakdown to turbulence before being entrained.
From a qualitative point of view, the disintegration of the vortices in the upper shear layer progresses faster than those on the opposite side of the gap, in the time period presented in figure 9. The marked vortex in the upper shear layer has just started forming in figure 9(a), but by figure 9(h) it has undergone strong deformation and is well underway to disintegrate. The differences between the upper and lower shear layer are related to a high-velocity flow in the gap, the aforementioned jet-like flow, and discussed shortly.
A vortex pairing event unfolds after transition in the upper shear layer, marked by a small circle in figure 9. The event is not very clear, due to the disordered state of the vortices, but we see that the two structures undergo pairing between figures 9(a) and 9(g). In figure 9(h), it is evident that the pairing has resulted in a longer wavelength of the shear layer vortices.
All through the series in figure 9, we see that there is very little activity in the region in the immediate wake of the upstream cylinder. The flow here is almost stagnant, compared with the evolution of the shear layers and the large-scale vortex. There seems to be little communication between the inner part of the shear layer, towards the separation point, and the gap vortex formation and shear layer impingement occurring at the end of the gap. This has consequences for the development of the shear layer instability, which are discussed in § 3.3.
Figure 10, which shows the same time instant as figure 9(g), gives an indication of the mechanism behind the accelerated breakdown of the upper shear layer. Here, we draw the directions of different parts of the flow at a time instant when the gap vortex is approximately half way in its cycle of formation and disintegration. As the vortex forms, it entrains part of the lower shear layer from which it rolls up, as well as part of the recirculating fluid from the upper shear layer. This fluid is pushed down along the front face of the downstream cylinder and then pulled along the outer boundary of the vortex. Simultaneously a flow with higher velocities than the surrounding fluid is directed towards the upper shear layer. This flow is dubbed ‘jet-like’ because of its appearance in the visualisations, although it is a quasi-two-dimensional feature, not an actual axisymmetric jet. There is a small region of low-velocity fluid trapped between the upper shear layer, the recirculating part, the gap vortex and the jet. As the vortex grows, this region shrinks until the vortex comes in direct contact with the upper shear layer.
Flow directions in the gap and near-wake at  $tU_{0}/D = 2005.86$, superimposed on the spanwise vorticity field. A jet-like flow crossing the gap impacts the opposite shear layer, increasing the turbulent activity. Part of the jet is diverted upstream, and if the vorticity in this fluid is strong enough it may trigger early transition to turbulence in the shear layer.

The jet-like flow is the main contributor to the enhanced breakdown of the shear layer opposite the gap vortex. Most of the jet fluid is entrained into the shear layer, but a small part is diverted towards the separation point. The jet-like flow may originate from the formation of the gap vortex, or it may be a remnant of the previous gap vortex. Most likely, perhaps, it is a result contributions from both vortices. It is strongest just after disintegration of the previous gap vortex, when the new one is beginning to form.
Interestingly, the jet-like flow phenomenon does not occur simultaneously along the whole cylinder span, which is related to the spanwise inhomogeneity of the gap vortices. An impact region is marked figure 6, where the jet-like flow visibly influences the development of the shear layer. In this case, the region is approximately 1.5D long. The result of the spanwise variation in the gap vortex formation and the occurrence of the jet-like flow is enhanced three-dimensionality of the wake.
3.3. Development of the shear layers
Figure 11 shows the crossflow velocity time signal and spectrum taken from a probe in the shear layer of the upstream cylinder. Although the frequency of the large-scale vortex formation is detected in this region, it is significantly weaker than that of the shear layer vortices. Spectra computed from probes further downstream in the gap are also included in figure 11(b), for comparison. The large-scale vortex frequency is gradually obscured by the increased turbulent activity when we move into the gap.
(a) Crossflow velocity signal in the plane  $z/D =0$ and (b) spanwise-averaged power spectral density (PSD) for probe P0 in the upstream shear layer. The smaller graphs inset in (b) show the spectra from probes further into the gap (P1, P2). Here, turbulent activity is strengthened, which obscures the shear layer vortex peaks. Note that these spectra are shown for their shape only, and they are not scaled to the strength on the vertical plot axis. The inset in (a) illustrates the location of the probes. The coordinates of P0, P1 and P2 are
  $(x/D, y/D) = (0.4, 0.6)$, (0.65, 0.65) and (1.0, 0.65), respectively.

The tail of each spectrum in figure 11(b) is steep compared with velocity spectra for fully developed turbulence, which are expected approximately follow Kolmogorov's  $-$5/3 power law (Kraichnan Reference Kraichnan1974). This is because the flow at the locations of the probes in question is only intermittently turbulent. Similar spectra are found for velocity and turbulent kinetic energy in the outer region of free jets, where turbulence is also intermittent (Fellouah, Ball & Pollard Reference Fellouah, Ball and Pollard2009; Yaacob, Buchhave & Velte Reference Yaacob, Buchhave and Velte2021). Probes placed further into the gap, where the flow is more turbulent, have less steep spectra, as seen when comparing P2 and P0.
Instead of one narrow peak, like that of the large-scale gap vortices, the shear layer covers a wide range of frequencies, seen as a broadband region with three distinctive peaks in figure 11(b). This is consistent with the single-cylinder studies of Khabbouchi et al. (Reference Khabbouchi, Fellouah, Ferchichi and Guellouz2014) and Dong et al. (Reference Dong, Karniadakis, Ekmekci and Rockwell2006). The latter did not see separate shear layer peaks, rather a broadband plateau, similar to the single cylinder in the present study. The highest peak, with a main frequency of  $f_{sl} = 2.5 U_{0}/D$, is associated with the shedding of shear layer vortices, whereas the secondary peaks are its harmonic and subharmonic. Here
  $2f_{sl}$ corresponds to shear layer vortex breakdown, whereas the subharmonic
  $0.5f_{sl}$ is associated with vortex pairing in the shear layer. The value of the main peak frequency is very similar to that of the single-cylinder case, which is
  $f_{sl} \approx 2.6 U_{0}/D$. The similarity indicates that, in addition to the delayed inception, the shear layer instability is not significantly affected by the presence of the downstream cylinder, as opposed to the primary instability. This is consistent with the observations of Kourta et al. (Reference Kourta, Boissin, Chassing and Ha Minh1987) for a single cylinder with a splitter plate in the wake. It is not an altogether surprising result, as K-H instability and the primary instability are two separate phenomena that may occur independently. For example, K-H vortices are found along the boundaries of free jets, or in the shear regions between atmospheric flows, as well as for single cylinders above a certain
  $Re$. When both instabilities are present in a flow, they may interact (Kourta et al. Reference Kourta, Boissin, Chassing and Ha Minh1987), but one does not depend on the presence of the other in order to develop.
The transition region in the shear layers exhibits a degree of random meandering, manifested as intermittency in the velocity signal from probes in the gap, as exemplified in figure 11(a). Close to the upstream cylinder, the crossflow velocity signal shows distinct periods of strong fluctuations that occur at irregular intervals over a long period of time. When moving to a probe further downstream, strong oscillations become frequent. This is shown in figure 12, which compares the crossflow velocity signal sampled at two positions for single and tandem cylinders.
Crossflow velocity signal over 25 vortex shedding cycles for (a) single and (b) tandem cylinders at two probes in the shear layer, in the plane  $z/D = 0$. Probe locations are shown in figure 11. For the tandem cylinders, early triggering of the shear layer instability leads to stronger oscillations downstream. One such event is marked by a dashed rectangle.

For the single-cylinder case in figure 12, there is very little difference in the number of shear layer fluctuations between the measurements taken in the near-wake and closer to the separation point. For the tandem cylinders, however, the difference is remarkable. Whereas only a few packets can be observed close to the upstream cylinder, the fluctuations are nearly continuous at  $x/D=1.0$. Recalling Prasad & Williamson's (Reference Prasad and Williamson1997) result, few packets at the upstream location implies that there is less meandering of the transition region in the tandem cylinder case. Furthermore, if we compare the influence of large-scale vortices on the shear layers, we see that the von Kármán shedding in the wake of the single cylinder clearly visible in the time traces in figure 12(a), but the gap vortices can barely be discerned in the time trace of the tandem cylinder gap probes in figure 12(b).
Being weaker than their single-cylinder counterparts, the gap vortices provide recirculated fluid with weaker vorticity. Further, the low-velocity region near the upstream cylinder back face is not directly touched by the gap vortices, as seen all through the snapshot series in figure 9. Little communication along the gap and weak vorticity means that there is a low supply of recirculated structures that are strong enough to amplify the shear layer instability and trigger transition close to the cylinder. This accounts for the low number of fluctuation ‘packets’ at probe P0, as shown in figure 12. P2, on the other hand, is almost always located in the transition region, and likewise receives an inflow of strong small-scale structures from the jet-like flow described in § 3.2. Conversely, it seems probable that early triggering of the shear layer instability (near probe P0) is caused by the part of the jet-like flow that is diverted upstream. Although triggering events in the upper and lower shear layers may overlap in time, there is no evidence in the present study that they are generally in-phase. This is consistent with the results of previous investigations (Rai Reference Rai2010).
Owing to transition to turbulence in the upstream shear layer, and the large-scale vortex formation in the gap, the reattachment points on the downstream cylinder are unsteady and asymmetrical with respect to the gap centreline. It is challenging to compute the instantaneous location of the reattachment points, but visual observation of the spanwise vorticity is a simple method that can give an indication of their whereabouts. The variation of the instantaneous reattachment in the plane  $z/D=0$ has been recorded during part of the vortex formation in the lower shear layer. The results are shown in figure 13. During this short time interval, the absolute value fluctuates between 50
 $^{\circ }$ and 65
 $^{\circ }$, for both reattachment points. Recalling from table 1 that the time-averaged reattachment location is 62.0
 $^{\circ }$, it follows that the temporal variation must be significant. For a single cylinder, the shear layers move transversely due to large-scale vortex shedding, but, as we have seen, this is not the case for the tandem cylinders herein. Thus, the main contribution to the high-speed fluctuations in reattachment position comes from instantaneous changes in the thickness of the turbulent part of the shear layer.
Instantaneous upper ( $Ru$) and lower (
 $Rl$) reattachment points in the plane
  $z/D = 0$, during formation of a large-scale vortex in the lower shear layer. The points are gleaned by a simple method, visual observation of the instantaneous spanwise vorticity, but provide useful insight into the unsteadiness of the reattachment. The lower reattachment point is given by its absolute value, to facilitate comparison.

In the present study, the results indicate that shear layer vortex pairing takes place both for single and tandem cylinders. For the single cylinder, the spectral peaks in figure 19(b) are less pronounced than for the tandem cylinders in figure 11(b), although the subharmonic and harmonic of  $f_{sl}$ can be discerned. This is consistent with the observations of Cardell (Reference Cardell1993), who saw that for the unconstrained single-cylinder near-wake, the subharmonic had developed to approximately the same amplitude as the main shear layer peak at
  $Re \approx 10\,000$. For the tandem spectra the difference in energy between
  $f_{sl}$ and
  $0.5f_{sl}$ decreases into the wake, where pairing is more frequent. At P2, the peaks are almost of equal height, so that this part of the spectrum compares well with the single-cylinder spectrum in figure 19(b). In addition to the event from figure 9, two distinct shear layer vortex pairing events are seen in figure 14, one in each shear layer. These have been marked for clarity. To the best of the authors’ knowledge, this is the first time vortex pairing in the gap shear layers of tandem cylinders has been reported.
Vortex pairing events in the shear layers at  $z/D = 0.5$,
  $tU_{0}/D=2406.15$, visualised by the spanwise vorticity.

3.4. Instantaneous wake structure
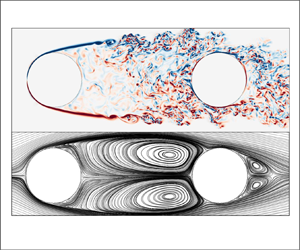
The wakes of the single and tandem cylinders at the same Reynolds number are strikingly different. The inset in figure 15 clearly shows that the tandem wake is narrower, and the vortices appear elongated. Increased mixing and diffusion, due to turbulent inflow from the upstream cylinder, causes the small structures of the tandem cylinder wake to be more uniform in terms of scale, and also more three-dimensional, which is shown in figure 15. Unlike the single-cylinder wake (see figure 19c), the tandem wake does not display a clear spanwise versus streamwise organisation, apart from the large-scale shedding.
Isometric view of the gap and wake flow of the tandem cylinders at  $tU_{0}/D = 2406.15$, represented by isosurfaces of
  $Q(D/U_{0})^{2}=5$ coloured by
  $\omega _{z} D/ U_{0}$. The inset shows a side view of the single and tandem cylinder wakes. For the tandem cylinders, the wake is narrowed, and the vortices are elongated compared with the single-cylinder vortices. The streamwise structures from the single-cylinder wake are missing for tandem cylinders, due to turbulent activity from the upstream cylinder shear layers.

The disappearance of the streamwise vortical structures for the tandem cylinders must be seen in connection with the turbulent inflow, as well as the strength of the von Kármán vortices. The streamwise vortices formed in instability mode B originate when streamwise vorticity is amplified through vortex stretching (Williamson Reference Williamson1996). However, this process is dampened by diffusion. The increased diffusion due to the turbulent inflow, coupled with the reduced strength of the primary vortices, giving a lower supply of vorticity to the braid regions, precludes the formation of sizable streamwise vortices. It must be noted that streamwise vortices have been observed in the wake of tandem cylinders at low  $Re$, where transition to turbulence occurs in the wake rather than in the shear layers (Carmo, Meneghini & Sherwin Reference Carmo, Meneghini and Sherwin2010).
Lin et al. (Reference Lin, Yang and Rockwell2002) also pointed out the changed shape of the wake vortices. They claim that for gap ratios up to  $L/D = 2.0$, the vortices have a tendency not to cut the opposing shear layer during the formation process. This cannot be the case because it is a prerequisite of shedding that the forming vortex cut the opposing shear layer. In our study, we see that this process is somewhat obscured by the incoming shear layer structures of the upstream cylinder, which may be a cause of the misunderstanding. Reattachment of the turbulent shear layers appears very neat and ordered in the time-averaged flow field (see figure 3), but in reality it is less straightforward. We have found that it is a combination of impinging structures, and structures that are drawn towards the downstream cylinder due to the increased velocity over the cylinder surface. The path and orientation of these outer structures are changed but they do not blend completely with the downstream shear layer. Rather they lie as an extra layer outside it until entrained in the von Kármán vortex. Moreover, the entire outer layer is not necessarily entrained during the wake vortex formation. Some of the structures pass over the forming vortices to merge with the wake a little further downstream. This can be seen in supplementary movie 2. The wake vortices do not necessarily cut through the outer layer of incoming shear layer structures as they form, just the shear layer originating from the downstream cylinder itself, which is likely what caused the erroneous conclusion of Lin et al. (Reference Lin, Yang and Rockwell2002) on that subject.
The von Kármán vortex shedding has a dominant frequency  $St = 0.157$, which agrees well with previous studies (see table 1). Figure 16 shows the time signal and resulting spectrum of a probe in the wake. There are secondary peaks near
  $f_{v}$. A wider bandwidth of the vortex shedding frequency is typical of single-cylinder wakes above
  $Re \approx 5000$, resulting from spanwise frequency variations (Aljure et al. Reference Aljure, Lehmkuhl, Rodrigues and Oliva2017).
(a) Crossflow velocity signal at  $z/D = 0$ at probe P7 and (b) the corresponding spanwise averaged spectrum. The probe is situated in the downstream cylinder wake, and its exact location is given in figure 8.

3.4.1. The effect of turbulent inflow to the downstream cylinder
As already mentioned, the downstream cylinder is completely submerged in the turbulent wake of the upstream one. That perturbations in the incident flow affects the flow field around a single cylinder is well known, so we must expect alterations in the downstream cylinder flow field. It was established in the previous sections that the overall effect is relocation of the primary separation point to the back face, suppression of secondary separation and a narrowed wake. Surprisingly, the influence of the turbulent inflow to the downstream cylinder has not yet been examined in detail in the literature, although the effect of incident turbulence to both cylinders has been studied Ljungkrona et al. (Reference Ljungkrona, Norberg and Sunden1991), and the narrow wake as been remarked by several (Ljungkrona et al. Reference Ljungkrona, Norberg and Sunden1991; Lin et al. Reference Lin, Yang and Rockwell2002; Zhou et al. Reference Zhou, Alam, Cao, Liao and Li2019). With good resolution of the flow near the solid bodies, we are in a unique position to study this phenomenon.
Figure 17 shows the effect of the incoming turbulence on the instantaneous flow features of the downstream cylinder. The boundary layer is subjected to continuous buffeting near the reattachment point, as well as additional strain from interaction with the outer shear layer. No shear layer frequency peak could be detected in this region, and only intermittently is elongation of a laminar inner shear layer seen, with the shedding of shear layer vortices.
Snapshot of the downstream cylinder spanwise vorticity field, at  $tU_{0}/D = 2005.3$. Interaction between the inner and outer parts of the shear layer leads to shortening and distortion of the inner layer, with only intermittent shedding of shear layer vortices. Buffeting of the boundary layer by the upstream cylinder shear layer and interaction with the outer part contributes to delayed separation.

Few tandem cylinder studies explicitly list the separation angle of the downstream cylinder, but the overall impression is that within the reattachment regime, separation occurs on the back face. Lee & Basu (Reference Lee and Basu1997) and Alam et al. (Reference Alam, Moriya, Takai and Sakamoto2003) found separation angles of 120 $^\circ$ and 113
 $^\circ$, respectively, for
  $Re = 4.0\times 10^{4}$ and
  $6.5 \times 10^{4}$. The result of Zhou et al. (Reference Zhou, Alam, Cao, Liao and Li2019) is interesting, in this respect. At a
  $Re$ of
  $10^{3}$, they found that the separation on the downstream cylinder varied between 122
 $^\circ$ and 128
 $^\circ$ for gap ratios
  $1.5 \leq L/D \leq 3.5$. Although the
  $Re$ is significantly lower than in the present study, the result is qualitatively similar. This indicates that, at least within the subcritical range, the flow around the downstream cylinder is independent of
  $Re$.
$Re$.
The recirculation bubble is shortened compared with the single-cylinder reference case, from  $L_{r} = 0.62$ to 0.45. Ishigai et al. (Reference Ishigai, Nishikawa and Cho1972) also saw a substantial shortening of the recirculation region,
  $L_{r} = 0.25$, at a gap ratio of 3.0 and
  $Re = 3900$. Lin et al. (Reference Lin, Yang and Rockwell2002), on the other hand, found that although the wake was narrowed, the recirculation length was not affected to any significant degree for gap ratios 1.25 to 2.0 and
  $Re = 10\,000$.
When looking at the flow field of the downstream cylinder, it is instructive to consider the effect of incident FST on a single cylinder. Naturally, this is a simplified model. We must also keep in mind that the turbulence level of the flow impinging on the downstream cylinder is significantly higher than in the available studies, which typically have turbulence intensities of 1–10% (Zdravkovich Reference Zdravkovich1997). Mechanisms associated with FST are accelerated transition to turbulence in the free shear layers and boundary layer, and enhanced mixing and entrainment (Bearman & Morel Reference Bearman and Morel1983). Khabbouchi et al. (Reference Khabbouchi, Fellouah, Ferchichi and Guellouz2014) reported that increased FST promoted breakdown of shear layer vortices and corresponded with a decrease in recirculation length, which corresponds well with the present results. However, for a single cylinder in the subcritical regime, the influence of FST is expected to be limited to the shear layers, with the boundary layer remaining laminar.
In the present study, it is likely that transition to turbulence in the downstream cylinder boundary layer is triggered by the buffeting from, and interaction with, the upstream cylinder shear layers. This hypothesis is strengthened by the fact that the primary separation point is moved to the back face, which is a known feature of transition to turbulence in the boundary layer for single cylinders. That shedding of shear layer vortices (a feature of transition in the shear layers) does happen in the present study, albeit intermittently, indicates that the boundary layer transition is not stationary in time.
4. Discussion
The gap flow shares many similarities with single cylinders with splitter plates, where large-scale vortex shedding is partially or completely suppressed in the near-wake region. This includes stabilisation of the separation point, delayed transition to turbulence in the separated shear layers, enhanced vortex pairing and reduced meandering of the transition region (Unal & Rockwell Reference Unal and Rockwell1988b; Cardell Reference Cardell1993). Studies with a gap between the cylinder base and splitter plate underline the similarity (Roshko Reference Roshko1954; Ozono Reference Ozono1999). Qualitatively, the effect on the upstream cylinder is the same irrespective of whether the downstream interference element, to use Roshko's terminology, is a cylinder or a flat plate. From this, we may infer that the mechanism of stabilisation is the same, namely inhibited communication between the separated shear layers.
The nature of the recirculation in the gap changes with the gap ratio. Lin et al. (Reference Lin, Yang and Rockwell2002) reported intermittent alternations between symmetrical and asymmetrical recirculation patterns at  $L/D = 2.0$, and a similar result was found by Zhou et al. (Reference Zhou, Alam, Cao, Liao and Li2019). In our case the recirculation is distinctly periodic and asymmetrical. By comparing our study with others at different gap ratios, a hypothesis is formed that there is a second critical gap spacing, preceding the transition co-shedding, at which the primary instability can start developing. This would explain why Lin et al. (Reference Lin, Yang and Rockwell2002) saw only symmetrical recirculation at low gap ratios, followed by intermittent symmetry/asymmetry when the gap ratio increased. Before this new critical spacing is reached, the recirculation in the gap is caused primarily by geometrical constraint. The downstream cylinder blocks the path of separated shear layer and forces its lower part to recirculate, whereas the upper part is reattached. Then, as the gap ratio is increased, true roll-up of the shear layer into large-scale eddies starts to happen. As we have only investigated a single gap ratio in this study, we cannot conclude firmly on this.
The interaction between the gap vortices depends on the type of recirculation. The mechanisms seen in the present study, direct interaction between a gap vortex and the opposite shear layer, as well as the jet-like flow, are features of asymmetrical recirculation. Lin et al. (Reference Lin, Yang and Rockwell2002) found a different type of jet flow, acting horizontally, along the centreline of the gap, where interaction occurs primarily with the upstream cylinder base. It is conceivable that, should this jet be strong enough, it could influence the development of the shear layers when the jet fluid is diverted outwards after impinging on the upstream cylinder.
In Ishigai et al.'s (Reference Ishigai, Nishikawa and Cho1972) study, the visualisations show that the transition region in the gap shear layer moves upstream with increasing gap ratio, at essentially the same  $Re$ (variation only within the range 3400–4000). The experimental technique (Schlieren method, where the cylinder is heated) makes estimation of the shear layer thickness from the photograph impossible. However, the trend regarding the transition region is still valid, and it can be coupled with Rai's (Reference Rai2010) result regarding the shear layer instability. In the present study, we have seen that the low strength of the gap vortices with respect to a single cylinder leads to less meandering of the transition region. If the gap ratio is increased, so is the strength of the gap vortices, accompanied by stronger small-scale recirculated structures, and a corresponding upstream movement of the shear layer transition region. Here, we must underline that instability of the shear layer occurs regardless of whether or not there is recirculation, but we believe that for tandem cylinders, its inception, and hence the position of the transition region, is influenced by the mechanism described previously.
The position of the transition region is important because it influences the near-wake of the downstream cylinder, and hence the structure of the large-scale shedding. Early transition allows the shear layer to develop further before reattachment, which results in an increase in the turbulence intensity in the inflow to the downstream cylinder. In § 3.4.1, it was suggested that this leads to transition to turbulence in the boundary layer, instead of in the shear layers. Zhou et al.'s (Reference Zhou, Alam, Cao, Liao and Li2019) results show that the downstream cylinder separation angle increases with increasing gap ratio within the reattachment regime. In addition to increasing the turbulence of the inflow, increasing the gap ratio also pushes the reattachment point upstream, allowing the downstream boundary layer to develop further before separating, as pointed out by Zhou & Yiu (Reference Zhou and Yiu2006). These two factors, increased turbulence and increased time for the boundary layer to develop, lead to delayed separation with increasing gap ratio.
The spanwise inhomogeneity of the gap vortices is interesting in itself, and because it gives rise to dynamics that influence the development of the shear layers. A possible explanation for the inhomogeneity is the mode B instability (Williamson Reference Williamson1996), which causes waviness of spanwise structures. This could potentially lead to spanwise crossflow velocity variations such as those observed in figure 8(a). Another possibility is that there is spanwise localised bi-stability, i.e. that the flow regime switches from reattachment to co-shedding intermittently, within a spanwise cell. For single cylinders, cellular vortex shedding is known to occur, caused by spanwise variations in phase and/or frequency. In experiments, a high aspect ratio is required to obtain this, due to blockage. In numerical simulations, the use of periodic boundary conditions in the spanwise direction allows for a lower aspect ratio. In the study of Aljure et al. (Reference Aljure, Lehmkuhl, Rodrigues and Oliva2017), spanwise von Kármán cells and dislocations are evident for  $z/D = 2{\rm \pi}$ and
  $3 {\rm \pi}$. The velocity spectra in both figures 7and 11 show signs of a secondary peaks near
  $f_{v}$. This is indicative of slight frequency differences in the von Kármán vortex shedding, and may include a mode of bi-stability with alternating reattachment, similar to the findings of Kitagawa & Ohta (Reference Kitagawa and Ohta2008). The spanwise behaviour of the large-scale vortices is not discussed in the literature, where the flow regime is normally presented on a two-dimensional cross section, implicitly implying homogeneity. Meanwhile, with the degree of three-dimensionality observed in the present study, combined with the bandwidth of the crossflow velocity spectra, cell-like occurrences of bi-stability are not unlikely.
Considering the reduced recirculation length behind the downstream cylinder, it is seemingly a paradox that the Strouhal number is lower than for a single cylinder at the same  $Re$. Xu & Zhou (Reference Xu and Zhou2004) suggested that this was caused by a ‘lock-in’ effect similar to what has been reported within the co-shedding regime, where the shedding behind the downstream cylinder is governed by the wake shedding of the upstream cylinder (Wang et al. Reference Wang, Alam and Zhou2018). Overall, the gap and wake vortices develop in-phase, and gap vortices exert direct periodic forcing on the downstream cylinder boundary layer, which supports the lock-in hypothesis. Moreover, the low frequency is consistent with an elongated recirculation length, such as that of the gap vortices. Although the lock-in hypothesis seems most probable in the present case, it is possible that the mechanism of interaction between the gap and wake flow changes with the gap ratio. As long as the primary instability of the gap vortices is blocked, at low gap ratios, periodicity in the gap region may be driven by upstream influence from the wake vortices.
5. Concluding remarks
In this study, DNS of flow around tandem cylinders at  $Re = 10\,000$ have been carried out for the first time, at a gap ratio of
  $L/D = 3.0$. The obtained spatial and temporal resolution made it possible to study the gap shear layers and their development with unprecedented detail. This gives new insight into the dynamics of the tandem cylinder gap region and the interaction between large- and small-scale vortical structures, as well as the reattachment mechanism and the effect on the development of the downstream cylinder wake.
We have seen that the flow in the gap between tandem cylinders in the reattachment regime shares similarities with that of a single cylinder with a splitter plate in the wake, due to the lack of vortex shedding in the gap. This is manifested in enhanced stability of the separation points, as well as the shear layers. Little or no crossflow motion of the shear layers is seen, and the onset of the K-H instability is delayed. Shear layer vortex pairing is reported for the first time for tandem cylinders.
There is formation of vortices at the end of the gap, which are asymmetrical and distinctly periodic, with the same frequency as the downstream cylinder wake shedding. Surprisingly, however, the gap vortices are not homogeneous along the span, and the results suggest that there may be spanwise localised bi-stability, with intermittent shedding in spanwise cells.
The gap vortices and the gap shear layers interact by two main mechanisms. One is direct, as the cyclic growth of the gap vortex is large enough for it to come into contact with the opposite shear layer before it disintegrates. The other mechanism is indirect. In the early stages of gap vortex formation, when the previous gap vortex is nearly disintegrated, a jet-like flow is directed towards the opposite shear layer, which contributes to increased turbulent activity. Moreover, some of the fluid from this flow is directed upstream, where it amplifies the shear layer instability and contributes to early transition to turbulence in the shear layer. Because the gap vortices are spanwise inhomogeneous, the jet-like flow does not occur simultaneously across the span. This enhances the three-dimensionality in the gap and wake flow.
Reattachment itself is seen to be very complex, due to transition to turbulence in the gap shear layers. The instantaneous reattachment position exhibits random fluctuations over a range of some 20 $^{\circ }$, on a very fine time scale. Moreover, we have found that reattachment is not complete, in the sense that the upstream cylinder shear layer does not merge directly with that of the downstream cylinder. Rather, reattachment is a combination of impingement and interaction between the upstream cylinder shear layer and the downstream cylinder boundary layer and shear layer. The upstream cylinder shear layer lies outside the downstream one, without merging with it, until they are both entrained in the wake. This type of a double shear layer has not been reported in previous tandem cylinder studies, to the best of the authors’ knowledge.
The wake of tandem cylinders in the reattachment regime is significantly altered with respect to a single cylinder at the same  $Re$, with delayed separation on the downstream cylinder, a shortened recirculation length and a significantly narrowed wake width. We believe that forcing of the downstream cylinder boundary layer from the impinging part of the upstream shear layer, as well as interaction downstream of the reattachment point, causes transition to turbulence in the boundary layer.
The turbulent inflow to the downstream cylinder changes the flow topology of the wake, causing the disappearance the streamwise vortical structures seen for the single cylinder. This is due to enhanced diffusion and weaker large-scale vortex strength, both of which weaken the mode B type instability in the wake.
Finally, it is interesting to note that between the few tandem cylinder studies that have reported separation angle for the downstream cylinder, there is relatively good agreement even over a wide range of  $Re$. Therefore, it is not an unreasonable conjecture that within the subcritical regime, the inflow
  $Re$ has little influence on the flow field of the downstream cylinder, and the flow tends to a one-parameter case determined only by the gap ratio. A more extensive survey is required to conclude firmly.
Supplementary movies
Supplementary movies are available at https://doi.org/10.1017/jfm.2022.960.
Funding
This work is supported by the Research Council of Norway through the Public Sector PhD Scheme, and the National Public Roads Administration, where the first author is an employee. Computational hours were granted by the Norwegian HPC project NN9191K.
Declaration of interest
The authors report no conflict of interest.
Appendix A. Flow around a single circular cylinder at Reynolds number 10 000
As a reference case, the flow field around a single cylinder at  $Re = 10\,000$ was computed. Statistical flow parameters are given in table 2, and compared with previous investigations. The present results agree with the literature, although the obtained
  $L_{r}$ is somewhat shorter. It is difficult to pinpoint the exact reason for this, but one possibility is that there is a long-term variation of
  $L_{r}$ that has been captured in our simulation. For example Dong et al. (Reference Dong, Karniadakis, Ekmekci and Rockwell2006) sampled statistics over approximately 50 vortex shedding cycles, whereas we have sampled over nearly 350 cycles. For a single cylinder at
  $Re = 3900$, Parnaudeau et al. (Reference Parnaudeau, Carlier, Heitz and Lamballais2008) investigated the sensitivity of the recirculation length with respect to time integration, and found that no convergence can be expected before approximately 250 shedding cycles.
Flow statistics for a single cylinder. Wei & Smith (Reference Wei and Smith1986) tested several cylinders of varying diameter. Here, only the  $d = 5.84$ cm case is included. The drag and lift coefficients,
  $C_{D}$ and
  $C_{L}$, are defined as
  $C = 2F/ \rho U_{0}^{2} DL_{z}$, where
  $F$ is the drag or lift force,
  $\rho$ is the fluid density and
  $L_{z}$ is the spanwise cylinder length. The r.m.s. of
  $C_{L}$ is used.
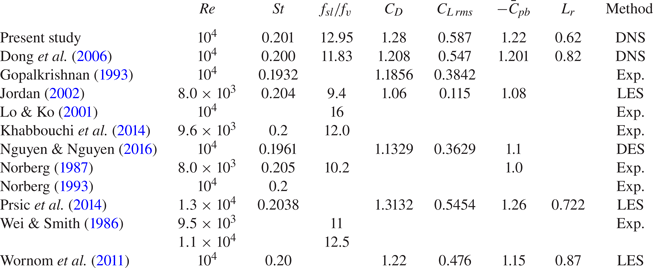
The time-averaged streamwise and crossflow velocities, as well as the streamlines, are shown in figure 18. Separation occurs at  $\theta _{1} = 88.1^{\circ }$. This compares well with Jordan (Reference Jordan2002), Wornom et al. (Reference Wornom, Ouvrard, Salvetti, Koobus and Dervieux2011) and Prsic et al. (Reference Prsic, Ong, Pettersen and Myrhaug2014) who found primary separation at 87.8
 $^{\circ }$, 87
 $^{\circ }$ and 87.6
 $^{\circ }$, respectively. Son & Hanratty (Reference Son and Hanratty1969) reported separation at 84
 $^{\circ }$ for
  $Re = 10^{4}$.
Time-averaged (a) streamwise and (b) crossflow velocities and (c) time-averaged streamlines for a single cylinder at  $Re = 10\ 000$. Primary separation occurs at
  $\theta _{1} = 88.1 ^{\circ }$, and there is a secondary separation bubble.

There is secondary separation initiated by the recirculating flow at  $\theta _{3} = 157.6^{\circ }$, which reattaches at
  $\theta _{2} = 110.0^{\circ }$. Both Prsic et al. (Reference Prsic, Ong, Pettersen and Myrhaug2014) and Son & Hanratty (Reference Son and Hanratty1969) report secondary separation with
  $\theta _{2} = 106^{\circ }$.
Figure 19(a) depicts the instantaneous flow, represented by the spanwise vorticity. The shear layers are almost parallel to each other, and roll up to form a von Kármán vortex street in the wake. Shear layer vortices form  $0.75D$–
 $1.0D$ downstream of separation. In figure 19(c), the instantaneous wake structure is visualised by isosurfaces of non-dimensionalised
  $Q$ (Hunt, Wray & Moin Reference Hunt, Wray and Moin1988). We see that the streamwise position of transition to turbulence in the shear layer is not coherent across the cylinder span. This spanwise non-uniformity of transition causes the shear layer vortices to appear in cells or stacks, which in turn causes dislocations in these small-scale structures, contributing to rapid development of three-dimensionality.
Instantaneous wake of a single cylinder at  $Re = 10\,000$, at
  $tU_{0}/D=1050$. (a) Spanwise vorticity in the plane
  $z/D = 0$. The shear layers are nearly parallel and shear layer vortices are formed
  $0.75D$–
 $1D$ after separation. (b) Crossflow velocity spectrum at
 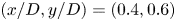 $(x/D, y/D)= (0.4,0.6)$. (c) Isosurfaces of
  $Q(D/U_{0})^{2}=25$ coloured by
  $\omega _{z}$. Shear layer vortices organised in spanwise stacks are seen in the near-wake. Streamwise structures bridge the large-scale vortices in the wake, and the streamwise vortices are themselves straddled by small-scale spanwise vortices. Pairing of streamwise vortices is observed downstream.

Owing to the high  $Re$, the wake is turbulent and the large-scale vortices consist of a number of smaller structures with different orientations. The large-scale vortices are connected by streamwise structures that form counter-rotating pairs. These are the result of a mode B three-dimensional wake instability (Williamson Reference Williamson1996).
In the near-wake, the streamwise vortical structures are straddled by several smaller vortices with spanwise orientation. The dynamics of the wake are complex, and pairing of streamwise vortices occurs. This is shown in an inset in figure 19(c), where two of these structure roll-around one another and combine. For mode B, the spanwise wavelength of the streamwise structures is expected to be around  $1D$. Huang, Zhou & Zhou (Reference Huang, Zhou and Zhou2006) observed larger wavelengths than this at
  $x/D = 5$, for
  $Re = 10\,000$. The findings were attributed to spanwise vortex dislocations, but our visualisation indicates that vortex pairing is another possible explanation.
The crossflow velocity spectrum taken at a location in the shear layer is presented in figure 19(b). The large-scale shedding frequency and its first harmonic are seen, as well as the shear layer frequencies. The latter are seen as a broadband plateau centred around the shear layer vortex shedding frequency,  $f_{sl}$. The plateau encompasses frequencies around the subharmonic
  $0.5f_{sl}$, which indicates that vortex pairing occurs in the shear layers.
Appendix B. The similarity between tandem cylinder shear layers and plane mixing layers
It has been suggested that the time-averaged properties of shear layers in a cylinder near-wake where the von Kármán vortex shedding is suppressed develop similar to plane mixing layers (Unal & Rockwell Reference Unal and Rockwell1988b; Cardell Reference Cardell1993). One study even makes this claim for cylinders with unimpeded vortex shedding (Khabbouchi et al. Reference Khabbouchi, Fellouah, Ferchichi and Guellouz2014). We have investigated this for the tandem cylinder case by looking at the shear layer thickness, and the behaviour of the streamwise velocity profiles in the gap, both shown in figure 20.
Shear layer thickness of the upstream cylinder, and velocity profiles in the gap plotted against similarity coordinates. To determine geometrical properties of the shear layer, the time-averaged free stream and gap velocities,  $U_{f}$ and
  $U_{g}$, were used. The shear layer thickness was defined as the distance between the points where the time-averaged streamwise velocity was equal to
  $[\bar {U} + 0.5 (U_{f} -\bar {U} ) ]$ and
  $[\bar {U} - 0.5 (\bar {U} - U_{g}) ]$. Here,
  $\bar {U} =0.5 ( U_{f} + U_{g})$. The velocity profiles are normalised as
  $U_{n} = 2(U-\bar {U}) / {\rm \Delta} U$, where
  ${\rm \Delta} U = U_{f} - U_{g}$. They have been plotted against the similarity variable
  $\eta = ( y - y_{c} ) / \delta$, where
  $\delta$ is the shear layer thickness and
  $y_{c}$ is the centreline of the shear layer.

In the initial stages, the growth rate of the shear layer thickness is small, but it accelerates after  $0.8D$. This approximately where transition to turbulence starts, although there is a small variation in the location of the transition region, as we have seen. The growth of the gap shear layer is restricted by reattachment, and figure 20(a) shows how the shear layer thickness decreases after
  $x/D \approx 2.25$. This is the point where part of the shear layer starts diverting into the gap, and the remaining part goes on to reattach to the downstream cylinder. The approximate reattachment point is seen as a small kink at the end of the gap profile, around
  $x/D = 2.7$.
In a plane mixing layer, the width grows as the square root of the downstream distance within the laminar region, and linearly after transition (White Reference White2006). This is distinctly not the case with the gap shear layer, as shown in figure 20(a). As the K-H instability is sometimes triggered as early as  $x/D = 0.4$, the part of the shear layer which can strictly be called laminar is short. However, the square root curve is not a good fit in any part of the shear layer close to the upstream cylinder. With some goodwill, the growth post-transition can be called quasi-linear. Up to
  $x/D \approx 2.0$, the development of the shear layer thickness is qualitatively similar to a single circular cylinder (Gkiolas, Kapiris & Mathioulakis Reference Gkiolas, Kapiris and Mathioulakis2020), and, even more so, to side-by-side flat plates of gap width
  $g/D = 1$ (Dadmarzi et al. Reference Dadmarzi, Narasimhamurthy, Andersson and Pettersen2018). These wake flows have large-scale vortex shedding in common. Clearly, the mixing layer analogy has its limits when there is formation of large-scale vortices.
The growth of the tandem cylinder shear layers between transition and reattachment does share some qualitative similarities with mixing layers. One is the transition through stretching of the shear layer vortices. Another is the growth of the structures that comprise the shear layer. Vortex pairing is known to be the primary mechanism of growth for plane mixing layers for low  $Re$ (Winant & Browand Reference Winant and Browand1974). However, recent research has shown that in the transitional and turbulent states, the linear growth of the mixing layer thickness happens, not by vortex pairing, but by linear growth of the coherent spanwise vortices themselves. Although, vortex pairing certainly occurs after transition, it was found to be a consequence of the growth of the spanwise vortices, rather than the main cause for mixing layer growth (D'Ovidio & Coats Reference D'Ovidio and Coats2013; McMullan, Gao & Coats Reference McMullan, Gao and Coats2015). This is reminiscent of the development of the tandem cylinder shear layer vortices after transition, recalling their transformation from compact vortex cores to larger, loosely coherent ensembles of small-scale structures. Figure 9 also indicates that pairing events after transition do not increase the thickness of the shear layer, which corresponds with the findings of McMullan et al. (Reference McMullan, Gao and Coats2015).
For both single and tandem circular cylinders, the shear layers do not reach a fully turbulent state before they roll up or reattach, respectively. Therefore, we cannot expect true self-similarity of the velocity profile across the shear layer. In this study, we do see a degree of self-similarity in the early part of the shear layer ( $x/D < 0.6)$, as shown in figure 20(b). This part of the shear layer is predominantly laminar, with intermittent triggering of the K-H instability. Deviation from similarity develops as the transition region approaches, and is strongest in the lower part of the shear layer, due to the recirculation. The same discovery was made by Cardell (Reference Cardell1993), who found two different similarity profiles in the shear layer: self-similarity in the initial growth stage, and the expected self-similarity for turbulent mixing layers, which could develop downstream when large-scale vortex formation was suppressed. The author suggested that it was possible that the boundary layer developed a self-similar profile prior to transition, and that this profile persisted in the laminar part of the shear layer.
This discussion serves to clarify a few points: the tandem cylinder shear layers are indeed mixing layer-like in that they have a quasi-linear growth after transition, and that vortex pairing occurs. However, the growth of the shear layer in the laminar region is nothing like a mixing layer. This means that the near self-similarity in the laminar part of the shear layer cannot be used as an argument towards likeness with mixing layers. In extension, this also applies to single cylinders, because the mechanism of shear layer instability is the same for both cases.


 Open access