


Introduction
In 1959, within the vast boreal forest of northern Finland, local workers extracting sand encountered an assemblage of stone artefacts, which they diligently reported to the authorities in Helsinki (Erä-Esko Reference Erä-Esko1961). Some 30 years later, Tuija Laurén (née Wallenius) undertook excavations revealing archaeological features that would become the source of some confusion within Finnish archaeology. Could this site, with evidence for as many as 40 burials from the fifth millennium BC located only 80km below the Arctic Circle, constitute the largest Stone Age cemetery in Finland? In this article, we collate and analyse the archival evidence for the scale and nature of the site's features and review the validity of the cemetery hypothesis and its wider significance.
Background
Starting in the fifth millennium BC, the seasonally mobile Mesolithic hunter-gatherer-fishers of the far north of Europe followed a distinctive form of neolithisation (Herva et al. Reference Herva, Mökkönen and Nordqvist2017). By the fourth millennium, these communities exhibited signs of sedentarism in the form of permanent dwellings and village aggregation, and the use of pottery, but even as late as the early second millennium AD, clear evidence for large-scale pastoral or agricultural activity is absent. Thus, throughout almost the whole of prehistory, northern Fennoscandia was occupied by people practising a mainly forager lifestyle (Hakonen Reference Hakonen2021a & Reference Hakonenb).
Large Mesolithic and Neolithic hunter-gatherer-fisher cemeteries in the forests of northern Europe—including the prominent sites of Yuzhniy Oleniy Ostrov in north-west Russia, Zvejnieki in Latvia and Skateholm in Sweden (Gurina Reference Gurina1956; O'Shea & Zvelebil Reference O'Shea and Zvelebil1984; Larsson Reference Larsson and Bonsall1988; Zagorskis Reference Zagorskis2004)—were first recognised in the 1950s and 1960s and they continue to captivate archaeologists’ attention. Recent studies have targeted overlooked aspects of these sites (Larsson et al. Reference Larsson, Stutz, Zagorska, Bērziņš and Ceriņa2017; Mannermaa et al. Reference Mannermaa, Rainio, Girya and Gerasimov2021), refined dating (Schulting et al. Reference Schulting2022) and offered reviews of the burial evidence (Kashina et al. Reference Kashina, Ahola and Mannermaa2021; Macāne & Nordqvist Reference Macāne and Nordqvist2021). The largest cemeteries contain hundreds of burials, mostly in the form of elongated pits, 0.3–0.7m deep, containing single supine inhumations. At the two largest known sites, Zvejnieki and Yuzhniy Oleniy Ostrov, 330 and 177 individuals, respectively, have been excavated. With modern quarrying having disturbed both sites prior to archaeological investigation, the total number of burials in each cemetery is estimated at 400 or more (O'Shea & Zvelebil Reference O'Shea and Zvelebil1984; Zagorskis Reference Zagorskis2004). Outside of these larger cemeteries, it is rare for mortuary sites to feature more than 20 burials, and most only contain a few (e.g. Grünberg Reference Grünberg, Grünberg, Gramsch, Larsson, Orschiedt and Meller2016: 13; Tõrv Reference Tõrv2016; Ahola Reference Ahola2019; Macāne & Nordqvist Reference Macāne and Nordqvist2021). Graves were typically furnished with more organic than inorganic objects (see Zagorskis Reference Zagorskis2004; Mannermaa et al. Reference Mannermaa, Rainio, Girya and Gerasimov2021), presenting a particular challenge in an environment where organic material—including human bone—is rarely preserved. The inclusion of red ochre has often been considered to be a key characteristic associated with Stone Age burials but recent work underscores the diversity of practices, with many verified graves lacking red ochre entirely (e.g. Macāne & Nordqvist Reference Macāne and Nordqvist2021). In northern Fennoscandia specifically, mortuary sites typically feature fewer than half a dozen burials. Organic material, including bone, decays in the region's acidic soils within a few millennia, leaving only scarce artefactual and virtually non-existent osteological evidence.
Archaeological investigations between 1984 and 1991 at Tainiaro (registry ID 751010040; see Wallenius-Saksanen Reference Wallenius-Saksanen1985; Wallenius Reference Wallenius1990, Reference Wallenius1991a, Reference Wallenius1992) recovered more than 32 000 finds and the site is briefly mentioned in many monographs, theses and research articles (e.g. Huurre Reference Huurre1998; Halinen Reference Halinen and Huurre1999: 173–4; Purhonen et al. Reference Purhonen, Hamari and Ranta2001: 302–3; Lappalainen Reference Lappalainen2007; Halinen Reference Halinen, Haggrén, Halinen, Lavento, Raninen and Wessman2015; Nordqvist & Mökkönen Reference Nordqvist, Mökkönen, Lozovskaya, Mazurkevich and Dolbunova2016; Nordqvist Reference Nordqvist2018; Ahola Reference Ahola2019: 40, 42; Hakonen & Hakamäki Reference Hakonen and Hakamäki2019; Hakonen Reference Hakonen2021b & Reference Hakonenc; Mökkönen & Nordqvist Reference Mökkönen, Nordqvist, Halinen and Taivainen2021). Yet no overview of Tainiaro has ever been published and its interpretation as a cemetery remains problematic.
Tainiaro: the documentary and material record
The site of Tainiaro lies on a sandy terrace, 79m above sea level, on the bank of the Simojoki River, 33km from the Baltic Sea coast between the Ostrobothnian lowlands and hill country of southern Lapland (Figure 1A). The region was covered by a continental ice sheet until approximately 10 300 years ago (Stroeven et al. Reference Stroeven2016); post-glacial rebound of the ground continues to the present day (e.g. Vaneeckhout et al. Reference Vaneeckhout, Okkonen and Costopoulos2012; Hakonen Reference Hakonen2017). At the beginning of the fifth millennium BC, the site appears to have been located on a coastal estuary of the ancient Bothnian Bay, with prehistoric activity extending across an area of approximately 300 × 50m (Figure 1B).
A) elevation map of northern Europe (DIVA-GIS). Tainiaro is marked as a star near the Arctic Circle; B) the topography of the environs of Tainiaro (and Tainilanrotko, reg. ID 751010051) along the Simojoki River, with the sea level set at 76m above current level, representing the ancient shoreline of c. 5000 BC (elevation model 2m resolution by the National Land Survey of Finland, NLSF) (figure by Aki Hakonen).

Some 27 years after the final season of the original (unpublished) excavations, new fieldwork was initiated at Tainiaro in 2018 by a team from the University of Oulu. The fieldwork involved relocating the previously excavated trenches and undertaking a small, targeted excavation (6m2) in the western corner of area 1 (surrounding pits 27 and 65 in Figure 3) with the aim of assessing features identified on ground-penetrating radar. The complete archive of 190 field drawings from the 1984–91 excavations were georeferenced in GIS, along with the 6969 artefact units, some containing hundreds of individual finds, detailed in a 547-page hand- and type-written paper archive.
The total artefact assemblage weighs 366kg, of which 97 per cent by weight comprises lithic artefacts, debitage and unworked stone. Pottery (see online supplementary material (OSM)) makes up less than 1 per cent of the total, with the remainder comprising mainly burnt animal bone. More than 70 per cent of the total artefact weight comes from the upper 0.3m of the podzol horizon. Below this, the georeferenced field drawings record the soil morphology in 50–100mm layers across the three main excavated areas. This stratigraphic detail forms the basis for the following re-evaluation of the evidence for the presence of 40 burials (e.g. Halinen Reference Halinen, Haggrén, Halinen, Lavento, Raninen and Wessman2015) at the site.
The Tainiaro pits
Close scrutiny of field drawings made during the original excavations reveals 127 possible pits of varying size, form and content at Tainiaro; none are visible on the surface (Figure 2). The most distinctive and frequent form, with at least 36 examples, are rectangular in plan with rounded corners and measuring from 1.5–2.2m in length, 0.5–1m in width and 0.5–0.8m in depth. Most of these rounded rectangular pits contained evidence of burning, with occasional fragments of stone debitage and burnt bone, and some contained artefacts. Traces of red ochre were found in 23 pits, but only as small concentrations, patches or streaks.
Examples of pit features at Tainiaro (1984–1990): Features 1 (A), 9 (B), 15 (C), 10 (D) (class 6), 34 (E) (class 3) with a modern intrusion covering lower left corner, and 43 (F) (class 3) with a possible posthole on the right (photographs by Tuija Laurén (A–C, E–F) and Aki Arponen (D) (Finnish Heritage Agency)).
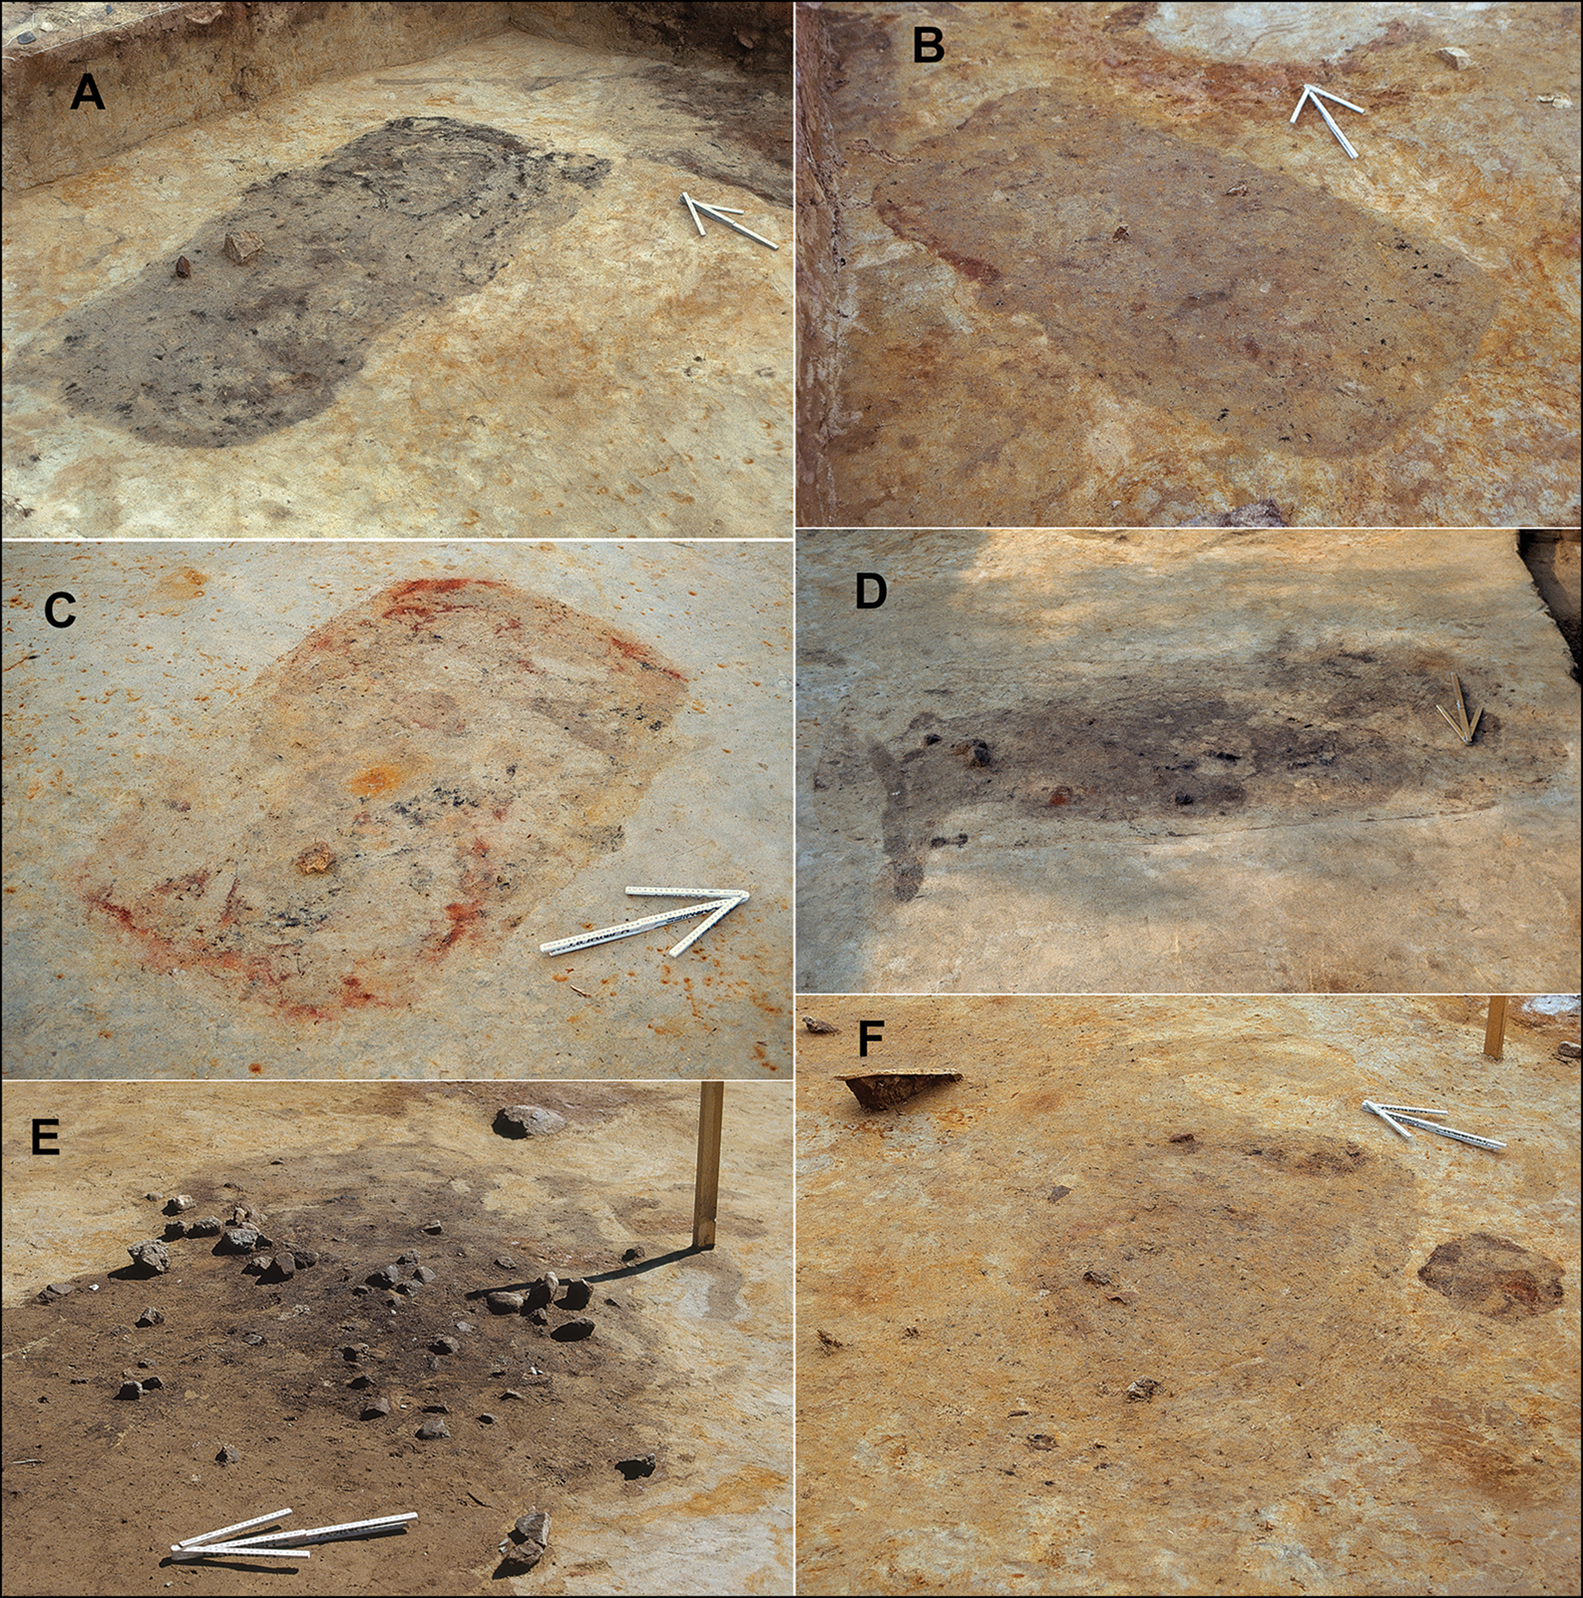
Based on form and content, each feature was classified on a scale of 1 to 6 (Table 1; see also OSM Table S2 for pit-by-pit evaluation). Pits of the most regular and frequent form—that is, a depth of 0.5–0.8m containing red ochre and artefacts—are designated as class 6. Irregularly shaped and indistinct pit features that lack evidence for ochre and artefacts are designated class 1. Other pits are assigned to classes 2–5. As class 3 pits share a greater resemblance with class 6 than with class 1, the scale is effectively logarithmic. Features that were only partly investigated during the original excavations, yet resemble higher class pits, are assigned to class 3. Based on this classification and the distance of each pit from a datum point in the eastern excavation zone, the pits have been assigned unique identification numbers for future reference (Figures 3 & 4).
Evaluation of possible burial features at Tainiaro: a conservative estimate.

Top diagram) excavated areas and test pits, with (1) east, (2) middle and (3) west zones; lower diagram) close-up of pit features in the east zone, rasterised from strong to weak based on their resemblance to burials (elevation model based on laser scanning data 5 p/m2 produced by NLSF in 2021). See also Table 1 and OSM (figure by Aki Hakonen).

Pit features from west (bottom left) and middle (top and bottom right) excavation zones, rasterised from strong to weak based on their resemblance to burials (elevation model based on laser scanning data 5 p/m2 produced by NLSF in 2021). See also Table 1 and OSM (figure by Aki Hakonen).

Evidence of in situ burning, in the form of reddened sand mixed with ash and charcoal, was found in 24 pits out of the 53 attributed to classes 3–6. In 10 of these pits, traces of burning were restricted to the upper layers. In nine further pits, traces were found both at the bases of the pits and also higher up—in five of these cases, the traces indicate clearly separated distinct episodes of burning. Another five pits had evidence for burning limited to their bases only. Ash and charcoal, fire-cracked rocks and reddened sand are sufficiently frequent in some of the class 3–6 pits to warrant the hypothesis that some of them functioned primarily as hearths or some other (non-funerary) pyrotechnic activity. In the following section, we evaluate the evidence of hearths from other broadly contemporaneous contexts in the region to assess the possibility that some of the elongated pits at Tainiaro may have been hearths. In the following section, we then turn to evaluate the hypothesis that they were, in fact, burials.
Assessing the pyrotechnic hypothesis
To evaluate the pyrotechnic hypothesis, morphological characteristics of the Tainiaro pits were compared with those of known hearths of similar form. Omitting rectangular hearths that were constructed on the ground surface (mainly Late Iron Age in date, e.g. Halinen et al. Reference Halinen, Hedman, Olsen, Anderson, Wishart and Vaté2013) leaves only a few regional examples of pit hearths similar in shape and size to the Tainiaro pits. Two excavated roasting pits from the eighth-millennium BC Dumpokjauratj site (Bergman et al. Reference Bergman, Olofsson, Hörnberg, Zackrisson and Hellberg2004), 320km west of Tainiaro in northern Sweden (Figure 5), were reportedly “rectangular (approximately 1.5–2 × 1m) in shape […] and 0.5–1m deep” with “no discernible stratigraphy” (Bergman Reference Bergman, Engelmark, Larsson and Rathje2005: 57). The pits contained large pieces of charred wood (Bergman et al. Reference Bergman, Olofsson, Hörnberg, Zackrisson and Hellberg2004: 165) and were surrounded by burnt rocks and charcoal indicating reuse of the pits.
Distribution of Stone Age cemeteries in northern Europe and other sites mentioned in the text (DIVA-GIS elevation model). Letters refer to sites described in Table 2 (figure by Aki Hakonen).

Investigations at Veskankangas, a near-contemporaneous site of the sixth millennium BC, located only 20km south of Tainiaro, identified 11 rectangular pit features that have been interpreted as hearths (e.g. Wallenius Reference Wallenius1991b; Rautiainen Reference Rautiainen1995). The pits, while similar in shape to the Tainiaro examples, contained thick layers of charcoal and burnt sand and rocks. Compared with the hearths at Veskankangas and Dumpokjauratj, it is clear that none of the pits at Tainiaro contained sufficient traces of burning to be definitively classified as a pyrotechnic feature (see also Liedgren et al. Reference Liedgren, Hörnberg, Magnusson and Östlund2017). At Tainiaro, the pits do not appear to have been intended primarily for in situ fires.
Moreover, many of the pits at Tainiaro produced no clear evidence of burning at all. Some contained faintly discoloured fills, barely distinguishable from the natural soil; indeed, some other less conspicuous and irregular soil stains may indicate the presence of further pits, although many were probably formed by the annual freeze-thaw cycle (see Schaetzl & Rothstein Reference Schaetzl and Rothstein2016). Yet, as even the most clearly discernible pits do not seem to qualify as pit hearths, despite the evidence of sporadic in situ fires, the investigation leads us elsewhere.
Assessing the burial hypothesis
Due to the natural acidity of the local soil in northern Fennoscandia, organic material rarely survives more than a few millennia. In some local Stone Age burials, the arrangement of the bodies and sometimes even decayed teeth and bones have been preserved by the inclusion of red ochre (see Engblom Reference Engblom1989: graves 2–4; Liedgren Reference Liedgren2014; Ahola et al. Reference Ahola, Salo and Mannermaa2016). As ochre was used only sporadically at Tainiaro, the burial hypothesis cannot rely by default on such preservation, but instead the morphology of the pits themselves needs to be considered.
Comparing the pits at Tainiaro to Stone Age burials with near-complete organic decomposition elsewhere in Finland offers initial support for the burial hypothesis. A previous review of the evidence by the archaeologist Marja Ahola revealed that the average dimensions of Finnish graves containing red ochre are 2.07m long, 0.97m wide and 0.69m deep (Lappalainen Reference Lappalainen2007: 3), measurements which closely match those of the Tainiaro pits (OSM Table S2). The number of pits at Tainiaro is unusual, however. The two largest confirmed cemeteries are from southern and south-eastern Finland. At Jönsas, a total of 27 burials span from the Late Mesolithic (sixth–seventh millennium BC) to the early third millennium BC (e.g. Ahola Reference Ahola2017); excavations at Vaateranta have identified up to 22 burials from the fourth millennium BC (Katiskoski Reference Katiskoski2004). The interpretation of both sites as cemeteries rests principally on pit morphology and the shapes of red ochre deposits, as well as the human dental remains from eight burials at Vaateranta (Katiskoski Reference Katiskoski2004; Ahola et al. Reference Ahola, Salo and Mannermaa2016).
Several northern European Mesolithic and Neolithic burial sites with better organic preservation, including the two largest cemeteries discussed earlier, have also been published in sufficient detail to allow further comparisons (Nilsson Stutz Reference Nilsson Stutz2003; Petersen Reference Petersen2015; Larsson Reference Larsson, Grünberg, Gramsch, Larsson, Orschidt and Meller2016; Larsson et al. Reference Larsson, Stutz, Zagorska, Bērziņš and Ceriņa2017; Ahola Reference Ahola2019; Schulting et al. Reference Schulting2022; Table 2; Figure 5). Most of the graves from these sites (see OSM Table S3) are single inhumations in regular elongated pits with rounded ends, 1.6–2m in length, 0.4–0.7m in width and 0.3–0.7m in depth (see Tõrv Reference Tõrv2016; Kashina et al. Reference Kashina, Ahola and Mannermaa2021; Macāne & Nordqvist Reference Macāne and Nordqvist2021). With length-to-width ratios of 3:1 or even 4:1, these graves are mostly narrower than the pits at Tainiaro, where the ratio is closer to 2:1. Also, the curved-shaped ends of most northern European grave plans are clearly distinct from the more rectangular pits with rounded corners at Tainiaro.
List of inhumation cemeteries and sources referred to in comparison. The compilation is based on cited references, which other sources may contradict. Letters refer to locations in Figure 5. N/A: either unavailable or unclear information (see also OSM).

*The excavations at Strandvägen are still being processed. Nevertheless, the site contained at least 15 inhumations in different stages of decomposition, two cremation deposits as well as an assortment of disarticulated human bones and skulls (Molin et al. Reference Molin, Gummesson, Hagberg, Storå, Borić, Antonović and Mihailović2021), including, discovered in an adjacent wetland (Kanaljorden), at least 10 skulls, two erected on stakes (Gummesson et al. Reference Gummesson, Hallgren and Kjellström2018).
But, when graves containing more than one inhumation are considered, a stronger similarity between the pits at Tainiaro and burials at other northern European cemeteries becomes evident. While multiple inhumations within a single pit are infrequent, larger cemeteries generally contain several examples and at Zvejnieki the number of pits with multiple burials is as high as 26 out of 277 (Zagorskis Reference Zagorskis2004; Larsson et al. Reference Larsson, Stutz, Zagorska, Bērziņš and Ceriņa2017; Table 2). The poor bone preservation at Tainiaro makes it impossible to confirm the presence of multiple inhumations, but it is possible that the larger, more distinct pits may have contained several individuals. Comparison with verified burial sites does, however, show that a large number of confirmed graves have irregular or indistinct plans, the equivalent of classes 1–2 (Table 1). These graves include child and animal burials (see Fahlander Reference Fahlander2012). Unfortunately, none of the analogous northern European sites have been published in sufficient detail to evaluate the number of irregular pit-like anomalies that were not considered to be graves. Overall, comparison to cemeteries across northern Europe does suggest that many of the pits at Tainiaro are burials, with slightly wider than usual pits resulting either from variation in local or regional practices for single inhumations or from a higher than usual number of multiple burials.
But if the pits are burials, how should the traces of burning within them be explained? Some of the smaller burnt patches may result from mixed backfill, but the evidence for in situ fires could reflect other activities. Although several contemporaneous cemeteries do offer evidence for similar small fires within or adjacent to burial pits (e.g. Zagorska Reference Zagorska, Fahlander and Oestigaard2008: 117; Ahola Reference Ahola2015: 32; Petersen Reference Petersen2015: 90; Grünberg Reference Grünberg, Grünberg, Gramsch, Larsson, Orschiedt and Meller2016: 19; Gummesson & Molin Reference Gummesson, Molin, Grünberg, Gramsch, Larsson, Orschiedt and Meller2016: 154; Macāne & Nordqvist Reference Macāne and Nordqvist2021: 310), the purpose or significance of such fires is not well understood. An ancient association between red ochre and fire, and with the warmth of the lifegiving hearth (e.g. Hakonen & Hakamäki Reference Hakonen and Hakamäki2019), is just one possibility out of many, but one which resonates deeply, especially in the subarctic context.
Discussion
Based on morphological comparisons, Tainiaro should, in our opinion, be considered to be a cemetery site. If correct, this would be one of the largest such sites with Mesolithic characteristics in northern Europe (see Meiklejohn et al. Reference Meiklejohn, Babb, Hiebert, Grünberg, Gramsch, Larsson, Orschiedt and Meller2016). Eleven radiocarbon assays (Figures 6 & 7) give a date span between 5000 and 4000 cal BC, with three AMS-dated ceramic crust samples narrowing the range to 4700–4350 cal BC (see OSM and Table S1 for further discussion concerning the site chronology). Such a large cemetery at such a high northerly latitude does not necessarily fit preconceptions about prehistoric foragers in this region but, perhaps, instead of forcing an alternative interpretation (e.g. a pyrotechnic one) it is time to recalibrate our expectations. Even though no skeletal material has survived at Tainiaro, our review of the available evidence supports an interpretation of the site as a cemetery.
Radiocarbon dates compiled from earlier publications and reports (see OSM Table S1). Grey ranges indicate less reliable charcoal samples; brown ranges are samples of ceramic crust. Numbers 1–11 correspond with those showing locations in Figure 7. Calibrated using IntCal20 calibration data (Reimer et al. Reference Reimer2020) and OxCal v4.4.4 (Bronk Ramsey Reference Bronk Ramsey2009) (figure by Aki Hakonen).

The spatial distribution of radiocarbon dates shows their inadequate representativeness (elevation model based on laser scanning data 5 p/m2 produced by NLSF in 2021) (figure by Aki Hakonen).

Previous use of the term ‘cemetery’ in Mesolithic contexts has been criticised on the basis that the term artificially separates burial from a range of other activities (e.g. Meiklejohn et al. Reference Meiklejohn, Petersen, Alexandersen, Zvelebil, Domanska and Dennell1998). Indeed, it has recently been argued that Mesolithic places for the dead were also places for the living and some sites previously interpreted as cemeteries were in fact habitation sites with burials dug beneath the dwellings (Petersen Reference Petersen2015: 88). In our opinion, there is no need for the term ‘cemetery’ to imply a closed category that excludes other activities. Regardless of terminology, Petersen's wider interpretative approach may also apply to Tainiaro.
The upper stratigraphic layers at Tainiaro are dotted with traces of burning, perhaps signifying individual fires or short-lived hearths. Whether these traces of burning relate to activities associated with burials, or whether they are remnants from surface-level dwellings, requires further investigation. This could offer insight into the long-term use of the site and whether it was used by a largely sedentary population or a mobile group(s) returning to the same place time and again. Judging by the site's stone debitage (Hakonen Reference Hakonen2021c; Mökkönen & Nordqvist Reference Mökkönen, Nordqvist, Halinen and Taivainen2021), Tainiaro could have been a lithic production site akin to the fourth-millennium-BC metatuff workshops of the Lake Onega region in north-west Russia (Tarasov & Nordqvist Reference Tarasov and Nordqvist2021), albeit on a smaller scale. But the question remains, does Tainiaro represent a unique hub, where people gathered to bury their dead and to experiment with new materials (see Hakonen Reference Hakonen2021c), including stone and early pottery, or is the site a chance discovery, with others waiting to be found? Similar sites could have existed throughout the region, some remaining hidden in the forested landscape, others destroyed by quarrying long ago.
As to the number of burials at the site, we can provide only estimates. By assigning minimum and medium probability estimates for the six different classifications of pit features (Table 1), multiplying the probability decimal by n per class and estimating the total extent of the burial ground based on the previously excavated areas and the spaces left in between (approximately 3300m2 with 730m2 excavated), we arrive at a total estimate of 115–200 burial pits, of which between 26 and 44 have been excavated. The number of buried individuals is likely somewhat higher, since multiple burials are a recurrent phenomenon at similar Stone Age sites. Factoring in the irregular burial pits commonly observed at other sites could increase that estimate by up to a third, reaching an estimated 300 individuals in total, though we should be careful not to unnecessarily inflate this number.
But how reliable is such an estimate? Some pits seem to share traits with hearths, yet none contains enough evidence of burning to establish them as such and we should not exclude the possibility that even some of the grave-like pits are something else entirely. Verifying a wider range of related activities would further increase the research potential of Tainiaro. The stone workshop hypothesis (see Tarasov & Nordqvist Reference Tarasov and Nordqvist2021) certainly allows further analytical approaches. The surface-level hearths could also indicate dwelling activity. In light of all these possibilities, Tainiaro should not be considered as a single-function site intended only for burial. There is no reason to assume that the people whose practices formed the Tainiaro site considered the place in such a way. Perhaps the fact that the pits themselves seem multivalent is an indication of intentional ambiguity.
Conclusions
Never fully published, the investigations at the site of Tainiaro have only incidentally fed into interpretation and debate about prehistoric burial practices in northern Fennoscandia. In this article, we have reviewed the archival material from the original excavations and undertaken further test excavations to confirm some of the findings. We argue that the site of Tainiaro was most likely, although not certainly, a large Stone Age cemetery of the fifth millennium BC. If correct, it would be among the largest such sites to date to this period known in northern Europe. We have interpreted as many as 44 of the pits excavated at the site as burials and, since only one-fifth of the site's area has been excavated, the total number could be more than 200. The site is unusual in other ways too, not least because of the range of activities attested and its location in the northern subarctic, further north than any other known large cemetery of this date. Many questions about Tainiaro remain unanswered. For the time being, however, the notion that a large cemetery seems to have existed near the Arctic Circle should cause us to reconsider our impressions of the north and its peripheral place in world prehistory.
Acknowledgements
We extend our gratitude to Sara Gummesson for help in accessing information regarding Strandvägen and Kanaljorden sites and we thank Janne Ikäheimo for providing access to the latest lidar map. We also wish to thank Matti Enbuske and Johanna Mujunen and then-students Aleksi Kelloniemi, Heidi Lamminsivu, Robert Fält and Markus Kaakinen for participating in the 2018 fieldwork. Two anonymous peer reviewers pushed us in the right direction to substantially improve the manuscript, for which we are extremely grateful.
The article is dedicated to Tuija's husband Juha Laurén (1956–2021) and Aki's father Martti Hakonen (1954–2022).
Funding statement
This research received no specific grant from any funding agency or from commercial and not-for-profit sectors.
Supplementary material
To view supplementary material for this article, please visit https://doi.org/10.15184/aqy.2023.160.


 Open access