

Worldwide supplies of fish oils and meals have reached their sustainable limits, forcing industries to look for alternative lipid sources for use in marine fish diets(Reference Ringo, Lodemel and Myklebust1). As terrestrial animal products are prohibited, there is great interest in aquaculture to produce fish better able to utilise vegetable feedstuffs. Vegetable products are rich in eighteen-carbon fatty acids (C18 fatty acids) but do not contain C20–22 n-3 highly unsaturated fatty acids (n-3 HUFA), such as EPA (20 : 5n-3) and DHA (22 : 6n-3). These n-3 HUFA are required in the diet to provide the essential fatty acids for marine fish, as marine fish have a low capacity to produce C20–22 HUFA from C18 fatty acid precursors, such as α-linolenic (18 : 3n-3) and linoleic (18 : 2n-6) acids(Reference Mourente and Tocher2, Reference Sargent, Tocher, Bell, Halver and Hardy3). Δ-6 Desaturase (Δ6D) is the rate-limiting enzyme catalysing the first reaction of n-3 HUFA synthesis from 18 : 3n-3 and 18 : 2n-6(Reference Cho, Nakamura and Clarke4), but, as its activity is very low in marine fish(Reference Sargent, Tocher, Bell, Halver and Hardy3, Reference Owen, Adron and Middleton5), it could also limit the use of vegetable products by marine fish.
One solution could be to apply metabolic programming using nutritional conditioning during early larval stages, as already shown in mammals(Reference Lucas6), in order to stimulate the fatty acid desaturation pathways of n-3 HUFA synthesis in marine fish. We recently showed(Reference Vagner, Robin and Zambonino Infante7, Reference Vagner, Zambonino Infante and Robin8) that metabolism in sea bass (Dicentrarchus labrax) juveniles can be modulated by larval nutritional conditioning. The Δ6D mRNA level was enhanced in larvae fed a low-n-3 HUFA diet (0·8 % DM EPA+DHA), and this was retained in pre-conditioned juveniles fed an n-3 HUFA-restricted diet (0·5 % DM EPA+DHA). Moreover, a slightly, but significantly, higher DHA content in the polar lipids (PL) of pre-conditioned juveniles was measured. However, the larval conditioning did not significantly affect the growth performance of juveniles in terms of weight and survival rates, suggesting that larval nutritional stimulus was not sufficient to induce further long-term effects.
The aim of the present study was to determine the range of dietary n-3 HUFA content that would elicit effects on desaturation/elongation pathways for n-3 HUFA synthesis and whether the effect could be amplified. Thus, a large range of n-3 HUFA dietary content (0·5–3·7 % EPA+DHA) was used during the larval stage, followed by a severe n-3 HUFA-restricted diet (0·3 % EPA+DHA) during the juvenile period.
Materials and methods
Rearing conditions and experimental design
Larval conditioning: experiment 1
Sea bass (D. labrax) larvae, at 3 d post-hatching, were obtained from a commercial hatchery (Gravelines, France), and experiments were conducted at the Ifremer-Brest facility (Brest, France). Larvae were distributed in twenty conical fibreglass tanks (35 litres; initial stocking density was sixty larvae per litre, i.e. 2500 larvae per tank) and temperature was progressively increased from 13·5°C to 19°C within 2 d. All groups were fed microparticulate diets from mouth opening at day 6 to day 45. Four experimental diets differing only in their n-3 HUFA content were tested: extra-high level of HUFA (XH; 3·7 % EPA+DHA on a DM basis); high level of HUFA (HH; 1·7 %); low level of HUFA (LH; 0·7 %) and extra-low level of HUFA (XLH; 0·5 %) (Table 1). The different n-3 HUFA contents were obtained by the incorporation of soyabean oil in the LH and XLH diets and by an inverse proportion gradient of soya lecithin and marine phospholipid. Four tanks were fed the HH or XH diets and six tanks were fed the LH or XLH diets. The four experimental conditions were XH1, HH1, LH1 and XLH1. The rearing conditions were as described previously(Reference Vagner, Robin and Zambonino Infante7).
Formulation (g/100 g), chemical composition and fatty acid composition of total lipids (% fatty acid methyl esters) of the four experimental larval diets differing in their highly unsaturated fatty acid (HUFA) content used in the larval experiment (experiment 1)

XH, extra-high-HUFA diet; HH, high-HUFA diet; LH, low-HUFA diet; XLH, extra-low-HUFA diet.
* Sources: fish meal LT 94, Norse (Fyllingsdalen, Norway); hydrolysed fish meal, Archimex (Vannes, France); fish protein hydrolysate CPSP 90, Sopropêche (Boulogne sur Mer, France); soya oil, Système U (Créteil, France); soya lecithin, Louis François (Saint-Maur, France); marine lecithin LC 60, Phosphotech (Saint-Herblain, France).
† Vitamin mixture contained (g/kg vitamin mix): retinyl acetate, 1; cholecalciferol, 2·5; dl-α-tocopheryl acetate, 5; menadione, 1; thiamine-HCl, 0·1; riboflavin, 0·4; D-calcium pantothenate, 2; pyridoxine-HCl, 0·3; cyanocobalamin, 1; niacin, 1; choline, 200; ascorbic acid (ascorbyl polyphosphate), 5; folic acid, 0·1; D-biotin, 1; meso-inositol, 30.
‡ Mineral mixture contained (g/kg mineral mix): KCl, 90; KI, 0·04; CaHPO4.2H2O, 500; NaCl, 40; CuSO4.5H2O, 3; ZnSO4.7H2O, 4; CoSO4, 0·02; FeSO4.7H2O, 20; MnSO4.H2O, 3; CaCo3, 215; MgOH, 124; Na2SeO3, 0·03; NaF, 1.
Juvenile period: experiment 2
The larval period was followed by an intermediate period of 1 month (day 46 to day 77), during which the four groups were separately held at 19°C and fed a commercial diet with 2·7 % EPA+DHA (DM basis), corresponding to the mean between the XH (3·7 % EPA+DHA) and HH (1·7 % EPA+DHA) diets. The four experimental groups were XH2, HH2, LH2 and XLH2. The day 77 juveniles of each group were anaesthetised (ethylene-glycol-monophenylether, 0·15 ‰) and selected fish were randomly distributed in 60 litre square tanks (180 fish per tank). The fish were acclimatised to the experimental unit for 6 d (day 77 to day 83) at 19°C, and two experimental isolipidic and isoproteic diets differing in their n-3 HUFA content by the incorporation of either rapeseed oil or cod-liver oil (Table 2) were progressively introduced. Four replicate groups per initial condition were fed the experimental n-3 HUFA-restricted diet (0·3 % EPA+DHA), termed ‘R-groups’ (XH2 R, HH2 R, LH2 R and XLH2 R). Two other replicated groups per initial condition were fed an n-3 HUFA-rich diet (1·4 % EPA+DHA, i.e. 2-fold higher than the 0·7 % EPA+DHA requirement defined for sea bass juveniles(Reference Skalli and Robin9) and used as control ‘C-groups’ (XH2 C, HH2 C, LH2 C and XLH2 C)). The rearing conditions of juveniles were as described previously(Reference Vagner, Zambonino Infante and Robin8). The experiment started when all groups were fed entirely on the HUFA-restricted or -rich diets (day 83, i.e. t0), and lasted until the final weights of all fish were increased at least 2-fold (day 118; i.e. t35).
Formulation (g/100 g), chemical composition and fatty acid composition of total lipids (% fatty acid methyl esters) of the experimental highly unsaturated fatty acid (HUFA)-restricted diet and the HUFA control diet used in the juvenile experiment (experiment 2)

* Sources: lupin without pellicle, Le Gouessant® aquaculture (Lamballe, France); fish meal LT 94, Norse (Fyllingsdalen, Norway); wheat amygluten 110, Chamtor Vitalor (Bazancourt, France); fish protein hydrolysate CPSP 90, Sopropêche (Boulogne sur Mer, France); precooked starch, Prégéflo Roquette frères (Lestrem, France).
† Vitamin mixture contained (g/kg vitamin mix): retinyl acetate, 1; cholecalciferol, 2·5; dl-α-tocopheryl acetate, 5; menadione, 1; thiamin-HCl, 0·1; riboflavin, 0·4; D-calcium pantothenate, 2; pyridoxine-HCl, 0·3; cyanocobalamin, 1; niacin, 1; choline, 200; ascorbic acid (ascorbyl polyphosphate), 5; folic acid, 0·1; D-biotin, 1; meso-inositol, 30.
‡ Mineral mixture contained (g/kg mineral mix): KCl, 90; KI, 0·04; CaHPO4.2H2O, 500; NaCl, 40; CuSO4.5H2O, 3; ZnSO4.7H2O, 4; CoSO4, 0·02; FeSO4.7H2O, 20; MnSO4.H2O, 3; CaCo3, 215; MgOH, 124; Na2SeO3, 0·03; NaF, 1.
Sampling procedures
Experiment 1
For larval growth assessment and lipid composition, samplings were performed on 12 h fasted larvae at day 45, corresponding to the end of the larval period (when all enzymic and molecular functions are established). For molecular analyses, intermediate samplings were also performed at day 10, day 17 and day 25.
Weight was monitored by sampling thirty larvae in four tanks per condition (120 larvae per condition; n 4). After a minimum preservation period of 3 weeks in 4 % seawater formalin, larvae were individually weighed, pooled and dried for 24 h at 105°C to estimate the dry weight of each group (n 4). Final biomass (mg/l) was the larvae mean wet weight per survival rate at day 45 (n 6 for XLH1 and LH1 and n 4 for XH1 and HH1). The survival rate was the ratio of the final to initial number of larvae in each tank, minus the number of larvae sampled (n 6 for XLH1 and LH1 and n 4 for XH1 and HH1).
Measurement of the mRNA level of genes involved in digestive functions and lipid metabolism (Δ6D, and PPARα, PPARβ and PPARγ) was performed on 100 mg of larvae at day 10 and day 17 and on about 300 mg of larvae at day 25 and day 45, in four tanks per condition (n 4). Larvae were conserved in TRIzol reagent (Invitrogen, Carlsbad, CA, USA) (1 ml for 100 mg of larvae) at − 80°C pending analysis.
For lipid analysis, fifty pooled larvae from each of four tanks per condition (n 4) were weighed and conserved at − 80°C pending analysis.
Experiment 2
Juveniles were anaesthetised before sampling (for all samplings, n 4 and n 2 for R- and C-groups, respectively). An HH2 C tank was lost at day 90, resulting in n 1 for this group at day 90, day 104 and day 118.
Growth was estimated by weighing individually fifty fish ( ± 0·1 g) at day 83 (t0), day 90 (t7), day 104 (t21) and day 118 (t35) in all tanks. The survival rate was estimated as for larvae. The daily growth index (DGI; %) between t0 (day 83) and t35 (day 118) was calculated as follows:
Measurement of the mRNA level of genes involved in lipid metabolism (Δ6D and PPARα, β and γ) was performed on R-groups on ten pooled fish from each of four tanks per condition (forty fish per condition) at day 83, day 90, day 107 and day 118. They were immediately frozen in liquid N2 and stored at − 80°C until assayed.
Lipid analyses were performed on C- and R-groups. Six pooled fish per tank were taken at day 83 and ten pooled fish per tank were taken at day 118. They were individually weighed, frozen in liquid N2 and stored at − 80°C pending analysis.
Analytical methods
Gene expression
Expression of Δ6D and PPARα, PPARβ and PPARγ genes was performed on the whole body for larvae and on the liver for juveniles. Dissections of frozen juveniles were conducted on a glass plate maintained at 0°C. The whole liver was isolated and the gall bladder removed because bile can destroy RNA. Gene expression measurements of each sample were performed on 200 mg of homogenised pooled livers (Polytron® PT 2100 Bioblock®; Fisher Bioblock Scientific, Illkirch, France). Total RNA was extracted from total larvae and livers using TRIzol reagent (Invitrogen, Carlsbad, CA, USA). cDNA were obtained in duplicate from total RNA (1 μg) using the Quantitect Reverse Transcription® kit with integrated removal of genomic DNA contamination (QIAGEN® GmbH, Hilden, Germany). Real-time PCR was performed using the iCycler iQTM® (Bio-Rad® Laboratories Inc., Hercules, CA, USA) as described in our previous studies(Reference Vagner, Robin and Zambonino Infante7, Reference Vagner, Zambonino Infante and Robin8). The specificity of forward and reverse primers for each gene was checked by sequencing the amplicon (Eurogentec, Labège, France). Primers for Δ6D, PPARα and PPARβ were as described previously(Reference Vagner, Robin and Zambonino Infante7). Those for PPARγ were 5′-3′: CAGATCTGAGGGCTCTGTCC and 3′-5′: CCTGGGTGGGTATCTGCTTA. Real-time PCR efficiencies (E) were determined for each gene from the given slopes in Bio-Rad® software (iCycler iQ™ Real-Time Detection System Software; Bio-Rad® Laboratories Inc., Hercules, CA, USA), according to equation 1:
To determine the relative quantity of target gene-specific transcripts present in the different samples, expression ratios were calculated according to equation 2:

where E is the PCR efficiency, ‘mean sample’ corresponds to the triplicate average and CT is the cycle threshold. The HH1 and HH2 samples were used as the standard group for larval and juvenile experiments, respectively, because they are close to the rearing condition in fish farming. Elongation factor 1α (EF1α) was used as the reference gene(Reference Olsvik, Lie and Jordal10) as its expression is constant during the activation and proliferation of cells(Reference Gause and Adamovicz11).
Fatty acid composition
Whole frozen larvae were homogenised at 0°C using a Polytron® (PT 2100 Bioblock®; Fisher Bioblock Scientific), while whole frozen juvenile were homogenised rapidly with a Hobart® mixer (Hobart Food Equipment Australia, Silverwater, NSW, Australia) in order to keep a low temperature and then, more accurately using a Polytron® (PT 2100 Bioblock®; Fisher Bioblock Scientific). Lipid analyses were performed on a representative portion (about 1 g and about 5 g for larvae and juvenile samples, respectively) and about 3 g were taken for dry weight measurement (105°C; 24 h). Assays were conducted on one larval sample, while for juveniles they were performed on duplicates at day 83 and at day 118.
Extraction of total lipid (TL), separation of neutral lipid (NL) and PL, preparation of fatty acid methyl esters (FAME) and separation of FAME were performed on larvae and juveniles as described in our previous study(Reference Vagner, Robin and Zambonino Infante7, Reference Vagner, Zambonino Infante and Robin8). Each chromatogram was visually controlled on the computer using an amplification of the baseline in order to check the peak shape and quality of integration by the computer program. Internal standard (tricosanoic acid; 23 : 0) was used to quantify FAME in TL and NL on a fish fresh matter basis, and was added to a weighed known quantity of larvae before the TL extraction, while it was added before the TL and PL FAME extraction for juvenile lipid analysis. The results of individual fatty acid compositions were expressed as percentage of total identified FAME.
Chemical analyses of feed were performed in duplicate for each sample according to Association of Analytical Chemists(Reference Williams12) methods.
Statistical analysis
The data are presented as mean values with their standard errors of the replicate groups. Before applying statistical tests using Statistica® (Tulsa, OK, USA), percentage data were transformed by arcsine square root, and data for body weight, biomass and relative gene expression ratio were transformed by Ln. The effect of diet on growth performances, mRNA level for each sampling date and lipid composition was tested on means per tank using a one-way ANOVA, after control of equality of variances using Levene's test. Effects of diet and age of fish on mRNA level were tested on means per tank using two-way ANOVA, after control of equality of variances using the χ2 test. The effect of larval nutritional conditioning on mass gain of R-groups of juveniles, as well as between R- and C-groups was tested comparing curve slopes between t0 and t7, t7 and t21, and t21 and t35 by a one-way ANOVA. The Newman–Keuls multiple-range test was used to compare means in case of a significant effect (P < 0·05).
Results
Experiment 1
Growth performances
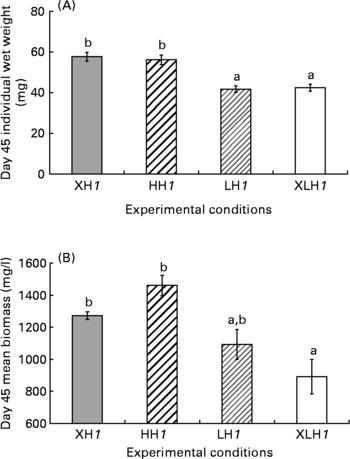
Diet did not significantly influence larval survival rate (46·0 (se 2·3) %), while the mean wet weight was more than 25 % higher in XH1 and HH1 groups than in LH1 and XLH1 groups (Fig. 1 (A); P < 0·001). The mean final biomass of XLH1 groups (892 (se 108) mg/l) was about 34 % lower than that of XH1 and HH1 groups (1367 (se 47) mg/l; P < 0·01), while biomass measured in LH1 groups (1093 (se 93) mg/l) was not significantly different from the others (Fig. 1 (B)).
(A) Day 45 mean larval wet weight (n 4) and (B) biomass for each experimental condition (n 4 for extra-high-highly unsaturated fatty acid (HUFA) (XH1) and high-HUFA (HH1) groups and n 6 for extra-low HUFA (XLH1) and low-HUFA (LH1) groups). Values are means, with their standard errors represented by vertical bars. The effect of diet was statistically significant (P < 0·01). a,b Mean values with unlike letters were significantly different (P < 0·05).
Gene expression
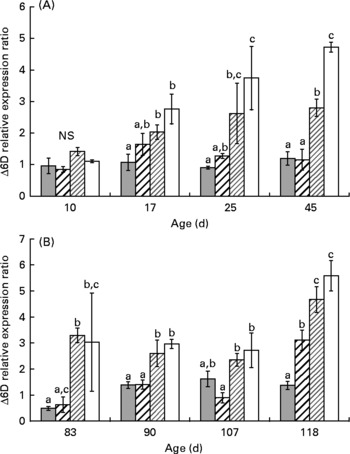
At day 10, the Δ6D mRNA level was similar in all groups (Fig. 2 (A); 1·0 (se 0·2)). At day 17, LH1 and XLH1 groups exhibited higher values than XH1 groups (P < 0·05) but were similar to HH1 groups. The difference between groups fed a low-HUFA diet (XLH1, LH1) and those fed a rich-HUFA diet (XH1, HH1) increased with time, and mean Δ6D mRNA level measured in XLH1 and LH1 groups was higher than that of XH1 and HH1 groups at day 45 (P < 0·01).
(A) Δ-6-Desaturase gene expression ratio (Δ6D) according to time in the larval experiment (experiment 1) and for each experimental condition (n 4). (![]() ), Extra-high-highly unsaturated fatty acid (HUFA) diet (XH1); (
), Extra-high-highly unsaturated fatty acid (HUFA) diet (XH1); (![]() ), high-HUFA diet (HH1); (
), high-HUFA diet (HH1); (![]() ), low-HUFA diet (LH1); (□), extra-low-HUFA diet (XLH1). Ratios are expressed relative to the HH1 group. (B) Δ6D gene expression ratio according to time in the juvenile experiment (experiment 2; restricted-HUFA diet during the juvenile stage) and for each experimental condition (n 4). (
), low-HUFA diet (LH1); (□), extra-low-HUFA diet (XLH1). Ratios are expressed relative to the HH1 group. (B) Δ6D gene expression ratio according to time in the juvenile experiment (experiment 2; restricted-HUFA diet during the juvenile stage) and for each experimental condition (n 4). (![]() ), Extra-high-highly unsaturated fatty acid (HUFA) larval diet (XH2 R); (
), Extra-high-highly unsaturated fatty acid (HUFA) larval diet (XH2 R); (![]() ), high-HUFA larval diet (HH2 R); (
), high-HUFA larval diet (HH2 R); (![]() ), low-HUFA larval diet (LH2 R); (□), extra-low-HUFA larval diet (XLH2 R). Ratios are expressed relative to the HH2 R group. Values are means, with their standard errors represented by vertical bars. a,b,c Mean values at a time point with unlike letters were significantly different (P < 0·05).
), low-HUFA larval diet (LH2 R); (□), extra-low-HUFA larval diet (XLH2 R). Ratios are expressed relative to the HH2 R group. Values are means, with their standard errors represented by vertical bars. a,b,c Mean values at a time point with unlike letters were significantly different (P < 0·05).
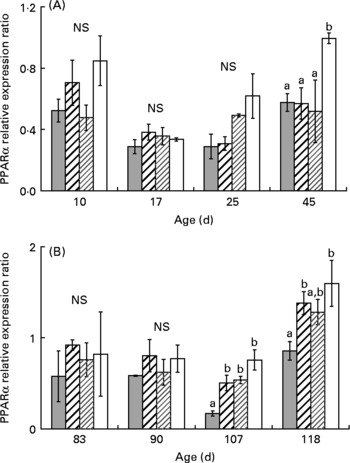
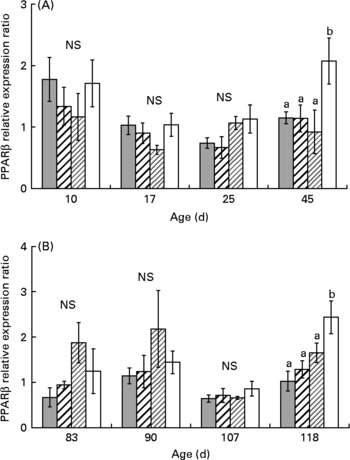
One-way ANOVA analysis revealed that PPARα, β and γ mRNA levels were not affected by diet from day 10 to day 25 (Figs. 3, 5). At day 45, PPARα and β mRNA levels were higher in XLH1 groups than in others (P < 0·05), while PPARγ mRNA level was higher in XLH1 groups than that measured in LH1 larvae (P < 0·05) but similar to that measured in XH1 and HH1 groups.
(A) PPARα expression ratio according to time in the larval experiment (experiment 1) and for each experimental condition (n 4). (![]() ), Extra-high-highly unsaturated fatty acid (HUFA) diet (XH1); (
), Extra-high-highly unsaturated fatty acid (HUFA) diet (XH1); (![]() ), high-HUFA diet (HH1); (
), high-HUFA diet (HH1); (![]() ), low-HUFA diet (LH1); (□), extra-low-HUFA diet (XLH1). Ratios are expressed relative to the HH1 group. (B) PPARα expression ratio according to time in the juvenile experiment (experiment 2; restricted-HUFA diet during the juvenile stage) and for each experimental condition (n 4). (
), low-HUFA diet (LH1); (□), extra-low-HUFA diet (XLH1). Ratios are expressed relative to the HH1 group. (B) PPARα expression ratio according to time in the juvenile experiment (experiment 2; restricted-HUFA diet during the juvenile stage) and for each experimental condition (n 4). (![]() ), Extra-high-highly unsaturated fatty acid (HUFA) larval diet (XH2 R); (
), Extra-high-highly unsaturated fatty acid (HUFA) larval diet (XH2 R); (![]() ), high-HUFA larval diet (HH2 R); (
), high-HUFA larval diet (HH2 R); (![]() ), low-HUFA larval diet (LH2 R); (□), extra-low-HUFA larval diet (XLH2 R). Ratios are expressed relative to the HH2 R group. Values are means, with their standard errors represented by vertical bars. a,b Mean values at a time point with unlike letters were significantly different (P < 0·05).
), low-HUFA larval diet (LH2 R); (□), extra-low-HUFA larval diet (XLH2 R). Ratios are expressed relative to the HH2 R group. Values are means, with their standard errors represented by vertical bars. a,b Mean values at a time point with unlike letters were significantly different (P < 0·05).
(A) PPARβ expression ratio according to time in the larval experiment (experiment 1) and for each experimental condition (n 4). (![]() ), Extra-high-highly unsaturated fatty acid (HUFA) diet (XH1); (
), Extra-high-highly unsaturated fatty acid (HUFA) diet (XH1); (![]() ), high-HUFA diet (HH1); (
), high-HUFA diet (HH1); (![]() ), low-HUFA diet (LH1); (□), extra-low-HUFA diet (XLH1). Ratios are expressed relative to the HH1 group. (B) PPARβ expression ratio according to time in the juvenile experiment (experiment 2; restricted-HUFA diet during the juvenile stage) and for each experimental condition (n 4). (
), low-HUFA diet (LH1); (□), extra-low-HUFA diet (XLH1). Ratios are expressed relative to the HH1 group. (B) PPARβ expression ratio according to time in the juvenile experiment (experiment 2; restricted-HUFA diet during the juvenile stage) and for each experimental condition (n 4). (![]() ), Extra-high-highly unsaturated fatty acid (HUFA) larval diet (XH2 R); (
), Extra-high-highly unsaturated fatty acid (HUFA) larval diet (XH2 R); (![]() ), high-HUFA larval diet (HH2 R); (
), high-HUFA larval diet (HH2 R); (![]() ), low-HUFA larval diet (LH2 R); (□), extra-low-HUFA larval diet (XLH2 R). Ratios are expressed relative to the HH2 R group. Values are means, with their standard errors represented by vertical bars. a,b Mean values at a time point with unlike letters were significantly different (P < 0·05).
), low-HUFA larval diet (LH2 R); (□), extra-low-HUFA larval diet (XLH2 R). Ratios are expressed relative to the HH2 R group. Values are means, with their standard errors represented by vertical bars. a,b Mean values at a time point with unlike letters were significantly different (P < 0·05).
(A) PPARγ expression ratio according to time in the larval experiment (experiment 1) and for each experimental condition (n 4). (![]() ), Extra-high-highly unsaturated fatty acid (HUFA) diet (XH1); (
), Extra-high-highly unsaturated fatty acid (HUFA) diet (XH1); (![]() ), high-HUFA diet (HH1); (
), high-HUFA diet (HH1); (![]() ), low-HUFA diet (LH1); (□), extra-low-HUFA diet (XLH1). Ratios are expressed relative to the HH1 group. (B) PPARγ expression ratio according to time in the juvenile experiment (experiment 2; restricted-HUFA diet during the juvenile stage) and for each experimental condition (n 4). (
), low-HUFA diet (LH1); (□), extra-low-HUFA diet (XLH1). Ratios are expressed relative to the HH1 group. (B) PPARγ expression ratio according to time in the juvenile experiment (experiment 2; restricted-HUFA diet during the juvenile stage) and for each experimental condition (n 4). (![]() ), Extra-high-highly unsaturated fatty acid (HUFA) larval diet (XH2 R); (
), Extra-high-highly unsaturated fatty acid (HUFA) larval diet (XH2 R); (![]() ), high-HUFA larval diet (HH2 R); (
), high-HUFA larval diet (HH2 R); (![]() ), low-HUFA larval diet (LH2 R); (□), extra-low-HUFA larval diet (XLH2 R). Ratios are expressed relative to the HH2 R group. Values are means, with their standard errors represented by vertical bars. a,b,c Mean values at a time point with unlike letters were significantly different (P < 0·05).
), low-HUFA larval diet (LH2 R); (□), extra-low-HUFA larval diet (XLH2 R). Ratios are expressed relative to the HH2 R group. Values are means, with their standard errors represented by vertical bars. a,b,c Mean values at a time point with unlike letters were significantly different (P < 0·05).

Lipid analysis
The TL content in day 45 larvae was low (between 2 and 3 % wet weight) and there were no significant differences between treatments (Table 3). Differences in NL composition of larvae at day 45 reflected those of the diets (Tables 1 and 3). However, 18 : 3n-6 was significantly higher in the NL of XLH1 and LH1 larvae than in the NL of XH1 and HH1 larvae (P < 0·01) independent of 18 : 3n-6 dietary content. HUFA (arachidonic acid (AA; 20 : 4n-6), EPA and DHA) contents were high in the PL of day 45 larvae, and increased from XLH1 to XH1, according to diet (P < 0·05). The 18 : 2n-6 and 18 : 3n-3 contents were lower in the PL of larvae than in diets, and decreased from XLH1 to XH1, according to diet (P < 0·001). Other PUFA were low and not directly related to diet composition: 18 : 3n-6 and 20 : 3n-6 were significantly higher in the PL of LH1 and XLH1 larvae than in the PL of XH1 and HH1 larvae (P < 0·001 and P < 0·0·05, respectively) and 20 : 2n-6 was lower in the PL of XH1 larvae than in the PL of other groups (P < 0·001). The other intermediates in n-3 fatty acid synthesis (18 : 4; 20 : 3, 20 : 4) were very low (0·12; 0·06 and 0·20 % of FAME, respectively) and their content was not different between the groups (data not presented in Table 3).
(Mean values (n 4) with their standard errors)

XH, extra-high-HUFA diet; HH, high-HUFA diet; LH, low-HUFA diet; XLH, extra-low-HUFA diet.
a,b,c,d Mean values within a row with unlike superscript letters were significantly different (P < 0·05).
*P < 0·05, **P < 0·01, ***P < 0·001.
The PL content in day 45 larvae represented a major proportion of TL ranging from 41 to 47 %, with a significantly higher value in XH1 fish than in LH1 and XLH1 groups (P < 0·05). Accordingly, TL fatty acid profiles of larvae (not presented here) showed intermediate percentages between those obtained in NL and PL.
Experiment 2
Growth performances
Juvenile survival rate (98·3 (se 0·25) %) was not affected by larval nutritional conditioning. There was no significant difference in weight increase from day 83 (t0) to day 118 (t35) in the four R-groups (2·2 (se 0·02) g). The mass gain was similar between the R-groups (Fig. 6) and C-groups (not presented) from t0 to t7 (NS differences in curve slopes). From t7 to t21, mass increase was significantly higher in the R-groups than in C-groups (P < 0·01) and significantly lower from t21 to t35 (P < 0·01). Day 83 to day 118 DGI was not significantly different (P = 0·075) between the R- (1·13 (se 0·02) %) and C-groups (1·19 (se 0·00) %).
Fresh body weight increase over time (days 83–118) in the juvenile experiment (experiment 2; restricted-HUFA diet during the juvenile stage) for the four restricted groups (n 4). (–▲–), Extra-high-highly unsaturated fatty acid (HUFA) larval diet (XH2 R); (– × –), high-HUFA larval diet (HH2 R); (–●–), low-HUFA larval diet (LH2 R); (–■–), extra-low-HUFA larval diet (XLH2 R). Values are means, with their standard errors represented by vertical bars.
Gene expression
The mean Δ6D mRNA level was 2-fold higher at day 118 than at any time-point earlier (Fig. 2 (B); two-way ANOVA; P < 0·001). One-way ANOVA performed at each sampling date indicated that Δ6D mRNA level was significantly higher in XLH2 R and LH2 R groups than in XH2 R groups at day 83 (P < 0·05), while XLH2 R and HH2 R groups showed similar values. At day 90, XLH2 R and LH2 R groups showed about 2-fold higher values than XH2 R and HH2 R groups (P < 0·05) and at day 107, XLH2 R, LH2 R and XH2 R groups showed higher values than in HH2 R groups (P < 0·05). At day 118, the Δ6D mRNA level was lowest in XH2 R groups (1·4 (se 0·2)) and highest in XLH2 R and LH2 R groups (4·7 (se 0·5) and 5·6 (se 0·6), respectively; P < 0·001).
The mean PPARα and β mRNA levels were globally higher at the end of experiment 2 (day 118) than at any previous time-point (Figs. 3(B) and 4 (B); two-way ANOVA; P < 0·01). Using one-way ANOVA, PPARα and β mRNA levels were similar in all R-groups at day 83 and day 90. At day 107, PPARα mRNA level was about 3-fold lower in XH2 R than in other groups (P < 0·01), while PPARβ mRNA levels were similar in all groups. At day 118, PPARα mRNA level was similar in XH2 R and LH2 R groups, and about 50 % lower than in HH2 R and XLH2 R groups (P < 0·05). In comparison, PPARβ was significantly higher in XLH2 R groups than in other groups (P < 0·01). PPARγ mRNA level was significantly lower at day 107 than at other sampling periods (Fig. 5 (B); two-way ANOVA; P < 0·001). At day 83, it was more than 3-fold higher in LH2 R groups than in others (3·4 (se 0·6); P < 0·05), while non-significant differences occurred between groups at day 90 and day 107. At day 118, XLH2 R groups showed a significantly higher mRNA level than XH2 R and HH2 R groups (P < 0·01).
Lipid analysis
The mean whole-body TL content of the R-groups was not significantly different between groups during the course of the experiment (Table 4). It was 4·4 (se 0·4) % wet weight at day 83 and 9·2 (se 0·2) % at day 118. The PL content represented a higher proportion of TL at day 83 than at day 118 (29·5 (se 1·1) v. 13·4 (se 0·9) % TL). At day 83 (i.e. after 1 month of feeding the commercial diet), the influence of diets observed during the larval stage disappeared, fatty acid composition was very similar in all groups, except for DHA, which was higher in the NL of XH2 R groups than in others (12·4 (se 0·2) v. 11·5 (se 0·0) % FAME; P < 0·05). At day 118, the DHA, EPA, AA, 18 : 3n-6 and SFA contents in the NL of R-groups were higher than in the restricted diet (P < 0·05), while 18 : 2n-6, 18 : 3n-3, MUFA and PUFA levels were lower (Tables 4 and 2). DHA, EPA and 20 : 3n-3 were higher in the NL of XH2 R groups than in others at day 118 (P < 0·01 and P < 0·05, respectively). Other fatty acids in NL were not significantly different within the R-groups. From day 83 to day 118, 18 : 2n-6, 18 : 3n-3 and MUFA content in NL increased by 45, 75 and 41 %, respectively, while other fatty acids, including DHA, EPA and AA decreased (11·9 (se 0·2) v. 2·4 (se 0·1) % FAME for DHA). The 18 : 3n-6, AA, EPA and DHA contents were higher in the PL of day 118 juveniles than in their restricted diet, while the contrary was observed for 18 : 2n-6 and 18 : 3n-3 (Table 4 and 2). From day 83 to day 118, 18 : 2n-6, 18 : 3n-6, 20 : 2n-6, 20 : 3n-6, 18 : 3n-3 and MUFA content in PL increased, while others fatty acids, including DHA, EPA and AA, decreased (Fig. 7). The fatty acid content in PL was not significantly different within the R-groups at day 83, as well as at day 118, except for 20 : 4n-3, which was higher in LH2 R groups than in others (P < 0·05). The AA, EPA, DHA, SFA and PUFA were noticeably higher in PL than in NL at day 83 and day 118.
(Mean values (n 4) with their standard errors)

XH, extra-high-HUFA diet; HH, high-HUFA diet; LH, low-HUFA diet; XLH, extra-low-HUFA diet.
a,b Mean values within a row with unlike superscript letters were significantly different (P < 0·05).
*P < 0·05, **P < 0·01.
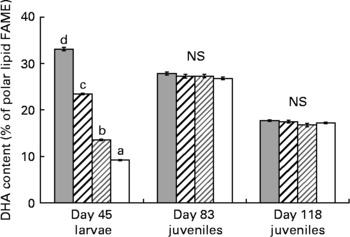
DHA content in polar lipids (% fatty acid methyl esters; FAME) of day 45 larvae (n 4), and day 83 (n 4) and day 118 juveniles fed the restricted diet (n 4), according to the larval initial diet. (![]() ), Extra-high-highly unsaturated fatty acid (HUFA) larval diet (XH); (
), Extra-high-highly unsaturated fatty acid (HUFA) larval diet (XH); (![]() ), high-HUFA larval diet (HH); (
), high-HUFA larval diet (HH); (![]() ), low-HUFA larval diet (LH); (□), extra-low-HUFA larval diet (XL). The effect of the initial diet was statistically significant at day 45 (P < 0·001). a,b,c,d Mean values at a time point with unlike letters were significantly different (P < 0·05).
), low-HUFA larval diet (LH); (□), extra-low-HUFA larval diet (XL). The effect of the initial diet was statistically significant at day 45 (P < 0·001). a,b,c,d Mean values at a time point with unlike letters were significantly different (P < 0·05).
The fatty acid content of the C-groups was related to the control diet (not detailed here). Their HUFA content was clearly higher than in the R-groups (not detailed here). The AA, EPA and DHA contents in the PL of the C-groups were 1·9 (se 0·0), 9·8 (se 0·2) and 24·2 (se 1·3) % FAME, respectively. The low number of replicates did not allow a statistical evaluation within C-groups.
Discussion
The aim of the present study was to elucidate whether the stimulation of desaturation/elongation pathways for n-3 HUFA synthesis in juveniles induced by a larval nutritional conditioning shown in a previous study(Reference Vagner, Zambonino Infante and Robin8) can be amplified using a large range of n-3 HUFA content (0·5–3·7 % EPA+DHA) in the larval diet and a severe n-3 HUFA-restricted diet (0·3 % EPA+DHA; restricted diet) during the juvenile period.
As encountered in other studies(Reference Vagner, Robin and Zambonino Infante7, Reference Zambonino Infante and Cahu13), diet composition had no significant effect on larval survival rates, while very low dietary n-3 HUFA content (XLH; 0·5 % EPA+DHA) led to decreased larval mass gain. Survival rates obtained were in agreement with a previous study(Reference Zambonino Infante and Cahu13), in which sea bass larvae reared at 19°C and fed a diet similar to HH1 had a survival rate of 48 % at day 38. The effect of high dietary HUFA content on mass gain could be the consequence of an elevated n-3-HUFA requirement for high cellular turnover during the larval stage(Reference Le Milinaire14). Larval mean weights obtained in the present study were high at day 45, and the values obtained in HH1 groups was much higher than found previously(Reference Zambonino Infante and Cahu13) in sea bass larvae reared in similar conditions. This could indicate that the initial larvae were of high quality. As previously observed(Reference Vagner, Zambonino Infante and Robin8), larval conditioning did not affect the growth performance of sea bass juveniles fed the restricted diet, despite large differences in juvenile initial weight at the onset of experiment 2, as a result of the different n-3 HUFA contents of the larval diets. The weight increase of R-juveniles was good in all groups, as it more than doubled in 35 d, and was not significantly different from that observed in C-groups during week 1 of the experiment. However, the growth of the R-groups seemed to be limited during the last period of the experiment. This was in accordance with a significant growth retardation of sea bass juveniles fed different HUFA dietary contents for 7 weeks(Reference Skalli and Robin9).
As observed earlier(Reference Vagner, Robin and Zambonino Infante7, Reference Vagner, Zambonino Infante and Robin8), the level of Δ6D mRNA was significantly higher in larvae fed a restricted n-3 HUFA diet during the larval stage (0·5 or 0·7 % EPA+DHA) and in juveniles fed a low-HUFA diet (0·3 % EPA+DHA) following a transient feeding on a HUFA diet. This revealed that (i) Δ6D transcription could be modulated by the n-3 HUFA content of the diet, as observed in seabream(Reference Seiliez, Panserat and Corraze15) and, that (ii) conditioned juveniles were better than unconditioned fish in better developing desaturation processes in order to adapt to a low dietary HUFA content. The mRNA expression data were supported by the significant increase in 18 : 3n-6 measured in PL, as it is the Δ6D desaturation product of 18 : 2n-6, and could not have been obtained through the diet. These findings indicate that the increase in the level of Δ6D mRNA probably led to an increase in Δ6D enzymic activity required for the first step of the bioconversion of 18-carbon fatty acids to HUFA (20–22 carbons), and for the conversion of EPA to DHA(Reference Buzzi, Henderson and Sargent16). Contrary to our previous study(Reference Vagner, Zambonino Infante and Robin8), the present results showed a persistence of Δ6D mRNA level in juveniles 30 d after feeding of the larval diets ceased, and beyond the intermediate period on a high-HUFA diet. It may be a consequence of (i) the more restricted HUFA contents in the larval (0·5 and 0·7 % EPA+DHA v. 0·8 %) and juvenile (0·3 v. 0·5 %) diets used, (ii) the younger fish used (day 83 v. day 151 at the beginning of experiment 2), or (iii) a shorter acclimatisation period (30 v. 90 d).
The present results demonstrated that PPARα and PPARβ genes, which are involved in fatty acid catabolism and keratinocyte differentiation, showed a higher mRNA level in day 45 larvae fed the lowest dietary n-3 HUFA content (0·5 % EPA+DHA); this was maintained in day 118 juveniles in the case of PPARβ. These results were in concordance with the higher Δ6D mRNA level measured in these groups at the same times. According to several studies conducted in mammals(Reference Nakamura and Nara17), PPAR are involved, along with sterol regulatory element binding protein-1 (SREBP-1a and SREBP-1c), in the control of the Δ6D gene transcription. SREBP-1 binds to sterol regulatory elements, and mediates the suppression of the Δ6D gene by HUFA. In the present study, the concomitant increase of PPAR and Δ6D mRNA levels suggested that PPAR could be partly involved in modulating Δ6D gene expression in larval and juvenile sea bass. PPARγ is involved in adipocyte differentiation and induction of lipogenic enzymes and, although its mRNA level was not significantly higher in larvae fed an n-3 HUFA-deprived diet, it was significantly higher in day 118 juveniles pre-conditioned with the lowest-n-3 HUFA diet during the larval stage. This suggested that PPARγ could also have a role in the stimulation of the Δ6D gene expression observed at the same time. The stimulation of PPAR mRNA level was not significantly higher in juveniles pre-conditioned with the LH diet (0·7 % HUFA dietary content), in spite of the significantly higher Δ6D mRNA level measured in these groups. We could hypothesise that the Δ6D gene could possibly be stimulated by PPAR when drastic nutritional conditions occurred, and that above a threshold, other mechanisms like those observed in mammals may be implicated, such as SREBP-1. This hypothesis is in concordance with previous results(Reference Vagner, Zambonino Infante and Robin8), which did not reveal any significant stimulation of PPAR, using a conditioning larval diet containing 0·8 % EPA+DHA, while a higher Δ6D mRNA level was observed.
As the increase in PPAR and Δ6D mRNA levels observed in larvae fed a low-HUFA diet was retained in juveniles fed a low-HUFA diet, this indicated that (i) pre-conditioned fish were able to develop adaptation to low dietary HUFA content during the juvenile period and that (ii) this adaptation could be the consequence of nutritional programming occurring during larval stage. Several existing biological mechanisms described in mammals could explain the ‘memory’ of metabolic effects of early nutritional environments in juveniles(Reference Waterland and Garza18): induced variations in organ structure, alterations in cell number, clonal selection, metabolic differentiation, hepatocyte polyploidisation and epigenetic modifications. In the present study, the memory of metabolic process in juveniles could be due to epigenetic modifications of the Δ6D and PPAR genes. Epigenetic modifications are modifications of DNA and covalent modifications of histones, which condition the accessibility of chromatin to transcription factors, facilitating the recognition of genes to be expressed or silenced, transiently or permanently, by these factors(Reference Waterland and Garza18). The hepatocyte nuclear factor 1 α (HNF1 α) has been identified as an homeoprotein expressed in liver, kidney, pancreas and digestive tract that could activate transcription through participation in the recruitment of the general transcription machinery to the promoter, or through the remodelling of chromatin structure and demethylation that would allow transcription factors to interact with their cognate cis-acting elements(Reference Pontoglio, Faust and Doyen19).
The relatively high level of n-3 HUFA measured in the PL v. NL of larvae and juveniles was in agreement with the preferential incorporation of these fatty acids in PL contributing to the maintenance of PL quality(Reference Linares and Henderson20). Although AA, EPA and DHA were selectively incorporated in the PL of larvae, low values were observed in the PL of fish fed low-n-3 HUFA diets (LH1 and XLH1), revealing an n-3 deficiency in these groups. Even though growth was similar in LH1 and XLH1 larvae, the HUFA content in PL was different within these groups, in accordance with values previously observed in day 45 sea bass larvae fed a diet with similar EPA+DHA content(Reference Vagner, Robin and Zambonino Infante7). The XH1 groups showed an exceptionally high DHA content in both PL and NL in day 45 larvae, which has rarely been observed in aquaculture, except in larvae fed on natural plankton or on rotifers enriched with DHA(Reference Van Der Meeren, Klugsoyr and Wilhelmsen21, Reference Garcia, Parrish and Brown22). The AA deficiency observed in larvae fed the LH1 and XLH1 diets, while its precursor 18 : 2n-6 increased in these groups, can be explained by the low activity of Δ-5-desaturase in these groups. This hypothesis was in accordance with the very low enzymic activity of Δ-5-desaturase compared with that of Δ6D measured in seabream (Sparus aurata)(Reference Tocher and Ghioni23). That 18 : 4n-3 was not increased could be due to the higher concentration of this fatty acid in larvae combined with the low concentration of its precursor (18 : 3n-3) in the diets used, as shown in microsomes of dogs and rats(Reference Dunbar and Bauer24). Moreover, as the level of 18 : 2n-6 is 10-fold higher than 18 : 3n-3 in the diets, its bioconversion could be stimulated in larvae even although Δ6D usually shows higher affinity with n-3 fatty acids than with n-6 fatty acids(Reference Zheng, Seiliez and Hastings25). This suggested that production of 18 : 4n-3 could exist in n-3 HUFA-deprived larvae, even if it is not observable with the techniques used. Thus, the high level of n-6 fatty acids in the diet may mask effects on the n-3 HUFA synthesis pathway.
Day 83 R-juveniles showed a similar composition in NL, while at day 118, several n-3 HUFA, including EPA and DHA, were present at a higher level in the NL of XH2 R juveniles than in others. This indicated that differences observed at day 118 could be the consequence of the growth-dependent dilution effect of initial (day 83) fatty acid stores in the smaller fish(Reference Robin, Regost and Arzel26). The DHA content in the PL of R-juveniles at day 118 (about 17 %; P < 0·001) was intermediate between the DHA content of n-3-deprived LH1 and -sufficient HH1 larvae, and significantly lower than in C-groups (about 24 %) and day 83 juveniles (about 27 %). This was in agreement with a previous study(Reference Skalli and Robin9), which showed that sea bass juveniles fed at or above requirement had a minimal DHA content in PL of about 20 % of total fatty acids. The fatty acid content in the PL of day 118 juveniles remained similar in all groups, except for 20 : 4n-3, which was at a higher level in XH2 R groups than in others. In a previous experiment(Reference Vagner, Zambonino Infante and Robin8), a slightly higher DHA content in PL was found in juveniles conditioned with an n-3 HUFA-deprived diet during the larval stage than in others, suggesting an enhanced capacity to adapt to a HUFA-restricted diet. A similar result was not obtained in the present study, which could be the consequence of technical differences between the two experiments, or to biological mechanisms. Irrespective, the two studies showed that the observed stimulation of Δ6D mRNA was not linked to an increase in PL n-3 HUFA content, and this could be due to the very low rate of desaturation already described for European sea bass, even when up-regulated by diet(Reference Mourente, Dick and Bell27).
Conclusion
The present study demonstrated an amplified stimulation of Δ6D mRNA induced by dietary n-3 HUFA deficiency in juveniles pre-conditioned with a low dietary n-3 HUFA content during the larval stage, and persisting in young juveniles. However, this did not have a noticeable influence on fatty acid composition and growth performances in juveniles challenged with a HUFA-restricted diet. The present results also suggested the involvement of PPAR in the regulation of Δ6D gene expression. Further studies concerning enzymic activities of Δ6D and PPAR gene regulation are required to further investigate and understand the metabolic pathways for HUFA synthesis in marine fish.
Acknowledgements
The present study was supported by Ifremer (Institut Français pour la recherche et l'exploitation de la mer) and INRA (Institut National de Recherche Agronomique) grants to the first author (M. V.). M. V. conducted the analysis of growth and molecular biology, as well as the statistical analysis of all data. J. H. R. was responsible for the lipid analysis, J. L. Z. I. contributed to the analysis of molecular biology, and D. R. T. contributed to the lipid analysis and the English corrections. J. P.-L. R. contributed to all data analysis, as she was the PhD supervisor of the first author (M. V.). None of the authors has any conflicts of interest. We are grateful to N. Le Bayon, H. Le Delliou, M. M. Le Gall, P. Quazuguel and A. Sévère for their technical assistance.


