


1 Introduction
The interplanetary space is permeated by a plasma in which the rate of Coulomb collisions can either be negligible with respect to the flow transit time (from the Sun to the Earth), giving rise to a collisionless medium, or of the order of, or higher than, the transit time, inducing the system to relax towards the thermal equilibrium (Kasper, Lazarus & Gary Reference Kasper, Lazarus and Gary2008; Maruca et al. Reference Maruca, Bale, Sorriso-Valvo, Kasper and Stevens2013). It has been observed that, in the range of scales where kinetic effects dominate the plasma dynamics, the particle velocity distribution functions (VDFs) are far from the thermodynamic equilibrium. Recent self-consistent numerical simulations and nonlinear models of plasma turbulence dynamics have also shown the emergence of significant non-Maxwellian features in the particle VDFs. In particular, 2D-3V (two dimensions in physical space and three dimensions in velocity space) kinetic, hybrid Vlasov–Maxwell (HVM) numerical simulations (Valentini et al. Reference Valentini, Trávníček, Califano, Hellinger and Mangeney2007), which reproduce the turbulent energy cascade down to ion scales, have highlighted significant local departures of the ion VDFs from a Maxwellian shape close to current sheets, generated by the turbulent cascade and non-uniformly distributed through space, which are often associated with the observed ion temperature anisotropy (Greco et al. Reference Greco, Valentini, Servidio and Matthaeus2012; Servidio et al. Reference Servidio, Valentini, Califano and Veltri2012). A certain degree of correlation between the emergence of non-Maxwellian features in the ion VDFs and the presence of regions of high ion vorticity has also been found in such simulations (Valentini et al. Reference Valentini, Perrone, Stabile, Pezzi, Servidio, De Marco, Marcucci, Bruno, Lavraud and De Keyser2016; Sorriso-Valvo et al. Reference Sorriso-Valvo, Perrone, Pezzi, Valentini, Servidio, Zouganelis and Veltri2018b). Localized heating close to strong enhancements of ion vorticity has also been observed in other numerical experiments (Franci et al. Reference Franci, Hellinger, Matteini, Verdini and Landi2016; Parashar & Matthaeus Reference Parashar and Matthaeus2016). Finally, distortions of the VDFs have been found to be related to strong magnetic field activity and to the magnetic field topology (see Servidio et al. Reference Servidio, Valentini, Califano and Veltri2012). On the other hand, recent analysis made on the solar wind and near-Earth plasma have shown that, at proton scales, the plasma is characterized by magnetic discontinuities (Retinò et al. Reference Retinò, Sundkvist, Vaivads, Mozer, André and Owen2007; Perri et al. Reference Perri, Goldstein, Dorelli and Sahraoui2012) that are connected through spatial scales from ion to electron scales (Greco et al. Reference Greco, Perri, Servidio, Yordanova and Veltri2016; Perrone et al. Reference Perrone, Alexandrova, Mangeney, Maksimovic, Lacombe, Rakoto, Kasper and Jovanovic2016, Reference Perrone, Alexandrova, Roberts, Lion, Lacombe, Walsh, Maksimovic and Zouganelis2017), giving rise to a complex network, whose effect on the plasma dynamics is still under investigation. Local heating and magnetic energy dissipation at such thin current sheets have been observed in numerical simulations (Wu et al. Reference Wu, Perri, Osman, Wan, Matthaeus, Shay, Goldstein, Karimabadi and Chapman2013; Perrone et al. Reference Perrone, Valentini, Servidio, Dalena and Veltri2014; Wan et al. Reference Wan, Matthaeus, Roytershteyn, Karimabadi, Parashar, Wu and Shay2015; Sorriso-Valvo et al. Reference Sorriso-Valvo, Carbone, Perri, Greco, Marino and Bruno2018a). Moreover, recent works have also found that velocity-space fluctuations of the ion VDF are characterized by a broad, power-law Hermite spectrum (that is an enstrophy cascade in the velocity space) both in in situ data (Servidio et al. Reference Servidio, Chasapis, Matthaeus, Perrone, Valentini, Parashar, Veltri, Gershman, Russell and Giles2017) and in numerical simulations (Schekochihin et al. Reference Schekochihin, Parker, Highcock, Dellar, Dorland and Hammett2016; Cerri, Kunz & Califano Reference Cerri, Kunz and Califano2018; Pezzi et al. Reference Pezzi, Servidio, Perrone, Valentini, Sorriso-Valvo, Greco, Matthaeus and Veltri2018) and that velocity-space activity is intermittent and concentrated near coherent structures (Pezzi et al. Reference Pezzi, Servidio, Perrone, Valentini, Sorriso-Valvo, Greco, Matthaeus and Veltri2018).
Thanks to the launch of the Magnetospheric Multiscale (MMS) mission, we get both the advantage of accessing plasma measurements at a time resolution never reached by previous space missions and the possibility of making spatial measurements from a constellation of four identical satellites able to approach a minimum distance close to  $7$ km (this is the shortest inter-spacecraft distance ever reached). Thus, such kind of measurements allow us to investigate kinetic physics and the possible formation of discontinuities at ion and electron scales. Observations of reconnecting current sheets in the Earth’s magnetopause have been reported (Burch et al. Reference Burch, Torbert, Phan, Chen, Moore, Ergun, Eastwood, Gershman, Cassak and Argall2016; Ergun et al. Reference Ergun, Goodrich, Wilder, Holmes, Stawarz, Eriksson, Sturner, Malaspina, Usanova and Torbert2016), as well as signatures of crossings of ion and electron diffusion regions in the Earth’s magnetosheath (Eriksson et al. Reference Eriksson, Vaivads, Graham, Khotyaintsev, Yordanova, Hietala, André, Avanov, Dorelli and Gershman2016; Yordanova et al. Reference Yordanova, Vörös, Varsani, Graham, Norgren, Khotyaintsev, Vaivads, Eriksson, Nakamura and Lindqvist2016; Vörös et al. Reference Vörös, Yordanova, Varsani, Genestreti, Khotyaintsev, Li, Graham, Norgren, Nakamura and Narita2017) and in the magnetopause (Lavraud et al. Reference Lavraud, Zhang, Vernisse, Gershman, Dorelli, Cassak, Dargent, Pollock, Giles and Aunai2016). Those observations clearly show the presence of magnetic energy conversion to plasma heating and the signatures of the departure of the ion and electron VDFs from the local thermodynamic equilibrium (Graham et al. Reference Graham, Khotyaintsev, Vaivads, Norgren, André, Webster, Burch, Lindqvist, Ergun and Torbert2017; Sorriso-Valvo et al. Reference Sorriso-Valvo, Catapano, Retinò, Le Contel, Perrone, Roberts, Coburn, Panebianco, Valentini and Perri2019). Thus, one question can be whether the departure from the Maxwellian equilibrium in a plasma at kinetic scales is statistically significantly related to specific plasma quantities, such as the current density (to investigate whether distortion of the particle VDFs occurs in localized regions where current sheets form), temperature anisotropy and ion vorticity (to assess whether small scale vortices and velocity gradients induce non-Maxwellian features). In order to try to answer such a question, and motivated by a similar study made on ion VDFs in numerical simulations (Valentini et al. Reference Valentini, Perrone, Stabile, Pezzi, Servidio, De Marco, Marcucci, Bruno, Lavraud and De Keyser2016), here we perform a statistical investigation of the correlation between the degree of departure of the ion VDF from a Maxwellian shape and the plasma characteristic parameters, by comparing MMS data intervals in the Earth’s magnetosheath and HVM simulations of turbulence.
2 Magnetosheath event overview and measure of deviation from Maxwellian plasma
In this work we make use of the high-resolution (150 ms) ion VDFs from the Fast Plasma Investigation (FPI) instrument on board MMS (Pollock et al. Reference Pollock, Moore, Jacques, Burch, Gliese, Saito, Omoto, Avanov, Barrie and Coffey2016), the magnetic field from the merged fluxgate (FGM) (Russell et al. Reference Russell, Anderson, Baumjohann, Bromund, Dearborn, Fischer, Le, Leinweber, Leneman and Magnes2016) and search coil (SCM) data (Le Contel et al. Reference Le Contel, Leroy, Roux, Coillot, Alison, Bouabdellah, Mirioni, Meslier, Galic and Vassal2016), at approximately 1 kHz resolution (Fischer et al. Reference Fischer, Magnes, Hagen, Dors, Chutter, Needell, Torbert, Le Contel, Strangeway and Kubin2016), and the electric field data from the Electric Double Probe (EDP) instrument, at an approximately 8 kHz sampling rate (Ergun et al. Reference Ergun, Goodrich, Wilder, Holmes, Stawarz, Eriksson, Sturner, Malaspina, Usanova and Torbert2016; Lindqvist et al. Reference Lindqvist, Olsson, Torbert, King, Granoff, Rau, Needell, Turco, Dors and Beckman2016; Torbert et al. Reference Torbert, Russell, Magnes, Ergun, Lindqvist, Le Contel, Vaith, Macri, Myers and Rau2016). The data describe a 5 min period on 2015 November 30 (from 00:21 to 00:26 UT) where the MMS spacecraft was immersed in the quasi-parallel turbulent magnetosheath (see Yordanova et al. Reference Yordanova, Vörös, Varsani, Graham, Norgren, Khotyaintsev, Vaivads, Eriksson, Nakamura and Lindqvist2016, Vörös et al. Reference Vörös, Yordanova, Varsani, Genestreti, Khotyaintsev, Li, Graham, Norgren, Nakamura and Narita2017). In this interval, the mean magnetic field (averaged over the whole 5 min) is  $B_{0}\sim 44$ nT, the ion to electron temperature ratio $T_{i}/T_{e}\sim 7$ and the plasma $\unicode[STIX]{x1D6FD}$ (namely the ratio between the plasma kinetic pressure and the magnetic pressure) shows large amplitude fluctuations and is greater than $1$. The aim of this work is to investigate the possible presence of non-Maxwellian features in the ion VDFs close to intermittent magnetic structures by means of a parameter that quantifies the deviation of the measured VDF from a Maxwellian shape (Greco et al. Reference Greco, Valentini, Servidio and Matthaeus2012). Then, these distortions will be compared with the ones observed in numerical experiments of turbulence to advance our knowledge on the physical mechanisms that could play a role in this process.
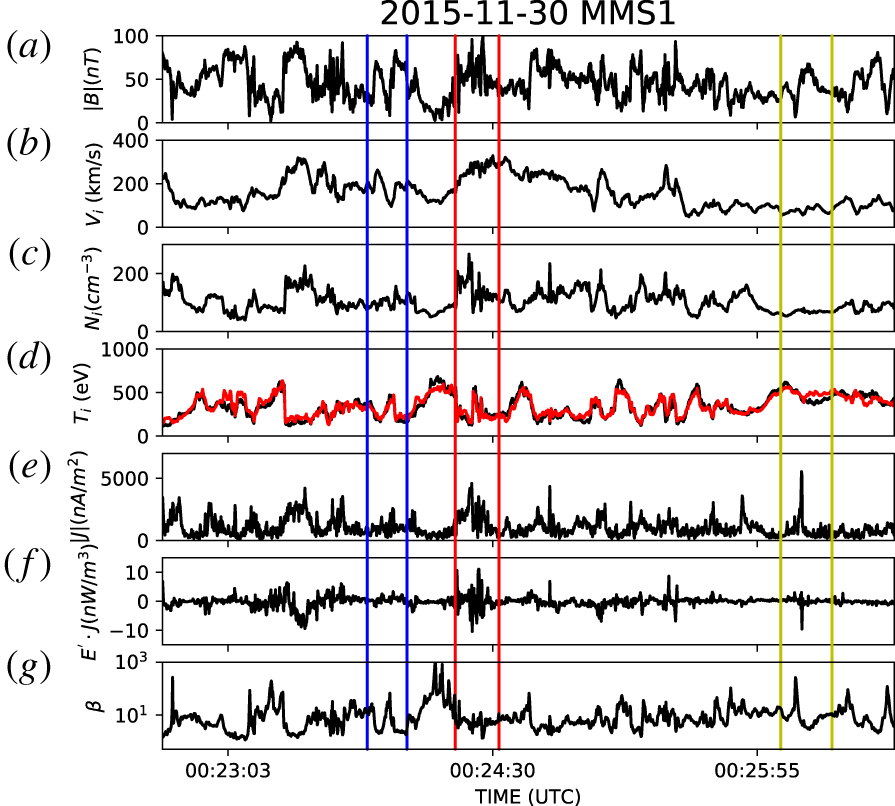
The event overview is shown in figure 1. From top to bottom we have (a) the magnetic field magnitude; (b) the ion bulk speed; (c) the ion density; (d) the ion temperature parallel (black line) and perpendicular (red line) to the mean magnetic field  $B_{0}$, (e) the intensity of the current density at $150$ ms resolution, computed as $\boldsymbol{J}=Nq(\boldsymbol{V}_{i}-\boldsymbol{V}_{e})$ with $N$ being the plasma density ( $N=N_{i}\sim N_{e}$) and $\boldsymbol{V}_{i}$ and $\boldsymbol{V}_{e}$ are the ion and the electron speeds, respectively; (f) $\boldsymbol{E}^{\prime }\boldsymbol{\cdot }\boldsymbol{J}$, which represents the work done by the fields on particles with $\boldsymbol{E}^{\prime }=\boldsymbol{E}+\boldsymbol{V}_{e}\times \boldsymbol{B}$ being the electric field in the electron frame; and (g) the ion plasma
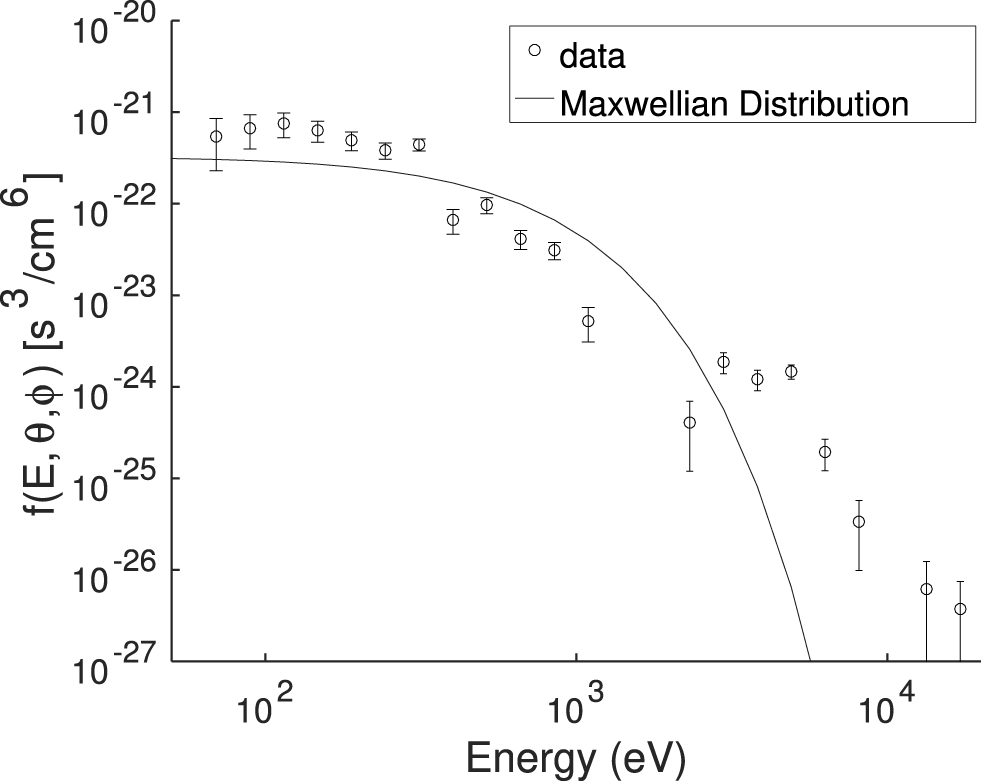
  $\unicode[STIX]{x1D6FD}$. All the data are from the MMS1 spacecraft. This represents a sample of turbulent plasma where three thin current sheet encounters have been analysed in previous studies (Eriksson et al. Reference Eriksson, Vaivads, Graham, Khotyaintsev, Yordanova, Hietala, André, Avanov, Dorelli and Gershman2016; Yordanova et al. Reference Yordanova, Vörös, Varsani, Graham, Norgren, Khotyaintsev, Vaivads, Eriksson, Nakamura and Lindqvist2016; Vörös et al. Reference Vörös, Yordanova, Varsani, Genestreti, Khotyaintsev, Li, Graham, Norgren, Nakamura and Narita2017) and are highlighted with coloured boxes in figure 1. Thus, in such a turbulent environment, the ion VDFs can be highly distorted and modified, as observed in numerical simulations (Servidio et al. Reference Servidio, Valentini, Califano and Veltri2012; Perrone et al. Reference Perrone, Valentini, Servidio, Dalena and Veltri2013) and in in situ data (Servidio et al. Reference Servidio, Chasapis, Matthaeus, Perrone, Valentini, Parashar, Veltri, Gershman, Russell and Giles2017; Vörös et al. Reference Vörös, Yordanova, Varsani, Genestreti, Khotyaintsev, Li, Graham, Norgren, Nakamura and Narita2017; Sorriso-Valvo et al. Reference Sorriso-Valvo, Catapano, Retinò, Le Contel, Perrone, Roberts, Coburn, Panebianco, Valentini and Perri2019). An example of a one-dimensional VDF cut as a function of energy is shown in figure 2 (symbols), where a clear departure from a Maxwellian distribution (solid line) is observed. Measurement errors are also displayed to show the significance of the departure from a Maxwellian. In particular, error bars represent the standard deviation of the observed particle distribution in the sky-map FPI instrument representation.
From top to bottom: (a) magnetic field magnitude, (b) ion bulk speed, (c) ion density, (d) parallel (black line) and perpendicular (red line) ion temperature, (e) current density magnitude computed using the FPI  $150$ ms data, (f) $\boldsymbol{E}^{\prime }\boldsymbol{\cdot }\boldsymbol{J}$, with $\boldsymbol{E}^{\prime }$ the electric field in the electron rest frame (i.e. $\boldsymbol{E}^{\prime }=\boldsymbol{E}+(\boldsymbol{V}_{e}\times \boldsymbol{B})$) at $150$ ms resolution, (g) the ion plasma $\unicode[STIX]{x1D6FD}$. The coloured vertical lines highlight previously reported studies (Eriksson et al. Reference Eriksson, Vaivads, Graham, Khotyaintsev, Yordanova, Hietala, André, Avanov, Dorelli and Gershman2016; Yordanova et al. Reference Yordanova, Vörös, Varsani, Graham, Norgren, Khotyaintsev, Vaivads, Eriksson, Nakamura and Lindqvist2016; Vörös et al. Reference Vörös, Yordanova, Varsani, Genestreti, Khotyaintsev, Li, Graham, Norgren, Nakamura and Narita2017).
Measured ion velocity distribution function (circles) as a function of energy measured at fixed angles and at a given time, compared with the associated Maxwellian distribution (solid line). Error bars are also shown.
In order to quantify the statistical occurrence of deviation from Maxwellian, we make use of the parameter (Greco et al. Reference Greco, Valentini, Servidio and Matthaeus2012; Valentini et al. Reference Valentini, Perrone, Stabile, Pezzi, Servidio, De Marco, Marcucci, Bruno, Lavraud and De Keyser2016)
 $$\begin{eqnarray}\unicode[STIX]{x1D716}_{i}=\frac{1}{n_{i}}\sqrt{\int (f_{i}-g_{i})^{2}\text{d}^{3}v},\end{eqnarray}$$
 with  $n_{i}$ the ion density, $f_{i}$ the observed VDF for the ions and $g_{i}$ the equivalent Maxwellian distribution with the same density, temperature and velocity as the observed one. Thus, $\unicode[STIX]{x1D716}_{i}=0$ indicates a Maxwellian VDF, while any $\unicode[STIX]{x1D716}_{i}\neq 0$ suggests a deviation from the equilibrium. As pointed out in Servidio et al. (Reference Servidio, Chasapis, Matthaeus, Perrone, Valentini, Parashar, Veltri, Gershman, Russell and Giles2017), $\unicode[STIX]{x1D716}_{i}^{2}$ is related to the phase-space enstrophy. We are comparing the real ion VDFs in the magnetosheath with a Maxwellian distribution as a quantitative measure of distortion of the distributions. We do not actually expect thermodynamic equilibrium in such an environment, so that finding non-Maxwellian distributions is not surprising. For example, the presence of cold ions (few tens of eV) of ionospheric origin (Toledo-Redondo et al. Reference Toledo-Redondo, André, Khotyaintsev, Vaivads, Walsh, Li, Graham, Lavraud, Masson and Aunai2016, Reference Toledo-Redondo, André, Khotyaintsev, Lavraud, Vaivads, Graham, Li, Perrone, Fuselier and Gershman2017; Li et al. Reference Li, André, Khotyaintsev, Vaivads, Fuselier, Graham, Toledo-Redondo, Lavraud, Turner and Norgren2017) could also produce a distortion of the ion VDF from a simple Maxwellian. However, the computation of $\unicode[STIX]{x1D716}_{i}$ allows us to have a quantitative measure of the departure from Maxwellian equilibrium.
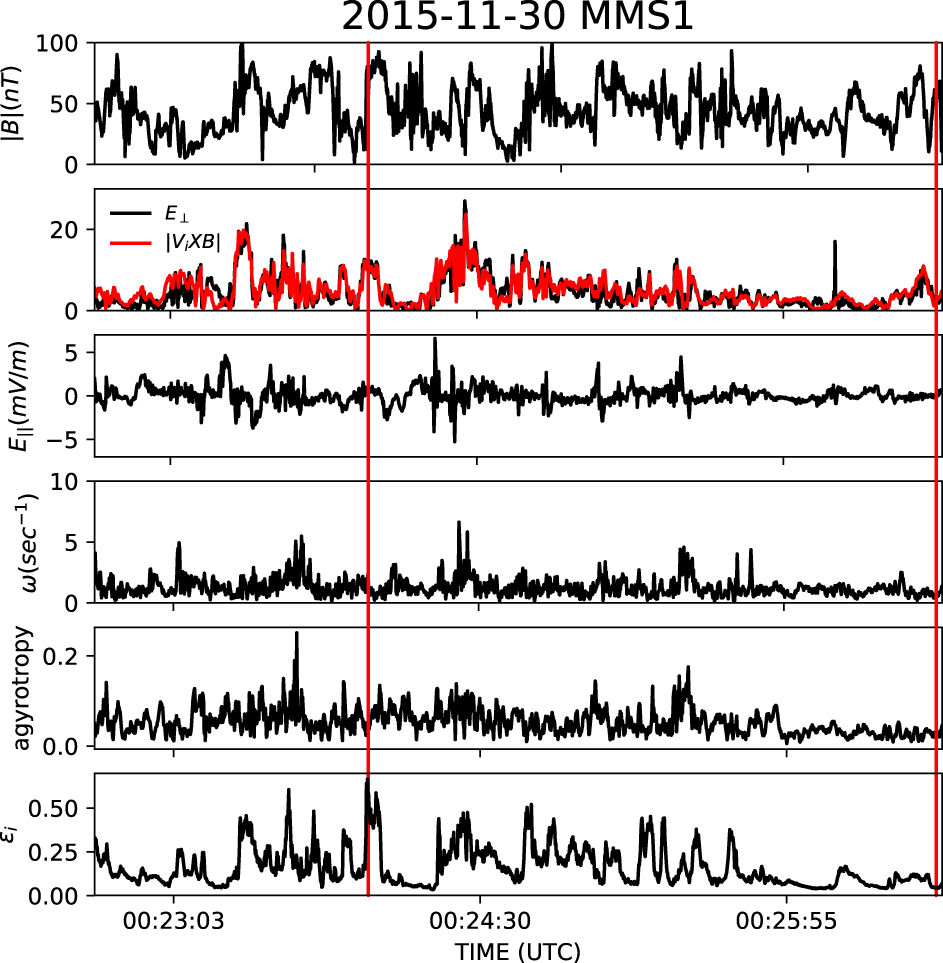
The time series of  $\unicode[STIX]{x1D716}_{i}$ in our turbulent interval is displayed in the bottom panel in figure 3; notice the burstiness of this quantity, with large deviations spread throughout the whole interval. Besides the time series of $\unicode[STIX]{x1D716}_{i}$, figure 3 shows, from top to bottom, the magnitude of the magnetic field (black line), the electric field $E_{\bot }=\sqrt{E_{\bot 1}^{2}+E_{\bot 2}^{2}}$ perpendicular to the local magnetic field (black line) – where $E_{\bot 1}$ lies along $\boldsymbol{E}\times \boldsymbol{B}$ and $E_{\bot 2}$ is aligned to $\boldsymbol{B}\times \boldsymbol{E}\times \boldsymbol{B}$ – together with the $|\boldsymbol{V}_{i}\times \boldsymbol{B}|$ (red line), the electric field component parallel to the local mean field and the ion vorticity $|\unicode[STIX]{x1D714}|=|\unicode[STIX]{x1D735}\times \boldsymbol{V}_{i}|$ from the 4 spacecraft measurements (the inter-satellite distance in this period is approximately $10$ km). Notice that ions are magnetized since $E_{\bot }$ and $|\boldsymbol{V}_{i}\times \boldsymbol{B}|$ track each other very well, and the time series of $\unicode[STIX]{x1D716}_{i}$ exhibits features that tend to correlate with $E_{\bot }$. The two red vertical lines in figure 3 indicate (i) a region where $\unicode[STIX]{x1D716}_{i}$ is above a $1\unicode[STIX]{x1D70E}$ threshold and seems to be correlated with enhancements in $E_{\bot }$ and $|\unicode[STIX]{x1D714}|$, and (ii) a region (near the right end of the interval) where $\unicode[STIX]{x1D716}_{i}$ is closer to zero (below the $1\unicode[STIX]{x1D70E}$ threshold). Thus, we have looked at the two-dimensional (2-D) VDF cuts in the regions indicated by the vertical lines in figure 3 in order to study their shapes and the emergence of kinetic features.
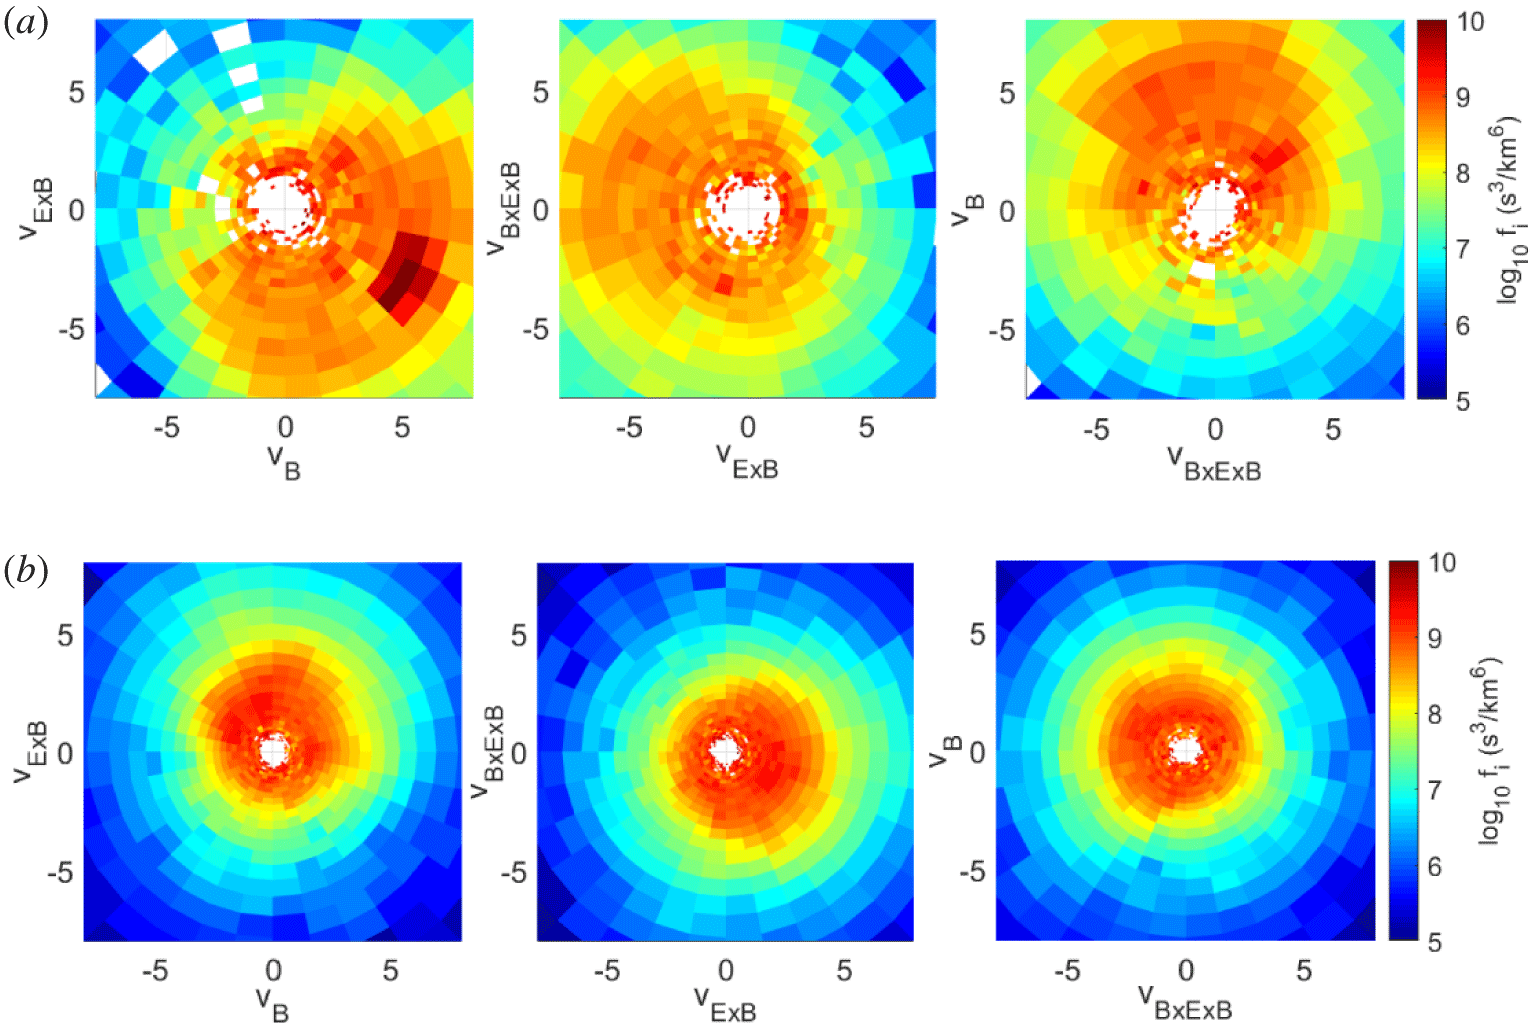
Figure 4 shows the ion VDFs, plotted in a reference frame with one direction aligned to  $\boldsymbol{B}$, one direction parallel to $\boldsymbol{E}\times \boldsymbol{B}$ and the third perpendicular to both. It is worth stressing that most of the ion VDFs are characterized by a beam-like distribution (mainly along $\boldsymbol{B}$), with the beam travelling at approximately $300~\text{km}~\text{s}^{-1}$, which is approximately $3$ times the local ion Alfvén speed (Yordanova et al. Reference Yordanova, Vörös, Varsani, Graham, Norgren, Khotyaintsev, Vaivads, Eriksson, Nakamura and Lindqvist2016; Sorriso-Valvo et al. Reference Sorriso-Valvo, Catapano, Retinò, Le Contel, Perrone, Roberts, Coburn, Panebianco, Valentini and Perri2019). Such a feature has frequently been found at the peaks of $\unicode[STIX]{x1D716}_{i}$ above the $1\unicode[STIX]{x1D70E}$ threshold. Figure 4 also shows the 2-D VDFs at a time during which $\unicode[STIX]{x1D716}_{i}$ is below the threshold (bottom panels). Within the interval, the shape changes abruptly (see also Servidio et al. Reference Servidio, Chasapis, Matthaeus, Perrone, Valentini, Parashar, Veltri, Gershman, Russell and Giles2017) to a more isotropic distribution. In the process of selecting ion VDFs at the peaks in $\unicode[STIX]{x1D716}_{i}$, we noticed that in several cases the ion VDFs are characterized by several ‘holes’ in different energy channels and lines of sight, due to the absence of detected particles. Such holes would artificially amplify a difference from a Maxwellian distribution. Therefore, we take a special care in our analysis and we compute the $\unicode[STIX]{x1D716}_{i}$ parameter (as defined in (2.1)), using those VDF bins where the ion VDF is fully defined. In order to strengthen our analysis, we have evaluated the propagation of the errors of the VDFs into $\unicode[STIX]{x1D716}_{i}$; we have now run a set of Monte Carlo simulations to obtain a statistical estimate. Considering one measured ion VDF (i.e. the observed values for each phase-space bin and its associated instrumental error), for each VDF phase-space bin we generated $10^{4}$ new values by adding to the data a Gaussian distributed error, whose variance is given by the instrumental error. For each of the $10^{4}$ newly generated VDFs, we have estimated the corresponding value of $\unicode[STIX]{x1D716}_{i}$. The resulting distribution of epsilon is roughly Gaussian, and its standard deviation can be considered as the propagated error on its estimate. We have repeated the Monte Carlo test using various VDFs with different values of $\unicode[STIX]{x1D716}_{i}$. The error found is always ${\leqslant}1\,\%$, and becomes negligible when epsilon is larger.
From top to bottom: magnetic field intensity; the electric field perpendicular to the local magnetic field direction (black line) along with the intensity of the  $\boldsymbol{V}_{i}\times \boldsymbol{B}$ (red line); the electric field component parallel to the local mean field; the ion vorticity; the agyrotropy as computed from (3.4); the derived time series of the $\unicode[STIX]{x1D716}_{i}$ parameter. The two vertical lines indicate (i) a region with $\unicode[STIX]{x1D716}_{i}$ above a $1\unicode[STIX]{x1D70E}$ threshold that corresponds also to enhancements in the perpendicular electric field and in the ion vorticity, and (ii) a region of very low $\unicode[STIX]{x1D716}_{i}$.
Two-dimensional VDF cuts in the two regions highlighted with vertical red dashed lines in figure 3. The top panels refer to a peak in  $\unicode[STIX]{x1D716}_{i}$, while the bottom panels to a valley in $\unicode[STIX]{x1D716}_{i}$. Notice the presence of a particle beam almost aligned with the $\boldsymbol{B}$ direction in the top panels. Velocity values are normalized to the local Alfvén speed.
3 Comparison between MMS1 data and HVM simulations
In order to investigate the properties of the regions of high deformation for the ion VDFs, we have compared the results coming from the MMS data with those obtained from a numerical simulation of decaying turbulence with a guide field for a collisionless plasma in a 2D-3V phase-space domain with the HVM code (Valentini et al. Reference Valentini, Trávníček, Califano, Hellinger and Mangeney2007; Perrone, Valentini & Veltri Reference Perrone, Valentini and Veltri2011). The code solves the Vlasov equation for the ion VDF, while the electrons are considered as an isothermal, massless fluid, and their contribution is taken into account through a generalized Ohm’s law that retains the Hall term and the electron pressure. The Vlasov equation and Ohm’s law are coupled with the Maxwell equations, where the displacement current is neglected. Quasi-neutrality is assumed. The dimensionless HVM equations can be read as
 $$\begin{eqnarray}\displaystyle & \displaystyle \frac{\unicode[STIX]{x2202}f}{\unicode[STIX]{x2202}t}+\boldsymbol{v}\boldsymbol{\cdot }\frac{\unicode[STIX]{x2202}f}{\unicode[STIX]{x2202}\boldsymbol{r}}+\left(\boldsymbol{E}+\boldsymbol{v}\times \boldsymbol{B}\right)\boldsymbol{\cdot }\frac{\unicode[STIX]{x2202}f}{\unicode[STIX]{x2202}\boldsymbol{v}}=0, & \displaystyle\end{eqnarray}$$
 $$\begin{eqnarray}\displaystyle & \displaystyle \boldsymbol{E}=-\boldsymbol{u}\times \boldsymbol{B}+\frac{1}{n}\;\;\boldsymbol{j}\times \boldsymbol{B}-\frac{1}{n}\unicode[STIX]{x1D735}p_{e}+\unicode[STIX]{x1D702}\,\boldsymbol{j}, & \displaystyle\end{eqnarray}$$
 $$\begin{eqnarray}\displaystyle & \displaystyle \frac{\unicode[STIX]{x2202}\boldsymbol{B}}{\unicode[STIX]{x2202}t}=-\unicode[STIX]{x1D735}\times \boldsymbol{E}, & \displaystyle\end{eqnarray}$$
 where  $f\equiv f(\boldsymbol{r},\boldsymbol{v},t)$ is the ion VDF, $\boldsymbol{E}(\boldsymbol{r},t)$ and $\boldsymbol{B}(\boldsymbol{r},t)$ are the electric and the magnetic field, respectively, and $\boldsymbol{j}=\unicode[STIX]{x1D735}\times \boldsymbol{B}$ is the total current density. The ion density, $n$, and the bulk velocity, $\boldsymbol{u}$, are evaluated as velocity moments of the ion VDF. In the above equations, time is scaled by the inverse proton-cyclotron frequency, $\unicode[STIX]{x1D6FA}_{ci}^{-1}$, velocity by the Alfvén speed, $v_{A}=B_{0}/\sqrt{4\unicode[STIX]{x03C0}n_{0}m_{i}}$, lengths by the ion skin depth, $d_{i}=v_{A}/\unicode[STIX]{x1D6FA}_{ci}$, and masses by the ion mass, $m_{i}$. In this paper, the ion distribution function studied from HVM simulations is actually the proton distribution function, so that hereafter, when referring to ions, we mean protons in the simulations. At $t=0$, the equilibrium consists of a homogeneous plasma embedded in a uniform background out-of-plane magnetic field, $\boldsymbol{B}_{0}$, along the $z$-direction. The ion VDF is initialized with a Maxwellian with homogeneous density. The system evolution is investigated in a double periodic domain $(x,y)$ perpendicular to $\boldsymbol{B}_{0}$. The equilibrium configuration is perturbed by a 2-D spectrum of Fourier modes (Servidio et al. Reference Servidio, Valentini, Califano and Veltri2012; Perrone et al. Reference Perrone, Valentini, Servidio, Dalena and Veltri2013; Valentini et al. Reference Valentini, Servidio, Perrone, Califano, Matthaeus and Veltri2014, Reference Valentini, Perrone, Stabile, Pezzi, Servidio, De Marco, Marcucci, Bruno, Lavraud and De Keyser2016). The root mean square of the magnetic perturbations is $\unicode[STIX]{x1D6FF}b/B_{0}\sim 0.3$ and neither density disturbances nor parallel fluctuations are imposed at $t=0$. The plasma $\unicode[STIX]{x1D6FD}=2v_{th,i}^{2}/v_{A}^{2}=0.5$, where $v_{th,i}=\sqrt{T_{i}/m_{i}}$ is the ion thermal speed. The ion-to-electron temperature ratio is $T_{i}/T_{e}=1$. Finally, the system size in the spatial domain is $L=2\unicode[STIX]{x03C0}\times 20d_{i}$ in both the $x$ and $y$ directions, discretized with $512^{2}$ grid points, while the 3-D velocity domain, limited by $\pm 5v_{th,i}$ in each direction, is discretized with a uniform grid of $71^{3}$ points.
Power spectral densities of the normalized electric (black lines) and magnetic (red lines) fluctuations in the MMS1 data set (a) and in the HVM simulation (b). Vertical dashed lines in both panels refer to the ion skin depth, with  $f_{di}=V/(2\unicode[STIX]{x03C0}d_{i})$.
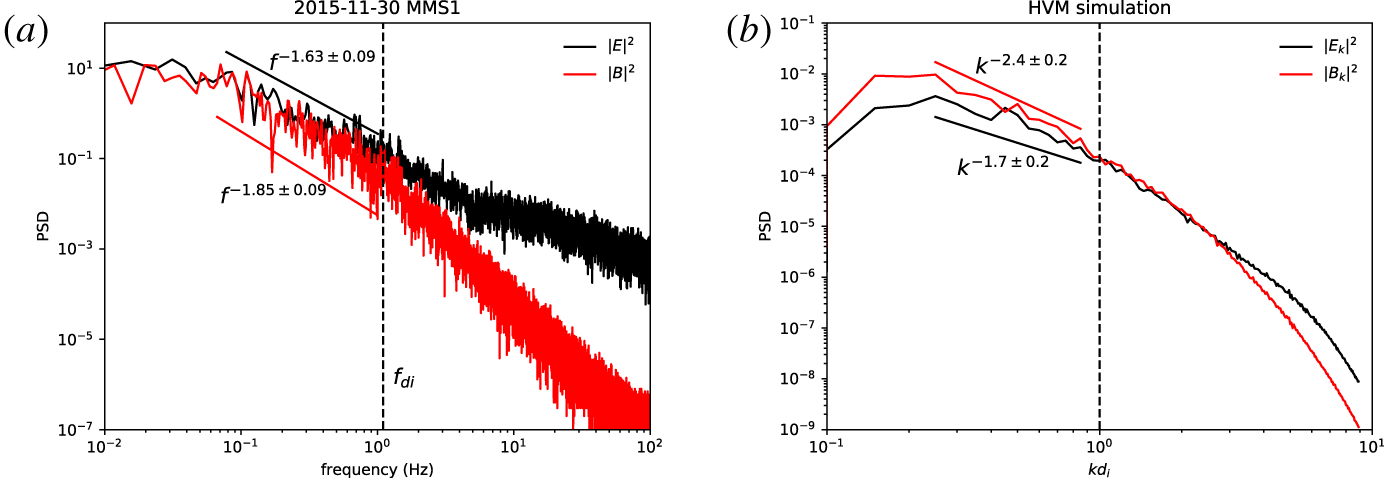
The omni-directional electric and magnetic field power spectral densities in the simulations are displayed in figure 5(b) at the maximum of the turbulent activity. At sub-ion scales, i.e. at scales smaller than the ion skin depth (vertical dashed line), turbulence becomes dominated by electric fluctuations, a well-known result reported in Bale et al. (Reference Bale, Kellogg, Mozer, Horbury and Reme2005), Schekochihin et al. (Reference Schekochihin, Cowley, Dorland, Hammett, Howes, Quataert and Tatsuno2009) and Matteini et al. (Reference Matteini, Alexandrova, Chen and Lacombe2017). The same trend has also been found in MMS1 data (see figure 5a), where the trace of the power spectral densities of the normalized electric ( $E^{2}/(v_{A}B_{0})^{2}$) and magnetic ( $(B/B_{0})^{2}$) fluctuations are shown. Indeed, at the frequency corresponding to the ion skin depth in the data interval (vertical dashed line in figure 5(a), assuming the Taylor hypothesis is fulfilled), normalized electric field fluctuations start to have a shallower power-law spectrum than that from the magnetic fluctuations. A similar result has previously been reported by Matteini et al. (Reference Matteini, Alexandrova, Chen and Lacombe2017), where the trend of the electric field power spectrum from ion to electron scales has been ascribed to non-ideal terms in the generalized Ohm’s law under the assumption of a dominance of highly oblique $\boldsymbol{k}$ vectors.
Same format as figure 3. The time series are measured along a one-dimensional cut in the HVM box. The vertical line indicates a region of high vorticity, large value of  $\unicode[STIX]{x1D716}_{p}$, high perpendicular electric field and large amplitude agyrotropy.

Figure 6 shows an overview of the numerical results, in the same format as figure 3. These physical quantities have been tracked along a one-dimensional cut of the 2-D spatial domain of the simulation, i.e. a diagonal path  $s$, normalized to $d_{i}$, that crosses the simulation box several times. In the simulation, as in the MMS data, protons are magnetized and $\unicode[STIX]{x1D716}_{p}$ is burst like. To make a comparison with the VDFs observed by MMS1, we have selected a small portion of the signal where peaks in $\unicode[STIX]{x1D716}_{p}$, $\unicode[STIX]{x1D714}$ and $E_{\bot }$ occur almost simultaneously (i.e. at $s/d_{i}=1324$, indicated by the vertical line in figure 6) and we have checked the shape of the ion VDF. In figure 7, we plot the 2-D cuts of the ion VDF, where the $v_{z}$ component is parallel to the background magnetic field direction. While in the plane perpendicular to $\boldsymbol{B}_{0}$ the VDF is almost isotropic, with a shift towards positive values of $v_{y}$ due to large scale fluctuations, in the other two planes a beam nearly aligned with $\boldsymbol{B}_{0}$ is evident, a feature similar to the one observed in figure 4(a). Thus, the high vorticity regions, with enhanced perpendicular electric fields, exhibit distorted ion VDFs with the formation of a beam travelling along $\boldsymbol{B}_{0}$ at almost the Alfvén speed (Sorriso-Valvo et al. Reference Sorriso-Valvo, Catapano, Retinò, Le Contel, Perrone, Roberts, Coburn, Panebianco, Valentini and Perri2019).
Two-dimensional VDF cuts in the portion of the signal highlighted in figure 6 by the vertical dashed line. A beam almost aligned with the  $\boldsymbol{B}_{0}$ direction is clearly visible.

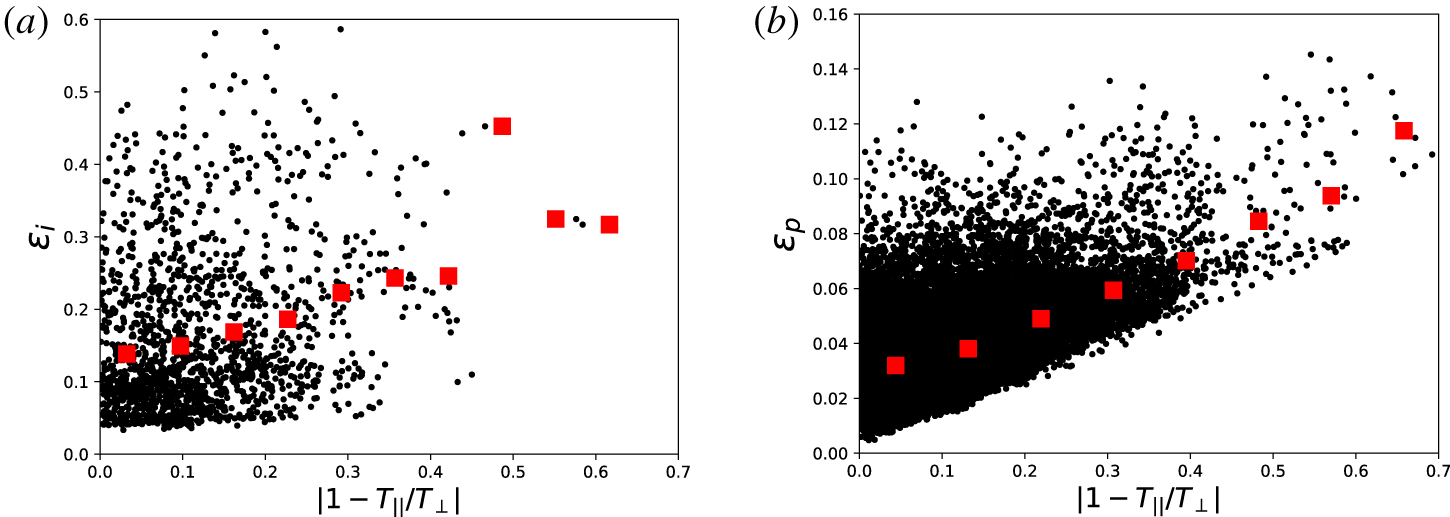
The  $\unicode[STIX]{x1D716}_{i}$ parameter as a function of the magnitude of the electric field in the plasma frame in the MMS data (a), and in the HVM simulation (b). The electric field data in the magnetosheath have been averaged out to 0.15 s resolution. Red squares report the mean values of $\unicode[STIX]{x1D716}_{i}$ within bins of $|E^{\prime }|$.

Correlation coefficients and associated  $p$-values between the $\unicode[STIX]{x1D716}_{i}$ parameter and plasma quantities in MMS data sets and in HVM simulation.

As noticed in figure 3, the time series of the  $\unicode[STIX]{x1D716}_{i}$ parameter computed with the MMS1 data has some features that can also be recognized in the time series of other quantities, such as the perpendicular component of the electric field. In order to highlight such similarities, we have generated scatter plots of $\unicode[STIX]{x1D716}_{i}$ as a function of different quantities, in order to investigate the physical quantities that might correlate with distortions in the ion VDFs (both in the data and in the simulations). A summary of the values of the correlation coefficient can be found in table 1 for both data sets and the HVM simulation. Figure 8 shows the scatter plots of $\unicode[STIX]{x1D716}_{i}$ versus the intensity of the electric field in the plasma frame, namely $\boldsymbol{E}^{\prime }=\boldsymbol{E}+(\boldsymbol{V}_{i}\times \boldsymbol{B})$ degraded to 0.15 s resolution in the magnetosheath interval (a) and in the HVM simulation (b). The Pearson correlation coefficient reported in table 1 indicates a strong degree of correlation in the MMS1 data set. Since the region is highly turbulent, fields and plasma quantities display considerable fluctuation, giving rise to a certain degree of dispersion in the scatter plots. Thus, we have overplotted the $\unicode[STIX]{x1D716}_{i}$ parameter mean values within bins of the electric field (red squares in figure 8). This procedure highlights the correlation between the two quantities and also in figure 8(b) a certain degree of linear correlation can be noted. Besides the strong correlation with the intensity of the electric field, the $\unicode[STIX]{x1D716}_{i}$ parameter tends to be also linearly correlated with magnetic field fluctuations $\unicode[STIX]{x1D6FF}B/B_{0}$ (see figure 9) both in the data and in the simulation. On the other hand, figure 10 displays a scatter plot of $\unicode[STIX]{x1D716}_{i}$ with the magnitude of the current density (see § 2) for the magnetosheath data (a) and for the HVM simulation (b). The Pearson correlation is ${\leqslant}0.2$ in both cases and very weak correlation can be noticed from observing the average $\unicode[STIX]{x1D716}_{i}$ values (red squares). Notice that Valentini et al. (Reference Valentini, Perrone, Stabile, Pezzi, Servidio, De Marco, Marcucci, Bruno, Lavraud and De Keyser2016) have pointed out that in the simulations the deviation from the Maxwellian equilibrium is non-homogeneous in space and tends to be maximized around (but not exactly at) the peaks of the current density that naturally form at the interfaces of magnetic flux tubes. Thus, the good comparison between data and simulation in figure 10 suggests that a similar scenario can be envisaged in the turbulent magnetosheath interval. Besides the current density, the correlation between the ion vorticity, as computed with a multi-spacecraft technique in the MMS data (see § 2), and $\unicode[STIX]{x1D716}_{i}$ has been studied both in the data and in the simulation. The scatter plots are given in figure 11. In such a case, the correlation in the data is poor ( $0.17$) although the average of $\unicode[STIX]{x1D716}_{i}$ in bins of $|\unicode[STIX]{x1D714}_{i}|$ shows a certain linear correlation, while a weak correlation between the two quantities is observed in the HVM simulations, where the formation of vortices tends to distort the ion VDFs. There is also a poor correlation between $\unicode[STIX]{x1D716}_{i}$ and the temperature anisotropy in the data and a moderate correlation in the simulation, as shown in figure 12 and in table 1, which suggests that distortions in the ion VDFs cannot be ascribed only to an anisotropic modification of the core.
Same format as figure 8 for the  $\unicode[STIX]{x1D716}_{i}$ parameter as a function of the magnetic field fluctuations. Notice the good correlation both in the MMS data and in the numerical experiment.

Same as figure 8 for the  $\unicode[STIX]{x1D716}_{i}$ parameter as a function of the current density magnitude.

Same format as figure 8 for the  $\unicode[STIX]{x1D716}_{i}$ parameter as a function of the magnitude of the ion vorticity.

Same as figure 8 for the  $\unicode[STIX]{x1D716}_{i}$ parameter as a function of the temperature anisotropy.
Same format as figure 8 for the  $\unicode[STIX]{x1D716}_{i}$ parameter as a function of the agyrotropy of the pressure tensor (see text).

The turbulent activity produces distortions of the VDFs that are much more complex than the generation of temperature anisotropy, thus hiding the natural correlation between  $\unicode[STIX]{x1D716}_{i}$ and $T_{\Vert }/T_{\bot }$. Furthermore, the ion agyrotropy of the pressure tensor, namely the departure of the pressure tensor from cylindrical symmetry about the local mean field, has been calculated by using the expression given in Swisdak (Reference Swisdak2016)
 $$\begin{eqnarray}Q=1-\frac{4l_{2}}{(l_{1}-\unicode[STIX]{x1D617}_{||})(l_{1}+3\unicode[STIX]{x1D617}_{||})},\end{eqnarray}$$
 where  $\unicode[STIX]{x1D617}_{||}=b_{x}^{2}P_{xx}+b_{y}^{2}P_{yy}+b_{z}^{2}P_{zz}+2(b_{x}b_{y}P_{xy}+b_{x}b_{z}P_{xz}+b_{y}b_{z}P_{yz})$, $l_{1}$ is the trace of the pressure tensor and $l_{2}=P_{xx}P_{yy}+P_{xx}P_{zz}+P_{yy}P_{zz}-(P_{xy}P_{yx}+P_{xz}P_{zx}+P_{yz}P_{zy})$. The correlation with $\unicode[STIX]{x1D716}_{i}$ is plotted in figure 13 and, by definition, $Q=0$ indicates gyrotropy. In the HVM simulation, the agyrotropy of the ion pressure tensor is moderately correlated with the deviation from Maxwellian. Thus, highly distorted ion VDFs have a probability of being associated with large agyrotropy. This is not really surprising since the latter can be seen as a deviation from Maxwellian. On the other hand, the correlation in the MMS1 data (figure 13a) is weaker than the one observed in the simulations, thus indicating that $Q$ is not a good quantity to interpret large amplitude peaks in $\unicode[STIX]{x1D716}_{i}$.
Finally, the degree of correlation between  $\unicode[STIX]{x1D716}_{i}$ and the plasma $\unicode[STIX]{x1D6FD}$ in the MMS1 data set has been studied. The plasma $\unicode[STIX]{x1D6FD}$ varies over a broad range of values and tends to be greater than $1$. Thus, we have reported in figure 14 the scatter plot in log–log axes between $\unicode[STIX]{x1D716}_{i}$ and $\unicode[STIX]{x1D6FD}$: good anticorrelation can be recognized (with a Spearman correlation coefficient of ${\sim}-0.6$). The largest deviations from a Maxwellian cluster around $\unicode[STIX]{x1D6FD}<3$, that is when the thermal speed of the ions tends to be of the same order as the Alfvén speed. In such a case, all the fluctuations that propagate at phase speed $v_{\unicode[STIX]{x1D719}}$ of the order of $v_{A}$ resonate efficiently with particles in the bulk of the ion VDFs, which have speed ${\sim}v_{th,i}$, this producing distortions in the distribution function and exciting nonlinear electrostatic waves (see Valentini et al. Reference Valentini, Califano, Perrone, Pegoraro and Veltri2011, Sorriso-Valvo et al. Reference Sorriso-Valvo, Catapano, Retinò, Le Contel, Perrone, Roberts, Coburn, Panebianco, Valentini and Perri2019). Notice that Sorriso-Valvo et al. (Reference Sorriso-Valvo, Catapano, Retinò, Le Contel, Perrone, Roberts, Coburn, Panebianco, Valentini and Perri2019) have found the formation of beams in the ion VDFs during intervals of high-frequency electrostatic activity, by means of the formation of bumps in the power spectral density of the parallel electric field.
Scatter plot in log–log axes of the  $\unicode[STIX]{x1D716}_{i}$ parameter as a function of the plasma $\unicode[STIX]{x1D6FD}$ in the MMS1 data set. A clear anticorrelation (computed using the Spearman correlation) has been found.

4 Discussion
The highly turbulent medium downstream of the quasi-parallel bow shock, as observed by the MMS spacecraft, shows bursty behaviour in both magnetic field and plasma data. The parameter  $\unicode[STIX]{x1D716}_{i}$, which quantifies the degree of deviation of the ion VDFs from a Maxwellian shape, has been computed throughout the 5 min interval analysed, showing again high variability, with regions of strong departure of the VDFs from thermodynamic equilibrium. Such a great variability makes the analysis of the correlation between $\unicode[STIX]{x1D716}_{i}$ and physical quantities, such as temperature anisotropy, current density, ion vorticity, very complex. A comparison between MMS1 data and results coming from a HVM simulation has been performed and will be discussed in the following. Similar results (see table 1) have also been found in a MMS data set on 8 September 2015, when the spacecraft was located in the dusk-side magnetopause, moving towards the magnetosheath (Stawarz et al. Reference Stawarz, Eriksson, Wilder, Ergun, Schwartz, Pouquet, Burch, Giles, Khotyaintsev and Le Contel2016; Sorriso-Valvo et al. Reference Sorriso-Valvo, Catapano, Retinò, Le Contel, Perrone, Roberts, Coburn, Panebianco, Valentini and Perri2019), suggesting that our interpretation might be extended to different samples of near-Earth plasmas, at least for periods of high electrostatic activity in the plasma (Sorriso-Valvo et al. Reference Sorriso-Valvo, Catapano, Retinò, Le Contel, Perrone, Roberts, Coburn, Panebianco, Valentini and Perri2019). It has to be noted that in the magnetopause data set no correlation between $\unicode[STIX]{x1D716}_{i}$ and $\unicode[STIX]{x1D6FF}B/B_{0}$ has been found. Indeed, at variance with the turbulent magnetosheath interval, the level of magnetic field fluctuation is much lower (typically $0.2$, see figure 1 in Stawarz et al. (Reference Stawarz, Eriksson, Wilder, Ergun, Schwartz, Pouquet, Burch, Giles, Khotyaintsev and Le Contel2016)), so that the magnetic field activity is very different from the event reported in figure 1. In the magnetopause crossing interval the plasma $\unicode[STIX]{x1D6FD}$ is $\unicode[STIX]{x1D6FD}\leqslant 2$, which reflects the presence of a pretty stable high amplitude magnetic field. Thus, both in the numerical experiment (for the geometry itself of the simulation) and within the magnetopause crossing the lower correlation between $\unicode[STIX]{x1D716}_{i}$ and the electric field can be ascribed to the presence of a uniform background magnetic field. The turbulent magnetosheath interval shows higher variability in the plasma quantities than the one from HVM simulations, which mimics typical solar wind turbulence conditions (i.e. $\unicode[STIX]{x1D6FD}\sim 0.5$ and $\unicode[STIX]{x1D6FF}B/B_{0}<1$). This reflects a general reduction of the degree of correlation between $\unicode[STIX]{x1D716}_{i}$ and the plasma quantities in the magnetosheath interval (and also in the magnetopause sample).
The comparison between in situ measurements and numerical results highlights a low degree of correlation between peaks in the  $\unicode[STIX]{x1D716}_{i}$ (high deviation from a Maxwellian shape) and the presence of high current density (thin current sheets) regions. These results are in agreement with previous numerical studies (Valentini et al. Reference Valentini, Perrone, Stabile, Pezzi, Servidio, De Marco, Marcucci, Bruno, Lavraud and De Keyser2016), where non-Maxwellianity is observed around the peaks of the current, but not exactly at that points, owing to a spatial shift between the presence of a current sheet (or an intermittent structure in general) and the response of the VDF to that structure.
However, if for ions the presence of localized regions of high current density and strong energy dissipation weakly influences the shape of the particle distribution functions (already observed in previous numerical studies (Valentini et al. Reference Valentini, Perrone, Stabile, Pezzi, Servidio, De Marco, Marcucci, Bruno, Lavraud and De Keyser2016; Sorriso-Valvo et al. Reference Sorriso-Valvo, Perrone, Pezzi, Valentini, Servidio, Zouganelis and Veltri2018b)), this is not the case for the electrons. Recently, in fact, Chasapis et al. (Reference Chasapis, Matthaeus, Parashar, Wan, Haggerty, Pollock, Giles, Paterson, Dorelli and Gershman2018) have shown a strong parallel electron heating at regions of high current density also associated with distortion of the electron VDFs, suggesting that physical mechanisms related to both heating and VDF modifications close to intermittent structures are more important for electrons than for ions.
On the other hand, we found correlation of  $\unicode[STIX]{x1D716}_{i}$ with the magnitude of the electric field, suggesting an important role of the electrostatic fluctuations in the plasma behaviour. In the magnetosheath interval, there is a clear tendency to develop non-Maxwellian features within regions with $\unicode[STIX]{x1D6FD}\sim 1$ (a strong anticorrelation has been found in both the MMS data sets analysed), where the interaction between the bulk of the ion VDFs, propagating at $v_{th,i}$, and the fluctuations, propagating at phase speed $v_{\unicode[STIX]{x1D719}}=v_{A}$, is maximized, and close to strong bursts of perpendicular electric field, with ions highly magnetized (see also the supplemental material of Sorriso-Valvo et al. (Reference Sorriso-Valvo, Catapano, Retinò, Le Contel, Perrone, Roberts, Coburn, Panebianco, Valentini and Perri2019)). The observed deviations are mainly due to the development of beams along the local mean field direction (see figure 4a). Thus, the strong correlation between $\unicode[STIX]{x1D716}_{i}$ and the electric field intensity in the MMS data opens the possibility for the generation of electrostatic waves via a resonant interaction between ions and Alfvénic fluctuations (Valentini et al. Reference Valentini, Califano, Perrone, Pegoraro and Veltri2011, Reference Valentini, Servidio, Perrone, Califano, Matthaeus and Veltri2014), propagating along the mean magnetic field, at sub-ion scales, causing an efficient transfer of energy towards the electron scales (see also Sorriso-Valvo et al. (Reference Sorriso-Valvo, Catapano, Retinò, Le Contel, Perrone, Roberts, Coburn, Panebianco, Valentini and Perri2019)). In the magnetopause crossing interval, due to the presence of a pretty stable high magnetic field, the plasma $\unicode[STIX]{x1D6FD}$ tends to be $\unicode[STIX]{x1D6FD}<1$; however, the correlation between $\unicode[STIX]{x1D716}_{i}$ and $\unicode[STIX]{x1D6FD}$ remains good, opening the question as to which mechanism is responsible for the distortion of the ion VDFs in a highly magnetized plasma. Notice that, also in such a different plasma sample, the correlation between $\unicode[STIX]{x1D716}_{i}$ and the electric field is much better than the other explored plasma parameters. We plan to defer to an upcoming study a more in depth analysis of the possible influence of electrostatic waves, such as the ion bulk waves (Valentini et al. Reference Valentini, Califano, Perrone, Pegoraro and Veltri2011), on the formation of beams in the ion VDFs.
Acknowledgements
This work has received funding from the European Unions Horizon 2020 research and innovation programme under grant agreement no. 776262 (AIDA, www.aida-space.eu). E.Y. was supported by the Swedish Civil Contingencies Agency, grant 2016-2102. D.P. was partially supported by STFC grant ST/N000692/1.


