

Diabetes mellitus is a complex metabolic disorder characterised by chronic hyperglycaemia resulting from defects in insulin secretion (insulin deficiency), insulin action (skeletal muscle, liver and/or adipose tissue resistance to insulin) or both. Type 2 diabetes represents about 90 % of diabetes cases; although traditionally considered a disease of adults, it is increasingly diagnosed in children in parallel with rising obesity rates. Insulin resistance is clinically defined as the inability of a known quantity of exogenous or endogenous insulin to increase glucose uptake and utilisation in an individual as much as it does in a normal population( Reference Lebovitz 1 ). Insulin resistance being the first committed step in the development of type 2 diabetes, the use of insulin-sensitising agents should prevent or delay pancreas failure and consecutive type 2 diabetes development.
Inositol, formerly referred to as vitamin B7, is a cyclitol naturally occurring in nature and foodstuffs. Inositol exists under nine distinct stereoisomers (named allo-, d-chiro-, l-chiro-, cis-, epi-, muco-, myo-, neo- and scyllo-inositol) through epimerisation in hydroxyl group configuration. Several inositol isomers (e.g. d-chiro- and myo-inositol) and derivatives (e.g. d-pinitol and sequoyitol) have shown insulin mimetic properties such as lowering postprandial blood glucose level and stimulating glucose uptake by muscle cells when given acutely in different animal models( Reference Ortmeyer, Larner and Hansen 2 – Reference Shen, Shao and Cho 5 ). myo-Inositol is by far the most abundant isomeric form of inositol in living cells and in foodstuffs, making this isomer as one of the best candidate for a nutritional strategy. We recently reported its insulin-sensitising potential in chronic treatment in mice( Reference Croze, Vella and Pillon 6 ). Interestingly, this insulin-sensitising effect has been associated with a substantial reduction in fat accretion, and a good correlation between insulin sensitivity and white adipose tissue (WAT) mass has been observed. As the risk of diabetes is reportedly increased by 7·3 % upon each kg of weight gained in humans( Reference Koh-Banerjee, Wang and Hu 7 ), reducing fat accretion constitutes a valuable strategy to improve insulin sensitivity and control diabetes. Hence, a first aim of the present study was to evaluate the ability of a dietary myo-inositol supplementation to prevent or delay insulin resistance development and fat accretion in a diet-induced obesity (DIO) mouse model: the C57BL/6 male mouse fed a high-fat diet (HFD). This DIO mouse model has been chosen because it is more representative of the human form of the metabolic syndrome than are genetic mouse models of obesity and/or diabetes( Reference Panchal and Brown 8 ).
In addition, some abnormalities in inositol metabolism have been observed in several diabetic subjects and would be associated with hyperglycaemia and/or insulin resistance (for a review, see Croze & Soulage( Reference Croze and Soulage 9 )). These abnormalities include (1) an excessive urinary excretion of inositol (i.e. inosituria)( Reference Kennington, Hill and Craig 10 – Reference Larner, Brautigan and Thorner 12 ); (2) an intracellular myo-inositol depletion in some tissues, in particular, in tissues susceptible of developing diabetes complications( Reference Winegrad 13 ) (e.g. kidneys, nerves, retina and lens); and (3) a decreased d-chiro-inositol: myo-inositol ratio in some insulin target tissues (e.g. skeletal muscles) and urine( Reference Sun, Heimark and Nguygen 11 , Reference Asplin, Galasko and Larner 14 ). To the best of our knowledge, there are no data in the literature regarding the presence of such anomalies in a diet-induced rodent model of insulin resistance. We then tested the presence of inosituria and/or inositol depletion in C57BL/6 mouse fed a HFD for 1 or 4 months. Little is known about the consequences of such metabolic alterations; however, given the important role of myo-inositol in cells as precursor of phosphatidylinositol and its derived secondary messengers (in particular phosphatidylinositol 4,5-bisphosphate/phosphatidylinositol (3,4,5)-trisphosphate (PIP2/PIP3) and inositol-1,4,5-trisphosphate (IP3)), it can be expected that inositol intra-tissue depletion has deleterious consequences that should be prevented or fought. Noteworthy, it has been suggested that inositol intra-tissue depletion could contribute to the progression or development of some diabetes microvascular complications such as neuropathy, nephropathy or cataract. Therefore, the present study also aimed to test the capability of a dietary myo-inositol supplementation to prevent inositol intra-tissue depletion associated with hyperglycaemia and/or insulin resistance.
Materials and methods
Chemicals and antibodies
myo-Inositol was purchased from Sigma Aldrich, and recombinant human insulin (100 IU/ml (3·5 mg/ml); Actrapid®) was from Novo Nordisk. Other chemicals were obtained from Sigma Aldrich when no other origin is specified.
Animals
All experiments were carried out according to the guidelines laid down by the French Ministère de l'Agriculture (no. 87-848) and the European Union Council Directive for the Care and Use of Laboratory Animals of 24 November 1986 (86/609/EEC). Animal experiments were performed under the authorisation no. 69-266-0501 (INSA-Lyon, DDPP-SV, Direction Départementale de la Protection des Populations – Services Vétérinaires du Rhône), according to the guidelines laid down by the French Ministère de l'Agriculture (no. 87-848) and the European Union Council Directive for the Care and Use of Laboratory Animals of 24 November 1986 (86/609/EEC). MLC (no. 692661241), AG (no. 69266332) and COS (no. 69266257) hold special licenses to experiment on living vertebrates issued by the French Ministry of Agriculture and Veterinary Service Department.
Male C57Bl/6 JRj mice (15–20 g) were purchased from Janvier-Labs SA and housed in an air-conditioned room with a controlled environment of 21 ± 0·5°C and a humidity of 40–70 %, under a 12 h light–12 h dark cycle (lights on from 07.00 to 19.00 hours) with free access to food (chow diet: 12·6 kJ/g 2016C, Harlan Teklad; for composition and vitamin and mineral content, see Table 1 and online Supplementary Table S1) and water.
Diet composition*

* Mean composition of the standard and high-fat diets from Harlan Laboratories, Inc. Data were obtained from Harlan Laboratories, Inc.
† Available carbohydrates only.
‡ Note that energy density is calculated from ingredient analysis or manufacturer data.
Diet and myo-inositol supplementation
Mice (n 10 per group) were randomly assigned to be either under standard diet (control group with chow diet – C) or under HFD with (HF-MI) or without (HF) myo-inositol supplementation (0·58 mg/g body weight (BW)) in drinking-water for 4 months. The myo-inositol (MI) dose was chosen to mimic the effect of the maximal dose tested and tolerated in human clinical trials (i.e. 20 g/d; indeed, only mild side effects such as nausea, flatus or mild insomnia were reported at doses up to 12–20 g/d and mild grade 1 gastrointestinal symptoms were observed at a dose of 34 g/d)( Reference Lam, McWilliams and LeRiche 15 , Reference Carlomagno and Unfer 16 ). In the HF and HF-MI groups, the chow diet (2016C; Harlan) was replaced by the HFD (TD.06 414, Research diets; Harlan Laboratories, Inc.; for composition, see Table 1 and online Supplementary Table S1) when mice were about 25 g (i.e. 3 weeks after randomisation). At the same time, myo-inositol was added to drinking-water (6 g/l) in the HF-MI group. HFD and myo-inositol supplement were given for 4 months. Food intake and BW were measured twice weekly. Food consumption was calculated as the difference between the amount given and that removed from the cage. Water consumption was measured to calculate daily intake of myo-inositol.
Insulin tolerance test
Insulin tolerance test (ITT) was performed after 80 d of HFD feeding with or without myo-inositol supplementation. After an overnight fast, animals were injected intraperitoneally with 0·5 IU/kg BW (17·5 μg/kg BW) of recombinant human insulin. Blood glucose was measured before and 15, 30 and 60 min after insulin injection. The glucose disappearance rate for ITT (K ITT; %/min) was calculated using the formula given by Lundbaek( Reference Lundbaek 17 ): K ITT= 0·693 × 100/t 1/2 where t 1/2 was calculated from the slope of the plasma glucose concentration, considering an exponential decrement of glucose concentration during the 30 min after insulin administration.
Urine collection
24 h-diuresis was collected after 1 month of standard or HFD feeding in polycarbonate metabolic cages (Charles River Laboratory). During urine collection, animals were given free access to food and water. The volume of each 24 h urine sample was measured gravimetrically. Urine samples were centrifuged for 10 min at 3000 g to discard cells and insoluble materials, and aliquots of supernatant were removed and stored at − 80°C until analysis.
Sacrifice and tissue dissection
Animals were deeply anaesthetised with pentobarbital (60 mg/kg intraperitoneal). BW and length were measured. Terminal cardiac blood (750 μl) punctures were realised on heparinised tube and blood was centrifuged for 2 min at 3500 g to prepare plasma. Plasma samples were aliquoted, snap frozen in liquid N2 and stored at − 80°C until analysis. Liver, heart, kidneys, gastrocnemius muscles, epididymal, retroperitoneal and subcutaneous inguinal WAT were dissected out according to anatomical landmarks, weighed to the nearest mg, snap frozen in liquid N2 and stored at − 80°C. Pieces of liver were fixed into paraformaldehyde for histological sections and 30–40 mg of retroperitoneal WAT were fixed in osmium tetroxide for measurement of adipose cell size as described below.
Liver histopathological study
Liver slices were fixed in 10 % (w/v) formalin solution for at least 24 h. Fixed tissues were then embedded in paraffin, and 5–6 μm sections were realised with a microtome and stained with haematoxylin and eosin. Non-alcoholic steatohepatitis was assessed under a light microscope (Zeiss).
Cellularity of retroperitoneal white adipose tissue: measurement of adipocyte sizes and numbers
Preparation of adipose tissue for the determination of cell size was performed essentially as described by Etherton et al. ( Reference Etherton, Thompson and Allen 18 ). Briefly, 30–40 mg of retroperitoneal WAT were immediately fixed in osmium tetroxide, and incubated at room temperature for 96 h. Samples were washed with saline for 24 h, then the saline was replaced by 10 ml of 8 m-urea for 72 h with occasional swirling to liberate the cells. Samples were then washed with 0·01 % Triton X-100 (v/v) in NaCl buffer. Before analysis, supernatant was discarded and cells were resuspended in glycerol. Cells were then diluted. The adipocyte size distribution was determined using a Beckman Coulter Counter Multisizer IV with a 400 μm aperture and from the measurement of at least 10 000 cell diameters per animal (mean of 22 000 (sem 1800) cell diameters measured per animal). DNA content in retroperitoneal WAT pads was measured, after delipidation of the samples with hexane, by a standard fluorimetric method using bisbenzimide and calf thymus DNA as standard( Reference Labarca and Paigen 19 ).
Fatty acid synthase assay
WAT (30–50 mg) was homogenised in 1 ml of ice-cold sucrose buffer (0·25 m-sucrose, 1 mm-dithiothreitol (DTT), 1 mm-EDTA and a mixture of protease inhibitors), pH 7·4. Homogenates were centrifuged at 105 000 g (0°C) for 60 min, fat cake was discarded, and the clear infranatant was aliquoted and freezed at − 20°C for the determination of fatty acid synthase (FAS) activity. FAS activity was measured spectrophotometrically by monitoring the oxidation of NADPH at 340 nm as described by Bazin & Ferré( Reference Bazin and Ferré 20 ). Briefly, 100 μl of infranatant were mixed with 700 μl of 100 mm-potassium phosphate buffer (pH 6·5) containing 200 μm-NADPH and 100 μm-acetyl-CoA. Absorbance at 340 nm was monitored in a heated chamber spectrophotometer at 37°C for 3 min to measure background NADPH oxidation. The reaction was started with 100 μl of 100 mm-potassium phosphate buffer (pH 6·5) containing 600 μm-malonyl-CoA, and reaction was assayed for 5 min at 37°C to determine the FAS-dependent oxidation of NADPH (molar extinction coefficient of NADPH at 340 nm: ɛ = 6220 m/cm). Results are expressed as nmol NADPH oxidised per min per mg of tissue.
White adipose tissue gene expression by quantitative PCR
Total RNA from epididymal WAT samples (80–150 mg) were extracted using TRI Reagent (Sigma Aldrich). Total RNA quantities and qualities were assessed using the Agilent 2100 Bioanalyzer and the RNA 6000 LabChip Kit (Agilent Technologies). Reverse transcriptions (RNAse H, Takara enzyme) were performed on 1 μg of total RNA. Real-time PCR assays for acetyl coenzyme A carboxylase (Acc), fatty acid synthase (Fas), Adiponectin, Leptin, Glut-4, sterol regulatory element-binding protein (Srebp)1a, Srebp1c and TATA box binding protein (tbp) genes were performed using a Rotor-Gene™ 6000 (Qiagen). Values were normalised to tbp gene expression. The full list of genes and corresponding primer sequences is shown in online Supplementary Table S2.
myo-Inositol oxygenase assay
Kidneys were homogenised in a lysis buffer (1 mg/10 μl) containing 20 mm-sodium acetate, 1 mm-FeSO4, 2 mm-l-cysteine, 1 mm-glutathione and 1 × inhibitor cocktail, pH 6·0, followed by a brief sonication. Lysates were then centrifuged for 30 min at 13 000 g , 4°C. Supernatant (100 μl) was added to 900 μl of myo-inositol oxygenase (MIOX) reaction buffer (50 mm-sodium acetate, 2 mm-cysteine, 1 mm-FeSO4 and 60 mm-myo-inositol, pH 6·0), and MIOX assays were then performed at 30°C for 30 min. MIOX reaction was terminated by incubating samples in boiling water for 5 min. Samples were then centrifuged for 10 min at 12 000 g , 4°C to remove precipitates. The d-glucuronate formed from MI by MIOX reaction was then determined in the supernatant by the orcinol assay. Briefly, a double volume of freshly prepared orcinol reagent (28 mm-orcinol and 3 mm-FeCl3 dissolved in 12-M HCl) was added to the supernatant (and to standard solutions of d-glucuronic acid) and incubated in boiling water for 30 min. Reaction was stopped by incubation on ice, 5 min. Colorimetric readings were made at 670 nm. For each sample, a negative control was prepared following the same procedure; however, negative samples were boiled directly 5 min before MIOX reaction (i.e. just after addition of the lysate supernatant to the MIOX reaction buffer and so before reaction at 30°C). MIOX activity of the sample was then expressed as the quantity of d-glucuronic acid formed during the 30 min of reaction (calculated from the difference between the sample and its negative control) per mg of kidneys.
myo-Inositol measurement in urine and tissues
myo-Inositol was determined by the GC method described by Kawa et al. ( Reference Kawa, Taylor and Przybylski 21 ). Briefly, one volume of ethanol was added to an equal volume of urine. Samples were vortexed and evaporated to dryness under N at 40°C. For the determination of free myo-inositol, tissues were deproteinised with an equal amount of 0·15 M-Ba(OH)2 and 0·3 M-ZnSO4 and centrifuged and the supernatant was evaporated to dryness. Dried samples were sonicated for 5 min with 1 ml of trimethylsilylimidazole–pyridine (1:1, v/v) containing 200 μg of phenyl-α-d-glucoside as an internal standard, and were derivatised for 1 h at 80°C. Derivatised samples or standards (2 μl) were injected into a gas chromatograph (Shimadzu) equipped with a flame ionisation detector and split injector. Inositols were separated on a silica capillary SP-2380 column (60 m × 0·22 mm). Column temperature was programmed from 150 to 200°C at the rate of 3°C/min, and then to 325°C at the rate of 7°C/min. Initial and final temperatures were held for 5 and 20 min, respectively. The injector and detector temperatures were held at 270 and 350°C, respectively. The carrier gas was H at 1·5 ml/min, and the split ratio used was 1:40.
Biochemical measurements
Fasting and non-fasting blood glucose levels were measured with a glucometer (Accu Check Performa; Roche Diagnostics). The plasma insulin (mouse/rat insulin no. EZRMI-13K; Merck Millipore), leptin and adiponectin (rat/mouse leptin no. A05176 and mouse adiponectin no. A05187; SPI-Bio) levels were determined with mouse enzyme immunoassay (EIA) kits according to the manufacturer's instructions. The detection limits were 0·1 ng/ml for adiponectin, 50 pg/ml for leptin and 0·2 ng/ml for insulin immunoassays. Inter-assay coefficients were 3·9, 8·5 and 8·2 % for adiponectin, leptin and insulin immunoassays, respectively. The homeostasis model assessment of insulin resistance (HOMA-IR) was calculated using glucose and insulin concentrations obtained after 16 h of food withdrawal, using the following formula:
 $$\begin{eqnarray} fasting\,blood\,glucose\,(mmol/l)\times fasting\,insulin\,(\mu U/ml)/22\cdot 5. \end{eqnarray}$$
Plasma total cholesterol, TAG, NEFA and urea levels were measured with the following commercial kits, cholesterol RTU (bioMérieux), TAG PAP (bioMérieux), NEFA-C (WAKO; Sobioda) and according to the manufacturer's recommendations. All assays were performed at least in duplicates. The muscle and hepatic lipids were extracted according to the procedure of Folch et al. ( Reference Folch, Lees and Sloane Stanley 22 ) using chloroform–methanol (2:1, v/v) and total lipid content was measured gravimetrically.
Statistical analyses
Data are expressed as means with their standard errors. All data were analysed using GraphPad Prism version 5.0 software (GraphPad Software) and Statview 4.5 (Abacus Concepts, Inc.). Multiple comparisons were performed using ANOVA followed when appropriate by post hoc Fisher protected least significant difference (PLSD) tests. Simple comparisons were performed using Student's t test. When appropriate, Welch's correction for inequality of variances was applied. Differences were considered significant at the P< 0·05 level.
Results
Altered inositol metabolism in high-fat diet-fed mice
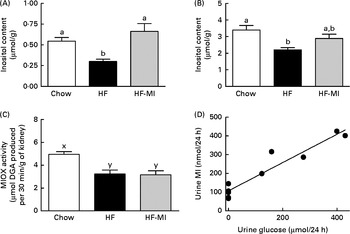
Insulin resistance and hyperglycaemia are reported to be associated with increased myo-inositol urinary excretion (often referred to as inosituria) and inositol intra-tissue depletion( Reference Croze and Soulage 9 , Reference Nayak, Kondeti and Xie 23 ). We thus measured urinary excretion, intracellular content of inositol in kidneys and liver after 1 or 4 months of normal or diabetogenic (HF) diet. HFD feeding for 1 month induced striking glycosuria (P= 0·011) and inosituria (3·9 folds, P= 0·006; Table 2). The myo-inositol urinary excretion was strongly correlated with the glucose urinary excretion as shown in Fig. 1(D). No significant difference was found in creatinine urine level between chow diet-fed mice and HFD-fed mice. Finally, urinary myo-inositol:creatinine ratio was significantly higher in high-fat-fed mice (5·25, P= 0·014). HFD feeding for 4 months induced a significant reduction of myo-inositol content in liver (Fig. 1(A): − 46 %, P< 0·005) and kidneys (Fig. 1(B): − 35 %, P< 0·005). This intracellular myo-inositol depletion was totally prevented by myo-inositol supplementation in liver and partially corrected in kidneys. High glucose level can increase myo-inositol catabolism in kidney cells by enhancing MIOX expression and activity( Reference Nayak, Kondeti and Xie 23 ). We measured MIOX activity in the kidneys and found a lower MIOX activity in kidneys from HFD-fed mice (3·2 (sem 0·3) and 3·2 (sem 0·4) μmol d-glucuronic acid produced in 30 min/g of kidneys for HF and HF-MI, respectively) compared with kidneys from standard diet-fed mice (5·0 (sem 0·2) μmol d-glucuronic acid produced in 30 min/g of kidneys, so a change of − 36 and − 32 % for HF and HF-MI, respectively, v. C, P< 0·01; Fig. 1(C)).
Urinary inositol excretion in mice fed a chow (C) or a high-fat (HF) diet† (Mean values with their standard errors, n 5 per group)
* Mean value was significantly different from that of the group fed the C diet (P< 0·05).
† Data were compared using Student's t test and when appropriated Welch correction for variance in homogeneity.
Inositol metabolism imbalance associated with insulin resistance and hyperglycaemia in high-fat (HF) diet mice. myo-Inositol (MI) content in liver (A) and kidneys (B) of C57BL6J/Rj mice was determined by HPLC after 4 months of chow or HF (60 % energy from fat) diet feeding with or without MI supplementation (0·58 mg/g body weight). Values are means (n 7–9), with standard errors represented by vertical bars. a,b Mean values with unlike letters were significantly different (P< 0·005; one-way ANOVA). (C) myo-Inositol oxygenase (MIOX) activity was measured as described in the Materials and methods section in the kidneys of mice after 4 months of diet with or without MI supplement. Values are means (n 4–5), with standard errors represented by vertical bars. x,y Mean values with unlike letters were significantly different (P< 0·01; one-way ANOVA). (D) Urinary excretion of inositol was determined by HPLC quantification of inositol in the 24 h urine samples collected with metabolism cages after 1 month of chow diet or HF diet feeding (n 5, P< 0·01, Student's t test). Inosituria was correlated with glycosuria in mice after 1 month of chow or HF diet feeding (n 10, R 2 0·915, y= 0·7558+106·8, linear regression).
myo-Inositol supplementation reduces fat deposition in mice fed a high-fat diet
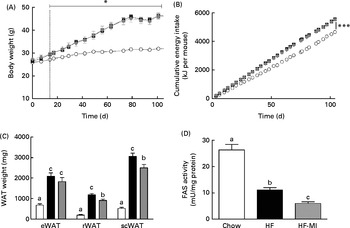
To evaluate myo-inositol capacity to reduce fat accumulation under obesogenic diet, mice were fed a HFD (60 % energy from fat) with or without a dietary myo-inositol supplement (0·58 (sem 0·2) mg/g BW per 24 h) for 4 months. BW, energy intake and myo-inositol intake were monitored throughout the study (see Fig. 2(A) and (B)). Note that no difference of body growth or cumulative energy intake was observed between HF and HF-MI groups throughout the study period; however, significantly higher values were observed for those parameters in HFD groups compared with control group as early as 2 weeks of diet for BW. Biometric data for each group after 4 months of diet are presented in Table 3. Lee index, a common index of adiposity in rodents, was markedly increased in HFD-fed animals (P< 0·0001). No significant difference was found, however, between the two HFD groups (HF and HF-MI). The mean daily energy intake was higher in high-fat-fed mice compared with chow diet-fed mice, but was not different between HF and HF-MI groups (53·9 (sem 0·8) kJ/d for HF mice, 54·0 (sem 0·9) kJ/d for HF-MI mice v. 46·0 (sem 1·5) kJ/d for chow diet-fed mice, n 29–30, P< 0·05). Of note, myo-inositol addition to drinking-water did not change mice water consumption as no significant difference in the mean daily water consumption was noticed between HF and HF-MI groups (2·8 (sem 0·1) and 2·9 (sem 0·1) ml/d and per mouse for HF and HF-MI groups, respectively; data not shown). Organ (liver, heart, kidneys and muscles) weights, taken as representative of lean mass, were not significantly different between the three groups with exception of kidneys that were bigger in high-fat groups (significant difference for HF-MI group). HFD sharply increased fat storage (total WAT weight 4·5-fold higher in HF, P< 0·0001), and myo-inositol supplement significantly restrained this fat accumulation in WAT (3·7-fold, i.e. a reduction of about 17 % in the total WAT weight compared with HF group without MI, P< 0·05; Table 3). This difference between HF and HF-MI groups was statistically significant for the retroperitoneal and subcutaneous fat pads (Fig. 2(C)).
myo-Inositol (MI) effect on white adipose tissue (WAT) and body weight (BW) in high-fat (HF) diet mice. (A) BW and (B) cumulative energy intake monitoring in C57BL6J/Rj mice during the 4 months of chow (![]() ) or HF (60 % energy from fat) diet feeding with (
) or HF (60 % energy from fat) diet feeding with (![]() ) or without MI (
) or without MI (![]() ) supplementation (0·58 mg/g BW; n 10). (C) Subcutaneous WAT (scWAT), epididymal WAT (eWAT), retroperitoneal WAT (rWAT) weights and (D) fatty acid synthase activity in eWAT after 4 months of diet with or without MI (n 9–10). One unit of FAS activity is the amount of enzyme needed to catalyse the oxidation of 1 nmol of NADPH. Values are means, with standard errors represented by vertical bars. a,b,cMean values with unlike letters were significantly different (P< 0·05; one-way ANOVA). Mean values were significantly different from those of the group fed the chow diet: * P< 0·05, *** P< 0·001.
) supplementation (0·58 mg/g BW; n 10). (C) Subcutaneous WAT (scWAT), epididymal WAT (eWAT), retroperitoneal WAT (rWAT) weights and (D) fatty acid synthase activity in eWAT after 4 months of diet with or without MI (n 9–10). One unit of FAS activity is the amount of enzyme needed to catalyse the oxidation of 1 nmol of NADPH. Values are means, with standard errors represented by vertical bars. a,b,cMean values with unlike letters were significantly different (P< 0·05; one-way ANOVA). Mean values were significantly different from those of the group fed the chow diet: * P< 0·05, *** P< 0·001. ![]() , Chow;
, Chow; ![]() , HF;
, HF; ![]() , HF-MI.
, HF-MI.
Biometric data and organ weights in C57Bl6 mice fed a high-fat (HF) diet and supplemented with myo-inositol (MI, 0·58 mg/g body weight (BW))‡ (Mean values with their standard errors, n 10 per group)
C, chow diet; WAT, white adipose tissue.
Mean value was significantly different from that of the group fed the C diet: * P< 0·05, *** P< 0·001.
† Mean value was significantly different from that of the group fed the HF diet (P< 0·05).
‡ Data were compared using one-way ANOVA and when appropriated PLSD Fischer post hoc tests.
myo-Inositol supplementation decreased fatty acid synthase activity in white adipose tissue
HFD caused important fat accumulation in the different WAT depots (i.e. inguinal, retroperitoneal and epididymal fat pads), which led to both hypertrophia (i.e. increase in cell size) and hyperplasia (i.e. increase in cell number) of these tissues. Indeed, mice from HF group had four to five times more total WAT than mice from C group (4·5-folds), and this was related to a significant increase in adipocyte cell number and size/volume (see Table 4). myo-Inositol supplementation significantly reduced this fat accumulation under HFD, and this result is confirmed by a decrease in adipocyte volume of HF-MI adipocytes compared with HF adipocytes. Of note, no significant difference was observed in retroperitoneal WAT cell number between HF and HF-MI groups. To get insights into myo-inositol mechanism of action in reducing fat storage, we measured the activity of the main lipogenic enzyme, namely fatty acid synthase (FAS; see Fig. 2(D)). FAS activity was reduced in HF group compared with C group ( − 58 %, P< 0·005, n 9) because of FAS repression by fat overload. Indeed, under HFD, leptin is produced by adipocytes in response to excess fat storage and represses FAS expression. FAS activity was further and significantly reduced in HF-MI group compared with HF group ( − 46 %, P< 0·05, n 9), which could contribute to the decreased WAT fat accumulation observed in HF-MI mice.
Cellularity of epididymal and retroperitoneal white adipose tissue (rWAT) in C57Bl6 mice fed a high-fat (HF) diet and supplemented with myo-inositol (MI, 0·58 mg/g) for 4 months‡ (Mean values with their standard errors, n 8–10 per group)
C, chow diet.
Mean value was significantly different from that of the group fed the C diet: * P< 0·05, *** P< 0·001.
† Mean value was significantly different from that of the group fed the HF diet (P< 0·05).
‡ Data were compared using one-way ANOVA and when appropriated PLSD Fischer post hoc tests.
myo-Inositol supplementation did not prevent insulin resistance associated with obesity
The plasma metabolite levels for each group are shown in Table 5. HFD induced hyperglycaemia with compensatory hyperinsulinaemia as assessed by the marked increase in HF and HF-MI fasting plasma levels of glucose and insulin. The HOMA-IR was calculated as a clinical parameter for the insulin resistance. The HOMA-IR indexes for HF and HF-MI groups were similar between them, but significantly higher than that of control group, suggesting insulin resistance in HFD-fed mice. High fat-fed groups also displayed increased fasting plasma levels of total cholesterol (P< 0·0001) and decreased fasting plasma levels of TAG compared with control group (P< 0·001). No significant difference was found between the three groups concerning the fasting plasma NEFA level (P= 0·322).
Plasma metabolites in C57Bl6 mice fed a high-fat (HF) diet and supplemented with myo-inositol (MI, 0·58 mg/g) for 4 months* (Mean values with their standard errors, n 10 per group)
C, chow diet; HOMA-IR, homeostasis model assessment-insulin resistance;
a,bMean values with unlike superscript letters were significantly different (P< 0·05).
* Data were compared using one-way ANOVA and when appropriated PLSD Fischer post hoc tests.
Insulin sensitivity was evaluated by ITT and their results are shown in Fig. 3. Exogenous insulin administration (0·5 IU/kg; 17·5 μg/kg) triggered a significantly greater hypoglycaemic response in control mice ( − 37 % in blood glucose level at 30 min compared with baseline) than HFD mice ( − 4 %; Fig. 3(A)). However, HF-MI mice glycaemic response to this exogenous insulin stimulation was improved compared with HF mice, as assessed by the significant difference in their glucose disappearance rates (K ITT, P< 0·05; Fig. 3(B)). Noteworthy, the glucose disappearance rate (K ITT) that reflects insulin sensitivity was negatively correlated with total WAT mass (Fig. 3(C), r 2 − 0·995, P= 0·003). Hence, the improvement in insulin sensitivity by myo-inositol supplementation could result from the reduction observed in fat mass accretion in that group compared with the other HF group.
myo-Inositol (MI) effect on insulin sensitivity in high-fat (HF) diet mice. Insulin sensitivity was explored through insulin tolerance test after 80 d of HF diet feeding with or without MI supplementation. (A) After an overnight fast, blood glucose was measured before and 15, 30 and 60 min after mice were injected intraperitoneally with 0·5 IU/kg (17·5 μg/kg) body weight of recombinant human insulin. ![]() , Chow;
, Chow; ![]() , HF;
, HF; ![]() , HF-MI. Values are means, with standard errors represented by vertical bars. Mean value of the HF diet-fed group was significantly different from that of the group fed the chow diet: * P< 0·05, *** P< 0·001 (two-way ANOVA). (B) The glucose disappearance rate for insulin tolerance test (ITT) (K
ITT, %/min) was calculated as described in the Materials and methods section. Values are means, with standard errors represented by vertical bars. a,b,cMean values with unlike letters were significantly different (P< 0·05; one-way ANOVA). (C) Negative correlation between K
ITT and total white adipose tissue (WAT) mass (C; linear regression, r
2 − 0·995, P= 0·003).
, HF-MI. Values are means, with standard errors represented by vertical bars. Mean value of the HF diet-fed group was significantly different from that of the group fed the chow diet: * P< 0·05, *** P< 0·001 (two-way ANOVA). (B) The glucose disappearance rate for insulin tolerance test (ITT) (K
ITT, %/min) was calculated as described in the Materials and methods section. Values are means, with standard errors represented by vertical bars. a,b,cMean values with unlike letters were significantly different (P< 0·05; one-way ANOVA). (C) Negative correlation between K
ITT and total white adipose tissue (WAT) mass (C; linear regression, r
2 − 0·995, P= 0·003).

myo-Inositol did not prevent ectopic lipid redistribution to liver and muscle
Ectopic lipid redistribution to insulin-sensitive tissues other than WAT (i.e. skeletal muscle and liver) was evaluated by measurement of tissue total lipid content (see Fig. 4(A)) and by direct observation of lipid droplets in histological liver sections (Fig. 4(B)). Livers of both HF and HF-MI groups displayed steatosis as revealed by the presence of numerous lipid droplets in the liver sections of these mice compared with the livers of chow diet-fed mice, and to the huge amount of lipids found in their liver compared with control livers (12·6 % for HF mice; 12·7 % for HF-MI v. 4·1 % of liver weight for C mice, P< 0·0001). Ectopic lipid redistribution was also observed in gastrocnemius muscles of HF and HF-MI mice that contained nearly as much intracellular lipids as a normal liver (4·7 and 4·4 %, respectively, compared with 1·6 % for control mice muscles, P< 0·0001).
myo-Inositol (MI) did not prevent ectopic lipid redistribution to liver or skeletal muscles in high-fat (HF) diet mice. (A) Intracellular lipid content in liver and gastrocnemius muscles. Values are means (n 10), with standard errors represented by vertical bars. a,b Mean values with unlike letters were significantly different (P< 0·0001; ANOVA). (B) Liver histological sections (optical zoom 10× and 40×) stained with haematoxylin and eosin of C57BL6J/Rj mice after 4 months of chow or HF (60 % energy from fat) diet feeding with or without MI supplementation (0·58 mg/g body weight). (A colour version of this figure can be found online at http://www.journals.cambridge.org/bjn).

myo-Inositol normalised plasma adipokine levels
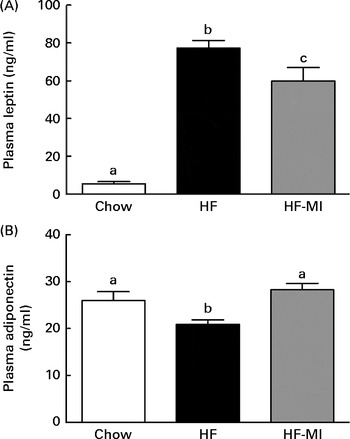
In accordance with the high adiposity of HF and HF-MI mice, leptinaemia was dramatically increased in those mice groups compared with the chow diet group (P< 0·001; Fig. 5(A)); however, leptinaemia of HF-MI mice was significantly lower than that of HF mice (P< 0·05). This decrease in leptin concentration is in good agreement with the lower total WAT mass. HF mice exhibited a reduced adiponectinaemia compared with C (P< 0·05; Fig. 5(B)). Noteworthy, adiponectinaemia of HF-MI mice was similar to that of C mice.
myo-Inositol (MI) beneficial effect on leptin and adiponectin plasma levels in high-fat (HF) diet mice. (A) Leptin and (B) adiponectin plasma levels in C57BL6J/Rj mice after 4 months of chow or HF (60 % energy from fat) diet feeding with or without MI supplementation (0·58 mg/g body weight). Values are means (n 9–10), with standard errors represented by vertical bars. a,b,c Mean values with unlike letters were significantly different (P< 0·05; one-way ANOVA).
myo-Inositol did not alter expression of lipogenic enzymes or adipokines in white adipose tissue
Since myo-inositol significantly reduced fat accretion and FAS activity, expression levels of two main lipogenic enzymes (acetyl-coenzyme A carboxylase, FAS) and transcription factors (SREBP-1a and SREBP-1c) were studied by quantitative PCR in epididymal WAT (Fig. 6). HFD feeding strongly reduced SREBP-1c expression (P< 0·0001; Fig. 6(D)) and nearly switched off that of acetyl-coenzyme A carboxylase 1 and FAS (P< 0·0001 and P< 0·001, respectively; Fig. 6(A) and (B)). However, myo-inositol treatment had no additional effect on all those gene expressions. Of note, expression of SREBP-1a was not altered, neither by diet nor by myo-inositol supplement (P= 0·733; Fig. 6(C)). Regarding adipokine expression profiles in adipose tissue, HFD feeding increased leptin (P< 0·005; Fig. 6(E)) and decreased adiponectin (P< 0·001; Fig. 6(F)) expressions. Finally, HFD feeding also down-regulated GLUT-4 expression (P< 0·0001; Fig. 6(G)). myo-Inositol treatment did not affect adipokines or GLUT-4 expression levels in mice under high fat feeding. Ultimately, HFD feeding-regulated adipokines, GLUT-4 and lipogenesis gene expressions, but myo-inositol supplementation, had no additional effect.
Effects of diet and myo-inositol (MI) on lipogenic, adipokines and GLUT-4 gene expressions in epididymal white adipose tissue of high-fat (HF) diet mice. Gene expression of lipogenic enzymes or transcription factors, adipokines or GLUT-4 was measured by quantitative PCR as described in the Materials and methods section in epididymal white adipose tissue of C57BL6J/Rj mice after 4 months of chow or HF (60 % energy from fat) diet feeding with or without MI supplementation (0·58 mg/g body weight). Expression rates of (A) acetyl-coenzyme A carboxylase (ACC1); (B) fatty acid synthase (FAS); (C) sterol-regulatory element binding protein (SREBP)-1a; (D) SREBP-1c; (E) leptin; (F) adiponectin and (G) GLUT-4, are expressed in folds compared with expression level of the TBP (TATA box binding protein) gene. Values are means (n 9–10), with the range indicated by the boxes. a,bMean values with unlike letters were significantly different (P< 0·05; ANOVA).

Discussion
We previously reported that a 2-week myo-inositol supplementation substantially reduced fat accretion and improved insulin sensitivity and glucose tolerance in mice( Reference Croze, Vella and Pillon 6 ). In the present study, we tested the ability of such nutritional intervention to prevent insulin resistance and/or obesity development in mice fed a HFD. However, dietary myo-inositol supplementation (0·58 mg/g daily for 4 months) improved insulin sensitivity and reduced fat accretion in mice ( − 17 %), but did not prevent insulin resistance or obesity development in this DIO mouse model. In addition, insulin resistance and/or hyperglycaemia were reported to be associated with anomalies in inositol metabolism, including inosituria and inositol intracellular depletion in some tissues (e.g. nerves and kidneys), in several human and animal studies( Reference Kennington, Hill and Craig 10 , Reference Sun, Heimark and Nguygen 11 , Reference Winegrad 13 ). Here, we show for the first time that such metabolic alterations are also concomitantly present with insulin resistance and hyperglycaemia in C57BL6 mouse after 1 or 4 months of HFD feeding. In addition, we show that inositol intracellular depletion can be reduced or fully prevented in kidneys or liver by a dietary myo-inositol supplementation.
Insulin resistance is associated with inositol metabolism alterations in high-fat diet-fed C57BL/6 mice and myo-inositol supplementation prevents inositol depletion
Mice fed a HFD exhibited a markedly increased urinary excretion of inositol (i.e. inosituria) from 1 month of diet, which was well correlated with the increased excretion of glucose (i.e. glycosuria). An inositol intracellular depletion was observed in their kidneys and liver after 4 months of diet, which was partially (kidneys) or fully (liver) prevented by myo-inositol supplementation. This difference could be explained by the fact that liver is the first organ supplied by dietary myo-inositol through the portal vein, while kidneys are the primary site of inositol catabolism (especially by MIOX) and excretion.
However, after 4 months of HFD (60 % energy from fat), we found that MIOX activity was not enhanced but rather significantly reduced. This result may be explained by the probable alteration in kidney structure and function due to the diabetic phenotype after 4 months of HFD feeding. In particular, it can be expected that the chronic hyperglycaemia, lipotoxic environment and the consecutive cellular stresses (e.g. oxidative stress and endoplasmic reticulum stress) probably present at this stage in kidney cells alter some cellular functions, including myo-inositol catabolism by MIOX. MIOX activity reduction observed after 4 months of HFD may then be related to early structural and functional changes in kidneys of obese and insulin-resistant mice (i.e. glomerulosclerosis, renal lipid accumulation and other early stages of diabetic nephropathy). It is worth noting that a study of Hu et al. ( Reference Hu, Chen and Fredrickson 24 ) has also reported a down-regulation of MIOX (decreased mRNA level of MIOX) in the kidneys of rodents with acute kidney injury. Chang( Reference Chang 25 ) reported, in an unpublished study, that MIOX gene was first overexpressed in the kidneys of streptozotocin-induced diabetes rat model (increased MIOX mRNA level 4 weeks after streptozotocin injection), but that this gene was down-regulated at a later time point in the course of diabetes development (8 weeks after streptozotocin injection), and despite an inositol depletion in kidneys at both time points. This reversal in MIOX expression/activity over the course of diabetes is unclear, but it could be related to renal alteration progression.
In contrast, competitive inhibition of inositol uptake by glucose (inhibition of renal tubular reabsorption and cellular uptake by cells) could be another cause of intracellular myo-inositol depletion under hyperglycaemic conditions and could also have contributed to inosituria at 1 month of HFD feeding. Indeed, glucose and myo-inositol exhibit structural similarities so that glucose is a competitive inhibitor of myo-inositol transport through its transporters SMIT (sodium/myo-inositol transporter) or H+/myo-inositol transporter. For this reason, excess urine glucose (glycosuria) can inhibit inositol tubular reabsorption through SMIT, therefore favouring inositol urinary excretion and causing inosituria, which possibly contributes to inositol intra-tissue depletion. Accordingly, we found a strong correlation between glycosuria and inosituria (see Fig. 1(D)). Similarly, hyperglycaemia can inhibit inositol import from extracellular sources and lead to inositol intracellular depletion. Dietary myo-Inositol supplementation probably prevents intracellular depletion by enhancing inositol blood level, thereby favouring its cellular uptake despite high level of blood glucose. However, if hyperglycaemia per se may contribute to inositol intra-tissue depletion and urinary inositol excretion through competition between glucose and inositol for cellular uptake, it may not be the only cause. In particular, the consequence of chronic hyperglycaemia on kidney function may be a more important cause of inosituria than hyperglycaemia per se and could also explain the good correlation between glycosuria and inosituria.
Indeed, a study of Chang et al. ( Reference Chang, Choong and Phillips 26 ) on isolated kidneys has shown that perfusion conditions replicating hyperglycaemia (20 mm-glucose) significantly potentiated D-chiro-inositol (DCI) but not MI urinary excretion in both non-diabetic and diabetic kidneys. The diabetic kidneys, however, presented 2-fold increased urinary excretion of myo-inositol compared with the non-diabetic kidneys. These findings show that (1) high glucose ambience per se has finally a minimal overall effect on inosituria (as MI is the predominant circulating stereoisomer in vivo), but it can potentiate urinary excretion of the less abundant stereoisomer DCI, and it shows that (2) alteration of kidney function and/or structure due to chronic exposition to hyperglycaemia, i.e. diabetic kidney per se, seems to be sufficient to alter tubular reabsorption of inositol and induce inosituria in this animal model of diabetes. In this context, inosituria was then primarily related to diabetic kidney-specific factors rather than from systemic factors (e.g. high glucose ambience, increased plasma inositol levels due to increased dietary intake or absorption). However, the underlying mechanisms through which inositol reabsorption is altered in diabetic kidneys and induces inosituria are still unclear, as SMIT expression in kidneys was increased at this time point of the disease (4 weeks after streptozotocin injection).
As the HFD used in the present study (60 % energy from fat) induced hyperglycaemia and the rapid development of a diabetic phenotype, it can be presumed that the kidneys of HF and HF-MI mice were impaired by this chronic high glucose ambience and by the excessive lipid supply. Indeed, Jiang et al. ( Reference Jiang, Wang and Proctor 27 ) reported an increase in renal intra-lipid accumulation, glomerulosclerosis and proteinuria in C57BL/6J mice after 12 weeks of a similar HFD (251 kJ (60 kcal) percentage saturated (lard) fat diet) feeding. The impaired kidney function probably associated with the diabetic phenotype in our mouse model was then probably the main contributor to the observed inosituria, and hyperglycaemia per se probably potentiated it.
Finally, chronic hyperglycaemia and associated glycosuria have probably contributed to both inosituria and inositol intra-tissue depletion in the short and long term, through direct competition of glucose with inositol for cellular uptake, and probably more importantly through long-term impairment of renal function.
myo-Inositol supplementation decreased fat accretion but did not prevent obesity development
In accordance with our previous study( Reference Croze, Vella and Pillon 6 ), we found that myo-inositol supplementation reduced fat accumulation and WAT hypertrophy under HFD feeding. Nonetheless, this nutritional intervention did not prevent obesity development.
The inhibitory effect of myo-inositol supplementation on WAT accretion seems to be related to its capacity to inhibit de novo lipogenesis in vivo, as revealed by the reduced FAS activity in HF-MI mice compared with HF mice (Fig. 2(D)). However, FAS activity (and thus de novo lipogenesis) is already strongly inhibited by the excess in fatty acids provided by the HFD (inhibition of lipogenesis gene expression (Fig. 6(A), (B) and (D))). Indeed, in the context of excessive dietary intake of fatty acids, a large amount of NEFA is available for TAG synthesis and other cell functions so that de novo synthesis of fatty acids from acetate or glucose (i.e. de novo lipogenesis) is down-regulated. In this context, de novo lipogenesis is no more a major contributor to fat accretion, which could explain why myo-inositol supplementation did not prevent efficiently fat accretion and obesity development in this DIO mouse model. Consequently, out of a use in complement of a balanced diet and a regular physical activity (which is by the way recommended for most anti-obesity strategies), myo-inositol supplementation cannot be an efficient strategy to prevent weight gain and obesity development.
myo-Inositol supplementation improved insulin sensitivity but did not prevent insulin resistance development
HFD feeding induced peripheral and liver insulin resistance with compensatory hyperinsulinaemia as evidenced by the reduced response to insulin during the ITT (Fig. 3), the fasting hyperglycaemia and hyperinsulinaemia and so the increased HOMA-IR index (Table 5). This insulin resistance was associated with central obesity (Fig. 2(A) and (C), and Table 3) and ectopic lipid deposition in liver and skeletal muscle (Fig. 4). Lipotoxicity and chronic low-grade inflammation were very probably the major causes of this diet- and obesity-induced insulin resistance. myo-Inositol supplementation did not prevent this insulin resistance and only slightly improved insulin sensitivity in mice fed a HFD. The large extent of ectopic lipid redistribution to liver or muscles in this mouse model, and the inability of MI to prevent or fight this phenomenon may explain MI supplementation failure in the prevention of this insulin resistance. The modest improvement in insulin sensitivity seemed to be of the same extent as the reduction in WAT accretion, as shown by the good correlation between the mean K ITT and the mean WAT weights for each group (Fig. 3(C)). In this context, a possible mediator of myo-inositol beneficial effect on insulin sensitivity could be adiponectin. Indeed, MI supplementation reduced WAT expansion, which may be responsible for the improvement in adiponectinaemia in HF-MI mice (Fig. 5(B)); and adiponectin has well-recognised anti-diabetic activities, so the improvement in adiponectinaemia may have contributed to the improvement in insulin sensitivity.
The greater insulin response in the HF-MI group could also potentially arise from the effects of myo-inositol on hepatic glucose output. However, Whiting et al. ( Reference Whiting, Danaher and Ruggiero 28 ) demonstrated that myo-inositol had no insulin-like effect on epinephrine-induced hepatic glucose output. In addition, the insulin-sensitising effect of myo-inositol supplementation observed in our previous study( Reference Croze, Vella and Pillon 6 ) by an ITT on normally sensitive mice mainly arised from peripheral (i.e. skeletal muscle and/or adipose tissue) insulin sensitivity improvement. Indeed, in normally insulin-sensitive mice, exogenous insulin stimulation switches off hepatic glucose output so that this phenomenon does not contribute substantially to the difference in hypoglycaemic response between normally or more insulin-sensitive mice groups during ITT. The little improvement in HF-MI mice response to insulin then mainly arise from an insulin-sensitising effect of myo-inositol on adipose tissue or skeletal muscle, than from an action on liver.
Incorporation of myo-inositol, as such or after in vivo conversion to d-chiro-inositol, into inositolphosphoglycans, putative second messengers of insulin, is a commonly proposed hypothesis for insulin-sensitising activities of inositol isomers or derivatives. If myo-inositol supplementation indeed enhanced the production and release of inositolphosphoglycans in response to insulin, this could have slowed down the progression of insulin resistance and be responsible for the little difference observed in insulin sensitivity between the two HF groups (for further details on inositolphosphoglycans insulin-like effects and putative mechanisms of action, see Croze & Soulage( Reference Croze and Soulage 9 ) review article).
myo-Inositol was far less efficient in this DIO mouse model of insulin resistance, than it had been in our previous study on normally sensitive mice. Several issues could account for these differences: (1) hyperglycaemia induced by the 60 % HFD (and then maintained by insulin resistance) inhibits inositol uptake by cells and so possibly reduces the effect of myo-inositol supplementation. A 40 % HFD might have provided a more gradual insulin resistance phenotype in the absence of hyperglycaemia, which could have provided greater cellular myo-inositol uptake and thus greater benefits of myo-inositol supplementation; (2) the HFD-induced fatty acid overload inhibits de novo lipogenesis from acetate and/or glucose and so probably dampens myo-inositol effect on WAT mass; and reduction in fat mass seemed to be an important contributory factor to insulin sensitivity improvement with chronic myo-inositol supplementation; (3) as the HFD used (60 % energy from fat) was caricatural, with a rapid insulin resistance development (1 month), it may be difficult to counteract with a simple nutritional intervention. A more appropriate physiological window to observe a greater insulin-sensitising effect of myo-inositol may have been obtained earlier after the beginning of the HFD or with a 40 % fat diet instead of the 60 % fat diet used; (4) if myo-inositol to d-chiro-inositol conversion is required for efficiency, and since this conversion is reported to be dependent on insulin action, the effect of myo-inositol in condition of insulin resistance is mitigated. Finally, it seems that myo-inositol supplementation is not a suitable strategy to prevent insulin resistance in sedentary subjects with a chronic high-energy and unbalanced diet. It may probably be more efficient for subjects at genetic risk of developing type 2 diabetes but with a less extreme way of life, or in insulin-resistant subjects but in complement of another treatment and/or lifestyle and dietary recommendations.
myo-Inositol supplementation did not improve plasma lipid profiles in high-fat diet-fed mice
Human studies with myo-inositol supplement have nearly always shown an improvement in plasma lipid profiles, with a reduction in plasma TAG, total and LDL-cholesterol, and an increase in HDL-cholesterol, thereby reducing the cardiovascular risk associated with insulin resistance( Reference Gerli, Papaleo and Ferrari 29 – Reference Santamaria, Giordano and Corrado 33 ). As expected, HFD-fed mice displayed hypercholesterolaemia; however, no significant difference was found between myo-inositol supplemented and only HFD-fed mice (Table 5). This result is not that surprising since rodents are quite different from humans concerning cholesterol metabolism (e.g. no cholesteryl ester transfer protein activity and increased hepatic cholesterol catabolism by liver X receptor activation in rodents but not in humans) and are then poor models for cholesterol-related human diseases (e.g. atherosclerosis).
HFD (60 %) feeding for 4 months was not associated with fasting hypertriglyceridaemia but rather with a reduction in plasma TAG (Table 5). Petit et al. ( Reference Petit, Arnould and Martin 34 ) reported low plasma TAG levels in mice fed a HFD, and showed that this was attributable to a more efficient chylomicron clearance from blood due to an increased lipoprotein lipase activity.
Parallel with human studies
Our results are globally consistent with the human studies performed with dietary myo-inositol supplementation, in that they show an insulin-sensitising effect in the long term (for a review of clinical studies, see Croze & Soulage( Reference Croze and Soulage 9 )). This insulin-sensitising action is modest, but remains significant in both animal and human studies. The 1-year clinical trial on postmenopausal women with metabolic syndrome( Reference Santamaria, Giordano and Corrado 33 ) has also shown a reduction in BMI (reduction from 31·5 (sem 2·4) to 30·2 (sem 1·1) kg/m2) and waist circumference (from 115 (sem 12) to 107 (sem 2·8) cm) with myo-inositol plus controlled diet (while no effect was obtained with diet alone), confirming the effect we found on WAT. Gerli et al. ( Reference Gerli, Papaleo and Ferrari 29 ) also reported a significant (P< 0·01) weight loss (associated with plasma leptin reduction) in the myo-inositol-supplemented group of women with polycystic ovary syndrome (PCOS), while a weight gain was observed in the placebo group. However, the effect of myo-inositol on adipose tissue mass is less important in humans than in mice. This can be explained by the fact that myo-inositol apparently acts on WAT de novo lipogenesis, and it has been shown that this process is much lower in humans compared with rodents (the liver is the main site of lipogenesis in humans). Indeed, under comparable dietary conditions, lipogenesis is about five times lower in pieces of human adipose tissue v. pieces of rat under comparable dietary conditions( Reference Swierczynski, Goyke and Wach 35 ). Rat adipose tissue exhibits higher lipogenic potential than human adipose tissue( Reference Letexier, Pinteur and Large 36 ).
Despite a modest efficiency when used alone, myo-inositol would probably potentiate (or have its action potentiated by) other insulin-sensitising agents (e.g. metformin) and could then help reduce the use of insulin-sensitive drugs. Supporting this view, combination of myo-inositol plus α-lipoic acid (antioxidant) plus metformin significantly improved hyperandrogenism, BMI and HOMA-IR indexes in PCOS women, compared with metformin alone( Reference Cappelli, Di Sabatino and Musacchio 37 ). In addition, association of myo-inositol with monacolin K (a natural statin) further improved myo-inositol efficiency on lipid profiles and hyperandrogenism in PCOS( Reference Musacchio, Cappelli and Di Sabatino 38 ). Combining myo-inositol with a balanced diet and/or a physical activity also probably improves its effectiveness. Noteworthy, all the human studies were performed in complement of a controlled diet and show that, in this context, myo-inositol supplementation can prevent gestational diabetes development( Reference D'Anna, Scilipoti and Giordano 39 , Reference Matarrelli, Vitacolonna and D'angelo 40 ), reduce the incidence of metabolic syndrome in post-menopausal women( Reference Santamaria, Giordano and Corrado 33 ) and greatly improve PCOS( Reference Unfer, Carlomagno and Dante 41 , Reference Artini, Di Berardino and Papini 42 ).
Concluding remarks
On the whole, the present results are in good accordance with the literature in that (1) we found back some abnormalities in inositol metabolism in association with hyperglycaemia and insulin resistance in a DIO mouse model of diabetes; and (2) myo-inositol supplementation significantly improved insulin sensitivity and reduced fat accretion; however, those effects were limited and seemed mitigated by hyperglycaemia and dietary lipid overload. Finally, myo-inositol supplementation does not seem to be a good strategy in the prevention or treatment of insulin resistance, diabetes and/or obesity, out of a use with a controlled diet. Nevertheless, myo-inositol supplementation keeps an interest as first-line treatment for PCOS or as a complement to other curative or preventive strategies for insulin resistance and type 2 diabetes. Additional animal and clinical studies should then be done in this way to conclude on the relevance and therapeutic interest of myo-inositol supplementation in the prevention or treatment of insulin resistance.
Supplementary material
To view supplementary material for this article, please visit http://dx.doi.org/10.1017/S000711451500121X
Acknowledgements
The authors gratefully acknowledge Dr Emmanuelle Fouilloux-Meugnier (CarMeN, INSERM U1060) for her assistance with gene expression analysis, and Pr. Michel Guichardant (CarMeN, INSERM U1060, INSA-Lyon) for fruitful discussion.
The present study was supported by INSERM and INSA-Lyon. M. L. C. was the recipient for a grant from the French ‘Ministère de la Recherche et de la Technologie’. INSERM and INSA had no role in the design and analysis of the study or in the writing of this article. This study received no specific grant from any funding agency, commercial or not-for-profit sectors.
The authors' contributions are as follows: M. L. C. and C. O. S. formulated the research question, and conceived and designed the experiments; M. L. C., A. G. and C. O. S. performed the experiments; M. L. C. and C. O. S. analysed the data; M. L. C. and C. O. S. wrote the paper; M. L. C., A. G. and C. O. S. discussed, reviewed and edited the manuscript.
None of the authors has any conflict of interest to declare.


