


1 Introduction
Semi-static adaptive optics (AO) has been an essential tool in controlling beam quality in high-energy, high-power laser facilities. These systems effectively remove static aberrations, enabling the highest intensities on target and unlocking new experimental regimes[ Reference Druon, Chériaux, Faure, Nees, Nantel, Maksimchuk, Mourou, Chanteloup and Vdovin1– Reference Ohland, Eisenbarth, Zielbauer, Zobus, Posor, Hornung, Reemts and Bagnoud5]. With the rapid advancement of laser technology, many beam quality issues have been addressed, revealing limitations that were previously unnoticed or considered irrelevant. Among these newly recognized limitations, dynamic aberrations have gained attention in recent years[ Reference Ohland, Posor, Eisenbarth, Iancu, Ungureanu, Ursescu and Bagnoud6– Reference Ohland9].
Dynamic aberrations evolve over various timescales: they range from slow drifts, for example, due to temperature changes of optical tables, and medium timescale changes, such as cool-down effects of active media, to fast evolution due to air turbulence or system vibrations. While pointing jitter is often mitigated using fast tip-tilt mirrors, higher-order aberrations have not yet been successfully addressed in real time. The increasing public interest in high-energy lasers with higher repetition rates, as demonstrated by initiatives such as the European Union (EU)-funded Technology for High-Repetition-Rate Intense Laser Laboratories (THRILL) program (https://www.thrill-project.eu/) and developments toward inertial fusion energy (IFE), underscores the urgency of addressing this issue.
Given the limitations of passive mitigation strategies for dynamic aberrations, the path forward clearly involves active beam control through real-time adaptive optics (RTAO). (Please note that the term ‘AO’ usually includes the real-time definition. However, in the laser community, ‘AO’ referred to non-real-time systems for the past decades, which is why we deliberately chose to use the ‘RTAO’ abbreviation to distinguish these systems in our context.) This technology has been successfully applied for real-time wavefront (WF) corrections in fields such as astronomical instrumentation[ Reference Jovanovic, Martinache, Guyon, Clergeon, Singh, Kudo, Garrel, Newman, Doughty, Lozi, Males, Minowa, Hayano, Takato, Morino, Kuhn, Serabyn, Norris, Tuthill, Schworer, Stewart, Close, Huby, Perrin, Lacour, Gauchet, Vievard, Murakami, Oshiyama, Baba, Matsuo, Nishikawa, Tamura, Lai, Marchis, Duchene, Kotani and Woillez10], ophthalmology[ Reference Akyol, Hagag, Sivaprasad and Lotery11] and free-space optical communication[ Reference Guiomar, Fernandes, Nascimento, Rodrigues and Monteiro12, Reference Kudryashov, Rukosuev, Samarkin, Galaktionov and Kopylov13]. However, the high-energy laser community faces a significant challenge: due to the historical focus on (semi-)static AO, there is a lack of expertise in designing and constructing custom RTAO systems tailored to the specific needs of large high-power laser facilities. Consequently, no feasible commercial solutions currently exist.
In this work, we take the first step toward addressing this issue by implementing a potential RTAO solution for a specific case. This implementation provides valuable insights into system architecture, feasible technologies and field-specific challenges. These insights will lay the foundation for the development of readily available RTAO systems in the field of scientific high-energy, high-power lasers, paving the way for a new era of beam stability in our community.
This paper is structured as follows. We begin with an introduction to the situation at the Apollon laser in France in the next section, which was the motivation and use case that we focused on. We proceed in Section 3 with a detailed description of the design considerations for our RTAO system, as well as the specific implementation in Section 4. We then present the performance evaluation on a test bench in Section 5 and in the actual system in Section 6, while we discuss the main challenges that we encountered in the operational environment in detail in Section 7. Based on these findings, we outline the future work necessary to integrate RTAO into regular operation in high-energy laser systems.
2 Background
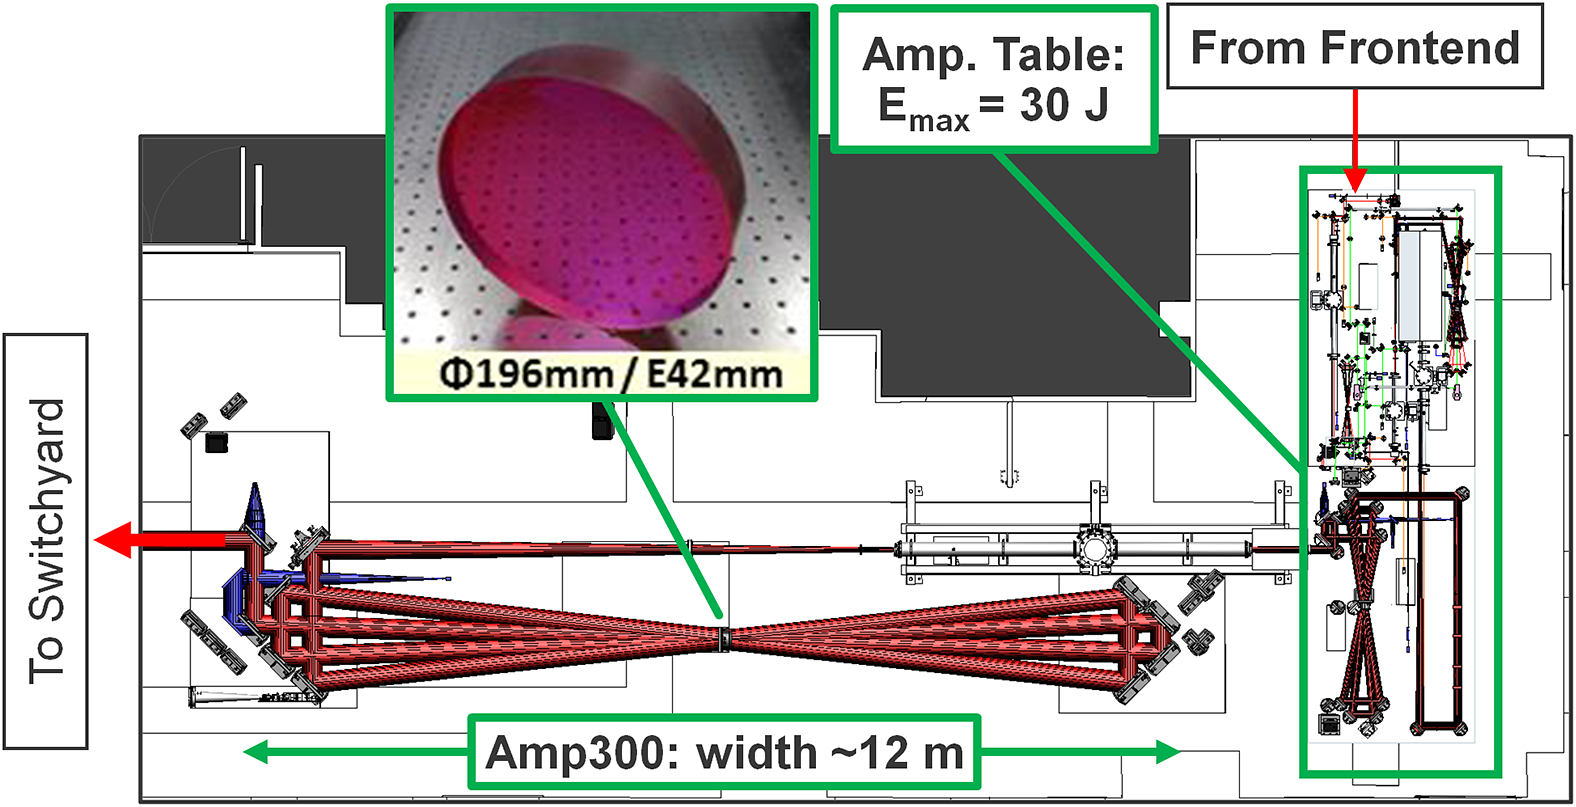
This work was conducted at the Apollon laser system[ Reference Burdonov, Fazzini, Lelasseux, Albrecht, Antici, Ayoul, Beluze, Cavanna, Ceccotti, Chabanis, Chaleil, Chen, Chen, Consoli, Cuciuc, Davoine, Delaneau, d’Humières, Dubois, Evrard, Filippov, Freneaux, Forestier-Colleoni, Gremillet, Horny, Lancia, Lecherbourg, Lebas, Leblanc, Ma, Martin, Negoita, Paillard, Papadopoulos, Perez, Pikuz, Qi, Quéré, Ranc, Söderström, Scisciò, Sun, Vallières, Wang, Yao, Mathieu, Audebert and Fuchs14, Reference Papadopoulos, Ayoul, Beluze, Gobert, Mataja, Fréneaux, Lebas, Chabanis, Dumergue, Audebert and Mathieu15], located close to Paris, France. Apollon is a titanium sapphire (Ti:sapph) chirped pulse amplification (CPA) laser system currently in its ramp-up phase, with the ambitious goal of delivering 150 J in 15 fs to the target, achieving 10 PW peak power at a repetition rate of one shot per minute. The laser pulses are initially generated in an optical parametric chirped pulse amplification (OPCPA) frontend and then amplified through a series of five bowtie Ti:sapph multipass amplifiers, each with increasing beam diameter.
The final amplifier in this sequence, known as ‘Amp300’, features one of the world’s largest Ti:sapph crystals, measuring 196 mm in diameter. Amp300 is designed to bring the pulse energy up to 300 J, with the next upgrade in the pump area within 2024 already unlocking energies of 250 J. Achieving such high energies is made possible by a large beam diameter of 140 mm and a complex multiplexing sequence where currently seven pump beams pump the crystal between the four amplification passes.
While this architecture enables large pulse energies, the bowtie design of Amp300, coupled with its large beam diameter, results in over 50 m of unimaged beam propagation through laboratory air (see Figure 1). This makes the beam extremely sensitive to air turbulence. Before any countermeasures were implemented, the Strehl ratio fluctuated between 0.2 and 0.9 within a single second, and the local WF slope fluctuated at up to 70 Hz. These fluctuations not only failed to meet the specifications of Apollon (maximum 10% Strehl ratio fluctuations) but also rendered the use of the Amp300 beamline unfeasible for high-intensity experiments.
Sketch of the Laser AMplification area (LAM) at Apollon. The last amplifier (Amp300) was known for causing beam instabilities due to air movement in the beam path.
Even after implementing passive measures, such as enclosing Amp300 in a tight beam housing, the Strehl ratio fluctuations still exceeded 20%, highlighting the limitations of passive beam control in certain configurations. This situation underscores the necessity for an active beam control solution, specifically an RTAO system.
It is important to note that while the architecture of Amp300 makes Apollon particularly susceptible to air turbulence, other facilities face similar challenges that limit certain types of experiments. For instance, the novel ELI-NP laser system achieves remarkable beam stability due to its vibration damping system, which includes nearly 1000 springs and dampers supporting the massive 1.5-m-thick reinforced concrete slab that forms the base of the laser hall. Nevertheless, atmospheric turbulence can still disrupt beam quality sufficiently to prevent certain types of experiments, for example, when employing helical beams[ Reference Ohland, Posor, Eisenbarth, Iancu, Ungureanu, Ursescu and Bagnoud6], which are highly sensitive to angular aberrations[ Reference Ohland, Eisenbarth, Roth and Bagnoud16]. This issue becomes much more prominent when sudden weather changes such as thunderstorms occur, which cannot be fully compensated by the air-conditioning system.
Furthermore, glass-based high-energy lasers with increased repetition rates are currently being developed for IFE applications. The thermal load from these lasers will inevitably generate beam instabilities, further emphasizing the need for expertise in designing, implementing and operating RTAO systems. This motivation therefore extends beyond Apollon and permeates the entire high-energy laser community.
3 System design and methodology
3.1 Inspiration from astronomy
RTAO has been an essential tool in astronomy for decades and is considered obligatory for large, earthbound telescopes in order to overcome the limitations imposed by atmospheric turbulence. Here, various RTAO schemes, such as high-resolution single conjugate RTAO for small fields of view, for example, for exoplanet imaging[ Reference Lozi, Ahn, Blue, Chun, Clergeon, Deo, Guyon, Hattori, Minowa, Nishiyama, Ono, Oya, Takagi, Vievard and Vincent17], and multi-conjugate RTAO with multiple deformable mirrors (DMs) for larger field of view observations[ Reference Rigaut and Neichel18], have been developed. These systems can handle many hundreds of control modes while operating at crossover frequencies (max. frequency that gets rejected by the loop) of hundreds of Hz (Tyson and Frazier[ Reference Tyson and Frazier19], Chapter 2). This extensive experience in astronomy provides valuable insights for implementing RTAO in high-energy laser systems.
To leverage this expertise, we partnered with the Subaru Coronagraphic Extreme Adaptive Optics (SCExAO) team at the Subaru Observatory on Maunakea, Hawaii[ Reference Jovanovic, Martinache, Guyon, Clergeon, Singh, Kudo, Garrel, Newman, Doughty, Lozi, Males, Minowa, Hayano, Takato, Morino, Kuhn, Serabyn, Norris, Tuthill, Schworer, Stewart, Close, Huby, Perrin, Lacour, Gauchet, Vievard, Murakami, Oshiyama, Baba, Matsuo, Nishikawa, Tamura, Lai, Marchis, Duchene, Kotani and Woillez10]. The SCExAO team, developers of the open-source Compute And Control for Adaptive Optics (CACAO) software[ Reference Guyon, Sevin, Gratadour, Bernard, Ltaief, Sukkari, Cetre, Skaf, Lozi, Martinache, Clergeon, Norris, Wong and Males20– Reference Deo, Guyon, Males, Ahn, Carcich, Cetre, Ferreira, Gratadour, Hagelberg, Jansen-Clem, Long, Lozi, Lucas, Morzinski, Mulet, Selznik, Sevin, Skaf and Vievard22], supported us in adapting their technology to our laser requirements on various levels.
3.2 Design considerations
Implementing RTAO in high-energy laser systems presents several unique challenges that differ from those encountered in astronomy. These differences necessitate specific adaptations in our approach.
Light source: One major difference is the light source for sensing. In astronomy, continuous light from natural or artificial guide stars (Tyson and Frazier[ Reference Tyson and Frazier19], Chapter 3.3) is typically available. However, high-energy, high-intensity laser systems operate with pulsed beams, with intervals of no light that can last for minutes during shot preparation.
One way to address this is to use a continuous pilot beam that co-propagates with the main beam, thus sampling the air turbulence and providing the RTAO loop with a signal to act upon. In that way, the loop can compensate for dynamic aberrations in the beamline up to shot delivery. The main concern using this technique is the protection of the sensor from the high fluence that occurs on shot. To mitigate this, the pilot beam can either be blocked a few milliseconds prior to the shot using a fast shutter, or the beam can be passively separated – for example, by employing an off-spectral pilot beam that features a wavelength that can be separated from the main pulse using a dichroic mirror and filters, which we decided to do at Apollon.
Wavefront sensor (WFS): The choice of WFS also required adaptation. While pyramid wavefront sensors (PWFSs) are commonly used in astronomy due to their ability to deal with photon noise when running on dim light sources, as well as high spatial resolution and computationally cheap evaluation (Tyson and Frazier[ Reference Tyson and Frazier19], Chapter 5.3), the PWFS faces limitations in its ability to deal with non-common path aberrations. This is typically no great concern in astronomical instrumentation as the beam diameters remain small after splitting the light between the WFS and the scientific camera. In our field, however, the sampling is done at the largest beam diameters after the beam is amplified in order to prevent damaging optics. The successive imaging and demagnification system usually generates significant numbers of non-common path aberrations, which renders PWFSs unfeasible for this application.
For this reason, other WFS schemes that cope well with this issue have to be used while carefully tweaking the evaluation pipeline to still feature sufficient speed and throughput for RTAO applications. One example would be using a Shack–Hartmann sensor (SHS), which features a large dynamic range, and implementing a suitably fast evaluation routine, as done in this project.
DM: Another critical consideration was the selection of the DM. In astronomical instrumentation, small, fast, high-resolution micro-electromechanical system (MEMS) mirrors are commonly used as they greatly fit this application[ Reference Jovanovic, Martinache, Guyon, Clergeon, Singh, Kudo, Garrel, Newman, Doughty, Lozi, Males, Minowa, Hayano, Takato, Morino, Kuhn, Serabyn, Norris, Tuthill, Schworer, Stewart, Close, Huby, Perrin, Lacour, Gauchet, Vievard, Murakami, Oshiyama, Baba, Matsuo, Nishikawa, Tamura, Lai, Marchis, Duchene, Kotani and Woillez10, Reference Lozi, Ahn, Blue, Chun, Clergeon, Deo, Guyon, Hattori, Minowa, Nishiyama, Ono, Oya, Takagi, Vievard and Vincent17].
However, the laser-induced damage threshold (LIDT) of these DMs is too low for high-energy, high-intensity lasers, as the thin membranes cannot withstand the stress of highly reflective dielectric coatings. At the same time, this technology cannot be scaled up easily to larger diameters at reduced fluence.
To our knowledge, the only DM technology that allows one to accommodate both specialized coatings and larger diameters is piezoelectricity. Standard piezoelectric bimorphs feature a good balance of size, speed, stroke and high damage threshold, while remaining relatively affordable[ Reference Bonora, Pilar, Lucianetti and Mocek23].
RTAO controller: The demands to the computation hardware are easily derived from the requirements for latency (see Section 5.1) and the number of control modes and quickly exceed the performance of a central processing unit (CPU)-based system. The two main competitors for high-speed RTAO control hardware are field-programmable gate array (FPGA)[ Reference Kudryashov, Rukosuev, Samarkin, Galaktionov and Kopylov13, Reference Surendran, Burse, Ramaprakash, Paul, Das and Parihar24, Reference Rukosuev, Belousov, Galaktionov, Kudryashov, Nikitin, Samarkin and Sheldakova25] and graphics processing unit (GPU)-based systems[ Reference Guyon, Sevin, Gratadour, Bernard, Ltaief, Sukkari, Cetre, Skaf, Lozi, Martinache, Clergeon, Norris, Wong and Males20, Reference Truong, Bouchez, Dekany, Shelton, Troy, Angione, Burruss, Cromer, Guiwits and Roberts26]. Both deliver high-throughput and low-latency computation to achieve the required performance.
In the laser community, AO controllers were usually non-real-time applications that exclusively ran on the computer’s CPU. Despite FPGAs potentially featuring lower latency, the increased and hardware-specific development efforts rule this option out as a community project. For this reason, using open-source GPU code on a real-time computer (RTC) is a more suitable approach.
4 Implementation
In this section, we provide details of the implementation of the Apollon Real-time Adaptive Optics (ARTAO) system. The setup is based on the design considerations that we discussed in the last section.
4.1 Pilot beam approach
For the ARTAO system, we chose the passive off-spectral pilot beam scheme. Our previous investigations showed that a wavelength of 905 nm is easy to separate from the main spectrum (730–890 nm) using dichroic mirrors and filters, while featuring a transmission of 10% up to the 1 PW compressor entrance, which is sufficient to saturate the WFS at an injected beam power of 20 mW. Moreover, the passive approach is easier to implement and more robust as there is no risk of damaging the WFS due to shutter failure.
We injected the single-mode fiber-coupled 905 nm laser diode after the second amplifier where the beam was still small and not impaired by air turbulence. The pilot beam was then separated right before the vacuum tank of the 1 PW compressor (see Section 6 for details on the sensor setup).
4.2 Real-time controller
As this is, to the best of our knowledge, the first time that a fully custom RTAO loop was implemented in an ultraintense laser system, reusability in other systems was a concern. For that reason, we decided to adapt the open-source CACAO code, developed by the SCExAO team, due to its robust features, maturity and its use of GPUs to achieve high-throughput, low-latency operation. The architecture and features of the CACAO code are described in detail in the original publications by the SCExAO team[ Reference Guyon, Sevin, Gratadour, Bernard, Ltaief, Sukkari, Cetre, Skaf, Lozi, Martinache, Clergeon, Norris, Wong and Males20– Reference Deo, Guyon, Males, Ahn, Carcich, Cetre, Ferreira, Gratadour, Hagelberg, Jansen-Clem, Long, Lozi, Lucas, Morzinski, Mulet, Selznik, Sevin, Skaf and Vievard22]. In brief, the CACAO code can be described as a framework where computations are split into microservices. These processes are triggered by image stream updates and thus form a fully customizable AO pipeline.
For the ARTAO system, we extended the CACAO code by implementing hardware interfaces, custom WFS referencing and evaluation functions and vectorized WF management to avoid unnecessary reshaping operations.
The hardware that we used to run the CACAO code was inspired by the KalAO[ Reference Hagelberg, Restori, Wildi, Chazelas, Baranec, Guyon, Genolet, Sordet and Riddle27] system, which featured specifications that were comparable with what we intended to achieve. The RTC was assembled solely of consumer grade components (see Appendix A for a full list of components) and can be compared to a high-end gaming computer. As such, the assembly was relatively cheap compared to the high-speed camera and the DM while easily delivering the required performance (see Section 5.1 for requirement estimation).
4.3 DM selection
As discussed before, the requirements for speed and damage threshold significantly reduce the number of choices concerning DM technology, where piezoelectric DMs are currently the most feasible options. While placing a large DM after the amplifiers as close to the WFS as possible would be the most unproblematic solution due to more direct DM imaging and less pre-compensation (foreshadowing, see Section 7), the increased size does not only mean increased costs, but also a lower resonance frequency for bimorph DMs. Piezostack DMs would avoid this issue, but feature a significantly lower dynamic range.
For these reasons, we decided to place a smaller bimorph DM, optimized for a 55 mm beam diameter, prior to the second last amplifier and image it to the WFS instead. The DM does therefore pre-compensate for the dynamic aberrations in the main amplifier.
In this work, we were using a bimorph with 60 mm clear aperture and 96 actuators in an annular arrangement, optimized for Zernike stroke at an angle of incidence of 0°–10° (DM9660 by Dynamic Optics, Italy). The characterization is shown in Section 5.3.
4.4 Wavefront sensor
For the WFS, we constructed a custom SHS using a micro-lens array (MLA) with a pitch of 250 μm and a focal length of 11 mm and a high-speed Peripheral Component Interconnect Express (PCIe) camera (CB013MG-LX-X8G3-TG, xiB-64 series by XIMEA), capable of streaming frames directly to the RTC’s memory (or even to the GPU, if it features GPUDirect remote direct memory access (RDMA)) at up to 7 kHz for a region of interest (ROI) of 5 mm $\times$
5 mm (384
$\times$
5 mm (384 $\times$
384 pixels) at a negligible latency. We used the taped glass version of the camera in order to remove the cover glass from the chip as this would cause interference patterns when a coherent, monochromatic light source, such as our continuous wave (CW) pilot beam, is employed.
$\times$
384 pixels) at a negligible latency. We used the taped glass version of the camera in order to remove the cover glass from the chip as this would cause interference patterns when a coherent, monochromatic light source, such as our continuous wave (CW) pilot beam, is employed.
We determined the distance of the MLA to the camera chip by introducing known amounts of tilt and observing the motion of the centroids on the camera image. The exact knowledge of this distance enables quantitative WF measurements relative to a reference. The reference was kept relative by design as the beam optimization at Apollon is done using a standard procedure with a large, slow mechanical DM (ILAO180, Imagine Optic), which provides the target WF to be stabilized.
For the evaluation, we implemented two routines in the CACAO code: a referencing routine, generating a fixed WF pupil with reference positions, and a GPU-based routine that uses this reference to calculate the WF from the camera image. The latter is logically a three-step process. Firstly, the image is convolved with a Gaussian kernel, fitting the standard deviation of the spots of the SHS, in order to increase robustness against noise. Secondly, a parabola is fitted to the brightest pixel and its closest neighbors of each smoothed spot in order to retrieve the fractional shift of the spot[ Reference Poyneer28]. Thirdly, the retrieved slopes are multiplied with a matrix that translates the gradient vector to a WF vector.
Practically, we used an adaptive windowing approach, where only the relevant pixels around each spot are copied to the GPU. Since the standard deviation of the focal spots (13.9 μm) nicely matched the camera pixel size (13.7 μm) in our case, the algorithm uses a kernel size of 3×3 pixels. Under the assumption that the spot position has moved less than half a pixel since the last frame, 6 $\times$
6 pixels, excluding the corner pixels, need to be streamed to the GPU.
$\times$
6 pixels, excluding the corner pixels, need to be streamed to the GPU.
The entire operation is completed within approximately 60 μs, well within the latency budget.
5 Characterization and testing
5.1 System modeling
In order to verify the system’s performance at a later point, we approximated the loop as a single-input single-output system and constructed a transfer function in the Laplace domain (Tyson and Frazier[ Reference Tyson and Frazier19], Chapter 8.2). In the following, we briefly describe the components of the feedback transfer function, where the formulae are listed after the enumeration.
-
(1) WFS exposure: ${H}_{\mathrm{exp}}(s)$
Modeled as an integrator normalized to the exposure time
${T}_{\mathrm{exp}}$
, minus another normalized integrator delayed by
${T}_{\mathrm{exp}}$
, effectively simulating the average response within the exposure window. -
(2) Frame transfer:
${H}_{\mathrm{trans}}(s)$
We represented the delay due to the WFS frame transmission as a simple delay corresponding to the maximum possible frame rate – approximately
${T}_{\mathrm{trans}}=$
135 μs in our case. -
(3) Controller response:
${H}_{\mathrm{RTC}}(s)$
The control unit was emulated by a discrete sampling (chain of Dirac impulses) every control cycle period
$T$
, coupled with a delay
${T}_{\mathrm{c}}$
, resembling the computation time and driver latency, and a gain factor
$G$
. -
(4) Leakage:
${H}_{\mathrm{leak}}$
As our loop ran using a leaky integrator, that is, a small portion of the integrated signal is ‘thrown away’ in order to avoid the accumulation of errors, the leakage per control step needed to be included in the model. For this, we modified the transfer function of an exponential decay in such a way that we could use the per-step leakage multiplier
$\lambda$
to determine how much of the control signal is discarded every iteration. -
(5) Driver hold:
${H}_{\mathrm{DRV}}(s)$
The DM driver itself was modeled by a simple zero-order hold for the control cycle period
$T$
. Considering the control signal being a chain of Dirac pulses with variable amplitude, this is again an averaging over the control period
$T$
. -
(6) DM response:
${H}_{\mathrm{DM}}(s)$
The speed of the bimorph DM is limited by the charge time of the electrodes. For this reason, we approximate the rise time by a linear ramp. Taking the step-like signal from the driver, this is yet another averaging transfer function. The rise time
${T}_{\mathrm{DM}}$
was extracted from measurements (see the next section).


In formulae, these contributions equal the following:
 $$\begin{align*}\displaystyle \begin{array}{c}{H}_{\mathrm{exp}}(s)=\dfrac{1}{sT_{\mathrm{exp}}}-\dfrac{e^{-{sT}_{\mathrm{exp}}}}{sT_{\mathrm{exp}}}=\dfrac{1-{e}^{-{sT}_{\mathrm{exp}}}}{sT_{\mathrm{exp}}},\\\\[-9pt] {}{H}_{\mathrm{trans}}(s)={e}^{-{sT}_{\mathrm{trans}}},\\\\[-9pt] {}{H}_{\mathrm{RTC}}(s)=G\cdot \dfrac{e^{-{sT}_{\mathrm{c}}}}{1-{e}^{- sT}},\\\\[-9pt] {}{H}_{\mathrm{leak}}(s)=\dfrac{sT}{sT-\ln \left(\lambda \right)},\\\\[-9pt] {}{H}_{\mathrm{DRV}}(s)=\dfrac{1-{e}^{- sT}}{sT},\\\\[-9pt] {}{H}_{\mathrm{DM}}(s)=\dfrac{1-{e}^{-{sT}_{\mathrm{DM}}}}{sT_{\mathrm{DM}}}.\end{array}\end{align*}$$
The parameters are listed in Table 1.
The parameters used in the model of the ARTAO loop for the estimation, on the test bench and in the Apollon beamline itself.
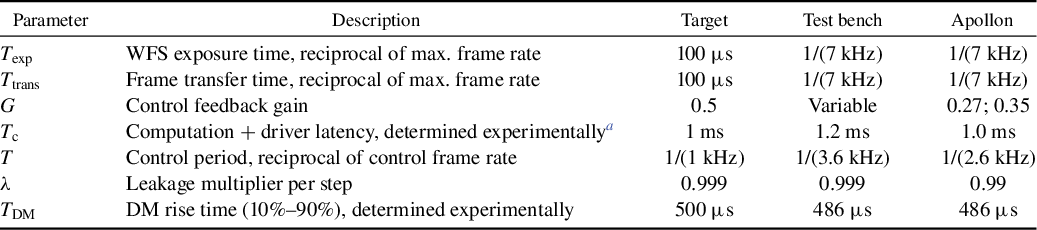
a
Here, ${T}_{\mathrm{c}}$
is dominated by the latency of the DM driver. While this is difficult to separate from other effects, measurements indicate a delay of approximately 0.7 ms (see Section 5.3).
${T}_{\mathrm{c}}$
is dominated by the latency of the DM driver. While this is difficult to separate from other effects, measurements indicate a delay of approximately 0.7 ms (see Section 5.3).
The corresponding error transfer function of the loop is as follows:
 $$\begin{align}R(s)=\frac{1}{1+F(s)},\end{align}$$
where $F(s)$
is the feedback transfer function, which in turn is the product of all transfer functions discussed above. The corresponding magnitude Bode plot (amplitude response) at frequency
$F(s)$
is the feedback transfer function, which in turn is the product of all transfer functions discussed above. The corresponding magnitude Bode plot (amplitude response) at frequency $\omega$
is then obtained by evaluating
$\omega$
is then obtained by evaluating $R\left( i\omega \right)$
. Prior to the design of the ARTAO system, we evaluated
$R\left( i\omega \right)$
. Prior to the design of the ARTAO system, we evaluated $R(s)$
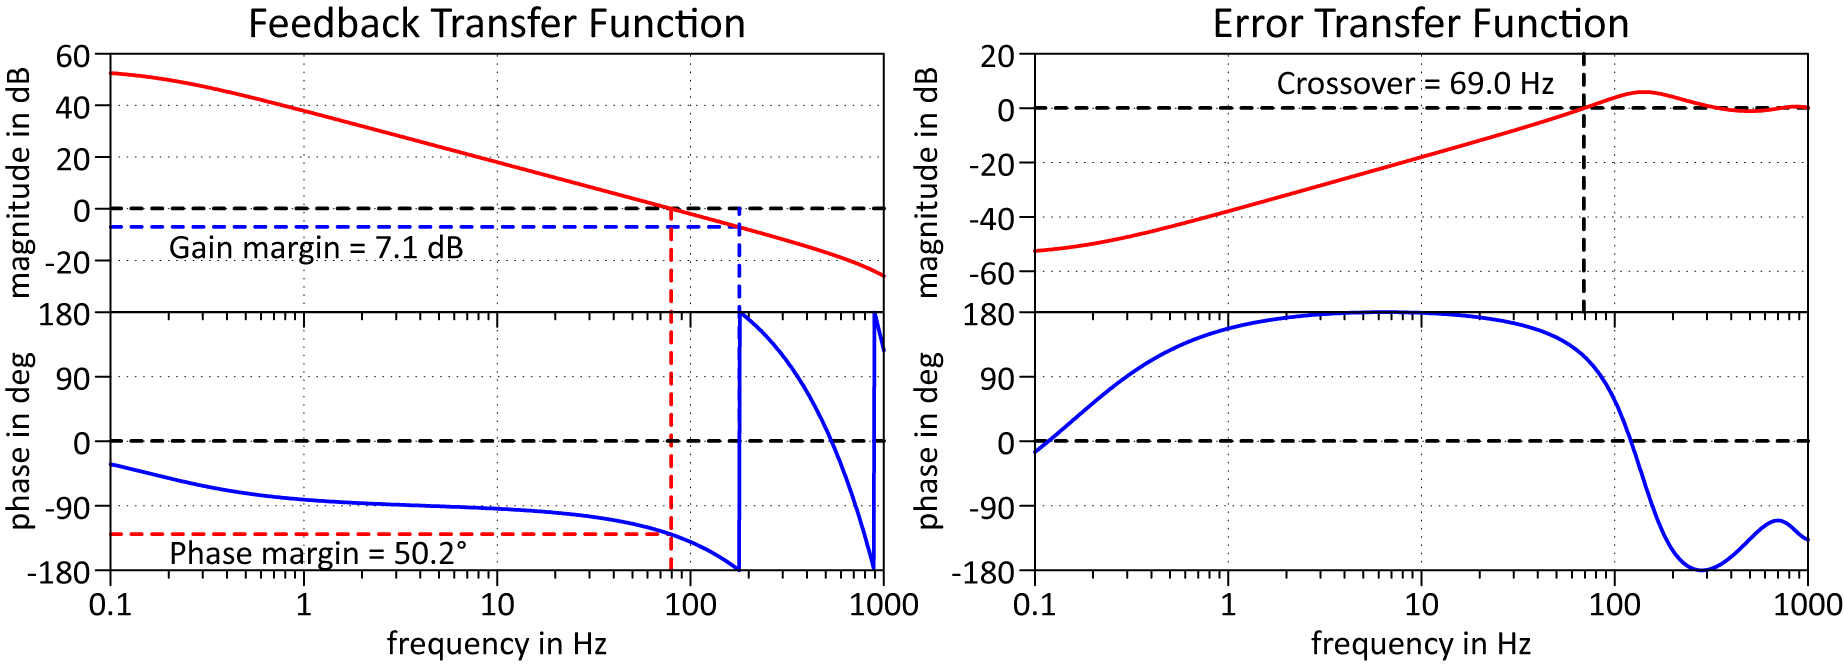
for a set of different parameters to aid the selection of the hardware. In Table 1, we list the set of target parameters that yielded a crossover frequency of approximately 70 Hz (cutoff frequency of the measured turbulence) with suitable gain and phase margins (Tyson and Frazier[
Reference Tyson and Frazier19], Chapter 8.2.9), while being realistically achievable. The corresponding Bode plots are shown in Figure 2.
$R(s)$
for a set of different parameters to aid the selection of the hardware. In Table 1, we list the set of target parameters that yielded a crossover frequency of approximately 70 Hz (cutoff frequency of the measured turbulence) with suitable gain and phase margins (Tyson and Frazier[
Reference Tyson and Frazier19], Chapter 8.2.9), while being realistically achievable. The corresponding Bode plots are shown in Figure 2.
The Bode plot of the feedback transfer function $F(s)$
(left) and the error transfer function
$F(s)$
(left) and the error transfer function $R(s)$
(right) according to Equation (1), using the parameter values from the ‘Target’ column in Table 1.
$R(s)$
(right) according to Equation (1), using the parameter values from the ‘Target’ column in Table 1.
We will use the same model with different parameter sets in the next section to validate our understanding of the system with experimental data.
5.2 Test-bench setup
To evaluate the functionality and performance of the ARTAO system, we set up a test bench with a simplified configuration (see Figure 3). It consisted of a single beam path where we collimated the pilot source after exiting the fiber, an aperture fixing the beam size, an imaging beam expander to the DM and an imaging system to the SHS afterwards. Although we did not implement a physical turbulence generator to emulate the operational conditions, we utilized the CACAO code’s internal turbulence injection to introduce disturbances to the DM.
Schematic of the test-bench setup, to scale.
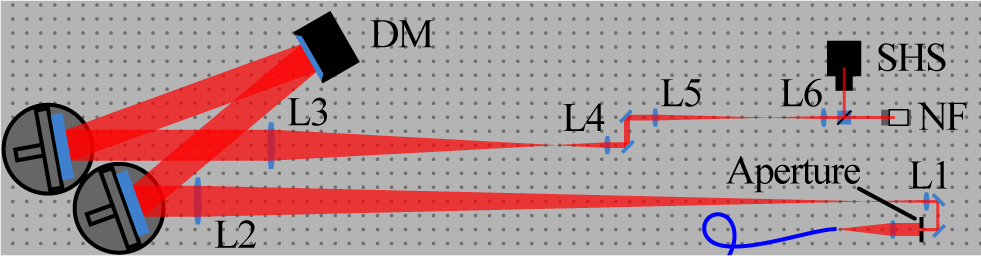
The primary objectives of this test-bench setup were to verify the system’s functionality, characterize the DM, measure system latency and determine the frequency response.
5.3 Performance evaluation
We conducted several performance tests to validate the system.
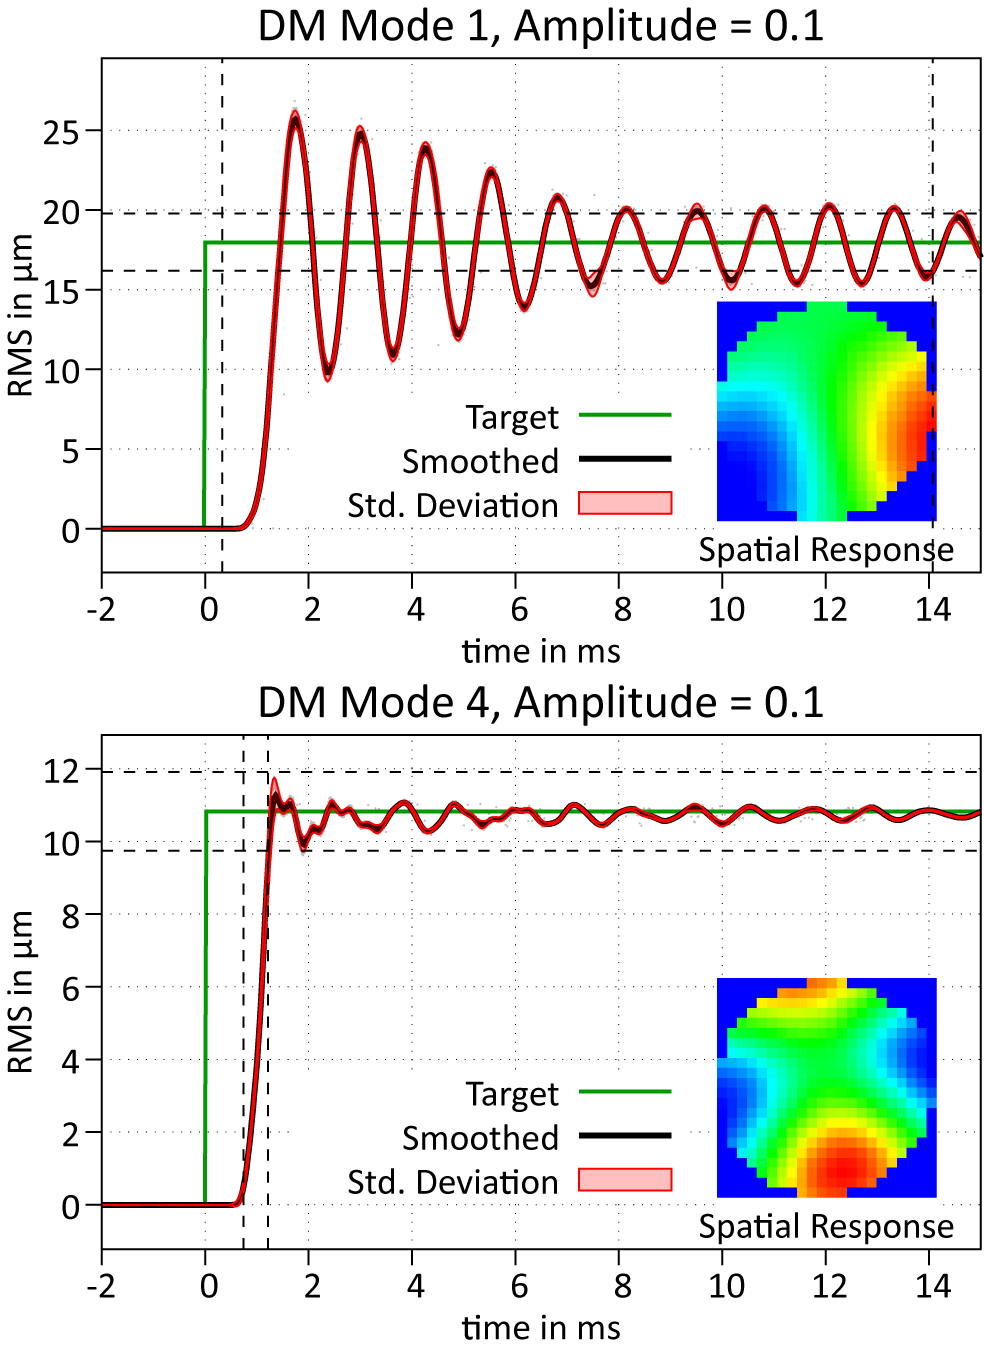
DM latency and rise time: Using a strobing technique, we evaluated the DM latency and rise time. By repeatedly poking a selected DM mode a couple of hundred times while varying the delay with respect to the camera frame, we generated a corresponding response curve (see Figure 4 for single-mode example curves), which is the DM response, convolved with the camera exposure timeframe, and delayed by the driver delay, the camera delay and the WFS evaluation time. From this, we extracted both the latency between the command and the first available WF of the onset of the rise time and the 10%–90% rise time of the DM itself. We then repeated process for all control modes of the control matrix (see Figure 5). The rise time is fairly consistent across all modes except for the lowest three ones, roughly corresponding to tip/tilt and defocus. When excluding these three, the rise time is at 486 ± 50 μs, following a delay of 780 ± 49 μs (including driver delay, camera exposure, frame transfer and WFS evaluation).
Step response of two DM modes over time (open loop). The dashed lines indicate the 10%–90% levels and corresponding settling times. Top: first mode, featuring severe ringing due to the mechanical DM properties. Bottom: fourth mode with a regular settling behavior. All modes from this order upwards feature a comparable settling behavior (see Figure 5).
Step responses of a full set of mirror modes over time.
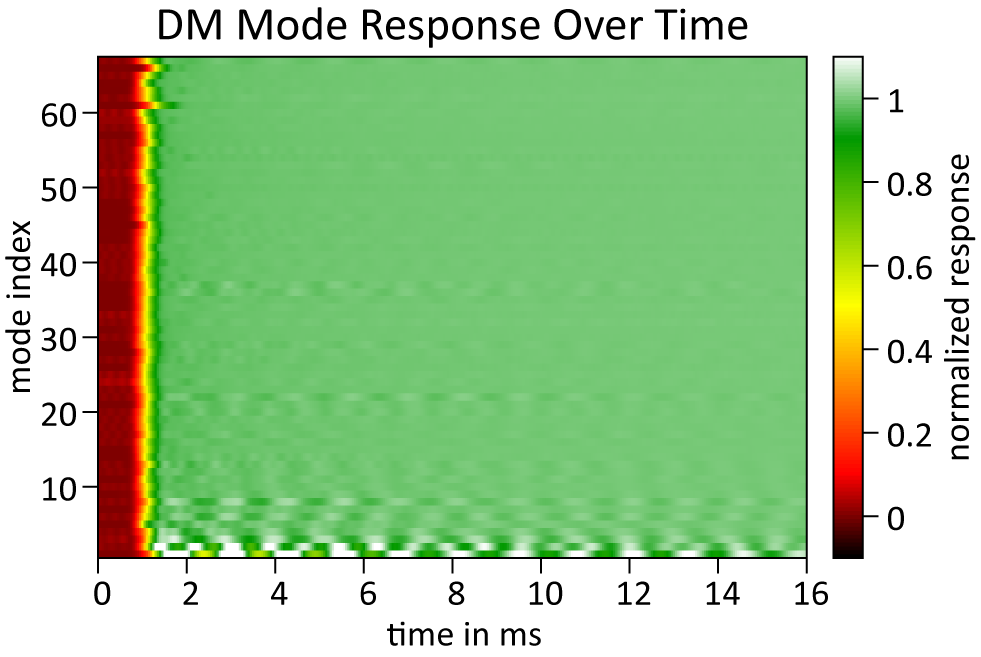
The lowest three modes showed notable ringing due to the DM mechanics. This ringing significantly increased the settling time to 13, 8.3 and 1.4 ms, respectively. While this is part of a separate project, this clearly indicates the advantage of a separate pointing control system if no DM with better temporal characteristics on these modes is available.
System frequency response: We measured the system’s frequency response using the CACAO code’s internal turbulence emulator, which introduced disturbances on the DM by sweeping a Kolmogorov screen[ Reference Kolmogorov29] across the actuator matrix at a constant velocity. By measuring the local WF jitter in both open- and closed-loop configurations, applying spectral smoothing and determining the ratio of the two for different stable loop gains, we experimentally measured the frequency response of the system (see Figure 6).
The RTAO loop gain over the frequency for different feedback gains. The dashed curves are the gains of the corresponding model, that is, the magnitude of the error transfer function.
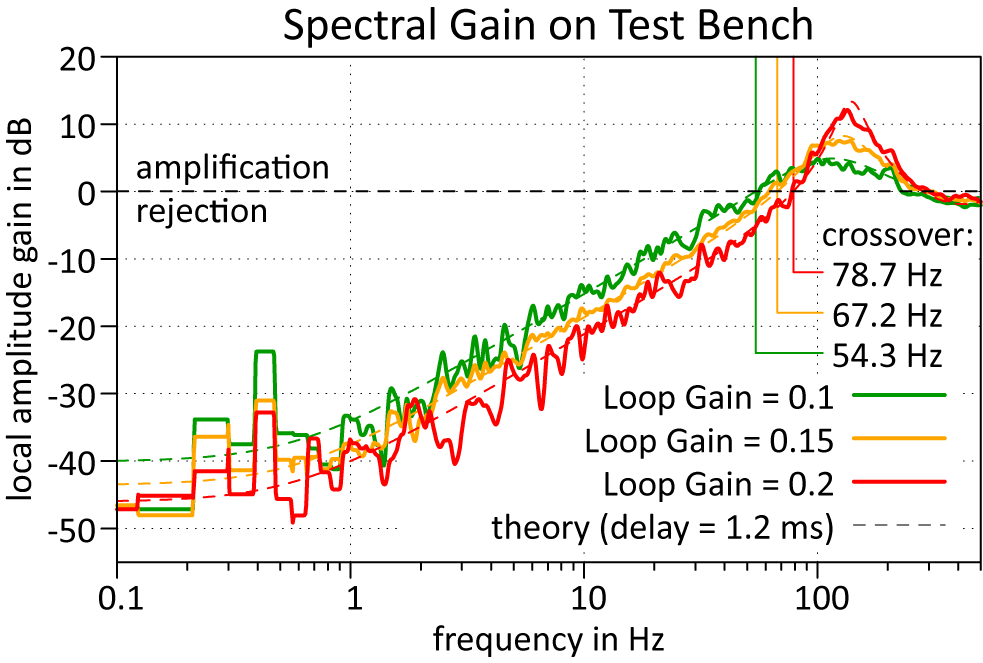
At this point, we used the model for the error transfer function (Equation (1)) as a fit model, where the loop delay was the fit parameter. At a delay of 1.2 ms, we found excellent agreement between the model and the experimental data.
In the lowest frequency range, the deviation of the data from the simulated curves increases, while also featuring some correlation between the measurements. The latter can be attributed to the periodic nature of the Kolmogorov screen that we used to disturb the loop, while the magnitude of the errors is caused by the limited recording duration (approx. 13.65 s in 12 image cubes, 4096 frames each), which leads to poor statistics in the low-frequency domain.
6 Integration with the Apollon laser system
6.1 Implementation details
We performed the integration of the ARTAO system into the Apollon laser system in a way that did not require significant changes in the main beamline that could potentially interfere with regular operation. In the following, we will briefly describe the changes we made. The setup is shown schematically in Figure 7.
Schematic setup of the ARTAO system in the Apollon laser chain.
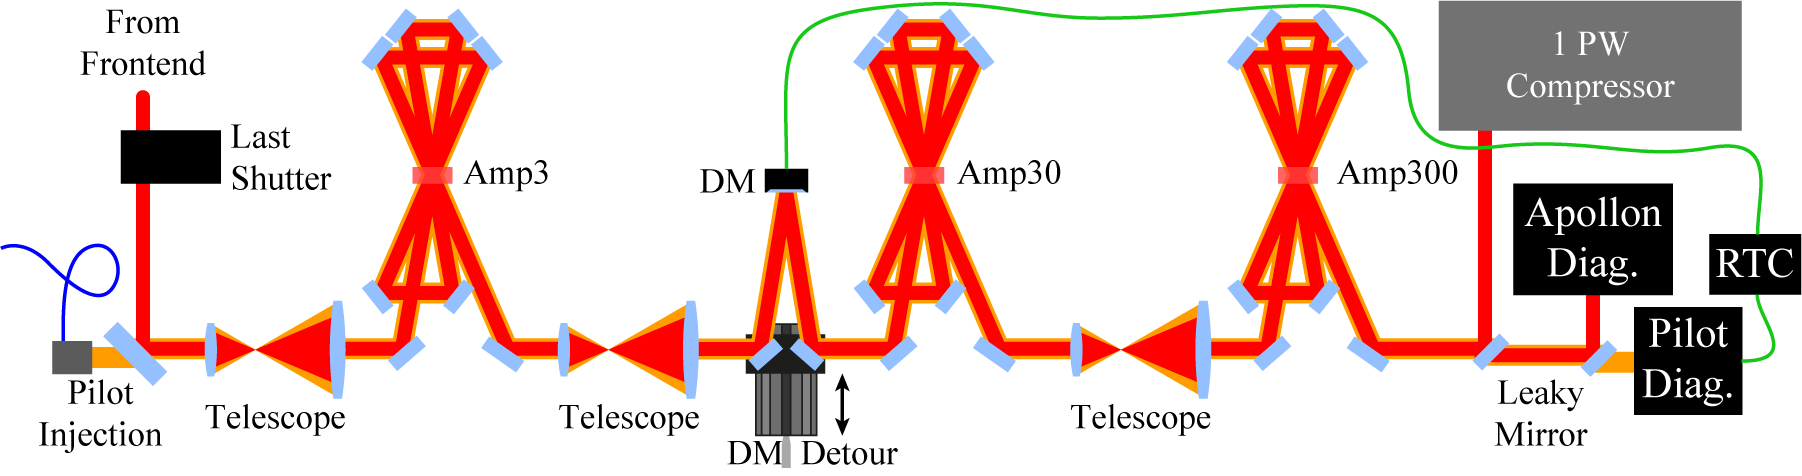
We injected the 905 nm CW pilot beam right after the last Pockels cell shutter of the Apollon laser system, located between the second and third amplifiers. Using a reflective fiber collimator, the beam featured a diameter slightly above the diameter of the main beam. We aligned the polarization using a wave plate and injected the pilot through a dichroic mirror. The regular beam alignment references were used to ensure co-propagation of both the pilot and main beams.
In order to enable easy bypassing of the DM, we integrated a beam detour prior to the fourth amplifier, where the beam diameter is 55 mm, ensuring a low fluence to prevent any potential damage to the DM. The detour injection and pickup mirrors were placed on a linear stage and could be inserted and removed whenever necessary.
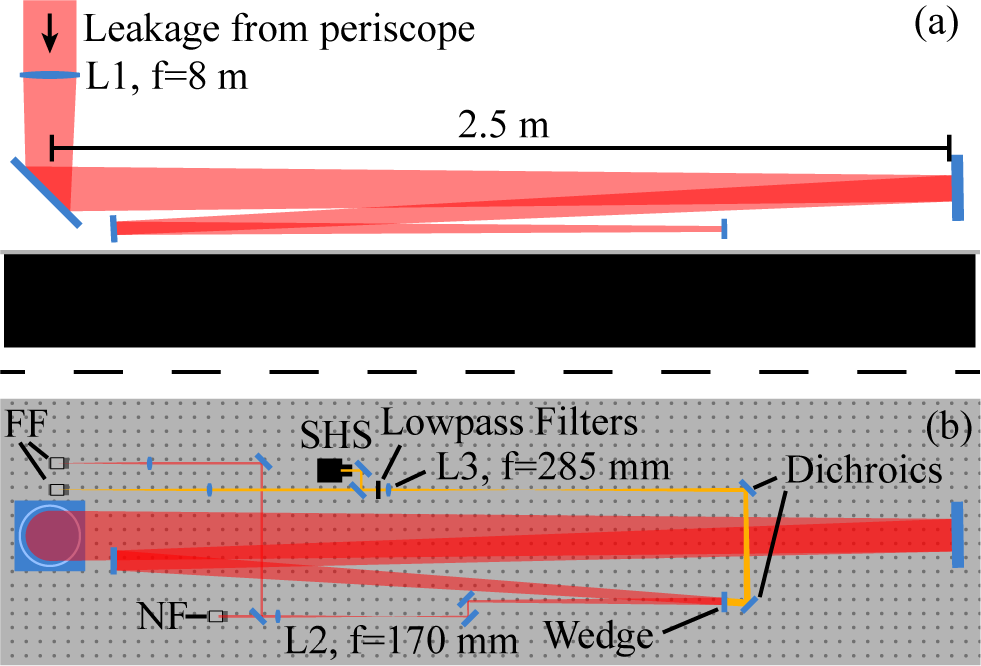
For the sensor setup, we implemented a dedicated beam sensor configuration right before the entrance of the 1 PW compressor (see Figure 8). Leakage light from the main beam was focused by an f = 8 m lens and then collimated. A dichroic mirror, followed by spectral filters, separated the pilot and main beams, allowing for independent diagnostics of each. The fast SHS was placed in the pilot beam arm in the image plane of the DM and was complemented by a far-field (FF) camera. Regular beam diagnostics, including near-field (NF), FF and a slow SHS, were placed in the main beam arm, where the image plane of the WFS matched that of the DM as well to enable direct comparison between the WFs of the two beams.
Sketch of the diagnostic setup prior to the 1 PW compressor from the side (a) and top views (b). The main beam path is shown in red, while the pilot beam path is indicated in orange.
The RTC for the ARTAO system was connected to the fast WFS via a 5 m PCIe copper cable and positioned close to the setup. We used a 50 m long CAT6 ethernet cable to directly connect the RTC and the DM, both of which are located in different rooms within the infrastructure.
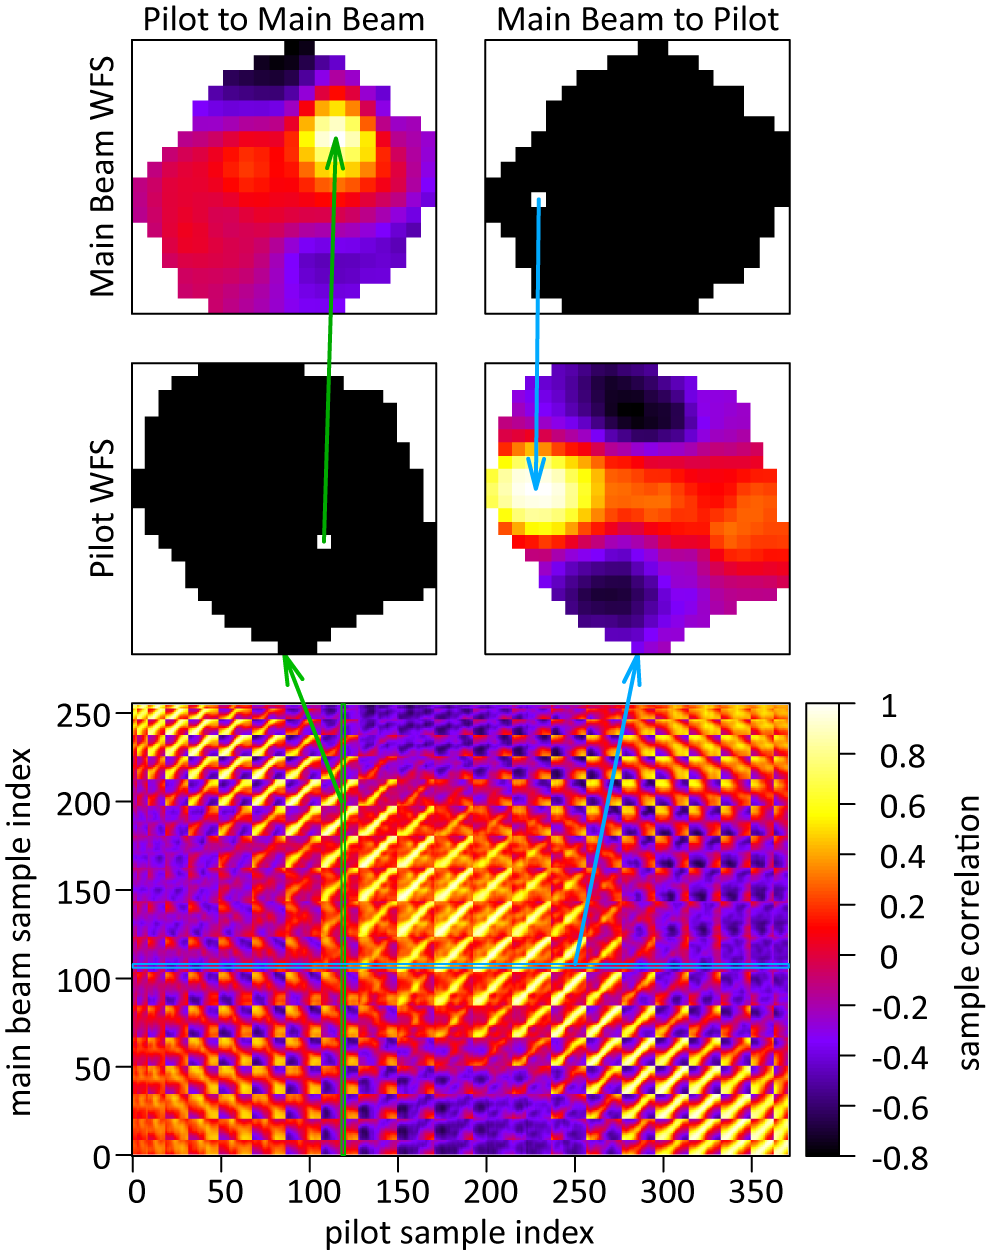
6.2 Pilot beam correlation
Using a pilot beam introduces uncertainties due to the differences in frequency and potential alignment. In order to ensure that running an RTAO loop on the pilot beam benefits the real beam, we investigated the correlation between the two beams. To do so, we simultaneously recorded WFs on both beams using the diagnostic setup.
To determine the mapping from one WFS to the other, we constructed a sample-wise correlation matrix from the recorded sequences, where we subtracted tip/tilt and the mean WF beforehand (see Figure 9). This matrix illustrates how well each WF sample in one WFS space correlates to a specific pixel in the other WFS space. We extracted the positions of maximum correlation, generating a set of point pairs, which we used to fit an affine transformation. This transformation allowed us to convert WFs between the two spaces using linear interpolation. An example frame is shown in Figure 10, with an animated version in the Supplementary Material of this publication.
Bottom: the sample-wise correlation matrix between the WFS of the main beam and the pilot beam over the recorded sequence without tilt and mean WF. Top: example correlation of the main beam WF to a randomly picked location of the pilot WF (left) and vice versa (right). Point pairs for a transformation fit can be extracted from the locations of maximum correlation.
Example of a mapped WF between the main beam WFS (top row) and the pilot beam WFS (bottom row), where the first column is the raw WF, the second one is the mapped WF from the other WFS, and the last column is the difference between the two. Note that the main beam is smaller than the pilot beam, which is why its mapped WF is smaller in the pilot WFS space.
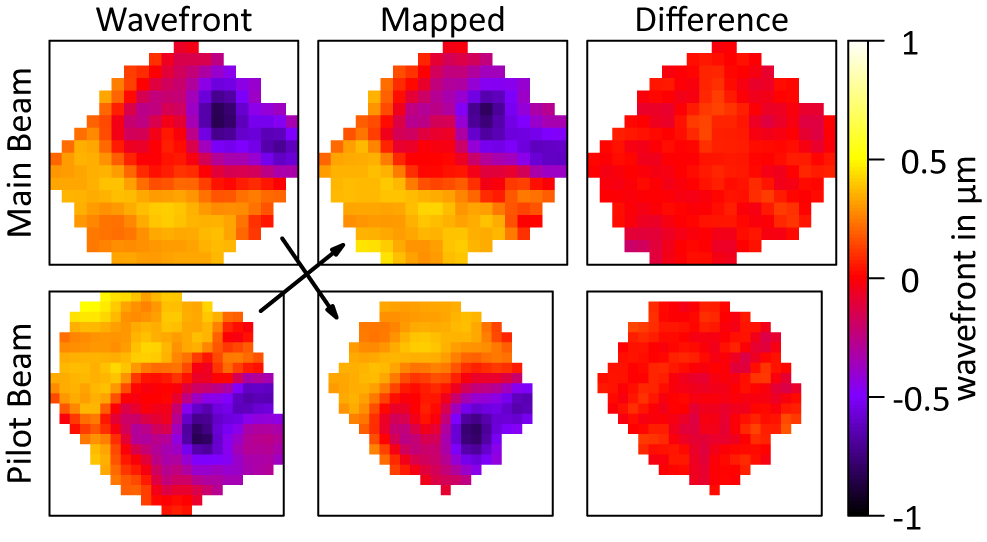
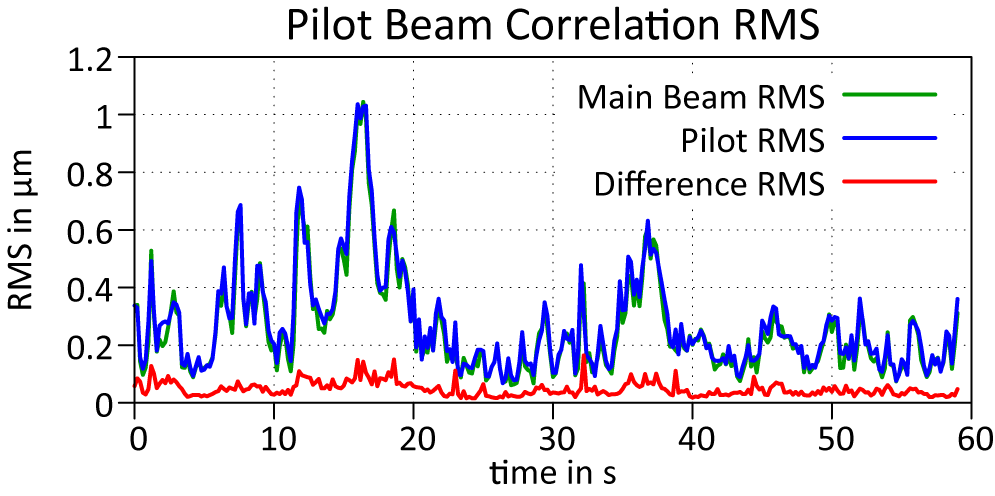
The analysis revealed excellent correlation between the WFs of the pilot and main beams, with errors being both of high spatial order (see Figure 10, right-hand column) and of significantly smaller amplitude than the full beam disturbance (less than 20%, see Figure 11). Potential sources of these errors include imperfect synchronization (the fast SHS was not triggered, estimated at approx. 20 ms accuracy in frame selection), errors in the fitted transformation and linear interpolation inaccuracies. While the precise attribution of these errors to the sources remains uncertain, we consider the overall error magnitude to be sufficiently small to validate the pilot beam concept for this application – especially since the Strehl ratio deficit scales quadratically with the root mean square (RMS) for small aberrations.
RMS of the main and the pilot beam WF, as well as the difference between the two, over a timeframe of 1 minute. The beam was actively disturbed using a hot air source for this measurement.
6.3 Short-term stabilization
To evaluate the short-term stabilization performance of the RTAO system, we conducted a series of experiments under regular operational conditions (i.e., all beam housings in place and air-conditioning systems active). The primary goal was to achieve optimal WF stability by fine-tuning the loop parameters to the environment.
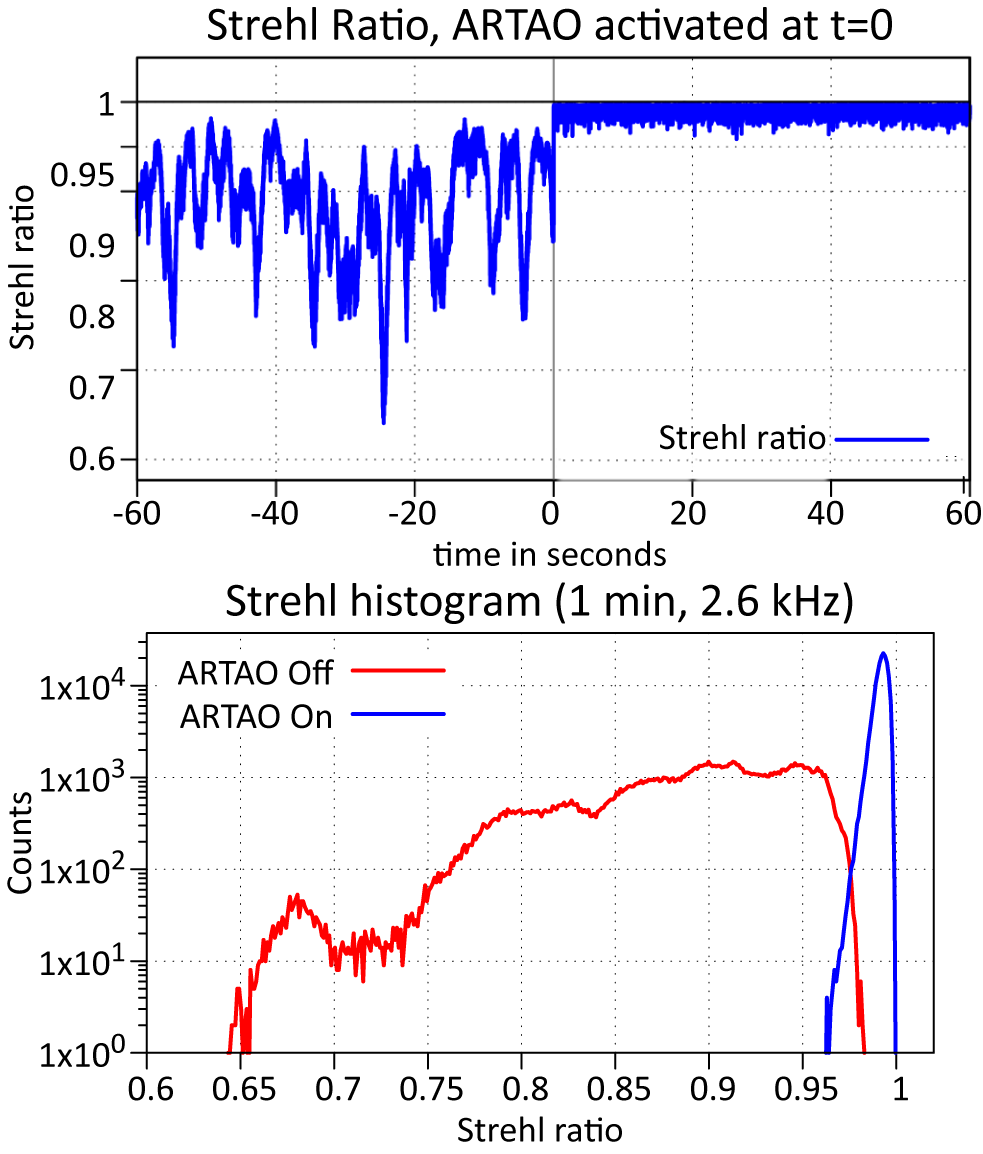
In these experiments, we mainly adjusted the frame rate of the WFS, the tip/tilt gain and the modal gain curves. For each setting, we incrementally increased the feedback gain to the edge of stability. We then recorded a time sequence of WFs of 1 minute prior to closing the loop and continued to record for another minute. From the WFs, we calculated the Strehl ratio via a fast Fourier transform (FFT) of the measured NF, which we used as relative measure for the beam stability. This Strehl ratio obviously only applies if all static aberrations are removed up to the target area and is thus an unrealistic value from the experiment point of view, but it remains useful to build some intuition on the performance of the RTAO loop in terms of achievable stability. The result is shown in Figure 12. The loop exhibits excellent performance on this short timescale, increasing the minimum Strehl ratio from 0.65 to 0.96.
Top: time series measurement of the Strehl ratio (compared to the reference WF, calculated via the FFT of the measured NF) of the pilot beam, where the ARTAO system is activated at t = 0. Bottom: the corresponding data series.
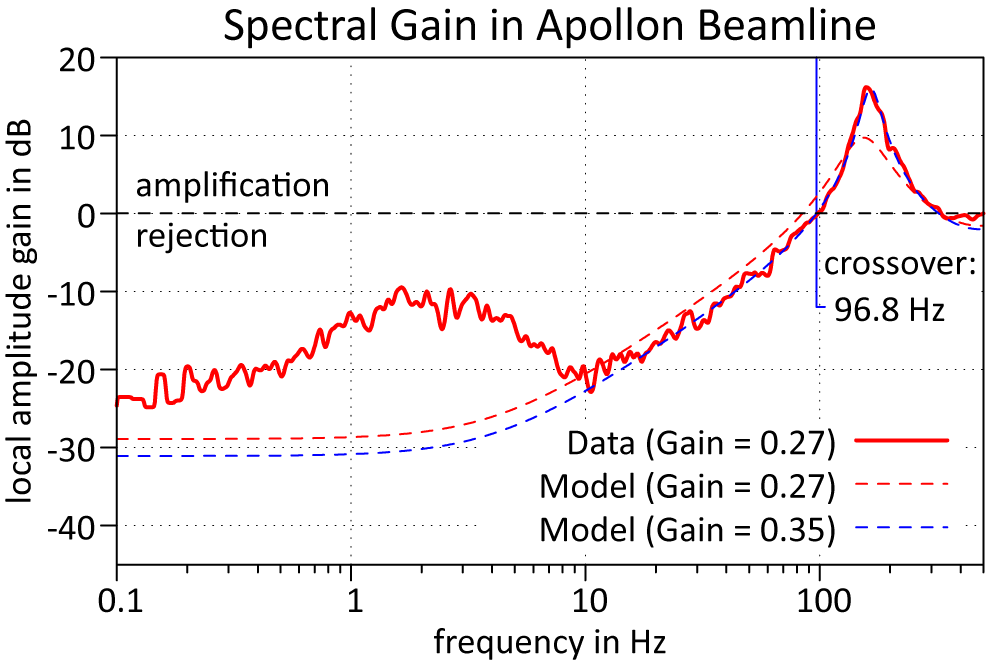
In addition, we calculated the spectral gain curve in order to compare the data to our model. The parameters that we used to obtain the theoretical curves are shown in the right-hand column in Table 1. Two deviations meet the eye. Firstly, the rejection is significantly worse than the model for frequencies lower than 10 Hz. The reason for this is that we characterized the gain based on the actual recorded WFs, where its portion that is not covered by the DM modes remains uncorrected. Apparently, the spatial frequencies feature a maximum in the low-frequency regime, where they are additionally more visible due to the otherwise large rejection of the loop. Secondly, plugging in the actual loop parameters into the model (dashed red curve in Figure 13) does not yield a good overlap in the higher frequency regime anymore. This is likely due to the fact that we applied a modal gain curve to the real-world loop, featuring a significantly higher gain (factor 1.4) for the tip/tilt modes of the DM, which is obviously not reflected by the model. With an empirical upwards correction of the loop gain (0.27 to 0.35, approximately a factor of 1.3, which is in between the base gain and the tip/tilt gain), the model resembles the data well again (dashed blue curve in Figure 13). The crossover frequency at the edge of stability was 96.8 Hz.
Recorded gain curve of the ARTAO system on the pilot beam WF in the Apollon beamline under regular operation conditions, compared with two theoretical curves (dashed lines) with parameters from Table 1. The dashed red curve uses the parameters of the real-world loop, while we tweaked the feedback gain for the blue curve in order to match the data.
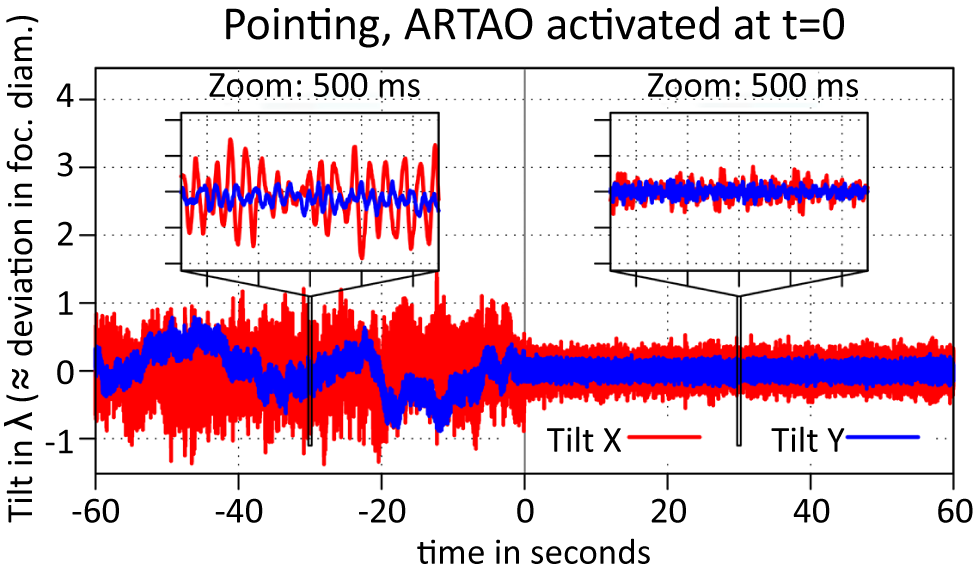
Furthermore, we analyzed the data with respect to the pointing stability of the beam with and without the ARTAO system (see Figure 14). This plot demonstrates that the loop is able to achieve some level of compensation of the pointing instabilities; the limitations of the DM and the loop bandwidth in general become relevant here. The pointing is dominated by an oscillation at around 35 Hz, as shown in the zoomed insert in Figure 14. This is a significant challenge considering the ringing of the first modes of the DM (see Figures 4 and 5) and the oscillations cannot be suppressed effectively, only yielding a peak-to-valley rejection of 50% compared to the open loop. This underlines the necessity to implement a fast steering mirror to outsource this mode to a faster, more rigid system. While this is a project currently underway at the Apollon laser facility, it goes beyond the scope of this work.
Time series measurement of the beam pointing of the pilot beam, where the ARTAO system is activated at t = 0. The tilt X (red) and tilt Y (blue) curves represent the tilt-portion of the recorded WF, relative to the reference, and are given in peak-to-valley in terms of the central wavelength of Apollon laser system, roughly corresponding to the movement of the focal spot in focal spot diameters. The inserts show a zoomed-in portion to illustrate the fast oscillations in the beam pointing.
6.4 Impact of pumping the amplifier crystals
Although we refrained from running the loop while delivering amplified shots due to the risks involved (as discussed in Section 7), we investigated the impact of amplifier pumping on the loop stability: we flashed the amplifiers without a frontend beam while the ARTAO loop was closed on the pilot beam in order to observe any potential effects on the system’s performance.
The results, presented in Figure 15, show the RMS of the measured WF over time, while the ARTAO loop was closed. In the center of the plot, the amplification event occurs. At this instant, the SHS’s spots became saturated due to the amplifier gain at 905 nm. While this saturation did not pose a risk to the camera, it resulted in a presumable erroneous detection of WF tilt. Approximately 2 ms later, the loop reacted to the tilt measurement, attempting to compensate, which led to a noticeable but temporary reaction in the WF. However, the disturbance was insufficient to destabilize the loop, and the WF quickly returned to its optimal state within a few tens of milliseconds – far below the repetition rate of the Apollon laser system or even the frontend of the facility.
Measured RMS of the closed-loop pilot WF during a pump event on the amplifiers. The inserts are the WFs at the times indicated by the arrows.
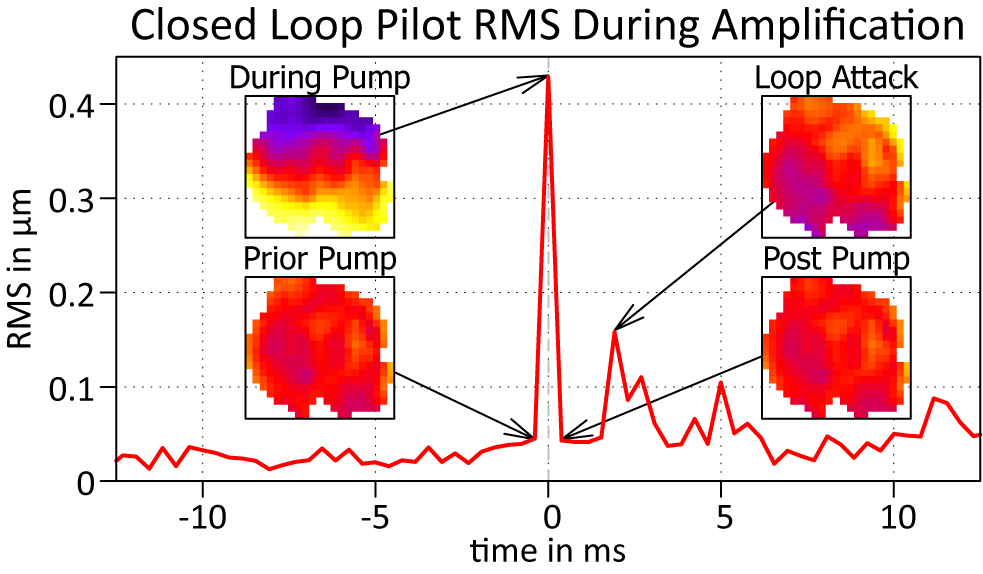
These observations indicate that while amplifier pumping does momentarily affect the WF measurement, the RTAO system is robust enough to quickly recover, maintaining overall stability in the short term.
7 Challenges and future work
While the results described in the previous sections demonstrate significant progress, several challenges remain before RTAO can be considered feasible for high-power laser systems. This section outlines the key issues encountered during testing and proposes steps to address them.
7.1 Long-term stability issues
A critical limitation of the ARTAO system arises when considering long-term stability. Figure 16 shows the evolution of the WF RMS of the pilot beam (relative to the initial reference) over nearly 2 hours of closed-loop operation. While the loop remains stable for the first 30 minutes, isolated instability events occur after this point, increasing in frequency until continuous instability streaks are observed beyond the 1-hour mark. The baseline stability of the WF also degrades slightly over time.
The WF RMS of the pilot beam under closed-loop operation over an extended timeframe. The insert plots are three selected WF frames from stable conditions at the beginning (left) and the end of the recording (center), as well as from a period of instability (right).
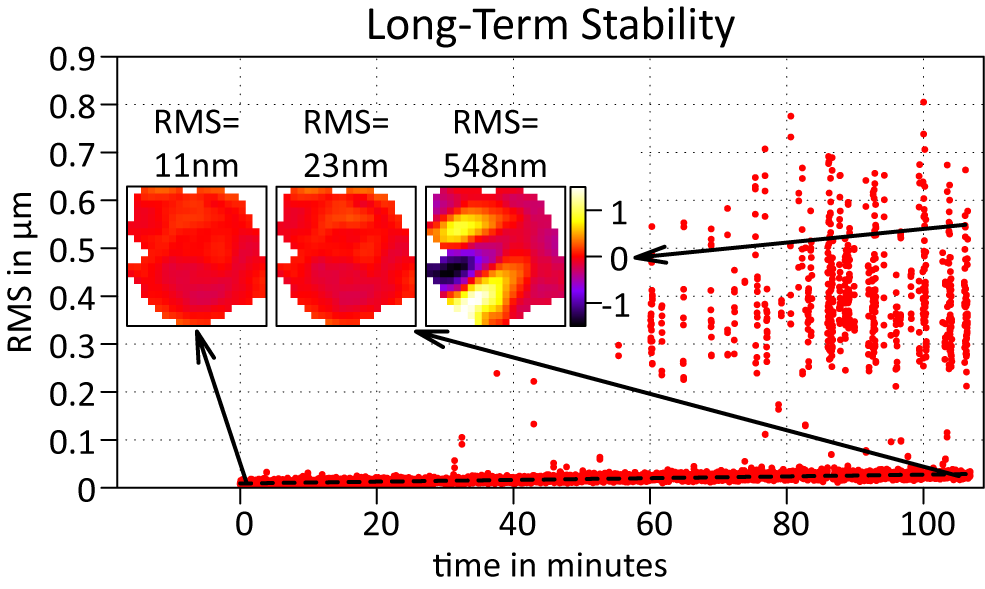
These instability events pose a significant risk for operation, as large DM strokes during these phases can create hotspots in the beam, potentially damaging system optics during shot delivery. The unstable WFs exhibit wave-like structures (Figure 16, right-hand inset) oscillating rapidly over time, strongly suggesting lateral misregistration between the WFS and DM[ Reference Berdeu, Bonnet, Le Bouquin, Édouard, Gomes, Shchekaturov, Dembet, Paumard, Oberti, Kolb, Millour, Berio, Lai, Eisenhauer, Garcia, Straubmeier, Kreidberg, Hönig and Defrère30]. This is likely due to environmental changes, for example, temperature or humidity deforming the beamline slightly and thus shifting the DM image on the WFS over time.
This hypothesis was confirmed when minor manual adjustments to a randomly picked steering mirror outside the DM conjugation plane between the DM and the WFS realigned the DM image position, which in turn restored stability. Thus, implementing a tracking routine to maintain lateral beam alignment on the WFS is a promising countermeasure. This approach will require a sensitive analysis routine to detect beam drift early[ Reference Berdeu, Bonnet, Le Bouquin, Édouard, Gomes, Shchekaturov, Dembet, Paumard, Oberti, Kolb, Millour, Berio, Lai, Eisenhauer, Garcia, Straubmeier, Kreidberg, Hönig and Defrère30].
It should be noted, however, that other sources of instability are still worth consideration. This includes, for example, a drop in illumination on the WFS, software crashes and exceedingly fast vibrations. This implies that a robust machine safety framework is necessary in any case.
7.2 Near-field intensity variations
Another issue arises from the coupling between the pre-compensated WF and the NF intensity. Aberrations introduced in planes not conjugated to the DM lead to pre-compensation effects that couple the WF to NF intensity variations. Depending on the magnitude of the aberrations, this coupling can generate hotspots, reducing the system’s maximum supportable pulse energy. Artificial examples demonstrating this effect are shown in Figure 17, where deliberate large DM strokes, approximately one order of magnitude higher than in regular operation, illustrate the potential for hotspot generation. Such amplitudes do occur for unstable loops, but could also occur for large amounts of pre-compensation, even if the loop remains stable. In this case, experiments may still be feasible at reduced energy, while the impact of the distorted NF and thus the three-dimensional intensity distribution around the focal plane on the target interaction has to be considered for each experiment individually.
Imprints of artificially large DM strokes onto the NF fluence in a non-conjugate image plane, where each NF corresponds to a different set of random actuator positions.
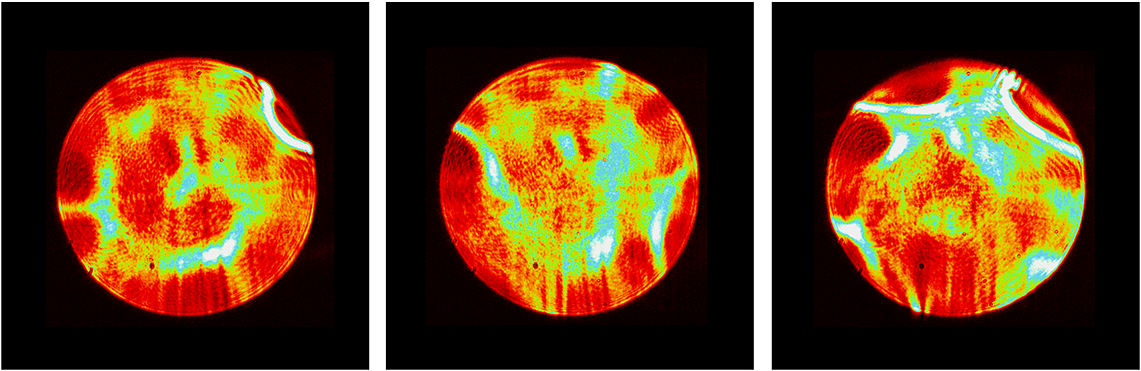
The WF to NF coupling is more pronounced for smaller beam diameters due to stronger WF gradients for the same phase amplitude. Mitigation strategies therefore should focus on reducing pre-compensation stroke magnitudes. Assuming passive aberration mitigation strategies are optimized, two potential solutions emerge.
-
(1) Fast post-compensating DM: Implementing a fast, large diameter DM after the amplifier for direct aberration post-correction. This requires significant hardware development, as larger DMs are slower compared to smaller ones.
-
(2) Cascaded compensation: Employing a fast pre-compensating DM combined with a slower post-compensating DM in the same conjugate plane to form a cascaded control system. This would share the correction load and reduce the required pre-compensation stroke.
Both approaches require further investigation in future work, but in general, reducing and possibly eliminating the pre-compensation amplitude as far as possible is the favorable path.
7.3 Implementation of safety mechanisms
As discussed previously, a malfunctioning RTAO loop poses a severe hazard for high-power laser facilities, with potential damage to compressor gratings reaching millions of dollars, alongside significant system downtime. To safely implement RTAO for shot delivery, robust safety mechanisms are essential. A recommended starting point involves developing a comprehensive interlock system.
-
• Loop-internal interlock: A monitoring subroutine that evaluates control loop parameters in real time. Safety thresholds, such as excessive actuator values or sudden changes in DM shape, trigger an abort signal to the control system.
-
• Loop-external interlock: An imaging system monitoring NF homogeneity in a critical optical plane. Violations of safety thresholds, such as localized intensity spikes or clipping, also trigger an abort signal.
-
• Pre-shot DM freeze: Before each shot, the DM is locked in its current position, halting the control loop. This interval must balance minimal dynamic aberration evolution and sufficient time for external interlocks to perform a final quality check.
7.4 Integration into the laser control system
In addition to ensuring machine safety, integrating the RTAO system into the broader laser control system is essential for operability. While the CACAO code provides a powerful and flexible platform for RTAO, it requires in-depth knowledge of AO concepts, software structure and available commands, making it unsuitable for daily laser operations, where operators need to manage many subsystems simultaneously.
Developing an interface that abstracts common workflows in the CACAO code into few intuitive commands is critical. This interface would allow operators to execute essential tasks without detailed knowledge of the underlying system. The integration effort is an essential step toward making RTAO a practical tool for routine high-power laser operation.
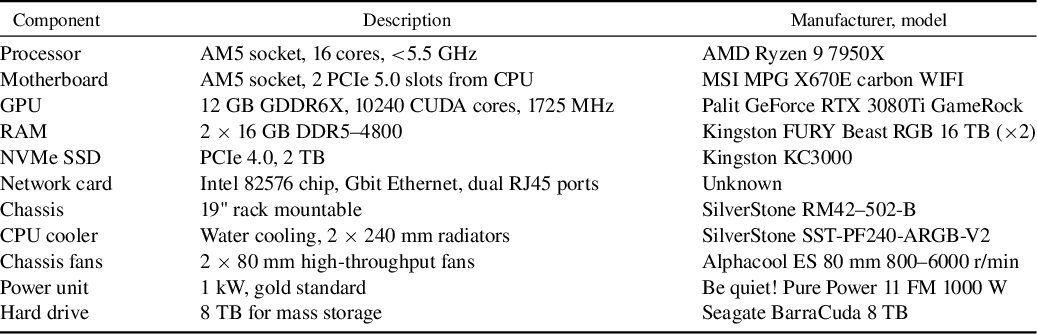
Component list for the RTC used in this work.
RAM, random-access memory; SSD, solid-state drive.
8 Conclusion
This work represents the first implementation of an RTAO system in a high-power laser, demonstrating its potential to significantly enhance beam stability. This advancement enables more repeatable laser shots, reduces experimental error bars and supports higher repetition rates.
The ARTAO system relies on an off-spectral pilot beam. The match between the WFs of the beams was found to be excellent, ensuring continuous WF control for pulsed laser systems. The ARTAO system operates at an acquisition rate of 2.6 kHz and a control speed of 1.3 kHz, achieving a crossover frequency of 96.8 Hz for local WF fluctuations. Short-term stabilization results indicate a guaranteed Strehl ratio of more than 0.96 for a statically fully corrected beam, compared to 0.62 without RTAO, and robust performance during amplifier pumping events.
The feasibility of RTAO has therefore been established. However, several issues remain that need to be resolved before RTAO can be used in daily operation. Firstly, long-term stability is not yet given as beam drifts may lead to lateral misregistration over time, rendering the loop unstable. Secondly, robust machine safety mechanisms, including conjugation tracking systems and interlocks, are essential to prevent shot delivery with suboptimal beam quality, which could damage optics in the beam path. Thirdly, simplified software interfaces are necessary as laser operators need to supervise many subsystems at once, requiring a certain level of abstraction. These next steps will be crucial for advancing RTAO technology in large laser facilities.
Once these issues are solved, RTAO will address critical challenges in high-power laser operations, particularly stabilizing beam quality for experiments sensitive to laser parameters, such as laser wakefield acceleration or the usage of beams with orbital angular momentum. Large laser facilities, including glass-based high-energy systems, can particularly benefit by actively mitigating temperature-induced fluctuations, enabling shorter cool-down times and improved operational efficiency.
In the long term, we expect RTAO to contribute to advancements in the entire field, including applications such as laser particle accelerators, IFE and integrated solutions for commercial laser systems. This may revolutionize beam stability, becoming a new standard in high-power and high-energy laser facilities.
Appendix A. Real-time computer assembly
The components that we used to construct the RTC that we used in this work are listed in Table 2. These are consumer grade components and are available at a relatively low price. The total cost for the RTC, as for the time of writing, is approximately €3000 (compared to tens of thousands for the SHS and DM). The entire setup was heavily inspired by the RTC of the KalAO system[ Reference Hagelberg, Restori, Wildi, Chazelas, Baranec, Guyon, Genolet, Sordet and Riddle27].
It is noteworthy that all available PCIe extension slots are occupied in this setup, so further extensions would require a different choice of hardware:
-
(1) PCI_E1: PCIe 5.0 × 8 (from CPU), occupied by the GPU;
-
(2) PCI_E2: PCIe 5.0 × 8 (from CPU), occupied by the PCIe camera card;
-
(3) PCI_E3: PCIe 4.0 × 4 (from chipset), occupied by an Ethernet card for the DM.
The RTC is running under Ubuntu 20.04 LTS.
Supplementary material
The supplementary material for this article can be found at http://doi.org/10.1017/hpl.2025.16.
Acknowledgements
The authors would like to thank Vincent Deo, Kyohoon Ahn, Bartomeu Pou and Olivier Guyon from the SCExAO team for their support with installing, operating and co-developing the CACAO code, which made this project possible in the first place.
This project has received funding from the EU’s HORIZON-INFRA-2022-TECH-01 call under grant agreement number 101095207.


 Open access