




I. INTRODUCTION
Perovskite-based solar cells (PSCs) are currently the leading contender for low-cost solar power. PSCs have far exceeded the power conversion efficiency (PCE) benchmark for commercialization with certified efficiencies exceeding even 20%. Reference Kojima, Teshima, Shirai and Miyasaka1–Reference Zhao and Zhu6 But significant commercialization barriers remain—most notably improving reproducibility and stability. Reference Zhao and Zhu5,Reference Snaith7 Diverse strategies have improved film morphology of methylammonium lead halide (MAPbX3) perovskites, e.g., increasing crystal grain size (correlated to the strength of x-ray diffraction peaks) and film uniformity (measured by atomic force microscopy). Reference Ito, Tanaka, Vahlman, Nishino, Manabe and Lund8–Reference Chen, Zhou, Hong, Luo, Duan, Wang, Liu, Li and Yang10 However, improved morphology has not directly translated into improved PCE or reduced perovskite degradation, suggesting that the chemical nature of a film plays a significant role. Some recent record-holding perovskite solar cells reduced Reference Burschka, Pellet, Moon, Humphry-Baker, Gao, Nazeeruddin and Grätzel11 or eliminated Reference Jeon, Noh, Kim, Yang, Ryu and Seok2 N,N-dimethylformamide (DMF) and showed corresponding improvement in reproducibility and stability, suggesting that DMF may be related to the underlying causes.
Covalent chemical reactions have already been proposed to be involved in perovskite degradation, but only with respect to reactions with water or oxygen. Reference Kim, Williams, Cho, Chueh and Jen12–Reference Leijtens, Eperon, Pathak, Abate, Lee and Snaith14 When considering the reactivity of many components present in perovskite solar cells, such as TiO2, Reference Schneider, Matsuoka, Takeuchi, Zhang, Horiuchi, Anpo and Bahnemann15–Reference Henderson17 DMF, Reference Øpstad, Melø, Sliwka and Partali18,Reference Bipp and Kieczka19 MAI, Reference Niu, Li, Meng, Wang, Dong and Qiu20 PbI2, water, Reference Lebleu, Kotsuki, Maddaluno and Legros21 or HI, Reference Allen, Atkinson and Williams22 we wondered whether additional covalent chemical reactions might be at work during perovskite formation. We turned to time-of-flight secondary ion mass spectrometry (TOF-SIMS), the chemical microscope, to identify changes in chemical composition of perovskite films.
We present a reaction of DMF that occurs during perovskite film formation, but that has gone un-noticed until now. TOF-SIMS identifies dimethylamine (DMA) after film formation, which we propose is a product of transamidation of DMF (Fig. 1). DMA is present in films formed by two representative methods of perovskite solar cell film preparation that use DMF (two-step sequential deposition and one-step spin-coating), suggesting that the reaction is generally applicable when DMF is used. But DMA is not present in perovskite formed without DMF (single crystal, and solvent-less vapor deposition of perovskite films), correlating with improved stability when DMF is not used. We confirmed the presence of DMA by x-ray photoelectron spectroscopy (XPS) and x-ray diffraction (XRD), and suggest how DMA might influence stability or degradation.
Catalyzed transamidation produces DMA from DMF that is incorporated into perovskite crystals. (a) In the environment of perovskite solutions methylamine can attack the carbonyl carbon of DMF, displacing DMA. DMA can then be incorporated in to perovskite crystal. (b) Catalyzed transamidation reaction between DMF and methylamine. (c) Mechanism for transamidation of DMF by TiO2 catalyst. (d) Corresponding proposed reaction catalyzed by PbI2 starting from the DMF*PbI2-complex.

II. EXPERIMENTAL
A. Materials
Lead(II) iodide (99%), lead(II) chloride (98%), and DMF (99.8%, anhydrous), and aqueous of H3PO2 (9.14 M) were purchased and used as received from Sigma–Aldrich. Methylammonium iodide was synthesized from 33 wt% methylamine in absolute ethanol (Aldrich) and hydroiodic acid (Tokyo Chemical Industry Co., Ltd., 57 wt%) according to literature procedure and purified by recrystallization. Reference Lee, Teuscher, Miyasaka, Murakami and Snaith23 Formamidinium iodide (FAI) was purchased and used as received from Dyesol.
Fluorine-doped tin oxide (FTO) films on 2 mm thick glass substrates (TEC-7, Pilkington, UK) were coated by spray pyrolysis of TiO2 from titanium(IV)isopropoxide (97%, Aldrich) and acetylacetone (99%, Sigma–Aldrich) in anhydrous ethanol, according to literature procedure. Silicon wafers (SAMCO Inc, Japan) were n-type, Sb-doped, 0.013 Ω-cm.
B. Perovskite preparation
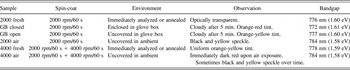
The perovskites analyzed in this work were prepared by the following methods: (i) single crystal growth by aqueous solution (no DMF); (ii) perovskite film preparation by two-step sequential deposition—dipping PbI2 films into MAI solution (DMF present), which were chemically analyzed by TOF-SIMS and were also confirmed to be similar to the literature Reference Burschka, Pellet, Moon, Humphry-Baker, Gao, Nazeeruddin and Grätzel11 by fabricating and characterizing solar cells; (iii) spin-coated perovskite film preparation under several processing conditions (Table I) using solutions with a 3:1 ratio MAI:PbI2 in DMF, which is the same ratio used in some recent high-performing PSCs Reference Zhou, Chen, Li, Luo, Song, Duan, Hong, You, Liu and Yang3 ; (iv) film preparation by chemical vapor deposition (no DMF); and (v) film preparation by hybrid deposition under vacuum (no DMF).
Sample treatment conditions for films presented in this manuscript that were prepared by one-step spin coating.
1. Solution preparation of crystals of MAPbI3 (no DMF)
Aqueous hydrogen iodide (6.8 mL, 7.58 M) and aqueous of H3PO2 (1.7 mL, 9.14 M) were mixed. The mixed solution was added into a 200 mL 2-necked round bottom flask. Nitrogen gas was bubbled through the solution for 1 min. We kept the solution under a nitrogen atmosphere throughout the experiment. The solution was heated to 120 °C using a stirred oil bath. Subsequently, PbI2 (462 mg/mL, 1 M) was added to the solution. PbI2 dissolved to form a yellow solution. MAI (159 mg/mL, 1 M) was then also added to the solution. After 4 h, we stopped stirring and let the solution cool to room temperature. After cooling, 1 mL of 2-propanol was gradually added to the solution. After 1 week, black crystals precipitated. We filtered and washed the crystals with anhydrous ethanol. The procedure was modified from the literature. Reference Stoumpos, Malliakas and Kanatzidis24
2. Two-step perovskite and solar cell confirmation (DMF)
PbI2 (1 M in DMF, 70 °C) was spin-coated on mesoporous TiO2/compact TiO2/FTO/glass substrates at 500 rpm for 5 s, followed by 6000 rpm for 20 s. After drying for 3 min at 40 °C and then 10 min at 100 °C, the samples were dipped in MAI solution (10 mg/mL) in IPA and dried by spinning on the spin-coater at 500 rpm for 5 s, 1500 rpm for 10 s, and then 3000 rpm for 20 s. The perovskite films were then dried for 15 s at 150 °C. Reference Burschka, Pellet, Moon, Humphry-Baker, Gao, Nazeeruddin and Grätzel11 Drying at 150 °C should remove the remaining DMF and terminate the reactions we discuss in the manuscript. Films were stored under nitrogen until analysis, or in the case of solar cell fabrication, until the hole extraction layer and gold electrodes were deposited as described below.
When devices were fabricated, 59 mM of 2,2′,7,7′-tetrakis(N,N′-di-p-methoxyphenyl-amine)-9,9′-spirobifluorene (spiro-MeOTAD), 172 mM 4-tert-butylpiridine (tBP) and 32 mM lithium bis-(trifluoromethylsulfonyl)imide salt in chlorobenzene was spin-coated on the perovskite film as the hole extraction layer and gold was thermally evaporated through a contact shadow mask for the top electrode [Fig. 2(a)]. Reference Raga, Jung, Lee, Leyden, Kato and Qi25 Solar cell current–voltage (i–V) response was measured using a Newport Oriel Sol 1A solar simulator (Newport Corp., Bozeman, Montana) with 1-sun (AM 1.5 G, 100 mW/cm2) illumination. The intensity varies within ±5% of the calibrated value, which is comparable to the original article. The i–V curve was measured at a scan rate of 0.1 V/s in the reverse direction (1.2 V to 0 V).
Transamidation of DMF produces DMA that is incorporated into high-efficiency PSCs. (a) PSC structure of FTO/compact-TiO2/MAPbI3 (two-step solution deposition)/spiro-MeOTAD/Au. (b) Response curves and histogram of PCE percentages for solar cells that have DMA incorporated into the perovskite. V oc, J sc, and Fill Factor averages with standard deviations were respectively, 1.04 ± 0.02 V, 18.5 ± 1.3 mA/cm, and 69.3 ± 1.9. One high-efficiency cell reached 14.8% PCE.
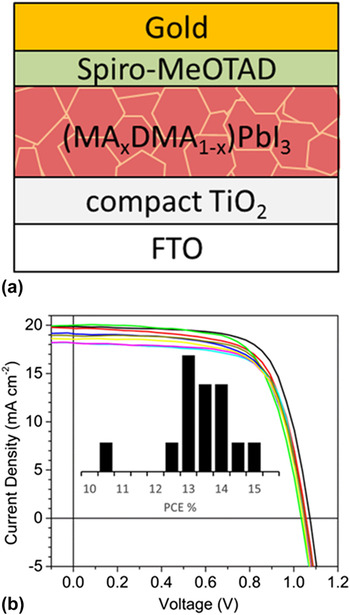
We found the cells performed comparably based on the characteristics published in the original paper. Reference Burschka, Pellet, Moon, Humphry-Baker, Gao, Nazeeruddin and Grätzel11 Measured power conversion efficiencies were 13.4 ± 1% with a champion cell of 14.8%. The average short-circuit current (J sc), open-circuit voltage (V oc), and fill factor (FF) were 18.5 mA/cm2, 1.04 V, and 69%, respectively, based on statistical analysis of 14 cells [Fig. 2(b)]. Although not reported in the original work, our cells exhibited hysteresis. The average of forward and reverse scans for the highest performing cell was 11.3%.
3. Preparation, treatment, and annealing of spin-coated MAI:PbI2 films (variable DMF)
We prepared solutions of 3:1 molar ratio of MAI:PbI2 in DMF. The PbI2 molarity in the solution was 0.87 mol/L. The solutions were spin-coated on 12 × 12 mm compact TiO2-coated 2 mm thick FTO/glass substrates at 2000 rpm for 60 s with or without a second step of 4000 rpm for 60 s. After preparing the films on the substrates, samples were carefully subjected to a variety of conditions before annealing. The conditions were: spin-coating at 2000 rpm for 60 s and starting annealing or analysis in less than 5 min from spin-coating (2000 fresh); spin-coating at 2000 rpm for 60 s and then enclosing in a Petri dish in the N2 glove box for 25 min (GB closed); spin-coating at 2000 rpm for 60 s and then placing the sample in an open Petri dish in the N2 glove box for 25 min (GB open); spin-coating at 2000 rpm for 60 s, and then placing the sample in an open Petri dish in class 100 clean room environment with fluorescent lighting for 25 min (2000 air); spin-coating at 2000 rpm for 60 s, followed by 4000 rpm for 60 s, then immediately analyzing or annealing (4000 fresh); and spin-coating at 2000 rpm for 60 s, followed by 4000 rpm for 60 s, and then placing the sample in an open Petri dish in class 100 clean room environment with fluorescent lighting for 25 min (4000 air). At the end of preparation and any treatment, samples were transferred to the analysis instrument and analysis was begun in less than 5 min from the end of spin-coating (2000 fresh or 4000 fresh) or the end of the respective environmental treatment. Samples from the glove box were transferred in a sealed container to maintain the nitrogen environment and covered in aluminum foil to protect the samples from light. Identically prepared samples were annealed on a hotplate in a nitrogen glove box or in the open lab before analysis to mimic the variety of PSC annealing conditions in the literature (Table I).
4. CVD preparation of FAPbI3 films (no DMF)
Perovskite films were grown in a two-step process where lead chloride was first deposited onto substrates, followed by CVD deposition of FAI which converted the film to perovskite. Reference Leyden, Ono, Raga, Kato, Wang and Qi26 Perovskite films were prepared by depositing a 100 nm layer of lead chloride onto substrates by thermal evaporation (at 2.0 × 10⁻² Pa, approximately 0.1–0.4 Å/s, using PbCl2 powder). Substrates predeposited with PbCl2 were loaded into a 2-zone CVD furnace, where the first zone was loaded with ∼1 g of solid FAI powder and the second zone with substrates. Substrates were ramped up to 120 °C, and then FAI was ramped to 180 °C.
5. Vacuum preparation of MAPbI3 films using hybrid deposition (no DMF)
MAPbI3 films were prepared by thermal evaporation of PbI2 and MAI in a custom hybrid deposition method Reference Ono, Wang, Kato, Raga and Qi27,Reference Wang, Ono, Leyden, Kato, Raga, Lee and Qi28 or multi-source multi-layer deposition vacuum chamber. To achieve both thick films and uniformity, two wide mouth crucibles are used for evaporating the source materials. A heat shield between the two sources minimizes thermal “cross-talk” by blocking radiative heat transfer. Two thickness monitors independently monitor the evaporation rate of PbI2 and MAI during hybrid deposition. Direct flux of MAI is blocked by a shutter to improve film uniformity. We optimized the perovskite deposition conditions by preparing several batches of perovskite films grown with different relative nominal rates of PbI2: MAI deposition to identify the evaporation conditions that give strong XRD peaks for the perovskite structure, while also minimizing the peak intensities for MAI and PbI2.
C. Sample analysis
1. Time-of-flight secondary ion mass spectrometry
TOF-SIMS data were obtained using a PHI Trift V nanoTOF (ULVAC-PHI Inc., Japan) instrument using 60 keV Bi3 ++ (30 keV applied potential) ion beam. The DC current was 2.0 nA for the analysis beam. Raster scans of 100 × 100 μm were used for spectra and image collection. An argon cluster beam Ar2500 + at 10 keV scanned over 400 × 400 μm areas at 3.5 nA was used for sputtering during depth profiling. Both positive and negative spectra were acquired for single-crystal MAPbI3, CVD-prepared FAPbI3, and two-step solution-processed MAPbI3 films.
2. X-ray diffraction with in situ annealing
We measured XRD with a Bruker D8 Discover instrument (Bruker AXS K. K., Tokyo, Japan) using Cu Kα source X-rays. The instrument is equipped with Pathfinder 0D and Vantec-500 2D detectors, in addition to an Anton-Paar DHS-1100 heating stage. Samples were annealed in air on the XRD heating stage so that spectra could be obtained in situ. Surface temperatures for the annealing process were calibrated on a TiO2/FTO/glass substrate using a low-mass, thin wire, type K thermocouple pressed against the substrate's top surface. Each surface temperature was paired to the stage temperature for a specific ramp rate. High-resolution XRD θ–2θ scans were acquired prior to annealing and also after ramping to 110 °C.
High and low resolution spectra provided accurate peak identification while also minimizing atmospheric exposure. Peak positions were determined with 0.02° sampling and dwell times of 200 ms between 5 and 65°. On some sample replicates, quick 0.1° resolution scans with dwell times of 100 ms allowed sample scanning to complete in less than 5 min from preparation and within only a two minutes of atmospheric exposure.
For in situ XRD during annealing, quick scans at 0.1° sampling intervals and shorter ranges of 5–32° or 7–17° minimized the temperature ramping time. Samples were annealed in air in the dark on the XRD heating stage with a constant temperature ramp from room temperature to 110 °C (calibrated) at which point a fine XRD scan was measured again. The samples were further annealed at (nominal) 110 °C, or alternatively heated to 130 °C and annealed, in air for at least 20 min. Temperature ramp rates of 2° per minute are presented in the manuscript, but similar results were obtained with ramp rates of 60° per minute. Crystallographic changes over time with air exposure were also recorded for some samples. From a single solution, the spectra were very similar as long as the time was minimized for getting the samples mounted on the XRD stage. As long as the ratios among PbI2, MAI, and DMF were maintained, then the results were comparable for different solutions.
3. UV–visible spectroscopy
Absorbance spectra were measured with a Thermo Scientific Evolution 600 UV–vis spectrometer (Thermo Electron Scientific Instruments LLC, Madison, Wisconsin) in transmission mode. Transmission for spin-coated films was compared to transmission of a sample with only mesoporous TiO2 and without any perovskite.
4. X-ray photoelectron spectroscopy
XPS analysis was performed using a Kratos Ultra DLD instrument (Kratos Analytical Ltd., Manchester, United Kingdom) with monochromated Al Kα (hν = 1486.6 eV) x-rays and a multi-channel plate detector with a 180° hemispherical analyzer. Binding energy was calibrated against the Au 4f (83.95 eV) and Cu 2p (932.65 eV) peaks on standard samples. Reference Moulder, Stickle, Sobol and Bomben29 Survey and fine scan spectra were acquired for each sample. If the films were electrically insulating, charge compensation was used. The atomic ratios were calculated based on integrated area under the XPS peaks and the sensitivity factors from the Kratos element library for CasaXPS. The atomic percent of oxygen, carbon, nitrogen, and iodine were divided by the percent of lead, enabling direct comparison to perovskite stoichiometric ratios. Integration of I 3d peaks was 76% of that for integration of I 4d peaks. The intensity of the I 4d peak was closer to what was expected based on stoichiometry, so it was used instead of the I 3d peaks. In perovskite materials there may be a significant deviation from standard sensitivity factors for one or both of the iodine peaks. Only I 3d data were acquired for 2000 fresh and GB closed spectra so for these samples the iodine intensity was scaled to compare to I 4d data. If the I 3d values are actually more correct, then the fundamental conclusions of the manuscript would be unchanged, but it would indicate that iodine can be lost independent of MA. In that case, the chemistry would be even more complicated than what is presented here.
III. RESULTS
A. TOF-SIMS identification of DMA and NMF
TOF-SIMS can conclusively identify molecular components in films or on surfaces. Primary ions impact a surface, ejecting secondary ions with specific mass-to-charge ratios (m/z) representative of the surface composition. Gentle ionization by cluster ions enhances the signal from both the molecular ion and also the fragments, allowing identification of each molecule ejected from the surface. Time-of-flight mass accuracy allows exact determination of the molecular formula. The pattern of relative abundances for each fragment ion provides a mass spectral fingerprint that eliminates any remaining ambiguity with respect to an ion's identity.
We first show the TOF-SIMS spectra of single-crystal perovskite (SC-MAPbI3) grown in a DMF-free solution as an example of the mass spectrum of pure perovskite [Fig. 3(a)]. The spectrum shows a strong peak from the methylammonium parent ion (m/z = 32.049) and its associated fragments. The spectrum is clean with only the expected peaks.
Transamidation of DMF produces DMA that is incorporated into perovskite. TOF-SIMS spectra for: (a) Single-crystal MAPbI3 prepared without DMF exhibiting no DMA-related peaks; (b) Two-step DMF solution-processed, MAPbI3 films, including both DMA and methylammonium (MA) ions; and (c) Mass spectral peaks from the film samples at the exact masses of DMA, DMF, and the byproduct of DMF transamidation, N-methylformamide (NMF). The * denotes sodium ions that are present at trace levels, but that sometimes appear prominently due to a high ion yield for sodium.

We fabricated films with a two-step process—identical to those used for solar cells, which performed the same as the solar cells in the published literature Reference Burschka, Pellet, Moon, Humphry-Baker, Gao, Nazeeruddin and Grätzel11 —and analyzed them by TOF-SIMS to understand their chemical composition. Spectra from the two-step perovskite films include the same MAI peaks from the single-crystal spectrum [Fig. 3(b), Film-MAPbI3]. However, DMF solvent (m/z = 74.016) can also be observed at a low intensity demonstrating that DMF can still remain after annealing.
The biggest surprise, however, is a strong peak from [C2H8N]+ (m/z = 46.065). The mass and fragments only match database spectra for DMA. Reference Stein, Linstrom and Mallard30 Another unexpected molecule, N-methylformamide (NMF) [Fig. 3(c)] is also present at a similar level to DMF. DMA and NMF are the products of transamidation. Decomposition or carbonylation (see Supplementary Material section and Figs. S1–S3) could also produce DMA from DMF, but would not produce NMF. Transamidation produces a significant amount of DMA in perovskite solar cells.
The two-step method used less DMF than previous methods and produced record PSCs that are still among the best examples in the literature. However, they include a significant impurity—DMA. Assuming similar ionization efficiencies for both amines, a rough estimate might suggest 10% DMA relative to MA. This is a significant contribution to the composition of the perovskite films.
B. Crystal phases in perovskite films
Residual DMF produced different crystal structures, or phases, but they were only apparent before the films were annealed to at least 120 °C. We performed in situ XRD analysis on samples with excess DMF and methylamine to more clearly observe the effects of transamidation. We prepared films with excess MAI (3:1 MAI:PbI2) similar to some of the first high-efficiency perovskite solar cells. Reference Zhou, Chen, Li, Luo, Song, Duan, Hong, You, Liu and Yang3 We acquired XRD spectra before and after annealing [Figs. 4(a) and 4(b), also S2]. Films were spin-coated at low speed (labeled 2000 fresh and 2000 air) to reduce evaporation of DMF or at higher speed (labeled 4000 fresh) to enhance evaporation of DMF. This allowed us to compare the effect of DMF. The effect of air exposure over 30 min was studied in samples labeled 2000 air, the rest were processed under dry N2. Other conditions after the spin-coating were also studied (Tables I and S1). Our spin-coated films show clear differences among all conditions within 30 min; the differences were captured by UV–vis absorption spectra (Fig. S4).
XRD spectra of films prepared with excess DMF and MAI (a) before annealing and (b) after annealing. P, D, and W mark respective peak positions for MAPbI3 perovskite, DMF*PbI2 complex, and (MA)4PbI6*2H2O complex. Sample 2000 fresh was spin-coated at 2000 rpm before measurement and annealing. Sample 2000 air was prepared at 2000 rpm and then left in ambient air before XRD and annealing. Sample 4000 fresh was spin-coated at 4000 rpm to remove DMF solvent. The final perovskite peaks shift to a lower angle unless the films are exposed to air.

XRD revealed four principal crystal structures (Figs. 4 and S2). Three of the structures observed by XRD are present prior to annealing and have been described previously: perovskite, water complex, and DMF complex. The perovskite structure, which we identify in the figures with “P”, is well known in the literature. The MAPbI3 perovskite structure has two main peaks at 14.1 and 28.3° when measured by Cu Kα X-rays, corresponding to a d-spacing of 6.28 Å. Reference Stoumpos, Malliakas and Kanatzidis24,Reference Baikie, Fang, Kadro, Schreyer, Wei, Mhaisalkar, Graetzel and White31 The water complex, which we have marked with “W”, refers to (MA)4PbI6*2H2O. Reference Christians, Miranda Herrera and Kamat32–Reference Vincent, Robertson, Cameron and Knop34 The water complex requires 4 methylammonium ions to each lead atom and appears in films exposed to humid air when excess MAI is present [W; Figs. 4(c) and S5]. The third known structure is a 1:1 complex between the solvent DMF and PbI2 (DMF*PbI2-complex) Reference Wakamiya, Endo, Sasamori, Tokitoh, Ogomi, Hayase and Murata33 ; we marked its peaks with “D”.
C. Phase transformations
In situ XRD during the annealing process [Fig. 5(a)], shows the phase transformations in the films prepared with excess DMF and MAI. We found that the basic structures in the perovskite films transform through two discrete processes during annealing, one DMF-related, and the other water-related [Fig. 5(c)]. Both of the processes and their related structures can be observed during annealing of a freshly prepared film spin-coated at 2000 rpm [Fig. 5(b)].
Controllable transitions between structures in perovskite films. (a) Graphic showing the in situ XRD setup. The samples are heated from the rear similar to typical annealing conditions, while XRD spectra are repeatedly scanned at each temperature. (b) In situ XRD spectrum versus temperature for a sample spin-coated at 2000 rpm and immediately annealed (2000 fresh in Fig. 4). Horizontal axis is 2θ angle. Vertical axis shows annealing temperature. Grayscale value is XRD intensity. Crystal structure transitions occur at around 40–55 °C and 85–95 °C, observable by the disappearance of some peaks and appearance of others. (c) Diagram of the structural transitions with water-complex processes on the left and DMF-complex processes on the right.

During annealing a transition is observed at around 85–95 °C. This DMF-related transition is clearly observed by in situ XRD for films that were annealed with residual DMF [Figs. 4(b) and S6]. When DMF was not retained in the film or not used (Figs. S7 and S8), this transition is minimized or eliminated. A transition at this temperature can explain why temperatures higher than 90 °C, often 100 °C, have been preferred for successful annealing of perovskites. Reference Kim, Williams, Cho, Chueh and Jen12–Reference Leijtens, Eperon, Pathak, Abate, Lee and Snaith14,Reference Raga, Jung, Lee, Leyden, Kato and Qi25,Reference Yan, Long, Zhang, Wei, Chen, Yang and Xu35–Reference Yu, Wang, Xie, Li, Chen and Zhao40 At around 90 °C, the DMF complex (D) disappears concomitant with the appearance of perovskite peaks [P, Fig. 5(b)]. A new minor component also appears that is discussed in the Supplementary Material (Fig. S2). Curiously, the perovskite peaks that appear during this transition occur closer to 14.0 degrees rather than the 14.1 degrees that is typical for perovskite. A 0.1 degree shift is consistent with a slightly larger crystal unit cell, similar to what is observed when some methylammonium is replaced by formamidinium, Reference Stoumpos, Malliakas and Kanatzidis24,Reference Baikie, Fang, Kadro, Schreyer, Wei, Mhaisalkar, Graetzel and White31,Reference Eperon, Stranks, Menelaou, Johnston, Herz and Snaith41 which has a molecular size similar to DMA. DMA is naturally incorporated as a minor component in PSC films in the same fashion as MA, ethylammonium, or formamidinium. Reference Eperon, Stranks, Menelaou, Johnston, Herz and Snaith41,Reference Im, Chung, Kim and Park42
During annealing the lower temperature transition occurs at 40–55 °C, as part of the water-related process. The water complex (W) merges with the perovskite phase (P) into a new transient structure (T). The T structure has not been reported in the literature, which is not surprising because it reverts to P + W at room temperature. Instability at room temperature makes observation of the structure less likely.
The transient phase (T) is not stable at room temperature and is reversible with heating and cooling (Fig. 6). The transient phase is observed without DMF present, so it is not related to chemical reactions of DMF. When heated to form the transient phase, the film darkens, but reverts to transparency upon cooling [Fig. 6(a)]. XRD shows the return of the W and P peaks upon cooling [Fig. 6(b)]. However if the film is heated at 125 °C, for 30 min—conditions under which both excess water and also excess methylammonium halide can be lost Reference Raga, Jung, Lee, Leyden, Kato and Qi25,Reference Unger, Bowring, Tassone, Pool, Gold-Parker, Cheacharoen, Stone, Hoke, Toney and McGehee37,Reference Xie, Zhang, Su, Ren, Wong, Grätzel and Choy43 –then films retain only the perovskite structure and are stable at room temperature. The XRD spectrum converges to stable perovskite [Figs. 4(b) and S2]. See Supplementary Material for more information. High-quality, oriented, crystalline films were confirmed by measuring off-axis peaks with 2D-XRD (Fig. S9).
Reversible P + W ↔ T ↔ P transition in films with excess MAI is reversible until heated long enough to evaporate excess MAI. (a) Images of reversible conversion after heating and cooling a film with excess MAI prepared by vacuum deposition of PbI2 and MAI. (b) Ex situ XRD on the film in (a) that was heated to successively higher temperatures, but measured at room temperature. Until the sample is heated above 120 °C (nominal heating surface temperature ∼125 °C), the film reverts to the P + W crystal structure at room temperature. * denotes FTO substrate peaks. (c) In situ XRD on a 4000 fresh film with excess MAI, but presumably without excess DMF. The horizontal axis is 2θ degrees from XRD, while the vertical axis is temperature in °C, and the value indicates the intensity of the XRD line (dark = more intense). After annealing above 50 °C and then to 60 °C, the P + W transition to T is observed. Above 120 °C, the spectrum converges again to a perovskite that is stable at room temperature.

The temperature at which the transient phase appears is already associated with a known phase transition to cubic MAPbI3. Reference Onoda-Yamamuro, Matsuo and Suga44,Reference Wasylishen, Knop and Macdonald45 During the transition to cubic, the higher temperature allows bonds to weaken and the inorganic Pb–I cage relaxes and allows the methylammonium ions to rotate freely. Alternatively, if the long axis of the orthorhombic Pnma perovskite Reference Baikie, Fang, Kadro, Schreyer, Wei, Mhaisalkar, Graetzel and White31 unit cell were to lengthen by about 2.3 Å relative to pure MAPbI3, such a structure would produce the main peaks of the transient structure at 12.0 and 14.4°. This expanded structure could house two organic cations. The water complex (4:1 MA+:Pb2+) might donate MAI to perovskite (1:1 MA+:Pb2+), merging into an orthorhombic structure with excess alkylammonium cation (2:1 MA+:Pb2+, Fig. S12). Neither the water complex nor the transient structure could form without excess MAI, which is consistent with our XRD observations.
D. Chemical characterization by XPS
The relative composition changes due to MAI loss and DMA insertion by transamidation [Fig. 7(a)] were observed with XPS. For samples similar to those presented in Fig. 4 with a 3:1 starting ratio of MAI:PbI2 (additional MAI to retain DMF more readily and enhance transamidation), the films initially have five iodine, three carbon, and three nitrogen atoms for each lead atom. These initial atomic ratios relative to lead are marked in Fig. 7(b) as horizontal purple, red, and green bars, respectively, to compare to the compositions as measured by XPS (the solvent DMF is not included). The initial composition deviates significantly from stoichiometric perovskite. However, as others have noted, and as we illustrate here, optimized annealing evaporates excess MAI, moving the composition toward stoichiometric perovskite.
The effects of MAI loss and transamidation are observed by XPS. (a) MAI loss reduces carbon, nitrogen, and iodine equally, while transamidation increases the amount of carbon relative to nitrogen. (b) XPS atomic ratios. Blue diamonds, red squares, green triangles, and purple circles represent atomic ratios relative to Pb 4f for O 1 s, C 1 s, N 1 s, and I, respectively based on XPS fine scans for films annealed at 110 °C in nitrogen. Error bars represent standard deviation. For reference, solid horizontal purple, red, and green bars show the levels of iodine, carbon, and nitrogen in the initial 3:1 solution of MAI:PbI2. Red arrows indicate increased carbon relative to nitrogen. The scale of increase is roughly one carbon (one transamidation) for each Pb atom. The ratio of MA to DMA can be estimated as [2(C–N)/(2N–C)].

The chemical composition measured by XPS is consistent with transamidation that was revealed by TOF-SIMS and with the transitions observed by XRD. Transamidation will consume one methylamine and replace it with one DMA, moving toward a 2:1 ratio of carbon to nitrogen. During annealing, MAI leaves the sample, Reference Raga, Jung, Lee, Leyden, Kato and Qi25,Reference Unger, Bowring, Tassone, Pool, Gold-Parker, Cheacharoen, Stone, Hoke, Toney and McGehee37,Reference Cheng, Han, Meyer, Dkhissi, Weber, Pringle, Bach and Spiccia39,Reference Xie, Zhang, Su, Ren, Wong, Grätzel and Choy43,Reference Frost, Butler, Brivio, Hendon, van Schilfgaarde and Walsh46 lowering the nitrogen, carbon, and iodine content in equal amounts. A combination of these two effects can be observed in Fig. 7.
Increases in carbon relative to nitrogen could have other causes. For instance, methylamine decomposition might leave more carbon than nitrogen; however, carbon content exceeds the carbon amount initially present from MAI [Fig. 7(b)] and methylamine cations are stable up to even 150 °C (no decomposition of FA+ was observed by TOF-SIMS of FAPbI3 prepared by CVD at 150 °C as shown in Fig. S11). The carbon must come from another source. Adventitious carbon is another possibility. However we strictly limited ambient exposure throughout the experiments, the surface and bulk compositions appeared similar by depth profiling with TOF-SIMS (Fig. S12), and samples left for 30 min in an open container in the glove box did not have more additional carbon than samples that were not exposed in that manner. In all cases, the carbon increase is proportional to the number of Pb atoms. The only reasonable explanation is transamidation, possibly with Pb as the catalyst center [Fig. 1(d)].
IV. DISCUSSION
We observed DMA, NMF, and DMF, in perovskites that were prepared with DMF as the solvent. Low levels of DMF remain in the films even after annealing to 150 °C. The peak intensities for DMA and NMF are higher than for the solvent, even though neither DMA nor NMF were added. If the ionization efficiencies of both amines are similar, then the ratio of MA:DMA is near 9:1. DMA and NMF are products of DMF transamidation. Transamidation has not been addressed in perovskite solar cell literature. From other literature, transamidation of DMF is catalyzed by TiO2 and Al2O3, [Figs. 1(a) and 1(b)]. The reaction is accelerated on TiO2 substrates that were prepared with an alcohol and annealed at 500–700 °C, Reference Yan, Long, Zhang, Wei, Chen, Yang and Xu35 which is particularly relevant to PSC. Reference Zhou, Chen, Li, Luo, Song, Duan, Hong, You, Liu and Yang3,Reference Ito, Tanaka, Vahlman, Nishino, Manabe and Lund8,Reference Chen, Zhou, Hong, Luo, Duan, Wang, Liu, Li and Yang10,Reference Burschka, Pellet, Moon, Humphry-Baker, Gao, Nazeeruddin and Grätzel11,Reference Sanchez, Gonzalez-Pedro, Lee, Park, Kang, Mora-Sero and Bisquert13,Reference Leijtens, Eperon, Pathak, Abate, Lee and Snaith14,Reference Raga, Jung, Lee, Leyden, Kato and Qi25,Reference Christians, Miranda Herrera and Kamat32,Reference Yan, Long, Zhang, Wei, Chen, Yang and Xu35,Reference Colella, Mosconi, Fedeli, Listorti, Gazza, Orlandi, Ferro, Besagni, Rizzo, Calestani, Gigli, De Angelis and Mosca36,Reference Eperon, Stranks, Menelaou, Johnston, Herz and Snaith41,Reference Im, Chung, Kim and Park42 Alternatively, transamidation can also be catalyzed by water Reference Lebleu, Kotsuki, Maddaluno and Legros21 or an acid (e.g., HI) Reference Allen, Atkinson and Williams22 (Fig. 1). We believe that transamidation of DMF with MA is the only reasonable explanation for DMA and NMF.
Post-annealing, the relative XPS atom% for nitrogen and iodine are lower than in the spin-coating solution. This reduction is consistent with depletion of excess MAI by annealing. Reference Raga, Jung, Lee, Leyden, Kato and Qi25,Reference Unger, Bowring, Tassone, Pool, Gold-Parker, Cheacharoen, Stone, Hoke, Toney and McGehee37,Reference Cheng, Han, Meyer, Dkhissi, Weber, Pringle, Bach and Spiccia39,Reference Xie, Zhang, Su, Ren, Wong, Grätzel and Choy43,Reference Frost, Butler, Brivio, Hendon, van Schilfgaarde and Walsh46 However, the carbon content increased relative to nitrogen. Increasing carbon is consistent with transamidation. Transamidation adds carbon by replacing MA (C:N = 1:1) with DMA (C:N = 2:1); the extra carbon comes from DMF solvent molecules. Carbon content exceeds the carbon in the original MAI and approaches 1.5 atoms of carbon for each nitrogen atom (50% MA + 50% DMA). Two-step perovskite may have 10% DMA, while DMF solution-prepared perovskite can have up to 50% DMA content.
When DMF was present, we observed perovskite XRD peaks gradually transform into a PbI2–DMF complex. More DMF produced more intense peaks from the complex. After heating above 90 °C, the peaks irreversibly reverted to perovskite peaks. However, the most intense DMF peaks (before annealing) were associated with XRD peak shifts in the perovskite peaks to smaller diffraction angles (after annealing). Similar shifts have been observed when some MA is replaced by FA. Reference Yan, Long, Zhang, Wei, Chen, Yang and Xu35,Reference Jeon, Noh, Yang, Kim, Ryu, Seo and Seok47 Because DMA is similar in size with formamidinium, shifting is consistent with replacement of some MA by DMA in perovskite. No XRD peak shift was observed for our high-efficiency, two-step films that have roughly 10% DMA (based on TOF-SIMS). This suggests that ∼10% impurities in perovskite can easily hide in high-performance solar cells prepared by methods common in the literature. Reference Zhou, Chen, Li, Luo, Song, Duan, Hong, You, Liu and Yang3,Reference Burschka, Pellet, Moon, Humphry-Baker, Gao, Nazeeruddin and Grätzel11 In contrast, roughly 50% DMA (based on XPS ratios, Fig. 7) induced a measurable shift of 0.1 degree in XRD. Considering that perovskite with 15% formamidinium, a similarly sized cation, induced a shift of 0.2 degrees, Reference Stoumpos, Malliakas and Kanatzidis24,Reference Baikie, Fang, Kadro, Schreyer, Wei, Mhaisalkar, Graetzel and White31,Reference Eperon, Stranks, Menelaou, Johnston, Herz and Snaith41 either DMA's effective size is smaller, or not all of the DMA gets incorporated into the perovskite structure. Considering that a film formed from DMAI and PbI2 has a high enough band gap to be mostly transparent and does not exhibit perovskite peaks (Fig. S13), the latter option is more likely.
We observed a reversible transition that this suggests that water could inhibit transamidation between perovskite and a complex with water that dominates if water is present, but disappears after sufficient annealing (Figs. 5 and S5). The complex includes more methylammonium iodide and water relative to lead than perovskite does. Because water is still present as humidity, termination of the reversible transition is more likely due to loss of methylammonium iodide and convergence to stoichiometric perovskite (Fig. S7 and S8). Samples exposed to humid air (pre-annealing), which also produced the water-complex transition in XRD did not exhibit the shifted XRD peaks due to DMA incorporation (post-annealing). Perhaps the transient structure protects the perovskite components until annealing converges the composition to stoichiometric perovskite. Transamidation could explain why some published works claim water improves perovskite. Reference Zhou, Chen, Li, Luo, Song, Duan, Hong, You, Liu and Yang3,Reference Raga, Jung, Lee, Leyden, Kato and Qi25,Reference You, (Michael) Yang, Hong, Song, Meng, Liu, Jiang, Zhou, Chang, Li and Yang38,Reference Bass, McAnally, Zhou, Djurovich, Thompson and Melot48
V. CONCLUSIONS
TOF-SIMS conclusively identified DMA in high-performing PSC films that were prepared using DMF. We suggest that perovskite researchers consider TOF-SIMS as a powerful and perhaps even necessary tool for chemical characterization of perovskites. Based on TOF-SIMS, XPS, and XRD, we believe transamidation of DMF produces DMA, some of which is inserted into the perovskite crystal. The extent of transamidation and perovskite incorporation of DMA, which could be as high as 50% for some methods, depend on the environment and annealing conditions. DMA could explain the variability in results in the literature. Although we did not measure the effect that DMA has on perovskite performance, films prepared from pure DMAI + PbI2 are transparent and are not perovskites. This suggests that DMA is detrimental. Finding an alternative solvent that is not chemically reactive will likely further improve thin film perovskite solar cell performance. NMF is a potential alternative.
Supplementary Material
To view supplementary material for this article, please visit http://dx.doi.org/10.1557/jmr.2016.272.
Experimental methods additional details, structural confirmation using 2D x-ray diffraction and comparison to 0D scanned spectra, CVD perovskite data, additional XPS, additional XRD data, peak parameters for (110) and (220) perovskite peaks, depth profiling atomic ratios.
ACKNOWLEDGMENTS
This work was supported by funding from the Energy Materials and Surface Sciences Unit of the Okinawa Institute of Science and Technology Graduate University. We thank ULVAC-PHI Inc. (Japan) for measuring samples by TOF-SIMS. We thank Steven D. Aird, the Technical Editor at Okinawa Institute of Science and Technology Graduate University for valuable suggestions.


 Open access


