


I. Introduction
Cannabis policies are rapidly evolving (Miller et al., Reference Miller, Goodman, Mustain and Whitehurst2024), opening unexplored avenues for entrepreneurship in food and beverage manufacturing (Stevens and Pahl, Reference Stevens and Pahl2021). One area garnering tremendous interest is the market for cannabidiol (CBD) and tetrahydrocannabinol (THC) beverages (Brewbound, n.d.).Footnote 1 For example, Nielsen (2022a) reports that CBD-infused beverages eclipsed $19 million in sales in 2022, up 42% from the year prior and 106% from two years earlier. Meanwhile, in states that have legalized recreational cannabis, several craft beverage manufacturers have partnered with cannabis companies to produce and sell THC-infused drinks in state-licensed dispensaries (Kendall, Reference Kendall2019; Villa, Reference Villa2021; Walsh, Reference Walsh2024). There are also loopholes in current federal laws stemming from the 2018 Farm Bill that allow the sale of certain types of THC beverages in states without recreational cannabis (Leas, Reference Leas2021). Despite these initial insights and partnerships, the market potential of these novel beverage categories has remained understudied.
This study uses double-bounded contingent valuation (DBCV) procedures (Hanemann et al., Reference Hanemann, Loomis and Kanninen1991) from an online survey of 2,010 U.S. adults to evaluate demand and willingness to pay (WTP) for various cannabis-infused beverages. The experiment includes 12 oz cans of CBD- and THC-infused juice, sparkling water, iced coffee, sweetened tea, sports drinks, and non-alcoholic (NA) versions of beer, wine, and cocktails. Parametric and nonparametric approaches are then used to estimate mean WTP and identify the consumer characteristics associated with elevated consumer WTP. In conducting this analysis, the study provides key statistics on the CBD- and THC-infused beverage market to inform entrepreneurial decision-making, product development, and marketing strategies.
The present study most closely resembles Charlebois et al. (Reference Charlebois, Music, Somogyi and Sterling2020), who evaluated Canadian consumer willingness to purchase cannabis-infused edibles. Their results suggest that 40–46% of consumers are willing to purchase edibles, with 15% willing to substitute a cannabis-infused beverage for a conventional beverage, and 16% for an alcoholic beverage. This study extends this analysis by focusing exclusively on cannabis-infused beverages, considering market pricing, and assessing preferences for several CBD- and THC-infused options.
The study offers three primary contributions for academic researchers and industry stakeholders. First, in sampling a nationally representative panel of U.S. adults 21+ with respect to key demographics, the study identifies the share of the population that is willing to try cannabis-infused beverages and the demographics of this group. Second, the study presents mean WTP estimates for 16 different cannabis-infused drinks: eight CBD-infused and eight THC-infused alternatives. In doing so, the study discusses the products that appeal to the broadest range of consumers and evaluates what price the market could potentially bear. This information is valuable for beverage manufacturers, who can compare estimated WTP against production costs to determine whether it is a market worth pursuing.Footnote 2 Finally, the study discusses the factors correlating with WTP, providing valuable marketing insights into which demographic characteristics, personal habits, etc., best predict WTP for each product.
In previewing the results, over half of the sample is or may be willing to try cannabis-infused beverages, with CBD- and THC-infused juice, sweetened iced tea, and iced coffee appealing to the broadest range of consumers. The mean WTP estimates vary quite substantially across products, ranging from a lower-bound estimate of $1.44 per 12 oz can of CBD-infused NA beer to an upper-bound estimate of $4.63 per 12 oz can of THC-infused juice. On average, the mean WTP for THC-infused alternatives is approximately $0.30–$0.40 higher (or 12.5% greater) than CBD-infused counterparts. Considering the demographics influencing WTP, age is the best predictor of elevated WTP levels for all products, while other characteristics and habits correlate well for some products. Ultimately, these results highlight the importance of defining a target audience during product development and considering how these factors will influence demand and WTP.
The remainder of this paper is structured as follows. Section II presents the methodology, including an overview of the product offerings, survey design, and estimation procedures. Section III presents the results of the DBCV analysis, including mean WTP estimates and a discussion of the factors influencing WTP. Section IV concludes with a summary of the marketing implications, limitations, and areas for future research.
II. Methodology
A. Experimental design
This study utilizes DBCV techniques to evaluate consumer WTP for CBD- and THC-infused beverages (Hanemann et al., Reference Hanemann, Loomis and Kanninen1991).Footnote 3 In a DBCV study, respondents are presented with a good or service and asked whether they would be willing to purchase it at a given price. They are then asked a follow-up question about whether they would be willing to pay a new price conditional upon their initial response. Respondents who state they would be willing to pay the original price see a higher price; those unwilling to pay the original price see a lower price.
Eight beverage types are included in this project, creating 16 total (hypothetical) cannabis-infused alternatives: eight CBD-infused and eight THC-infused beverages. These include 12 oz cans of juice, sparkling water, iced coffee, sweetened tea, sports drinks, and NA versions of beer, wine, and ready-to-drink (RTD) cocktails. These options reflect real-world alternatives and potential opportunities based on consumer demand. For example, sparkling water, tea, and fruit drinks represent some of the top-growing CBD-infused beverage categories (Nielsen, 2022a). Meanwhile, NA beer, wine, and RTD cocktails reflect growing consumer and producer interest in NA beverage markets (Lee-Weitz, Reference Lee-Weitz2023). Nielsen (2022b) reports that the category expanded by 20% from 2021 to 2022, while Lee-Weitz (Reference Lee-Weitz2023) highlights how the number of beverage manufacturers operating in this space has blossomed. Additionally, there is a budding curiosity among producers in cannabis-infused beverages that mimic NA beer, wine, and spirits (e.g., Villa, Reference Villa2021).
Given the broad beverage categories, respondents are asked to envision that the products are of their favorite flavor or type.Footnote 4 Each CBD-infused option has 25 mg CBD per 12 oz can, while the THC-infused options have 5 mg THC, representing standard industry serving sizes.Footnote 5 Figures 1 and 2 present the CBD- and THC-infused beverages.
CBD-infused beverage options.

THC-infused beverage options.

It is worth highlighting the warning label on the THC-infused alternatives but not the CBD-infused ones. CBD-infused alternatives are widely available, nonintoxicating, and generally come from federally legal hemp. As such, it does not require a warning label. Alternatively, THC comes from recreational cannabis and is intoxicating, so states with legal recreational cannabis require THC-infused food and drink products to be labeled with a warning label similar to the one used here (Kosa et al., Reference Kosa, Giombi, Rains and Cates2017; Villa, Reference Villa2021).
Market prices for a single 12 oz can of each CBD- and THC-infused alternative are then gathered for the bidding procedures. Based on the available information,Footnote 6 $2.99 per 12 oz can is selected as the average price for all products. Following Gabrielyan et al. (Reference Gabrielyan, McCluskey, Marsh and Ross2014), each respondent sees this initial $2.99 bid for each product in the first part of the DBCV. To cover the range of available prices and obtain additional variation in the choice data, two discounted prices and two premium prices are included for the follow-up question. If respondents say they are unwilling to pay the original price, they are randomly presented with a discounted price of $0.99 or $1.99. Respondents willing to pay the original price are shown a premium price of $3.99 or $4.99. Table 1 summarizes the bidding blocks that respondents could be placed in for each product.
Bidding blocks for each product

Note: Respondents were randomly placed into one of the four blocks for each product. This means that, for example, they could be placed in Block 1 for the first product but Block 3 for the second product.
B. Survey instrument and sampling strategies
The DBCV study is embedded in an online survey constructed and distributed through Qualtrics targeting a nationally representative sample of U.S. adults 21+ with respect to key demographics. Since there is limited literature on the demographics of cannabis-infused beverage consumers, the study elects for a nationally representative sample. That way, by asking each respondent whether they would be willing to try cannabis-infused beverages, the study identifies the share of the population and the consumer segments most likely to try these products. Outside of demographics, the survey includes questions on household characteristics, alcohol and cannabis consumption patterns, etc.
Before engaging in the DBCV portion of the study, respondents are provided with information on CBD- and THC-infused beverages. This includes real-world examples of these products and a summary of the differences between the two cannabinoids (Figure 3). They are then asked whether they had heard of CBD- and THC-infused beverages, whether they had consumed CBD- and THC-beverages, and if they would be willing to try them in the future. Each question is asked separately for CBD and THC.
Information provided to respondents before they state whether they would be willing to try CBD- and THC-infused beverages.

Respondents who state they are unwilling to try these beverages in the future skip the DBCV portion of the study. In other words, these individuals are assumed to have a WTP of $0.00 for the products included in the study. Removing these respondents acts as a screening criterion, as researchers generally constrain their sample when analyzing WTP to ensure the proper target population. Of course, including these respondents in the estimation would reduce WTP.
Those who say they would or may be willing to try these products then participate in the DBCV. Rather than randomizing across all 16 beverages, respondents randomly see the eight CBD-infused or eight THC-infused options first. This reduces the cognitive burden and prevents confusion over the different cannabinoids (i.e., CBD and THC). However, bidding across the eight products within each set is randomized to prevent ordering effects (Boyle et al., Reference Boyle, Welsh and Bishop1993; Day et al., Reference Day, Bateman, Carson, Dupont, Louviere, Morimoto and Wang2012). Once the respondent finishes their first set of eight tasks, they repeat the same questions for the other cannabinoid (if they said they would consume both types of cannabis-infused beverages). Figure 4 summarizes the DBCV survey flow for respondents.
Experimental design flow for the double-bounded contingent valuation (DBCV) portion of the experiment.

C. Estimation
The study uses DBCV methods (Hanemann et al., Reference Hanemann, Loomis and Kanninen1991) and parametric and nonparametric modeling to determine consumer WTP for cannabis-infused beverages. Following approaches outlined in past empirical studies (e.g., Gabrielyan et al., Reference Gabrielyan, Marsh, McCluskey and Ross2018, Reference Gabrielyan, McCluskey, Marsh and Ross2014; Tozer et al., Reference Tozer, Galinato, Ross, Miles and McCluskey2015), respondent i sees two bids for each product j. The initial market price bid  ${b^m}$ is presented to all respondents, and respondents are asked whether they would be willing to pay ${b^m}$ for product j. The second bid is then conditional upon whether respondents are willing to pay the initial bid price. Those willing to pay ${b^m}$ are then shown a premium price $b_i^p \gt {b^m}$, where the premium bid varies by i (Table 1). Respondents unwilling to pay ${b^m}$ see a discounted price $b_i^d \lt {b^m}$, which also varies across i.
As WTP is a latent variable, this framework constructs bounds on the WTP for each product j. Let  $WT{P_{ij}}{\text{ }}$denote individual i’s true WTP for product j. Then, the four possible outcomes ( $y_{ij}$) are responding: no to both bids (NN); (ii) no to the first and yes to the second (NY); yes to the first and no to the second (YN); and yes to both (YY). Mathematically, this is represented as:
 \begin{equation}{Y_j} {=} {\text{ }}\left\{ \begin{array}{*{20}{@{}c}}
{\begin{array}{*{20}{c}}
{{\text{NN if}}}&{WT{P_{ij}} \lt b_i^d} \\
{{\text{NY if}}}&{b_i^d \leq WT{P_{ij}} \lt {b^m}}
\end{array}} \\
{\begin{array}{*{20}{c}}
{{\text{YN if}}}&{{b^m} \leq WT{P_{ij}} \lt b_i^p} \\
{{\text{YY if }}}&{WT{P_{ij}} \geq b_i^p}
\end{array}}
\end{array}{.}\right.\end{equation}
\begin{equation}{Y_j} {=} {\text{ }}\left\{ \begin{array}{*{20}{@{}c}}
{\begin{array}{*{20}{c}}
{{\text{NN if}}}&{WT{P_{ij}} \lt b_i^d} \\
{{\text{NY if}}}&{b_i^d \leq WT{P_{ij}} \lt {b^m}}
\end{array}} \\
{\begin{array}{*{20}{c}}
{{\text{YN if}}}&{{b^m} \leq WT{P_{ij}} \lt b_i^p} \\
{{\text{YY if }}}&{WT{P_{ij}} \geq b_i^p}
\end{array}}
\end{array}{.}\right.\end{equation}The probability of membership in each bound is then predicted as a function of the bids and respondent characteristics using maximum likelihood procedures, assuming the random variables follow some assumed cumulative distribution function. We follow procedures outlined in López-Feldman (Reference López-Feldman2012), where respondent i’s WTP for product j is modeled as the linear function:
 \begin{equation}WTP_{ij}=z_{\mathrm{ij}}\beta_{\mathrm{j}}+\epsilon_{ij}\end{equation}
 where  $z_{\mathrm{ij}}$ is a vector of bid prices, respondent demographics, and personal characteristics, $\beta_j$ is the set of parameters, and ${\varepsilon _{ij}}\sim N(0,{ }{\sigma ^2})$. Demographic characteristics include gender, age, household income, and education. Other personal characteristics include political affiliation, past cannabis use, preferred alcoholic beverage (if any), knowledge of cannabis-infused beverages before this study, and the state legal policy of recreational cannabis. Additionally, the environmental and choice modeling literature suggests that the presentation order could impact WTP (Powe and Bateman, Reference Powe and Bateman2003; Stewart et al., Reference Stewart, O'Shea, Donaldson and Shackley2002). As respondents consider several products in the study, a series of dummy variables are included to control for possible ordering effects (Boyle et al., Reference Boyle, Welsh and Bishop1993; Day et al., Reference Day, Bateman, Carson, Dupont, Louviere, Morimoto and Wang2012). The model is estimated using the “doubleb” command (López-Feldman, Reference López-Feldman2012) in Stata 18.0 (StataCorp LLC., n.d.), which allows the parameter vector to be directly interpretable as marginal effects. This follows similar DBCV methods to those described in past empirical studies, such as Tozer et al. (Reference Tozer, Galinato, Ross, Miles and McCluskey2015), Sun and Zhu (Reference Sun and Zhu2014), and Budhathokia et al. (Reference Budhathoki, Lassa, Pun and Zander2019).
Understanding that mean WTP estimates can be sensitive to distributional assumptions, the study also employs nonparametric techniques (Carson and Hanemann, Reference Carson and Hanemann2005). Specifically, the Turnbull estimator is used to estimate the Kaplan–Meier mean WTP and survival function for each of the 16 cannabis-infused beverages. These estimates are generally considered a lower-bound estimate of mean WTP (Carson and Hanemann, Reference Carson and Hanemann2005), and thus serve as a more conservative estimate for the present study. Nonparametric modeling is done using the “turnbull.db” function (Aizaki et al., Reference Aizaki, Nakatani, Sato and Fogarty2022) in R Studio (R Core Team, 2021).
III. Results
A. Willingness to try CBD- and THC-infused beverages
Figure 5 gauges general awareness, previous consumption, and willingness to try CBD- and THC-infused beverages. Roughly half of the survey respondents had heard of CBD-infused drinks before the survey, whereas just 42% had heard of THC-infused beverages. The higher familiarity with CBD-infused beverages is unsurprising given the legal status of the two cannabinoids and the broad availability of CBD-infused beverages in traditional retail outlets.
Response rates to questions on cannabis-infused beverage familiarity, past consumption, and willingness to try (n = 2,010). Note: The sample size for CBD beverages is n = 1,163. The sample size for THC-infused beverages is n = 1,075, except for THC-infused juice (n = 967) due to an error in the survey coding during data collection.

Approximately 35% of the respondents who had heard of CBD-infused beverages before the survey, or 20% of the entire sample, previously consumed a CBD-infused beverage. For THC, 44% of those familiar with THC-infused beverages had previously tried them, equating to roughly 20% of the sample. Thus, while CBD-infused beverages are more well-known among the general population, they have similar overall consumption rates based on past exposure. It is also worth noting that there is significant overlap in the sample regarding who has tried CBD- and THC-infused beverages (correlation coefficient of 0.69).
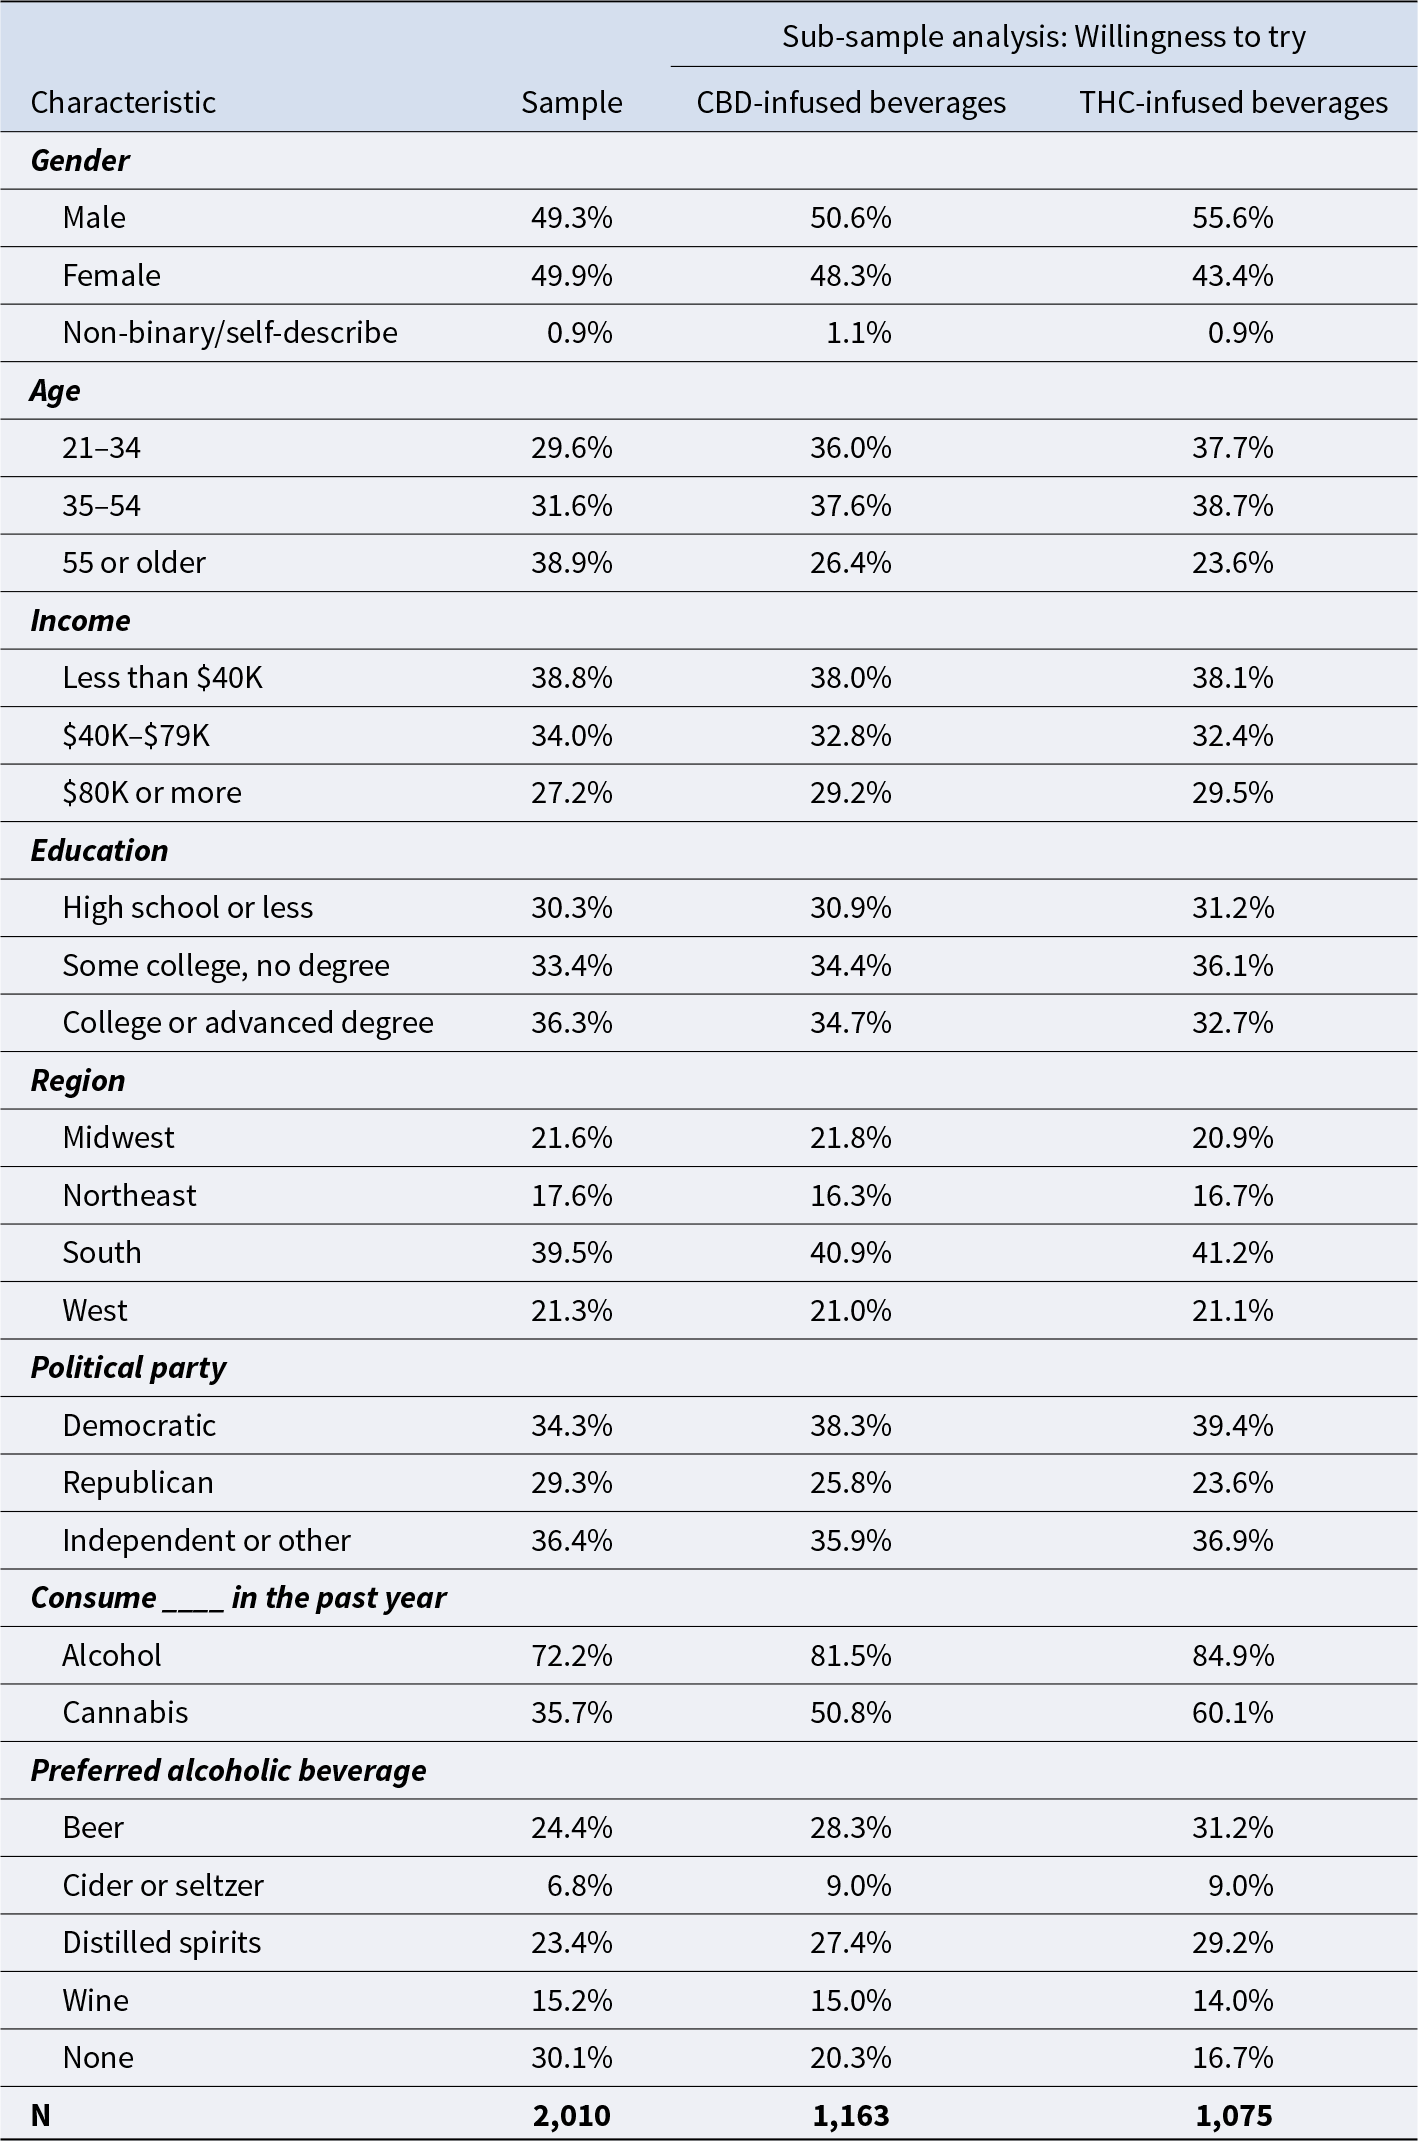
In comparing the responses to the willingness to try questions to the overall sample (Table 2), respondents who are willing to try CBD-infused beverages are, on average, younger and more likely to have reported recent alcohol and cannabis use. There are less notable differences among the other demographic characteristics. For THC-infused beverages, similar yet more pronounced trends emerge. Younger respondents who have recently used alcohol and cannabis are more likely to try these beverages. Males are also more likely to state a willingness to try THC-infused beverages.
Sample demographics, broken down by their willingness to try CBD- and THC-infused beverages
B. Mean WTP for cannabis-infused beverages
1. CBD-infused beverages
Of the 2,010 respondents completing the survey, 1,163 (58%) state that they would or may be willing to try CBD-infused beverages in the future. Figure 6 presents the mean WTP estimates of these 1,163 respondents under the parametric and nonparametric approaches.Footnote 7
Mean willingness to pay (WTP) per 12 oz can

Across the eight CBD-infused beverages, the juice has the highest mean WTP, ranging from $3.22–$4.14 per 12 oz under the different estimation strategies. Indeed, the mean WTP is at least $0.34 larger than the second most preferred CBD-infused product: sweetened iced tea ($2.88–$3.69 per 12 oz can). The iced coffee and NA cocktail are also popular alternatives, with mean WTP estimates of $2.78–$3.57 and $2.77–$3.49 per 12 oz can, respectively. Alternatively, NA beer ($1.82–$2.03) and NA canned wine ($2.29–$2.55) have the lowest mean WTPs, which was anticipated given their appeal to fewer consumers than more conventional beverages (e.g., juice). Put differently, if someone does not like the taste of beer, their WTP may be $0.00 even if they are interested in purchasing CBD-infused beverages. This limited appeal to a broad consumer base ultimately reduces the mean WTP for these products. Interestingly, the mean WTP for the NA cocktail is nearly double that of NA beer in the parametric approach and $0.48–0.94 larger than the mean WTP for NA wine. This traditional alcoholic product may not suffer the same reduction in appeal because it would essentially be a mix of fruit juices, soft drinks, and other natural flavorings.
2. THC-infused beverages
Figure 6 also shows the average WTP for THC-infused beverages under the parametric and nonparametric approaches, where 1,075 (53%) of the 2,010 respondents stated that they would or may be willing to try these beverages. Generally, the mean WTP estimates follow a similar preference ordering to the CBD-infused alternatives. THC-infused juice appeals to the broadest range of consumers, with the highest mean WTP estimates of $3.48–$4.63 per 12 oz can. THC-infused sweetened iced tea ($3.07–$4.16), NA cocktails ($3.03–$4.14), and iced coffee ($2.96–$4.09) round out the top four products with the highest mean WTP.
While NA beer remains the alternative with the lowest mean WTP, the THC-infused version sees a notable increase in mean WTP: $2.30–$2.54 per 12 oz can (up from $1.82 to $2.03 in the CBD-infused scenario). Indeed, this premium of switching from the CBD- to THC-infused option is the largest among the eight beverage categories. Gender differences in the two samples may drive this trend, as males are more likely to be willing to try THC-infused beverages (Table 2) and state that beer is their preferred beverage (Auter, Reference Auter2016).
The pattern of higher WTP in the THC setting exists across each beverage category. On average, the mean WTP is $0.36 per 12 oz can for THC-infused options than the CBD-infused counterpart. This amounts to roughly a 12.5% premium, on average. However, there is some variation across beverage types, ranging from $0.35 to $0.72 under the parametric approach and $0.16 to $0.27 under the nonparametric approach. Besides NA beer ($0.50), the NA cocktails ($0.45) and juice ($0.37) have the greatest average differences between CBD- and THC-infused options, while canned wine ($0.26) and sparkling water ($0.27) have the smallest.
3. Considering potential hypothetical bias
DBCV offers a straightforward procedure to generate WTP estimates for various products based on just two questions. However, one common critique of contingent valuation and online surveys more broadly is the potential for hypothetical bias and inflated mean WTP estimates (Carson and Hanemann, Reference Carson and Hanemann2005). Several steps were taken to reduce this potential bias, following best practices offered by Penn and Hu (Reference Penn and Hu2018) and Caputo and Scarpa (Reference Caputo and Scarpa2022). This includes providing respondents with a cheap talk script (Cummings and Taylor, Reference Cummings and Taylor1999), a consequentiality script (Carson and Groves, Reference Carson and Groves2007; Vossler and Evans, Reference Vossler and Evans2009), and a solemn oath script (Jacquemet et al., Reference Jacquemet, Joule, Luchini and Shogren2013) before the experiment.Footnote 8 However, given the hypothetical nature of the experiment and the lack of consequences for suboptimal decision-making, this bias could persist. For example, a recent meta-analysis in the marketing literature suggests that the average hypothetical bias in online WTP studies is 21% (Schmidt and Bijmolt, Reference Schmidt and Bijmolt2020). As such, Table 3 presents deflated mean WTP estimates alongside the original estimates presented earlier (Figure 6), where the initial range is deflated by 21%.
Deflated mean willingness to pay (WTP) estimates accounting for potential hypothetical bias

Note: The range in the “Estimate” columns denotes the values from the parametric and nonparametric approaches (Figure 6). The “Deflated” columns take the range and scale the estimates down by 21% according to the recent review study by Schmidt and Bijmolt Reference Schmidt and Bijmolt(2020) on the prevalence of hypothetical bias in online surveys.
This procedure simply scales each mean WTP estimate down by the same factor, so preference ordering remains the same. For CBD-infused beverages, the deflated mean WTP estimates range from a low of $1.44–$1.66 per 12 oz can for NA beer to a high of $2.54–$3.27 for juice. Similarly, for THC-infused beverages, NA beer has the lowest deflated mean WTP of $1.82–$2.01, while juice has the highest at $2.75–$3.66. As before, when comparing the deflated CBD- and THC-infused estimates, the average consumer is willing to pay $0.28 (12.5%) more for THC-infused beverages than their CBD-infused counterpart.
C. Demographics influencing WTP
Under the parametric approach, we used average consumer demographics and characteristics to calculate the mean WTP for the 16 cannabis-infused beverage alternatives. However, from a marketing perspective, it is also valuable to understand the characteristics associated with an increased WTP for each product. The following two subsections explore the factors associated with a higher WTP for each CBD- and THC-infused beverage.
1. CBD-infused beverages
Table 4 presents the DBCV output for CBD-infused beverages. Across all eight CBD-infused alternatives, age was a statistically significant predictor of WTP. Specifically, respondents ages 21–34 and 35–54 are, on average, willing to pay more for CBD-infused beverages than respondents above the age of 55. The premium is highest among respondents in the youngest age bracket. Males also have a higher average WTP for NA beer and sports drink; for the other six beverages, gender is an insignificant predictor of WTP. The higher WTP for males for these two CBD-infused products follows from the fact that males are more likely to consume beer (Auter, Reference Auter2016) and traditional sports drinks (Grand View Research, 2019). Household income above $80K positively correlates with WTP, with statistically significant estimates in four of the eight beverages. Educational attainment, political affiliation, and residing in states with legal recreational cannabis are relatively weak predictors of WTP, with a few spurious statistically significant estimates across the eight products.
Predicting willingness to pay for CBD-infused beverages as a function of demographic and personal characteristics

Note: Boldface represents statistical significance at the 5% level or greater.
Ordering effects are controlled for by the inclusion of dummy variables corresponding to the position in which the respondent saw each of the beverages.
2. THC-infused beverages
Table 5 presents the results of the WTP estimation for THC-infused beverages. Many of the results for the factors influencing consumer WTP for THC-infused beverages follow from the previous section on CBD-infused beverages. Specifically, age is a clear predictor of WTP, where younger consumers are willing to pay more for each of the eight product alternatives, on average. This is true across all eight product options, with statistically significant point estimates for 21–34- and 35–54-year-olds relative to the baseline (55+). Higher-income households are also willing to pay higher prices, on average, where the point estimate for $80K+ is significant at the 5% level for five of eight beverages. Alcohol consumption is also associated with an increased WTP for THC-infused beverages, as depicted through the point estimates on the preferred alcohol types. For example, consumers who prefer cider or seltzer are willing to pay more for THC-infused sparkling water, while those who prefer beer are willing to pay more for THC-infused beer. As with CBD-infused beverages, males are also willing to pay more for THC-infused sports drinks and NA beer, on average.
Predictors of willingness to pay for THC-infused beverages

Note: Boldface represents statistical significance at the 5% level or greater.
The sample size for THC-infused juice is 967 due to an error in the survey coding during data collection. Specifically, the skip logic insufficiently placed 108 respondents into the proper location following their first response (whether they would be willing to pay bm = $2.99). For example, some respondents saw a higher despite being unwilling to pay the initial price, while others were not asked a follow-up question altogether. This error was detected and corrected during data collection. Its effect is limited to only these 108 responses for the THC-infused juice option. Ordering effects are controlled for by the inclusion of dummy variables corresponding to the position in which the respondent saw each of the beverages.
IV. Discussion and conclusion
Entrepreneurs and key stakeholder groups are wondering about the market extent of cannabis products as U.S. policies continue evolving. While some studies have evaluated consumer cannabis product preferences, less is known about the market for CBD-and THC-infused beverages. This gap in the literature is critical as it represents an area for potential innovation in beverage manufacturing (Stevens and Pahl, Reference Stevens and Pahl2021).
This study uses survey and DBCV data from a panel of U.S. adults to provide three key takeaways on consumer demand and WTP for CBD- and THC-infused beverages. First, there is broad interest in cannabis-infused beverages among consumers, with 58% and 53% of survey participants saying they would or may be willing to try CBD- and THC-infused beverages, respectively. Second, the study expresses substantial variation in preferences and WTP for cannabis-infused beverages, where the mean WTP for THC-infused alternatives is approximately 12.5% higher than CBD-infused counterparts, on average. Preference ordering is consistent across categories, with CBD- and THC-infused juice, sweetened iced tea, NA cocktails, and iced coffee appealing to the broadest range of consumers. Finally, the study determines the demographics correlating with higher WTP. Across all 16 cannabis-infused beverages, age is a statistically significant predictor of WTP, while income, gender, and preferred alcoholic beverage (if any) are sometimes insightful. These results highlight the importance of market segmentation and considering the target population, as products with lower mean WTP estimates could still appeal to select demographic groups. For example, while cannabis-infused NA beers have the lowest mean WTP, beer manufacturers could still pursue this route knowing that beer drinkers are willing to pay above the mean for these products.
This study is not without limitations. The first comes from possible self-selection into treatment. While the sampling strategy targeted a nationally representative sample of U.S. consumers with respect to key demographic characteristics, some potential respondents may have been more likely to complete the survey than others. Alcohol and cannabis consumption can be sensitive topics, and regular consumers of these substances may have been more likely to complete the survey than those who strongly oppose them.Footnote 9 Thus, the estimate on the share of consumers who are willing to try cannabis-infused beverages may serve as an upper-bound approximation. However, by constraining the DBCV procedures to potential consumers and controlling for alcohol and cannabis use in the regression analysis, the main WTP findings are free of this concern.
The more prominent limitations of the WTP estimates stem from the reliance on DBCV techniques. The method has known shortcomings in incentive compatibility (Carson and Hanemann, Reference Carson and Hanemann2005), potentially leading to inflated WTP estimates due to hypothetical bias (Murphy et al., Reference Murphy, Allen, Stevens and Weatherhead2005). Best practices are used to mitigate these concerns (Caputo and Scarpa, Reference Caputo and Scarpa2022; Penn and Hu, Reference Penn and Hu2018), including combining a cheap talk script (Cummings and Taylor, Reference Cummings and Taylor1999), consequentiality script (Carson and Groves, Reference Carson and Groves2007; Vossler and Evans, Reference Vossler and Evans2009), and a solemn oath script (Jacquemet et al., Reference Jacquemet, Joule, Luchini and Shogren2013) before the experiment. Knowing that the bias could persist, the study also presents deflated WTP estimates following the study by Schmidt and Bijmolt (Reference Schmidt and Bijmolt2020). These deflated estimates can be thought of as the most conservative estimates of mean WTP for each product.
Other critiques of the DBCV are that the WTP estimates can be sensitive to starting bids and bid design (Chien et al., Reference Chien, Huang and Shaw2005; Cooper, Reference Cooper1993; Veronesi et al., Reference Veronesi, Alberini and Cooper2011; Vossler et al., Reference Vossler, Poe, Welsh and Ethier2004), ordering effects (Boyle et al., Reference Boyle, Welsh and Bishop1993; Day et al., Reference Day, Bateman, Carson, Dupont, Louviere, Morimoto and Wang2012), and the distributional assumptions made about true WTP (Borzykowski et al., Reference Borzykowski, Baranzini and Maradan2018; Veronesi et al., Reference Veronesi, Alberini and Cooper2011). Measures were taken to overcome these drawbacks. First, regarding the starting bid levels, we follow procedures outlined in Gabrielyan et al. (Reference Gabrielyan, McCluskey, Marsh and Ross2014); (Reference Gabrielyan, Marsh, McCluskey and Ross2018), where the same initial bid level is given to each respondent for all products. Available market data informed the initial bid price, and the discounted and premium prices were selected to cover the range of prices at equivalent intervals. This creates a well-balanced and symmetric design, which minimizes biases even if anchoring is strong (Veronesi et al., Reference Veronesi, Alberini and Cooper2011).Footnote 10 As for ordering effects, randomizing product appearance in the experiment and controlling for positioning in the empirical estimation mitigates these concerns (Cai et al., Reference Cai, Cameron and Gerdes2011). Finally, the nonparametric approach provides an estimate that is free of the concern over the distributional assumption. While these DBCV drawbacks may persist despite these mitigation efforts, the paper provides a necessary first set of estimates of consumer WTP for various cannabis-infused beverages. These insights, particularly when paired with considering the preference ordering of each beverage category and the information on demographic characteristics correlating with WTP, should be valuable to stakeholders on the potential market and consumer base of these cannabis-infused beverages.
This is a new and emerging market with several avenues for future research. Most notably, future research should build upon these results and consider expected consumption patterns of cannabis-infused beverages relative to alcohol or traditional cannabis options. That is, questions remain over whether consumers would substitute away from traditional alcohol or cannabis with this novel product option, or whether they would expect to consume them on the same occasion. This is important from both a marketing and public health perspective.Footnote 11 It could also be useful to gauge demand elasticities and perform market segmentation for frequent versus infrequent users to analyze optimal packaging options and per-unit pricing. A final avenue for future research is to explore and clarify the legal gray area in which cannabis-infused beverages operate (Schuster and Wroldsen, Reference Schuster and Wroldsen2018; Villa, Reference Villa2021). In no way should the results of this paper be considered guidance on the legal framework, and additional work is needed to better understand the legislative frameworks regulating the labeling, materials/input sourcing, distribution, etc., of cannabis-infused beverages.
Acknowledgments
The author thanks the editor and an anonymous reviewer for their comments and suggestions during the review process. Their effort and insights greatly improved the quality and direction of the paper.


 Open access