


Impact Statements
The transition to renewable energy sources introduces challenges for electricity grid stability due to the weather dependency of wind and solar power. In particular, Dunkelflaute events, that is periods of low wind and solar generation, pose a substantial risk of supply shortages. This study employs a novel generative deep learning framework to downscale climate model projections and assess the future risk of Dunkelflaute events in Germany. Our results indicate that both frequency and duration of such events remain largely stable under both moderate and high-emission scenarios through the 21st century. These findings suggest existing risk management strategies may remain effective, while the proposed method provides a transferable, high-resolution tool for evaluating renewable energy reliability in a changing climate.
1. Introduction
Meeting the EU’s Green Deal targets (net-zero emissions by 2050; $ \ge 55\% $
reduction by 2030) demands a rapid expansion of variable renewables, especially wind and solar (European Commission, 2019). Renewables already supplied 44.7% of EU electricity in 2023 and 62.7% in Germany, where wind and solar accounted for 31.5% and 13.8%, respectively (Eurostat, 2024; Collins, Reference Collins2025; Enerdata, 2025). This trajectory is expected to continue, with the share of renewables projected to reach up to 80% by 2030 (Meza, Reference Meza2025). As weather-dependent sources grow, the power grid becomes increasingly sensitive to meteorological variability. In particular, simultaneous lulls in both wind and solar output pose a serious challenge. These so-called “Dunkelflaute” (or “dark doldrums”) events, typically occurring in winter under prolonged high-pressure, cloudy, low-wind conditions, can knock out most renewable generation at once. Germany experienced pronounced examples in November and December 2024: a week-long event in November cut renewables to 30% of supply and drove baseload prices to 145 €/MWh (compared to
$ \ge 55\% $
reduction by 2030) demands a rapid expansion of variable renewables, especially wind and solar (European Commission, 2019). Renewables already supplied 44.7% of EU electricity in 2023 and 62.7% in Germany, where wind and solar accounted for 31.5% and 13.8%, respectively (Eurostat, 2024; Collins, Reference Collins2025; Enerdata, 2025). This trajectory is expected to continue, with the share of renewables projected to reach up to 80% by 2030 (Meza, Reference Meza2025). As weather-dependent sources grow, the power grid becomes increasingly sensitive to meteorological variability. In particular, simultaneous lulls in both wind and solar output pose a serious challenge. These so-called “Dunkelflaute” (or “dark doldrums”) events, typically occurring in winter under prolonged high-pressure, cloudy, low-wind conditions, can knock out most renewable generation at once. Germany experienced pronounced examples in November and December 2024: a week-long event in November cut renewables to 30% of supply and drove baseload prices to 145 €/MWh (compared to $ \sim $
40 €/MWh on average) (Timera Energy, 2025), while a December episode briefly pushed prices past 175 €/MWh (Timera Energy, 2025). These episodes demonstrate that Dunkelflaute events already cause acute supply shortfalls and extreme price volatility, underscoring the need to assess their future risk under climate change. Prior work has mainly characterized Dunkelflaute events under historical climate but not projected them into the future. For example, meteorological studies of Germany show that they occur mostly in winter when solar irradiance is naturally low and winds—normally strong in this season—become stagnant; they last a few days and typically recur a couple of times per winter (Mockert et al., Reference Mockert, Grams, Brown and Neumann2023). Similarly, Kittel and Schill (Reference Kittel and Schill2024b) examined historical events across Europe using aggregated time series per country. There is a growing number of studies highlighting how wind and solar lulls combine (Kittel and Schill, Reference Kittel and Schill2024a; Biewald et al., Reference Biewald, Cozian, Dubus, Zappa and Stoop2025), but they focus on past data and fixed portfolio effects, and thus do not necessarily allow conclusions about future scenarios under climate change.
$ \sim $
40 €/MWh on average) (Timera Energy, 2025), while a December episode briefly pushed prices past 175 €/MWh (Timera Energy, 2025). These episodes demonstrate that Dunkelflaute events already cause acute supply shortfalls and extreme price volatility, underscoring the need to assess their future risk under climate change. Prior work has mainly characterized Dunkelflaute events under historical climate but not projected them into the future. For example, meteorological studies of Germany show that they occur mostly in winter when solar irradiance is naturally low and winds—normally strong in this season—become stagnant; they last a few days and typically recur a couple of times per winter (Mockert et al., Reference Mockert, Grams, Brown and Neumann2023). Similarly, Kittel and Schill (Reference Kittel and Schill2024b) examined historical events across Europe using aggregated time series per country. There is a growing number of studies highlighting how wind and solar lulls combine (Kittel and Schill, Reference Kittel and Schill2024a; Biewald et al., Reference Biewald, Cozian, Dubus, Zappa and Stoop2025), but they focus on past data and fixed portfolio effects, and thus do not necessarily allow conclusions about future scenarios under climate change.
To assess future Dunkelflaute risk, climate projections with high spatial and temporal resolution are needed to capture local weather patterns and short-term variability. Future climate projections from output of global climate model (GCM) simulations are provided by the Coupled Model Intercomparison Project Phase 6 (CMIP6) extending to the year 2100 (Eyring et al., Reference Eyring, Bony, Meehl, Senior, Stevens, Stouffer and Taylor2016). However, their native resolution, typically on the order of 100 km, remains too coarse for detailed, local impact assessments. Downscaling therefore refines GCM output either dynamically or statistically. Dynamical downscaling, on the one hand, uses high-resolution regional climate models (RCMs) driven by GCM output to simulate local climate processes explicitly (Giorgi et al., Reference Giorgi, Jones and Asrar2009). Databases, such as EURO-CORDEX, provide these high-resolution climate projections (12–50 km) for Europe (Kotlarski et al., Reference Kotlarski, Keuler, Christensen, Colette, Déqué, Gobiet, Goergen, Jacob, Lüthi, van Meijgaard, Nikulin, Schär, Teichmann, Vautard, Warrach-Sagi and Wulfmeyer2014). There are first studies that applied such dynamical downscaling approaches to CMIP6 data to investigate future Dunkelflaute events (Duchêne et al., Reference Duchêne, Van Schaeybroeck, Hamdi, Van den Bergh, Smet, Caluwaerts and Termonia2024). Data from the EURO-CORDEX database is used to derive energy relevant variables by the Copernicus Pan-European Climate Database (PECD v4.2) (Copernicus Climate Change Service (C3S), 2022), which provides wind and solar energy generation time series for past and future scenarios. However, different GCM-RCM pairings can yield divergent local trends even under the same scenario (Kjellström et al., Reference Kjellström, Nikulin, Strandberg, Christensen, Jacob, Keuler, Lenderink, van Meijgaard, Schär, Somot, Sørland, Teichmann and Vautard2018), particularly in complex terrain and coastal regions (Moemken et al., Reference Moemken, Reyers, Feldmann and Pinto2018). Moreover, the PECD remains constrained to selected GCM-RCM pairings, is largely deterministic, and often provides only monthly or aggregated fields rather than the sub-daily spatiotemporal data.
Statistical downscaling, on the other hand, builds empirical relationships between large-scale predictors and local weather and is computationally efficient, but traditional methods often fail to capture the complex spatio-temporal dependencies of multivariate weather fields (Maraun and Widmann, Reference Maraun and Widmann2018; Vandal et al., Reference Vandal, Kodra and Ganguly2019). To address this, we adapt a generative deep-learning framework (Schmidt et al., Reference Schmidt, Schmidt, Strnad, Ludwig and Hennig2025) based on score-based diffusion models trained on high-resolution ERA5 to learn joint local weather statistics and to conditionally map coarse CMIP6 fields to spatio-temporally consistent, turbine-relevant realizations. Crucially, the model’s probabilistic sampling produces many plausible high-resolution futures, enabling uncertainty-aware projections of Dunkelflaute occurrence, duration and regional variability across the CMIP6 ensemble.
2. Data and methods
2.1. Data
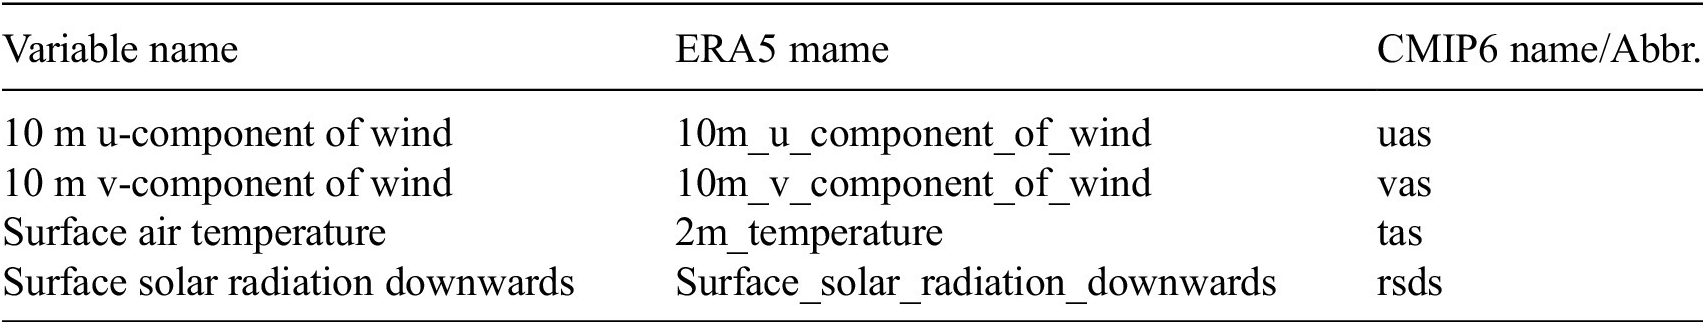
We use the ERA5 reanalysis dataset (Hersbach et al., Reference Hersbach, Bell, Berrisford, Biavati, Horányi, Sabater, Nicolas, Peubey, Radu, Rozum, Schepers, Simmons, Soci, Dee and Thépaut2018) from the Copernicus Climate Change Service (C3S) for the years 1979 to 2024 with a spatial resolution of 0.25° and a six hourly temporal resolution. Six-hourly resolution was shown to be a good compromise between temporal resolution and computational cost (Effenberger et al., Reference Effenberger, Ludwig and White2023). The variables needed to compute the wind and solar power generation are given in Table 1. For future projections, we use a selection of the Coupled Model Intercomparison Project Phase 6 (CMIP6) dataset (Eyring et al., Reference Eyring, Bony, Meehl, Senior, Stevens, Stouffer and Taylor2016): MPI-ESM1–2-HR, GFDL-ESM4, IPSL-CM6A-LR, MIROC6 and CANESM5. The selection is based on their spread in different climate sensitivities (Meehl et al., Reference Meehl, Senior, Eyring, Flato, Lamarque, Stouffer, Taylor and Schlund2020) and take the variables that correspond to ERA5 (see Table 1). We look at two specific emission scenarios, the Shared Socioeconomic Pathways (SSPs) SSP2-4.5 (referred to as ssp245) and SSP5-8.5 (ssp585), which represent an optimistic low and a high emission scenario, respectively. The CMIP6 data is downloaded using the Pangeo catalogueFootnote 1. A quantile mapping bias correction is applied to the CMIP6 data using coarsened ERA5 reanalysis as a reference.
Time-varying variables used to estimate the CF, along with their names in ERA5 and CMIP6, respectively

2.2. Bias correction of CMIP6 data
Biases can arise from (i) systematic errors in the coarse CMIP6 input and (ii) the generative downscaling model. For future projections of CMIP6 data, we therefore apply quantile-mapping-based bias correction in two stages: first to the raw CMIP6 fields using coarsened ERA5 as reference (compensating (i)), and second to the downscaled output using ERA5 (compensating (ii)). The second step also mitigates artifacts from daily-mean wind inputs, which reduce sub-daily variability and bias wind distributions toward near-zero values (Effenberger et al., Reference Effenberger, Ludwig and White2023) (see Supplementary Figure S1a,b). Further details are provided in Supplementary Section SI 1.
2.3. Estimation of Dunkelflaute events
Dunkelflaute events are generally characterized as periods when the combined wind and solar power generation falls below a specified threshold of installed capacity for an extended period (Kittel and Schill, Reference Kittel and Schill2024a). For event identification, we adopt the methodology described by Mockert et al. (Reference Mockert, Grams, Brown and Neumann2023), which relies on analyzing so-called capacity factor time series.
2.3.1. Pointwise capacity factor time series
The capacity factor (CF) is defined as the ratio of actual power output $ {P}_{\mathrm{generated}} $
to the theoretical maximum output
$ {P}_{\mathrm{generated}} $
to the theoretical maximum output $ {P}_{\mathrm{max}} $
over a given period, i.e.,
$ {P}_{\mathrm{max}} $
over a given period, i.e., $ \mathrm{CF}=\frac{P_{\mathrm{generated}}}{P_{\mathrm{max}}} $
. Here,
$ \mathrm{CF}=\frac{P_{\mathrm{generated}}}{P_{\mathrm{max}}} $
. Here, $ {P}_{\mathrm{max}} $
is determined by the installed capacity and the available wind speed or solar irradiance at each time step. A CF of
$ {P}_{\mathrm{max}} $
is determined by the installed capacity and the available wind speed or solar irradiance at each time step. A CF of $ 1.0 $
indicates operation at full rated capacity for the entire period, while
$ 1.0 $
indicates operation at full rated capacity for the entire period, while $ \mathrm{CF}<1 $
reflects periods of reduced generation due to meteorological conditions, outages, or maintenance. Note that, since in this work the CF is computed from reanalysis or model data, it only reflects meteorological variability, excluding effects from maintenance or outages, such that, for example,
$ \mathrm{CF}<1 $
reflects periods of reduced generation due to meteorological conditions, outages, or maintenance. Note that, since in this work the CF is computed from reanalysis or model data, it only reflects meteorological variability, excluding effects from maintenance or outages, such that, for example, $ \mathrm{CF}=0.3 $
means average output is 30% of capacity, not constant operation at that level. The pointwise CFs are calculated using a modified version of the atlite Python package (Hofmann et al., Reference Hofmann, Hampp, Neumann, Brown and Hörsch2021), requiring only the variables listed above (Figure 1a, Table 1):
$ \mathrm{CF}=0.3 $
means average output is 30% of capacity, not constant operation at that level. The pointwise CFs are calculated using a modified version of the atlite Python package (Hofmann et al., Reference Hofmann, Hampp, Neumann, Brown and Hörsch2021), requiring only the variables listed above (Figure 1a, Table 1):
-
• On and Offshore wind: The 10 m u- and v-components of the wind are extrapolated to turbine height (for onshore Vestas V112 3-MW model and for offshore 5-MW NREL as reference turbines) using the logarithmic wind profile, which requires surface roughness (fsr) as input. fsr is assumed to remain constant over time and is estimated from the ERA5 dataset.
-
• Solar: The surface solar radiation downwards (ssrd) is decomposed into direct and diffuse components using the Erbs model (Erbs et al., Reference Erbs, Klein and Duffie1982), which requires the surface air temperature as input. The top-of-the-atmosphere (toa) influx is estimated from the solar constant and the cosine of the solar zenith angle, which is calculated from the time and location of each grid cell. The toa influx, direct and diffuse components are then used to calculate the power output of a fixed-tilt photovoltaic system with a solar azimuth of 180° (South) and a slope of 35°.
2.3.2. Aggregation of local capacity factors
The local CFs per technology are then averaged considering only grid cells within German borders (compare Supplementary Figure S4) to obtain one characteristic time series per technology for Germany. We adopt the atlite package’s assumption, which states that the spatial allocation of installed wind and solar capacities is proportional to the respective local capacity factors of each technology. The national CF is calculated as a weighted average of each technology’s capacity factors, using current installed capacity shares, and this approach is applied consistently for both historical and future periods. For Germany in 2024, the installed capacities are: 57.7% solar (99.3 GW), 36.9% onshore wind (63.5 GW), and 5.4% offshore wind (9.2 GW) (Bundesnetzagentur, 2025). For further details, we refer to Section SI 2.
2.3.3. Definition of a Dunkelflaute event
The definition of Dunkelflaute events is not standardized in the literature, and different studies have used various thresholds and criteria to identify them (Mockert et al., Reference Mockert, Grams, Brown and Neumann2023; Kittel and Schill, Reference Kittel and Schill2024a; Biewald et al., Reference Biewald, Cozian, Dubus, Zappa and Stoop2025). In brief, these can be categorized into three main approaches: meteorological definitions, which identify characteristic large-scale or local weather patterns linked to low renewable generation (e.g., persistent high-pressure systems, weak winds, and/or low solar irradiance), often via indices or circulation-type classifications (Ohba et al., Reference Ohba, Kanno and Nohara2022; Effenberger et al., Reference Effenberger, Samarin, Schillinger and Knutti2025); supply-based definitions, which operationalize Dunkelflaute events directly from renewable generation (typically via combined wind–solar CF time series falling below a threshold for a minimum duration) (Kaspar et al., Reference Kaspar, Borsche, Pfeifroth, Trentmann, Drücke and Becker2019; Mockert et al., Reference Mockert, Grams, Brown and Neumann2023; Kittel and Schill, Reference Kittel and Schill2024a); and supply-and-demand definitions, which additionally incorporate electricity demand and classify events when renewable supply drops below a specified fraction of demand (van der Wiel et al., Reference van der Wiel, Stoop, van Zuijlen, Blackport, van den Broek and Selten2019; Otero et al., Reference Otero, Martius, Allen, Bloomfield and Schaefli2022). This work focuses on the weather dependency of Dunkelflaute events and therefore follows the supply-based approach. In particular, following Mockert et al. (Reference Mockert, Grams, Brown and Neumann2023), we define a Dunkelflaute event as a period during which the 48-hour-mean combined CF remains below a threshold of 0.06, shown exemplarily in Figure 1c for the year 2024 with the above-mentioned events in November and December 2024 (red stars). Consecutive low-generation periods are merged into a single event and assigned to the first day on which they occur. This definition captures compound wind–solar droughts, remains straightforward to interpret, and is independent of assumed system configurations, thereby ensuring comparability across scenarios and climate projections. This procedure enables systematic identification of events/year (Figure 1d). The notable 1997 peak aligns with previous studies (Mockert et al., Reference Mockert, Grams, Brown and Neumann2023; Kittel and Schill, Reference Kittel and Schill2024b). The same methodology is subsequently applied to the downscaled CMIP6 data (see Section 2.4).
Overview of the identification process for Dunkelflaute events in Germany. Note: Panel a displays the time series used to calculate local CFs for wind and solar energy in 2024, representative of the approach applied to the full reanalysis dataset. (b) Presents the resulting local CFs for wind and solar energy across Germany, where the different sources (onshore, offshore, PV) are weighted by their relative fraction in 2024. (c) Highlights periods classified as Dunkelflaute events, marked by low wind and solar generation; the red line denotes the threshold of 0.06 used for event detection (Mockert et al., Reference Mockert, Grams, Brown and Neumann2023). (d) Illustrates the timing and duration of significant low renewable generation periods identified in the ERA5 historical record. (e) Shows the individual and weighted average CFs for onshore, offshore wind, and solar energy, considering only grid cells within German borders (with partial cells weighted by their area within Germany, see Supplementary Figure S4). (f) Summarizes the monthly frequency of Dunkelflaute events averaged over the period 1979–2024.

2.3.4. Dunkelflaute event statistics
The individual CFs for wind and solar energy have a clear seasonal cycle. While off- and onshore winds are on average higher in winter and lower in summer, it is vice versa for solar power (Figure 1e). Even though this counterbalance means that on average the capacity remains approximately constant throughout the year (black line in Figure 1e), the lion’s share of Dunkelflaute events occur in winter from November to January (Figure 1f). This is likely because solar CFs are substantially lower in winter due to shorter daylight hours and lower irradiance and cannot compensate for days with low wind speeds that can occur in winter as well as in summer. Consequently, while the average wind CF may be higher in winter than in summer, the combined distribution of wind and solar CFs exhibits greater variability and deeper low tails in winter (Li et al., Reference Li, Basu, Watson and Russchenberg2021; Mockert et al., Reference Mockert, Grams, Brown and Neumann2023).
2.4. Generative downscaling of CMIP6 data
For this work, the downscaling framework is important to capture both spatial and temporal variability in the meteorological variables that drive wind and solar power generation. Temporal downscaling is crucial for accurately representing the diurnal cycle of solar radiation, which is essential for computing realistic solar capacity factors. Despite its importance, temporal downscaling remains difficult to achieve compared to spatial downscaling. Recent works have shown that generative models can be effective in bridging this gap (Bassetti et al., Reference Bassetti, Hutchinson, Tebaldi and Kravitz2024; Schmidt et al., Reference Schmidt, Schmidt, Strnad, Ludwig and Hennig2025; Aich et al., Reference Aich, Fürst, Sestak, Ruiz-Gonzalez, Boers and Brandstetter2026). Spatial downscaling is important for capturing the spatial heterogeneity of wind and solar resources across Germany, which can lead to systematic differences in the aggregated capacity factors when computed from coarse versus downscaled data. Following recent methodological developments in generative modeling, we train a probabilistic model for time series of atmospheric dynamics. This work directly builds on the generative spatiotemporal downscaling framework proposed by Schmidt et al. (Reference Schmidt, Schmidt, Strnad, Ludwig and Hennig2025), which we will abbreviate as GSD (Generative Spatiotemporal Downscaling) in the following.
Panels I and II in Figure 2 show a sketch of this framework. GSD is built around a generative diffusion model (DM) (Sohl-Dickstein et al., Reference Sohl-Dickstein, Weiss, Maheswaranathan, Ganguli, Bach and Blei2015; Song and Ermon, Reference Song, Ermon, Wallach, Larochelle, Beygelzimer, d’Alché-Buc, Fox and Garnett2019; Ho et al., Reference Ho, Jain, Abbeel, Larochelle, Ranzato, Hadsell, Balcan and Lin2020; Kingma et al., Reference Kingma, Salimans, Poole, Ho, Ranzato, Beygelzimer, Dauphin, Liang and Vaughan2021; Song et al., Reference Song, Meng and Ermon2021a, Reference Song, Sohl-Dickstein, Kingma, Kumar, Ermon and Poole2021b; Karras et al., Reference Karras, Aittala, Aila, Laine, Koyejo, Mohamed, Agarwal, Belgrave, Cho and Oh2022). Based on a finite data set, which is assumed to consist of independent draws from a shared probability distribution, DMs are trained to generate new, unseen data points by learning an implicit representation of the unknown data distribution and sampling from it. In GSD, a DM is trained on sequences of high-resolution reanalysis data (here: ERA5) and acts as a probabilistic model for the output space. During inference (i.e. after training), a conditioning mechanism allows for guiding the generated predictions to adhere to flexible boundary conditions provided by coarse climate simulations. This probabilistic formulation ensures that uncertainty associated with downscaling is reflected through sampling multiple plausible predictions. Schmidt et al. (Reference Schmidt, Schmidt, Strnad, Ludwig and Hennig2025) evaluate the model in an on-model setting (i.e. with available ground truth data) and, in a next step, apply it to downscaling output from different members of CMIP6. This work follows a similar approach.
Probabilistic pipeline for spatiotemporal downscaling of multiple variables. This schematic illustrates the generative spatio-temporal downscaling framework adapted from Schmidt et al. (Reference Schmidt, Schmidt, Strnad, Ludwig and Hennig2025). For clarity, only one representative variable is depicted. a: A score-based model is trained on sequences of reanalysis data, enabling the diffusion model to learn fine-scale spatial and temporal patterns. Note that Earth System Model (ESM) simulations are excluded from the training phase. b: An ensemble run from any ESM (here CMIP6, such as MPI-ESM) is selected and pre-processed for downscaling, including an optional bias-correction step to align climate output distributions with reanalysis data. c: The conditional model defines the mapping from the coarse climate simulation ( $ {Y}_{\mathrm{ESM}} $
) to the fine-scale reanalysis space (
$ {Y}_{\mathrm{ESM}} $
) to the fine-scale reanalysis space ( $ {X}_{\mathrm{reanalysis}} $
), establishing constraints for the generative process. d: The trained score model (a) is conditioned on the processed climate input (b) via the observation model (c), generating time series that preserve the statistics and relationships of the coarse climate data. e: The generative model samples from the learned distribution, producing fine-scale downscaled time series. These can be further post-processed to obtain CFs for wind and solar energy.
$ {X}_{\mathrm{reanalysis}} $
), establishing constraints for the generative process. d: The trained score model (a) is conditioned on the processed climate input (b) via the observation model (c), generating time series that preserve the statistics and relationships of the coarse climate data. e: The generative model samples from the learned distribution, producing fine-scale downscaled time series. These can be further post-processed to obtain CFs for wind and solar energy.

We introduce a few modifications to GSD that preserve the core functionality of the original framework but optimizes the training objective in a simpler and more robust way. DMs are special instances of the family of flow-based generative models trained with the Flow Matching (FM) objective (see Section SI 4 for details) (Lipman et al., Reference Lipman, Chen, Ben-Hamu, Nickel and Le2023, Reference Lipman, Havasi, Holderrieth, Shaul, Le, Karrer, Chen, Lopez-Paz, Ben-Hamu and Gat2024). While the generative process in the DM formulation follows a stochastic diffusion path guided by the score function to reach regions of high data density, the FM formulation allows for the construction of more general probability paths. In particular, linear probability paths have been shown to result in more stable training and sampling (Lipman et al., Reference Lipman, Chen, Ben-Hamu, Nickel and Le2023), which is why this work follows the FM formulation rather than the DM formulation.
GDS relies on training a fully unconditional generative model such that all guiding constraints are imposed post-training. While this allows a high degree of flexibility for downstream tasks, we found it advantageous to provide some conditioning information directly during the training. Specifically, we train the generative model on pairs of (i) sequences of reanalysis data and (ii) the corresponding time stamps. The time stamps only include the hour (here: 0:00, 06:00, 12:00, 18:00) and the month (1 through 12). The reasoning is that the hour of the day and the month capture information about the diurnal and the seasonal cycle. We train the conditional model by incorporating a learned embedding of the time stamps into the generative model (Dhariwal and Nichol, Reference Dhariwal, Nichol, Beygelzimer, Dauphin, Liang and Vaughan2021). It is safe to assume that learning the connection between the dynamics and this temporal information directly results in more informed predictions. In particular, the hour-of-day information allows for generating temporally-aligned predictions even if the conditioning information aggregates samples longer than 24 hours.
3. Results
3.1. Evaluation of the downscaling framework
3.1.1. Downscaling performance with respect to the ground truth
We assess the downscaling framework’s ability to accurately reproduce the fine-scale spatial and temporal variability of wind (Figure 3 1st column) and solar (Figure 3 2nd column) energy capacity factors in Germany. We further evaluate the model’s performance during the critical winter months of November through January (Figure 3 3rd column), which are most relevant for Dunkelflaute events. We find that while spatial downscaling is essential to reproduce spatial variability of wind energy (compare Figure 3d vs Figure 3j,m), temporal downscaling is essential for resolving correct solar capacity factors (Figure 3h) due to the diurnal cycle. Without these steps, the coarse input data fails to capture the spatial heterogeneity for the critical winter months Figure 3f) or is even unable to obtain a reasonable number of events Figure 3i). We also see that the bias correction step is essential to avoid an underestimation of the CFs for specific regions (e.g. compare North-East Germany in Figure 3l vs Figure 3c and Figure 3o). The importance of the bias corrected downscaling can also be shown exemplarily for a selected time period of the aforementioned Dunkelflaute events in November/December 2024 (Supplementary Figure S6a). While the general trend is captured also by a coarser spatial and temporal resolution, the bias corrected downscaling is closest to the ground truth. The other methods tend to underestimate the CF and are therefore likely to overestimate the number of Dunkelflaute events. Probabilistic calibration tests (see Supplementary Figure S2) suggest that the model is well-calibrated with some tendency to underdisperse the predictions, which is a common issue in generative models (Price et al., Reference Price, Sanchez-Gonzalez, Alet, Andersson, El-Kadi, Masters, Ewalds, Stott, Mohamed, Battaglia, Lam and Willson2025).
Comparison of different spatial and temporal resolutions and the effect of bias correction. Note: The first column presents pixelwise onshore wind energy CFs, the second column shows solar energy CFs, and the third column depicts the 0.05 quantile of the 48-hour running average of CFs for November–January. Across rows (from top to bottom): (a-c) CFs from ground truth (GT) ERA5 reanalysis data; (d-f) a spatially coarse (1.0°) and (g-i) a temporally coarse (24 h) resolution of the GT respectively; (j-l) the uncorrected downscaling (DS) output; (m-o) the bias-corrected downscaling (DS BC) results. The downscaling outputs are averaged over 10 samples drawn from the generative model.

3.1.2. Evaluation of the historical CMIP6 downscaled data
We compare the spatial and temporal average CF for wind and solar energy in Germany for the downscaled data of the historical CMIP6 runs to the CF obtained from ERA5 reanalysis data in the time range 1980–2014, shown in Figure 4. Since a direct 1:1 comparison between ERA5 and CMIP6 historical model runs is not feasible (ERA5 is an observation-constrained reanalysis that reconstructs the actual historical weather, while CMIP6 historical runs are free-running climate model simulations), we use a 10-year running average to smooth the time series and assess the reproduction of potential temporal trends and variability. The 10 year average of onwind CF remained stable around the period, centered from 1985 to 1998, it decreased in the period since then (1998–2010) by two percentage points (Figure 4a), further the decadal standard deviation is decreasing (Figure 4e). For the offshore wind CF, the decadal variability is also decreasing (Figure 4f), though the CF itself has no clearly visible trend (Figure 4b). Contrary to the onwind CF, the solar CF is increasing by 0.5 percentage points throughout the 30 years (Figure 4c) with an increasing variability. Even though the weighting of solar CF in the combined CF is largest, the effect of the decrease in onshore wind CF dominates the combined CF and over the 30 year period, a decrease from 1998 to 2010 by 0.5 percentage points is visible. The decadal standard deviations of wind (Figure 4e, f), solar (Figure 4g), and combined (Figure 4h) CFs are also consistent with those derived from ERA5.
Comparison of historical CFs obtained from CMIP6 to ERA5. The figure presents a detailed comparison between the 10-year running average capacity factors (CFs) derived from the bias-corrected and downscaled ensemble mean of historical CMIP6 runs and those obtained from ERA5 reanalysis data for the period 1980–2014. In the first row (a-d), the spatially weighted CF time series for Germany are shown, with individual CMIP6 models represented by colored lines and ERA5 reanalysis by grey lines, allowing for a direct temporal comparison across models and the observational reference. The second row (e-h) denotes the respective decadal standard deviation per time point. The third row (i-l) displays the spatially resolved, temporally averaged differences between the downscaled CMIP6 ensemble mean CFs and ERA5 CFs. Specifically, the first column corresponds to onshore wind energy, the second to offshore wind (restricted to grid cells with at least 50% water coverage), and the third to solar energy (restricted to land grid cells). The fourth column shows the weighted mean CFs, where individual sources are combined according to their current relative share in the German energy mix in 2024. The evaluation period covers January 1, 1980, to December 31, 2014.

A similar pattern is observed on a pixel-wise level. For onshore winds, the pixelwise deviations (most pixels show only a very slight overestimation of less than 1%) are marginal for the German mainland (Figure 4i). The coastal region and the Baltic Sea, present an exception from this with a more pronounced deviation between the downscaled and ERA5 CFs (Figure 4j). These biases are likely inherited from the coarse input data taken from the CMIP6 ensemble, which are known to suffer from inaccuracies at the land-sea transition (Allouche et al., Reference Allouche, Bou-Zeid and Iipponen2023; Cavaleri et al., Reference Cavaleri, Balsamo, Beljaars, Bertotti, Davison, Edwards, Kanehama and Wedi2024). We find a slight underestimation for solar energy (Figure 4k) that is almost uniformly distributed over Germany, indicating a consistent climate model bias. The combined weighted mean of the different energy sources aligns well with the CF time series of ERA5 (Figure 4l).
3.2. Historical and future projections of Dunkelflaute events
We first evaluate how well the downscaled CMIP6 data can reproduce the historical record (1980–2014) of occurrences of Dunkelflaute events in Germany using the capacity factor time series (Figure 5a) (see Section 2). For this purpose, the number of events per year is shown as a rolling average over a 10-year window to estimate decadal trends. The downscaled CMIP6 simulations show variability and a range of annual Dunkelflaute occurrences comparable to those in the ERA5 historical record. None of the models exhibit a statistically significant trend (using a Student’s t-test with a 0.05 significance level), nor does data from ERA5. The ensemble mean from 2000 on is very well aligned with the ERA5 data. We observe different behavior of single models compared to ERA5. While data from CANESM5 has a consistent decrease, but with permanently around 1 event per year less than ERA5, MPI-ESM1–2-HR shows an increase over the historical record. GFDL-ESM4 and MIROC6 show some decadal fluctuations, while IPSL-CM6A-LR is roughly stable. The historical ERA5 record lies within the decadal variability of the model ensemble, indicating that the simulations provide plausible scenarios for past Dunkelflaute events. We further look at the distribution of days per event in the historical record (Figure 5d) and find that the downscaled CMIP6 data show a comparable distribution of event durations as the ERA5 data, with a slight overestimation for the IPSL-CM6A-LR model in the duration length.
Yearly occurrences of Dunkelflaute events in Germany for past and future scenarios. The figure shows (a) a comparison of the historical record to ERA5 and the estimated occurrences of Dunkelflaute events for the time until 2100 for the (b) optimistic-case ssp245 and (c) the worst-case ssp585 emission scenarios. The number of events per year is the rolling average over a 10-year window to estimate decadal trends. The second row shows the distribution of the duration of all measured events in the respective time period for (d) historical record and (e, f) future scenarios. The errorband denotes the decadal standard deviation.

Next, we analyze projections for 2020–2100. Under the low-emission scenario (Figure 5b), taking CANESM5 aside, models are roughly in agreement until 2080, when they start to diverge: MPI-ESM1–2-HR, and IPSL-CM6A-LR catch up with CANESM5 and project an increase, while GFDL-ESM4 and MIROC6 show a slight decrease. In the high-emission scenario (Figure 5c), Ensemble mean trend remains stable with no significant changes to around 2–3 events per year. The distribution of duration per event (Figure 5e,f) remains largely unchanged compared to the historical record.
3.3. Local analysis of prolonged periods of low renewable energy generation
While the ensemble mean of CMIP6 suggests no significant change in the overall number of Dunkelflaute events for Germany, notable local variations in the frequency of low capacity factor days may still occur. This spatial analysis is especially important for strategic planning of wind and solar installations, as it identifies regions where the risk of extended low renewable generation may shift over the typical operational lifetime of assets (20–30 years) necessary for informed investment decisions by highlighting areas that may become less optimal under projected future climate conditions. In Figure 6, we assess the pixelwise occurrences of prolonged periods ( $ \ge 48 $
hours) of low combined capacity factors (<6%) for the near future (2020–2050). The historical reference from ERA5 (Figure 6a) shows a heterogeneous spatial distribution across Germany, with a general concentration from southwest to northeast and over the uplands and mountains. The CMIP6 ensemble mean for the historical period (Figure 6b) broadly replicates this pattern, albeit with problems over mountain regions such as the Alps (Figure 6c). For the future scenarios, analysis of the ensemble mean indicates that the spatial distribution of event frequency per grid cell remains largely unchanged (Figure 6d,f) compared to the historical reference, suggesting no substantial alteration in local patterns under future projections. In the future scenarios, we find a consistent decrease in event frequency in the Hessian region (Figure 6e,g) that mainly occur due to projected changes in wind capacity factors in that region (compare Supplementary Figure S8) and a slight decrease in the northeast near the Polish border, that likely arises due to changes in solar capacity factors (compare Supplementary Figure S9). Importantly, the differences in event frequency among the ensemble mean, maximum, and minimum are comparable to the inter-model variability (Supplementary Figure S7).
$ \ge 48 $
hours) of low combined capacity factors (<6%) for the near future (2020–2050). The historical reference from ERA5 (Figure 6a) shows a heterogeneous spatial distribution across Germany, with a general concentration from southwest to northeast and over the uplands and mountains. The CMIP6 ensemble mean for the historical period (Figure 6b) broadly replicates this pattern, albeit with problems over mountain regions such as the Alps (Figure 6c). For the future scenarios, analysis of the ensemble mean indicates that the spatial distribution of event frequency per grid cell remains largely unchanged (Figure 6d,f) compared to the historical reference, suggesting no substantial alteration in local patterns under future projections. In the future scenarios, we find a consistent decrease in event frequency in the Hessian region (Figure 6e,g) that mainly occur due to projected changes in wind capacity factors in that region (compare Supplementary Figure S8) and a slight decrease in the northeast near the Polish border, that likely arises due to changes in solar capacity factors (compare Supplementary Figure S9). Importantly, the differences in event frequency among the ensemble mean, maximum, and minimum are comparable to the inter-model variability (Supplementary Figure S7).
Local risk of prolonged (48 hours) low capacity factors (<6%) for different emission scenarios. The figure shows the spatial distribution of low capacity factors (<6%) per grid cell for Germany and surrounding regions for the period sensitive to low energy production November–February. The first row presents the historical reference for ERA5 (a) and the downscaled CMIP6 ensemble mean for 1985–2014 (b,c). The second and third rows display projected occurrences for 2020–2050 under the ssp245 (d,e) and ssp585 (f,g) scenarios, respectively. The first column shows ERA5 reference, the second column the CMIP6 ensemble maximum, and the third row the difference to the ERA5 reference period.

4. Discussion
The present study adapts a recently developed generative downscaling framework (Schmidt et al., Reference Schmidt, Schmidt, Strnad, Ludwig and Hennig2025) to assess local changes in the risk of Dunkelflaute events projected by the CMIP6 ensemble. With available high-resolution reanalysis ERA5 data, the downscaling framework is trained to learn the joint distribution of the meteorological variables that drive wind and solar power generation. Evaluation against ERA5 data withheld from training and artificially coarsened confirms the model’s ability to produce robust downscaled fields for the CMIP6 ensemble members as well. As a first check, we compare historical CF time series and find that the downscaled CMIP6 simulations reproduce the decadal evolution seen in ERA5 for solar CF time series and yield comparable decadal-mean onshore and offshore wind CFs evolution, with variability consistent with the ERA5 range.
Our results show a substantial spread across CMIP6 models in projected Dunkelflaute occurrences, while the ensemble mean suggests that Germany’s spatially averaged frequency of combined low wind and solar generation remains broadly consistent with the ERA5 historical record up to 2015. At the pixel level, the CMIP6 ensemble mean for the historical period largely reproduces the observed spatial pattern, but exhibits pronounced biases in mountainous regions such as the Alps. This is a known bias for wind speeds when downscaling data of mountainous regions (Moemken et al., Reference Moemken, Reyers, Feldmann and Pinto2018; Shen et al., Reference Shen, Zha, Li, Azorin-Molina, Deng, Minola and Chen2022; Lafferty and Sriver, Reference Lafferty and Sriver2023), resulting in our study covering more periods of low output in those regions. However, due to topography, wind turbines are rarely installed there, so this can be neglected for our analysis. We thus argue that the downscaled CMIP6 ensemble data provide a reasonable estimate of the frequency of event occurrences while noting remaining caveats from near-surface wind and downscaling biases that motivate ensemble/probabilistic interpretation rather than single-model forecasts.
These results indicate that the overall frequency of events in Germany is projected to remain at a similar level in most regions, although localized changes may occur, particularly in Southwestern Germany and near the Polish border. For future projections, the ensemble mean suggests that the overall frequency of events in Germany is projected to remain in most regions on a similar level, thus the risk of Dunkelflaute events in Germany is expected to remain stable through most of the century, with some model spread after 2080. The pixelwise analysis confirms this general pattern, but reveals certain areas, particularly in the eastern parts of Germany and Poland, that may experience a reduction in the wind speeds and might therefore become less attractive for newly installed wind power stations. In contrast, parts of Southwestern Germany are projected to become more attractive in the future. This is largely in agreement with other studies. Even though CMIP6 projections consistently indicate a decline in mean near-surface wind speeds across most of Europe over the 21st century, with reductions of around 5–15% under SSP2–4.5 and up to 20% under SSP5–8.5, particularly in northern and central regions (Martinez and Iglesias, Reference Martinez and Iglesias2024), for Germany, however, both raw CMIP6 output and downscaled analyzes suggest only minor changes in mean wind resources, with some small increases under SSP2–4.5 (Effenberger and Ludwig, Reference Effenberger and Ludwig2025). More critical for the energy system is variability: climate change is expected to make very rare but multi-day long wind droughts by 20–40% more likely(Qu et al., Reference Qu, Shen, Zeng, Yang, Zhong, Yang and Lu2025) while intensifying winter storm winds in Northern Europe, both of which pose challenges for grid stability and adequacy (Little et al., Reference Little, Priestley and Catto2023). Such effects could not be identified in this study but were not systematically examined and remain subject to future research.
This work has focused solely on the weather-induced likelihood of periods of combined low wind and solar power generation, which is only one aspect of the overall risk assessment for renewable energy systems. Other factors, such as the availability of storage technologies, grid infrastructure, and demand-side management strategies, also play a crucial role in determining the overall resilience of the energy system (Kittel and Schill, Reference Kittel and Schill2024a). Future work is therefore needed to integrate these aspects into a comprehensive risk assessment framework for renewable energy systems. One potential candidate would be the PyPSA package (Brown et al., Reference Brown, Hörsch and Schlachtberger2018). It has already been used to simulate the European energy grid’s transition towards renewable energy sources (Hörsch et al., Reference Hörsch, Hofmann, Schlachtberger and Brown2018; Frysztacki and Brown, Reference Frysztacki and Brown2020) and could be used to assess the impact of Dunkelflaute events on the grid’s stability. These should then be coupled with local demand time series and storage capacities. To explore the grid stability, one could consider coupling the downscaled data with a grid simulation model that simulates the flow of electricity through the grid.
The methodology presented here is general and can be applied to any region by training the generative downscaling framework on local high-resolution reanalysis data and conditioning on relevant coarse climate model outputs. This enables assessment of Dunkelflaute risks or similar meteorological events in different geographic contexts. The presented climate change impact assessment uses the CMIP6 ensemble as input. These are tied to hard-coded emission pathways, the so-called Shared Socioeconomic Pathways (SSPs) and Representative Concentration Pathways (RCPs), i.e., standardized scenarios describing different future trajectories of global societal development (e.g., population growth, economic development, technological progress) combined with different levels of greenhouse gas emissions. Thus, they offer only limited flexibility for “what-if” questions outside the existing SSP-RCP matrix. Future work will therefore address this limitation by further developing our framework (Schmidt et al., Reference Schmidt, Schmidt, Strnad, Ludwig and Hennig2025) into a conditional generative one that, for specified conditions (e.g., +1.5 °C warming), produces physically plausible coherent ensembles of meteorological fields and translates them into impact-ready variables - enabling rapid, flexible, and high-fidelity scenario generation tailored to decision-maker needs.
5. Conclusion
The downscaling framework presented here is a powerful tool for generating high-resolution climate projections that can be used to assess the potential impacts of climate change on renewable energy resources. We find that the ensemble mean of the downscaled CMIP6 data aligns with the historical record to a reasonable degree to assess the capacity factor time series for Germany and the associated occurrences of Dunkelflaute events. Our results suggest that the overall risk of Dunkelflaute events in Germany is likely to remain broadly stable throughout most of the 21st century, although uncertainty across models increases after 2080. At the same time, regional shifts in the frequency of low renewable generation periods may arise, with changes most apparent in Southwestern Germany and near the Polish border. Future research should embed these findings in a broader risk assessment of renewable energy systems that also accounts for storage deployment, grid constraints, and demand-side management.
Open peer review
To view the open peer review materials for this article, please visit http://doi.org/10.1017/eds.2026.10038.
Supplementary material
The supplementary material for this article can be found at http://doi.org/10.1017/eds.2026.10038.
Author contribution
The joint project was initiated by F.S. and N.L. and coordinated by P.H. and N.L. J.S. implemented the code base for the model and training. F.S. and J.S. handled data-processing and -pipeline (reanalysis data) and designed the experiments. F.S. implemented the data-processing for the climate simulations. F.S. was responsible for evaluation and visualization of the results. All authors discussed the results. The first version of the article was written by F.S., after which all authors reviewed and edited the manuscript.
Data availability statement
Datasets for the observational data from 1979 to date were taken from Copernicus Climate Change Service (C3S) (https://cds.climate.copernicus.eu/cdsapp#!/dataset/reanalysis-era5-pressure-levels?tab = overview) (Hersbach et al., Reference Hersbach, Bell, Berrisford, Biavati, Horányi, Sabater, Nicolas, Peubey, Radu, Rozum, Schepers, Simmons, Soci, Dee and Thépaut2018). The CMIP6 data were obtained from the Pangeo catalogue (https://pangeo-data.github.io/pangeo-cmip6-cloud/). The code for the downscaling framework is available at https://github.com/schmidtjonathan/DunkelFlowte n. The analysis uses the geoutils package (Strnad, Reference Strnad2023). The analysis scripts can be found at https://github.com/fstrnad/dunkelflauten.git.
Funding statement
The project is supported by the German Federal Ministry of Research, Technology and Space (BMFTR) through the FEAT project (grant number 01IS22073B). The authors gratefully acknowledge financial support by the DFG Cluster of Excellence “Machine Learning - New Perspectives for Science,” EXC 2064/1, project number 390727645. J.S. thanks the International Max Planck Research School for Intelligent Systems (IMPRS-IS) for supporting his PhD program. We acknowledge support by Open Access Publishing Fund of University of Tübingen
Competing interests
The authors declare that they have no competing interests.


 Open access
Comments
Dear Editors,
along with this letter, we would like to submit our manuscript “Assessing the risk of future Dunkelflaute events for Germany using generative deep learning” for review at Environmental Data Science. TThe paper develops and applies a probabilistic, generative deep-learning downscaling framework to produce high-resolution, uncertainty-aware projections of concurrent low-wind/low-solar episodes (so-called ``Dunkelflaute‘’ events) in Germany from a selection of CMIP6 scenarios, and evaluates the implications for future electricity system reliability and flexibility needs. The application to the German region can be regarded as an exemplary case study, as the methodology is general and can, in principle, be applied to any region.
Dunkelflaute events --- multi-day periods of simultaneously low wind and solar power generation --- pose a critical challenge for electricity systems that rely on renewables. Their occurrence can lead to supply shortages and extreme price volatility, as seen in recent German episodes.
While reliable estimates of their future risk are essential for planning resilient energy systems, current global climate projections lack the spatial and temporal resolution required to capture these events. Machine learning-based downscaling offers a promising pathway to bridge this gap by generating high-resolution, uncertainty-aware realizations consistent with coarse climate model information. Our study exploits a novel deep-learning-based statistical downscaling approach that can generate uncertainty-aware realizations of high-resolution projections from coarse-resolution climate model outputs and can translate these into localized impact assessments. The main findings of our study are as follows:
(1) We introduce a generative deep-learning downscaling framework that preserves coarse CMIP6 climate information while producing plausible high-resolution weather trajectories enabling realistic spatio-temporal quantification of wind and solar energy generation with quantified uncertainty.
(2) We show that the frequency of Dunkelflaute events in Germany remains relatively stable in the CMIP6 ensemble mean throughout the 21st century, but there is significant inter-model variability, with some models projecting increases and others decreases in event frequency.
(3) We identify localized changes in risk, with an increased likelihood of very low wind and solar conditions for example in southwestern Germany.
We believe these results will be of broad interest to the climate and energy community, as they provide both methodological advances and insights for planning and grid resilience under climate change. All code for reproducing the analysis, as well as the pre-processing and post-processing scripts used to generate the input data for the analysis, are publicly available at https://github.com/fstrnad/dunkelflauten.
The datasets used in this study are publicly available from the sources cited in the manuscript.
On behalf of all authors,
Best regards,
Felix Strnad