


I. Introduction
Employees in finance, particularly in asset management and investment banking, have been known to earn significantly higher wages than their comparable nonfinance counterparts since the 1990s (Philippon and Reshef (Reference Philippon and Reshef2012), Boustanifar, Grant, and Reshef (Reference Boustanifar, Grant and Reshef2018)) and significantly higher returns on talent (Célérier and Vallée (Reference Célérier and Vallée2019)). These findings raise the question whether finance may have lured talent away from other sectors, especially via attractive performance-based pay (Bénabou and Tirole (Reference Bénabou and Tirole2016), Böhm, Metzger, and Strömberg (Reference Böhm, Metzger and Strömberg2022)). Talent allocation is not likely to respond just to wage differences at a given point in time but rather to differences in the entire career paths within and between industries (see, e.g., Hampole (Reference Hampole2024)).
Entering a specific industry requires costly, industry-specific education and on-the-job training, fostering persistence in occupational choices. In fact, educational choices are based on expectations for future earnings in the corresponding sectors (Kirkeboen, Leuven, and Mogstad (Reference Kirkeboen, Leuven and Mogstad2016), Wiswall and Zafar (Reference Wiswall and Zafar2021)). Hence, talent allocation should be driven by the comparison between lifetime earnings profiles associated with careers in different industries, that is, by the resulting risk-adjusted value of human capital. This is precisely the approach we take in this article to assess the attractiveness of finance relative to other sectors. More precisely, we produce synthetic risk-adjusted measures of career profiles that are comparable across sectors, allowing for the evaluation of the relative attractiveness of different sectors from the perspective of talent allocation. To do so, we rely on panel data that allow us to follow individual professionals over their work lives, rather than using repeated cross sections that sample different professionals at each date to estimate returns to experience, as done by Philippon and Reshef (Reference Philippon and Reshef2012).Footnote 1 The longitudinal dimension of our data enables us to take into account that careers can develop entirely within one industry or sector, but may also span across sectors, which is not feasible with repeated cross-sectional data.
Following the career path of the same professional over time requires using resume-based data. We collect data on the careers of 11,255 randomly drawn professionals who work in finance, manufacturing, and high tech at some point between 1980 and 2017. We first document that the choice of industry made by professionals at entry is quite persistent: 75% of those who initiate their career in either finance or nonfinance remain in the same industry 20 years later, although a nonnegligible number of workers switch across sectors during their careers. Even within specific sectors of finance, professionals are more likely to stay in their entry sector (e.g., asset management and investment banking) than to switch to other sectors. Such persistence in occupational choices squares with evidence that early-career shocks durably affect compensation and career advancement: a buoyant stock market encourages MBA students to go directly into investment banking upon graduation, with a large and lasting positive effect on their careers (Oyer (Reference Oyer2008)), while people graduating during recessions suffer a decade-long earnings gap (Oreopoulos, von Wachter, and Heisz (Reference Oreopoulos, von Wachter and Heisz2012)). Also, CEOs’ careers are permanently affected by macroeconomic conditions at the time of their labor market entry (Schoar and Zuo (Reference Schoar and Zuo2017)).
Next, we compare typical career profiles. Given the persistence of industry choices in our sample, we assign careers to sectors based on the sector of entry of a given individual: as such, a career in a given sector (say, banking and insurance) allows for possible subsequent switches to other sectors (e.g., asset management and investment banking), weighted by their respective frequencies observed in our data. Since our resume data provide information about job titles but not actual compensation levels, we measure the typical earnings potential associated with a specific job, sector, and year by imputing the corresponding average annual salary drawn from the Current Population Survey (CPS). For top executive jobs, the imputed compensation also includes bonus payments, stocks, and options, to better reflect the compensation packages received by these employees. To this end, we use compensation data from 10-K forms and proxy statements, which include not only the fixed component but also the performance-based component of total pay. These dollar metrics of job titles enable us to compare career paths in the financial and nonfinancial industry, as well as between sectors of the former—that is, asset management and investment banking, and commercial banking and insurance, or of the latter—that is, high tech, manufacturing, and services.
We find that the typical career profile of professionals in finance features a substantial wage differential relative to nonfinance professionals in our sample, averaging 37% at the time of entry. When we consider total imputed compensation rather than wages, the differential with nonfinance workers is not only large but increasing over the career, the average differential being 40% at entry and 67% after 30 years. This evidence partly reflects the fact that careers in finance are faster, as witnessed by finance professionals being significantly more likely to attain top executive positions.
Careers also differ across the sectors of finance: the average career profiles of professionals in asset management and investment banking lie above those in banking and insurance, as well as those of nonfinance employees. High tech features the second-highest career profile, significantly above that of employees in banking and insurance, as well as services and manufacturing. Importantly, these sector-level differences between career paths persist also upon controlling for individual characteristics, in terms of educational attainment, quality of the educational institution, gender, and cohorts, and therefore do not simply reflect sector differences in composition.
While the visual comparison of average wage and total compensation profiles enables us to effect a broad comparison of career paths across industries and sectors, it fails to provide a synthetic measure of the various dimensions of career paths that may naturally affect the valuation by a (risk-averse) worker. Indeed, the time profiles of careers may differ in their intercept (i.e., entry-level pay level), slope (i.e., return to on-the-job experience), and risk (i.e., pay predictability).
Precisely to bring together these three dimensions of career development that should drive the allocation of talent, we devise synthetic measures of career characteristics. The most basic one, which does not include risk, is the present discounted value (PDV) of the average wage (or total compensation) that workers earn in our sample over time, that is, the risk-neutral valuation of their human capital when invested in a given sector. Such valuation can also be conditioned on the worker’s characteristics, including education, gender, and cohort, thus controlling for workers’ heterogeneity. Importantly, this metric enables us to compute the “career premium” (or “discount”) of one sector (say, asset management and investment banking) against a common benchmark (that we choose to be the service sector), defined as the ratio between the PDVs of the respective average wages (or total compensation).
It is worth comparing this analysis to that carried out in Section V of Philippon and Reshef (Reference Philippon and Reshef2012), where they acknowledge that career choices may be driven not only by differences in spot wages but also by their gradient over time and by their risk. The limit of their analysis is that they use repeated cross-sectional data, which do not enable them to observe the development of careers over time for the same professionals, and thus to compute individual career slopes as we do.
We find that workers in the finance sector earn a “career premium” relative to similar nonfinance workers, but such premium is concentrated in asset management and investment banking. Within the nonfinance sector, careers in high tech pay a premium relative to service firms, though not as large as the premium paid in asset management and investment banking.
It is natural to ask whether such premia can be regarded as a compensation for differential career risk, stemming both from the time-series volatility of wages and the cross-sectional variability of careers within each sector: before entering a sector workers may be uncertain about the shape of career paths, so that entry in a given sector is a draw of a specific career path from a distribution of possible paths in that sector. To take this into account, we compute the “certainty equivalent” (CE) of careers in each sector, defined as the constant pay that would yield the same expected utility as that obtained by the typical worker entering a given sector, based on his/her observed pay, assuming a time-additive, constant relative risk aversion (CRRA) utility function. As the estimated CE depends on the assumed CRRA coefficient, we compute it for values of this coefficient ranging from 0 to 2, which according to Chetty (Reference Chetty2006) is the CRRA upper bound consistent with existing estimates of labor supply elasticity. We find that for this parameter range, the CE of asset management careers significantly exceeds that of other sectors, with that of high tech being the second highest. Hence, differential risk alone cannot account either for the career premium observed in asset management and investment banking and in high-tech industries.
Another natural question is whether the career premia documented for the sample as a whole have been persistent over time or not. We address this question by applying our approach to the first 10 years of the career paths of all cohorts entering our sample from 1990 to 2006. In this respect, it is worth noticing that our notion of career premium differs conceptually from the wage premium analyzed by Philippon and Reshef (Reference Philippon and Reshef2012), because it refers to the prospective income of a particular cohort, rather than the cross-sectional average of the incomes of all employees (belonging to different cohorts) in a given year; as such, it enables comparisons across cohorts and even generations. Indeed, we find that careers in asset management and investment banking, though featuring a higher CE than those in other sectors for all cohorts, have become comparatively less attractive over time: the career premium in asset management and investment banking has declined between 1990 and 2006, especially relative to the high-tech sector. This finding highlights the difference between our metric and that proposed by Philippon and Reshef (Reference Philippon and Reshef2012), who document a steadily increasing finance wage premium since the 1990s. The reason for this finding is that, although careers in asset management and investment banking became more attractive in the early 1990s and 2000s, in each case there was a reversal, possibly due to the labor market impact of financial crises. Instead, the CE of careers in other sectors displays a trend increase, especially in high tech, except for a sharp setback after the burst of the 2001 dotcom bubble.
Finally, we explore whether changes in the attractiveness of careers over time have any explanatory power for the allocation of labor across sectors. The fraction of new entrants declined markedly in finance—especially in asset management and investment banking—from 1990 to 2020, while it rose in high tech, with a first wave in 1993–2000 and a second one after 2010, as well as in services in 2000–2010. To establish whether entry choices are correlated with changes in the attractiveness of careers across sectors, we estimate a multinomial logit model where the entry choices of the individuals in our sample are regressed on the sector CE premia (relative to the service sector), controlling for worker characteristics. Our choice of measuring job market entrants’ beliefs based on ex post realizations of career paths is consistent with Wiswall and Zafar (Reference Wiswall and Zafar2021), who analyze survey data regarding the careers of high-ability college students and document that “the distribution of expected and realized own earnings are remarkably similar” (p. 1365).
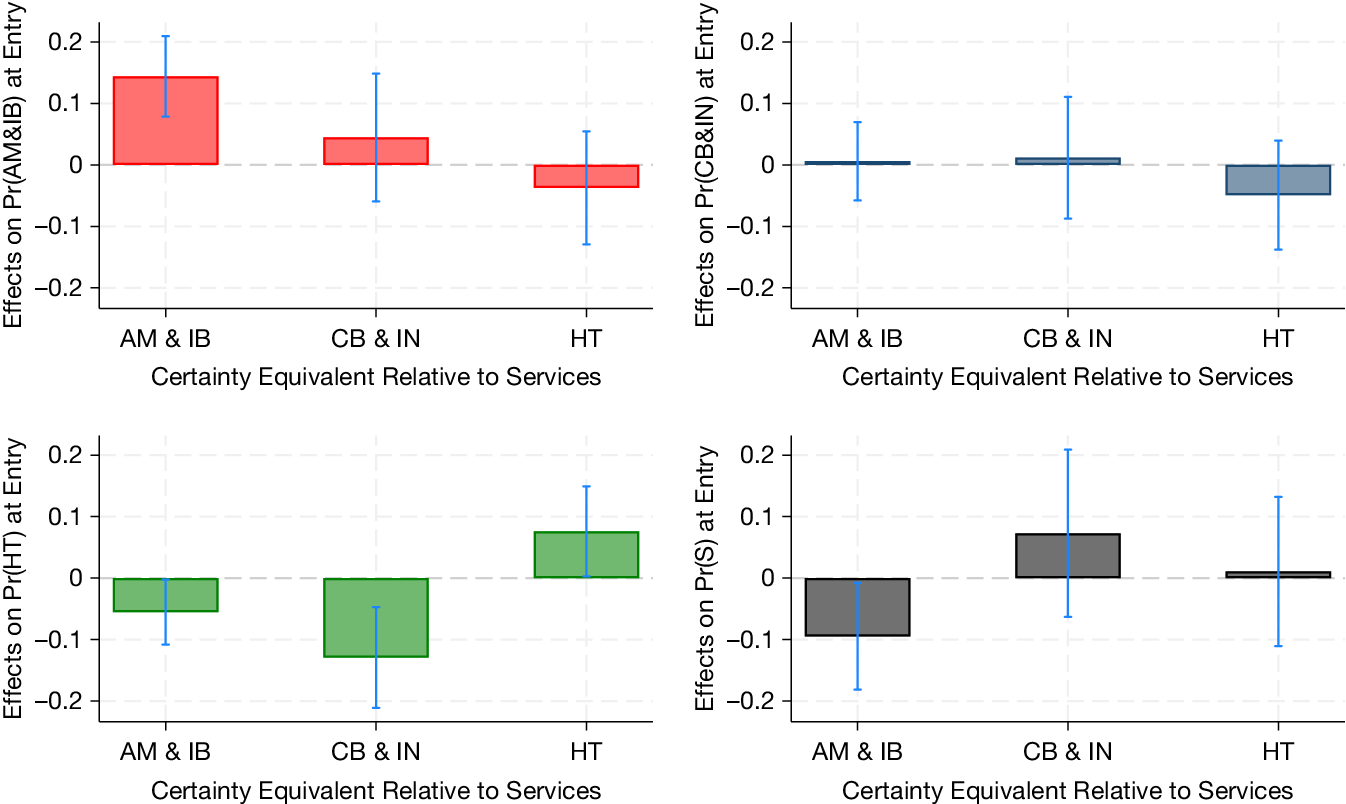
We find that entry in the asset management and investment banking sector, as well as in the high-tech sector, responds positively and significantly to increases in their respective CE premia, while entry in high tech and services responds negatively to increases in the CE premium in asset management and investment banking. This suggests that a career in high tech or services is perceived by labor market entrants as a substitute for a career in asset management and investment banking and that competition by these sectors may account for the decline in the fraction of entrants in asset management and investment banking observed in our sample.
On the whole, our article makes two main contributions. First, we introduce the notion of career certainty equivalent (CE) pay, which refers to a worker’s pay profile over his/her entire career, and can also take into account the risk of the career profile. Comparing this metric across sectors provides a metric of their relative attractiveness for a labor market entrant. When applied to the comparison between finance and nonfinance workers, it yields a measure of the (risk-adjusted) finance career premium, as opposed to the wage premium used so far in the literature. As mentioned previously, this brings a fresh perspective relative to the existing literature about the finance wage premium (Philippon and Reshef (Reference Philippon and Reshef2012), Boustanifar et al. (Reference Boustanifar, Grant and Reshef2018), and Célérier and Vallée (Reference Célérier and Vallée2019)). Indeed, we document that not only wages but also entire career paths differ greatly both between finance and nonfinance and within finance. Moreover, we show that career choices at the entry stage respond significantly to career premia, rather than to entry-level wage premia.
Second, we contribute to the debate about how careers in finance have changed over time by showing that, although careers in asset management and investment banking became more attractive for the cohorts entering in the early 2000s, consistently with the growth of compensation in this sector before the financial crisis (Philippon and Reshef (Reference Philippon and Reshef2012), Greenwood and Scharfstein (Reference Greenwood and Scharfstein2013)), they have become less attractive for cohorts entering right before the crisis, especially compared to those in high tech and services. Indeed, our evidence is consistent with high tech being a potential competitor to asset management and investment banking in the attraction of talent. Not only do both sectors offer a significant career premium relative to others, but the fraction of entrants has been declining in asset management and investment banking and rising in high tech, and the probability of entry in high tech is inversely correlated with the career premium in asset management and investment banking. This squares with other evidence regarding the ebb and flow of young talent between these two sectors in the last 2 decades: the finance boom in the early 2000s led to a reallocation of engineers to the financial sector that made them less likely to subsequently become entrepreneurs (Gupta and Hacamo (Reference Gupta and Hacamo2019)); conversely, the 2008–2009 crisis, by reducing the availability of jobs in finance, prompted elite students (such as MIT graduates) to major in science and engineering instead of management or economics and thus diverted them away from asset management into innovative jobs in science and engineering (Shu (Reference Shu2018)).
The rest of the article is organized as follows: Section II describes the data. Section III starts with evidence that most individuals choose across careers rather than jobs when they enter the job market and then illustrates the differences in career paths between the finance and nonfinance sectors, as well as across their sectors. Section IV analyzes how these differences have changed over time by considering successive cohorts and explores their correlation with individual labor market entry decisions. Section V concludes.
II. Data
Our analysis draws on manually collected data on individual career trajectories. The data were extracted in 2018 from a major online professional networking platform that hosts resume-style profiles detailing users’ employment histories, education, and skills. We start by making queries to the platform based on location and sectors of employment and to identify the profiles of individuals located in the United States and employed in manufacturing, finance, or high-technology industries as of 2018. Then, from the set of individual profiles identified in this first step, we draw a random sample of about 4,000 professionals for each sector. Finally, we drop the profiles that have too sparse information about key variables such as education and/or previous experience, resulting in a sample of 11,255 individual career profiles.
For each professional present in the resulting sample, we observe gender, education, year of entry into the labor market, and all job transitions within and across firms, including promotions to top executive positions. The data cover employment histories from 1980 to 2018, allowing us to reconstruct complete career paths up to 2018, starting from labor market entry (or 1980 for earlier entrants). To proxy for earnings potential, we assign to each job title the corresponding average sector-specific compensation, as described in the following.
We draw our data from this platform because our objective is to study the allocation of talent and its compensation. From the outset, it is important to note that our sample over-represents highly educated professionals relative to the U.S. population, consistent with our focus on talent. It may also under-represent individuals at both the lower and upper tails of the success distribution: those with fewer achievements may have little incentive to publicize their CVs, while the most successful may be less likely to engage in a job search. However, there is no clear reason to expect this selection to vary systematically across industries.
Compared with previous studies, our data set bridges the gap between aggregate labor statistics and micro-level studies based on elite samples. Unlike Célérier and Vallée (Reference Célérier and Vallée2019), Oyer (Reference Oyer2008), and Shu (Reference Shu2018), who focus on narrowly defined cohorts of elite graduates, our sample of 11,255 professionals spans multiple industries and captures a broader segment of skilled labor. Moreover, our longitudinal resume-based data allow us to follow individual careers over time and measure the slope, persistence, and risk of compensation profiles, whereas Philippon and Reshef (Reference Philippon and Reshef2012) estimate the finance wage premium using repeated cross-sectional data.
As will be explained in the following, by merging detailed career histories with CPS wage data and, in the case of professionals reaching the executive levels, executive compensation from 10-K filings, we are able to construct comprehensive, sector-specific measures of risk-adjusted lifetime compensation that enable direct comparison of career trajectories across industries. We will further discuss the representativeness of our sample in Section II.B.
A. Data Construction
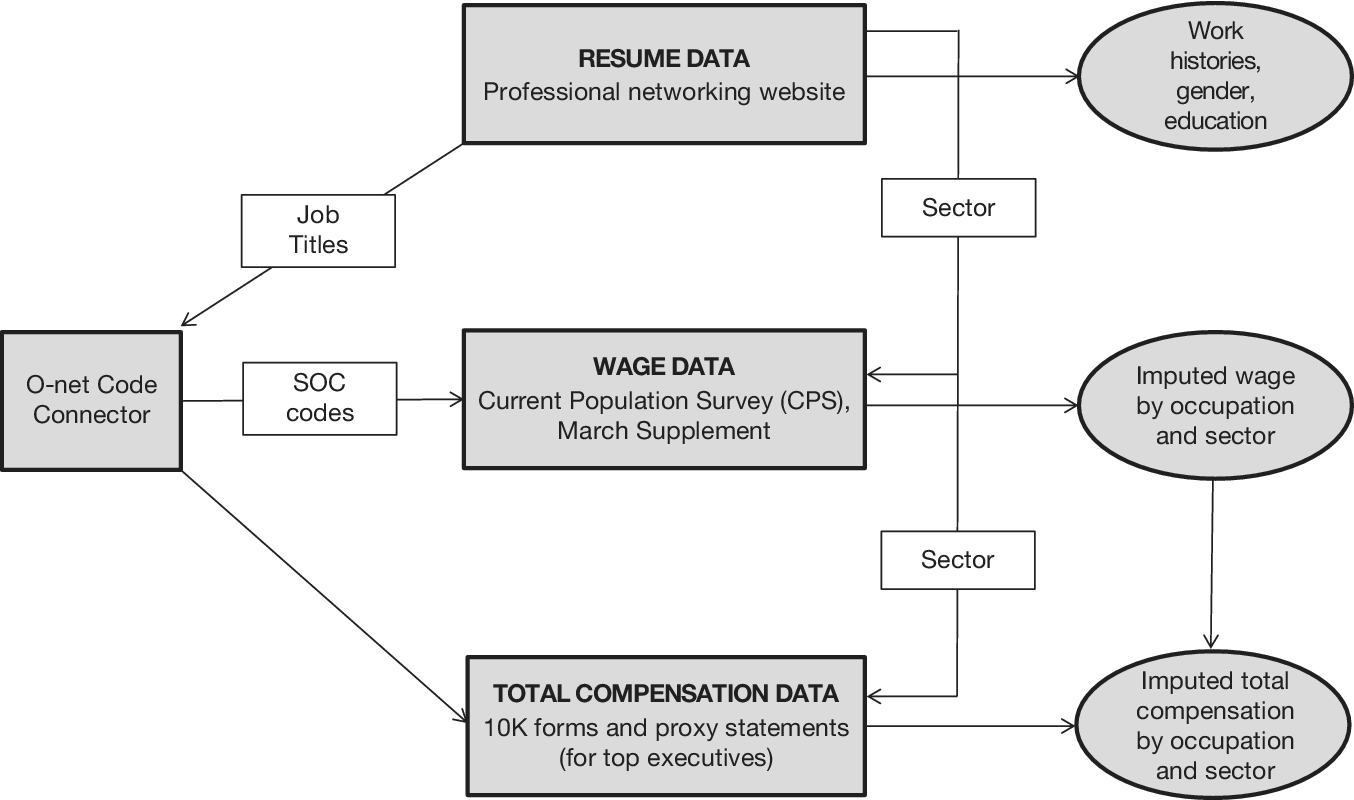
To measure the time profile of compensation over the careers of the workers in our sample, we merge data from different sources, proceeding in the following steps, as illustrated by Figure 1.
In Figure 1, information about work histories (start dates, end dates, employers, and job titles), gender, and education is drawn from individual resumes available on a major professional networking website. Job titles are matched with the Standard Occupational Classification (SOC) codes produced by the Bureau of Labor Statistics (BLS), via the O*Net code connector platform. SOC codes and employment sectors are mapped to the average annual wages using data from the March Supplement of the Current Population Survey (CPS) and to annual compensation (including bonus pay, for top executives) using data drawn from 10-K forms and proxy statements.

First, we assign each employer in our sample to finance, manufacturing, high tech, or services, and within finance to one of two sectors: asset management and investment banking, which we take to include also financial consulting and commercial banking and insurance.Footnote 2 , Footnote 3
Next, we match the job titles reported in individuals’ resumes with the Standard Occupational Classification (SOC) codes produced by the Bureau of Labor Statistics (BLS). Then, we impute to workers in a given sector, occupation, and year, the average CPI-deflated salary reported in the March CPS for the corresponding sector, Census Occupation Code, and year. Since CPS wage data are top-coded and contain no information on the variable (i.e., performance-based) component of compensation, which can be very large for executive positions, in the analysis that focuses on total compensation rather than base salaries, we impute compensation for professionals in these positions using two data sources. First, we collect total executive compensation (including salary, bonus, stock options, and other stock-based remuneration) from ExecuComp. Data from this source provide information for the larger U.S.-listed firms. To make our data informative also about executive compensation in medium-sized and smaller companies, we supplement the ExecuComp data with information from 10-K forms and proxy statements filed between 1994 and 2017 in the EDGAR system. Specifically, we randomly select 250 U.S.-listed firms from each sector, spanning the full distribution of market capitalization except for the top decile, which is already covered by ExecuComp. For these firms, we hand-collect data from their annual 10-K filings and proxy statements on total compensation—salary, bonus, stock options, and stock-based remuneration—awarded by the board to the top executives in the industry.Footnote 4
Then, we impute the average CEO pay for each sector and year to all individuals in our data who hold CEO positions in that sector and year, and we apply the same procedure to individuals holding other top (non-CEO) managerial positions. To avoid over-representation of large firms in the estimation of total compensation for managerial positions, we proceed as follows: For each sector and year, we first compute the mean compensation within each decile of the firm-size distribution (measured by firms’ stock market capitalization). We then average these decile-specific mean compensations and CPI-deflate them to obtain sector-year level estimates for CEOs and other (non-CEO) executives.
The end result is an imputed value for the real wage and total real compensation (including the variable component for executives) for each job title, sector, and year. For individuals employed by more than one company at a time, we keep track of all their positions, defining their compensation as that associated with their best-paid job in the relevant year. Imputed compensation varies with the SOC code for the relevant job title and, within each SOC code, with the sector. For instance, over the 1980–2017 period, the average yearly compensation of a sales manager ranges from $96,277 in manufacturing and $101,283 in high tech to $93,227 in commercial banking and insurance and $107,455 in asset management and investment banking. Naturally, the imputed real wages and total compensation in our sample vary not only across individuals but also within individuals over time, as workers change jobs and, in some cases, advance from rank-and-file or lower-management positions to top managerial roles.
B. Individual Characteristics
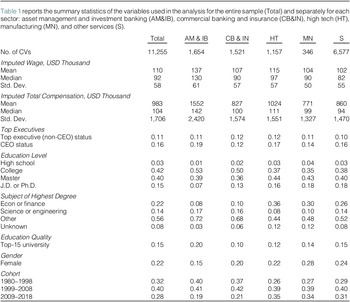
Table 1 describes the characteristics of the individuals in our sample. Workers are classified on the basis of their entry industry of occupation (i.e., that where they start their career). The sample breakdown by industry is roughly balanced across finance sectors (1,654 workers in asset management and investment banking and 1,521 in banking and insurance), while in nonfinance, the service sector is prevalent (6,577 employees out of 8,080).

On average, the imputed wages of employees in asset management and investment banking and in high tech exceed those in manufacturing and services, and the same holds for median imputed wages in these sectors. In contrast, the average wages in commercial banking and insurance are roughly in line with those in manufacturing. Hence, the data point to the existence of a wage premium in asset management and investment banking, rather than to a finance wage premium. The same qualitative conclusion applies when one focuses on total compensation, which includes bonus pay, on top of wages. Naturally, the distribution of total compensation is much more variable and strongly right-skewed across workers in each sector, as bonus pay is concentrated at the top of the pay scale and greatly exceeds wages. This is confirmed by the fact that in all sectors, the difference between median total compensation and median wage is much smaller than the difference between the corresponding means.
In the whole sample, the fraction of person-year observations referring to employees in top executive positions is slightly above one fourth (27%), but it is larger in asset management and investment banking (30%) and high tech (29%), which contributes to explain why in these sectors wages and total compensation are larger: careers are on average faster than in other sectors. Nevertheless, these figures underscore that the sample does not consist only of top executives, as in other recent studies such as Benmelech and Frydman (Reference Benmelech and Frydman2015), Graham, Harvey, and Puri (Reference Graham, Harvey and Puri2013), Kaplan, Klebanov, and Sorensen (Reference Kaplan, Klebanov and Sorensen2012), and Malmendier, Tate, and Yan (Reference Malmendier, Tate and Yan2011).
Almost all the employees in the sample have a university degree: the highest degree is a B.A. or B.S. for 42% of the sample, a Master’s for 40%, and a J.D. or a Ph.D. for 15%. Surprisingly, education in STEM subjects is not prevalent: only 22% of the individuals in the sample received their highest degree in economics or finance and only 14% in science or engineering. A sizable minority (15%) obtained their highest degree from a top-15 university according to the QS Ranking.
Consistent with anecdotal evidence, gender imbalance is highest in finance, and especially in asset management and investment banking, where only 15% of employees are female, against 28%, 24%, and 22% in manufacturing, services, and high tech, respectively.
On the whole, these descriptive statistics already indicate that careers in asset management and investment banking have quite distinctive characteristics, most of which are in common with employees in the high-tech sector: higher imputed wages and total compensation, and a higher frequency of attainment of top executive positions.
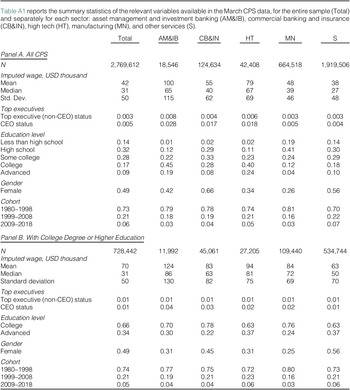
To assess how representative our data are compared to a comprehensive sample of U.S. workers, Table A1 in the Appendix reports summary statistics for individuals in the March CPS. Panel A, which includes all individuals in that sample, reveals some differences relative to Table 1: the March CPS data contain a larger share of women (49% vs. 22%), a higher proportion of less educated individuals and older cohorts, lower average wages, and a smaller fraction of individuals holding top executive positions. However, in Panel B, which focuses on individuals with at least a college degree, the average wage is much closer to that reported in Table 1. This finding indicates that our data oversample highly educated individuals compared to the broader U.S. population.
The comparison between our data and Panel B of Table A1 suggests that a more thorough assessment of our sample’s representativeness can be made by testing whether controlling for observable characteristics—such as experience, cohort, gender, and education—removes significant differences with respect to the March CPS data. We estimate the average gap between the March CPS wages and the imputed wages in our sample for each sector using a one-to-one nearest-neighbor propensity score matching estimator that conditions on education level (less than college, college, and more than college), gender, 5-year experience bins, and cohort. Once these characteristics are accounted for, no significant differences remain between the average wages in the two samples. This finding, reported in Table A2 in the Appendix, suggests that our sample is not selected on unobservable characteristics associated with different career trajectories. Note that this result is not mechanically implied by our imputation procedure. Although wage data in our sample are imputed based on the March CPS, significant differences in average wages between the two samples may still arise due to differences in their respective occupational structures, since occupations are not included in the propensity score matching described earlier. Therefore, we conclude that our data are representative of highly educated, especially male, U.S. professionals.
III. Are Careers in Finance Different?
As career choices appear to be quite persistent, it is worth asking whether career paths differ and, if so, how. In this section, we characterize career paths not only in terms of the level but also of the slope and risk of the corresponding compensation. We shall see that such differences are not entirely accounted for by heterogeneity in employees’ characteristics in terms of education and gender.
A. Persistence of Occupational Choices
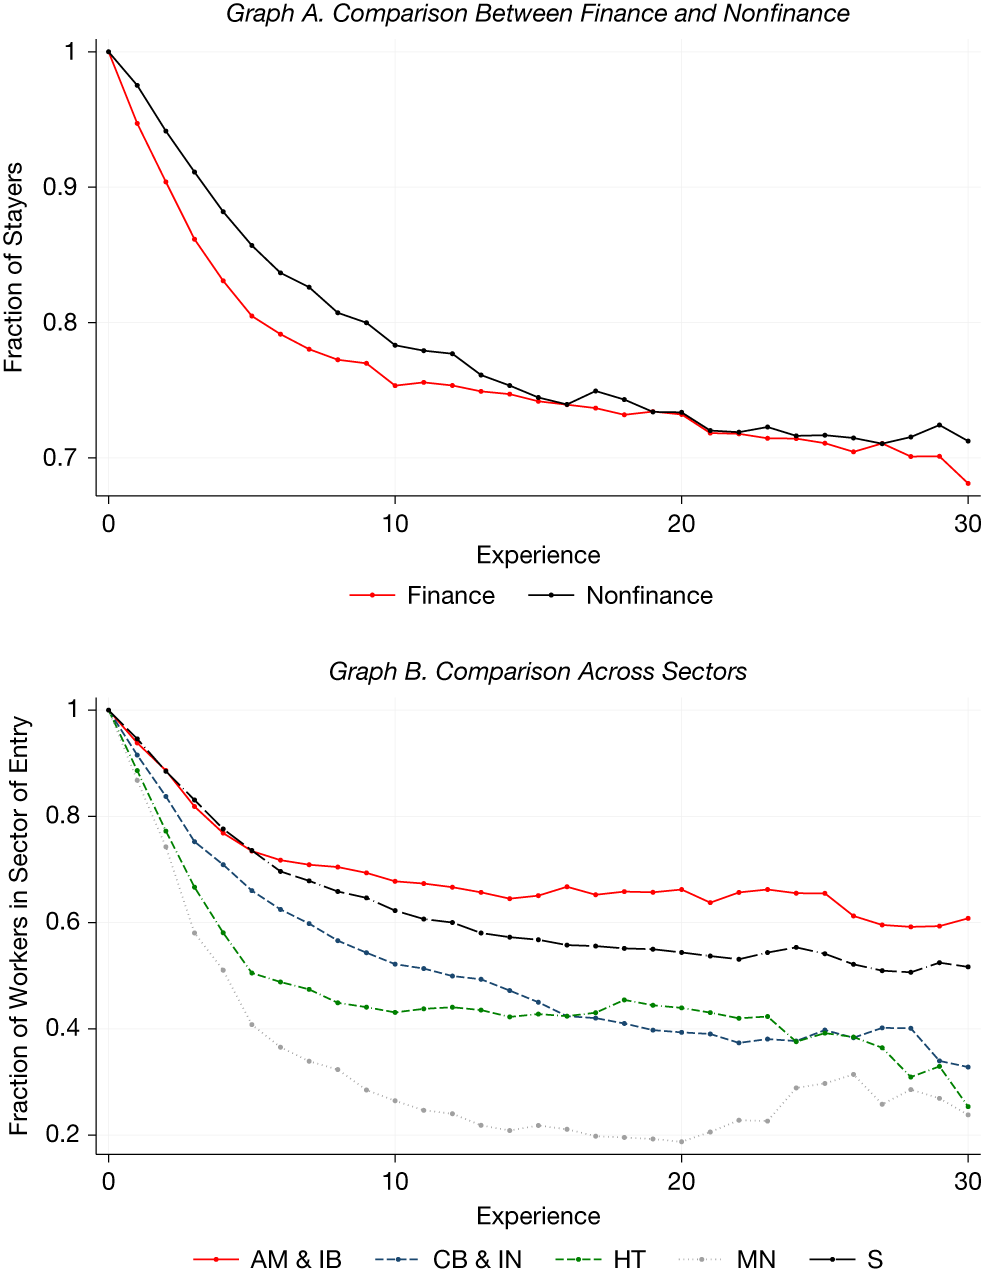
The first question our data can address is to what extent individuals choose careers rather than jobs when they enter the labor market, namely, whether the sector choice made at labor market entry persists over time. Do individuals spend most of their working life in a single sector, so that for most people a career is a lifetime choice? The answer is broadly positive: in our data, individuals’ professional choices feature high persistence. Graph A of Figure 2 shows the fraction of individuals who remain in finance or nonfinance at different moments of their career, conditional on their respective initial choice. In both cases, the fraction stays above 75% even after 20 years of experience. Graph B shows the fraction of individuals who remain in each sector at different experience levels. Careers in asset management and investment banking feature the highest persistence, probably reflecting the specificity of human capital required for the tasks performed by employees in this sector.
Graph A of Figure 2 shows, for each experience level, the share of workers who remain in the financial or nonfinancial industry after starting their careers in that industry. Graph B shows, for each experience level, the share of workers who remain in each sector after beginning their careers there. The sectors are asset management and investment banking (AM&IB), commercial banking and insurance (CB& IN), manufacturing (MN), high tech (HT), and services (S).
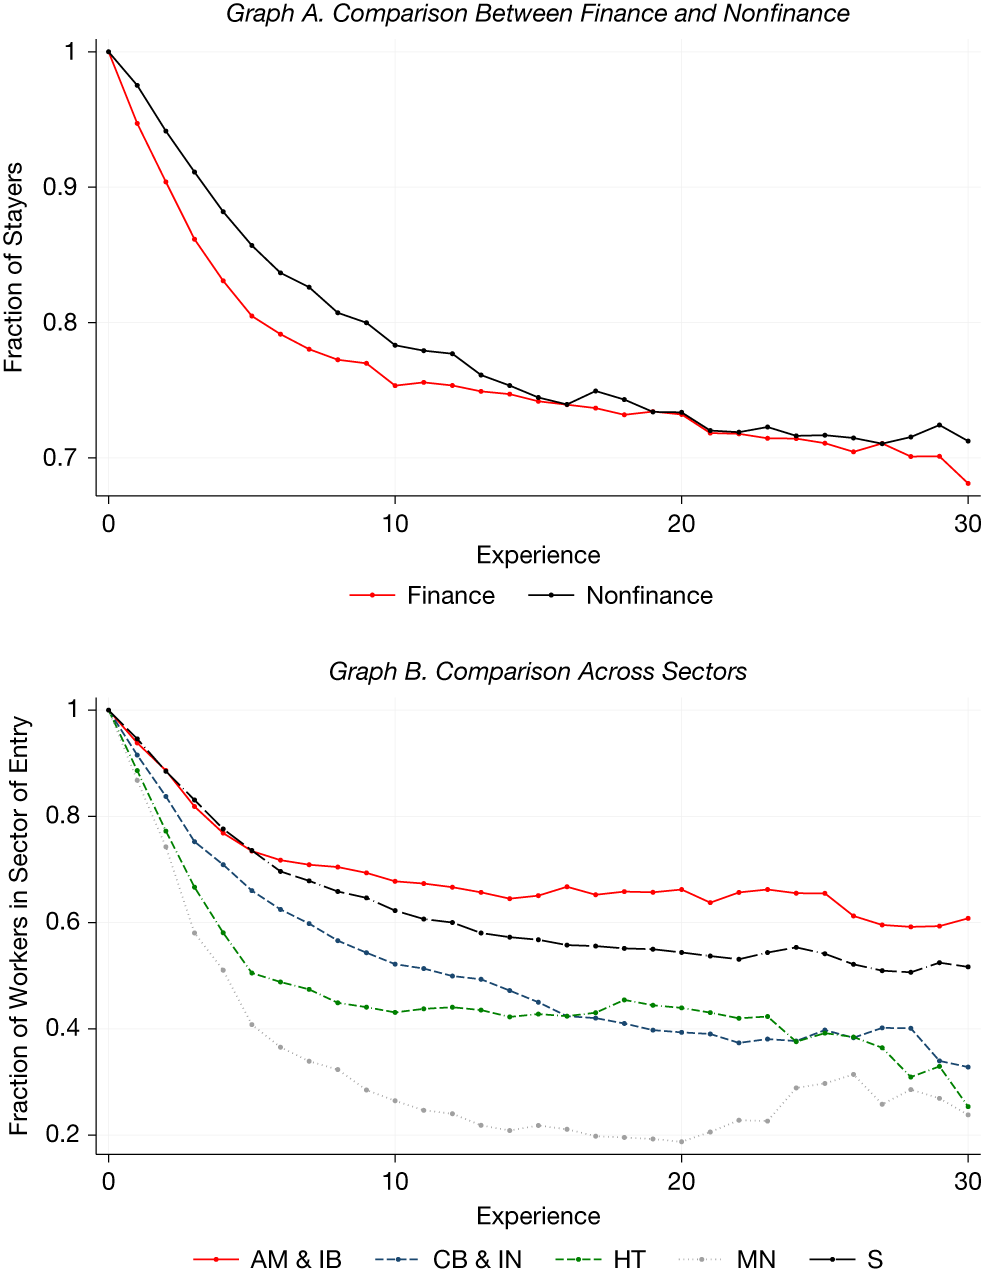
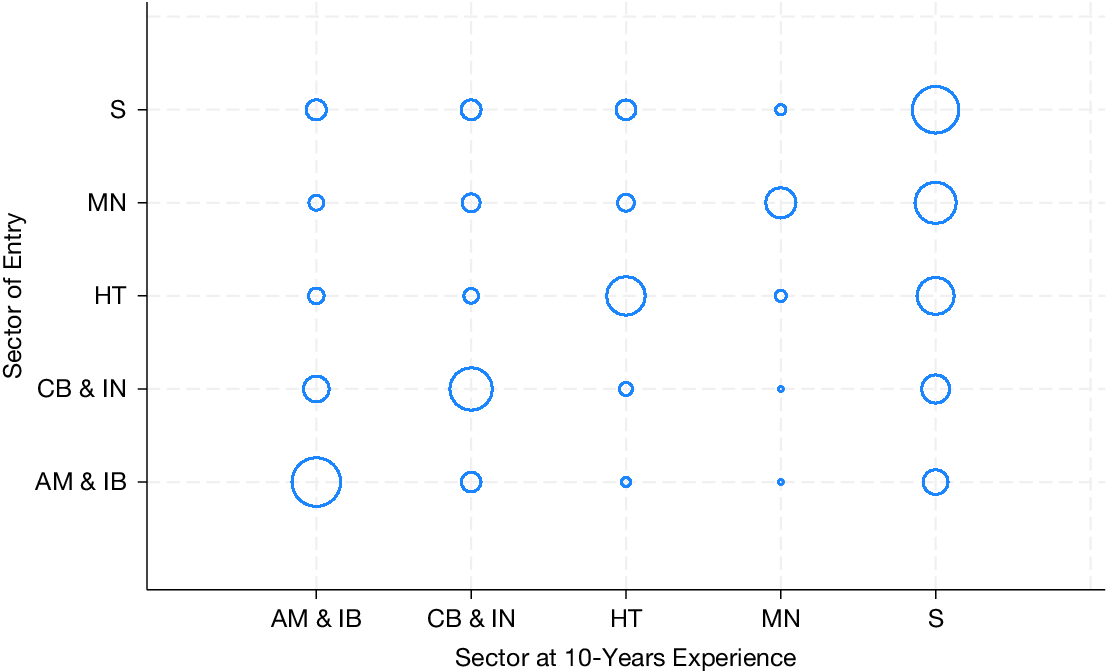
Figure 3 illustrates the frequency of transitions across sectors in the form of a 10-year transition matrix across sectors. The size of each circle in the figure measures the fraction of the entrants in sector $ i $
on the vertical axis who are employed in sector
$ i $
on the vertical axis who are employed in sector $ j $
on the horizontal axis. The fact that the largest circle in each column lies along the diagonal indicates that after 10 years of experience the largest group in each sector is formed by employees who joined that sector at the time of labor market entry. Interestingly, the largest off-diagonal circle in the finance sector is that formed by employees moving from banking and insurance into asset management and investment banking, implying that it is not uncommon for banking and insurance careers to include stints in asset management and investment banking. The reason why the circles in the last column are the largest reflects the sheer magnitude and heterogeneity of the service sector, which mechanically implies that other sectors’ entrants may eventually end up in the services sector.
$ j $
on the horizontal axis. The fact that the largest circle in each column lies along the diagonal indicates that after 10 years of experience the largest group in each sector is formed by employees who joined that sector at the time of labor market entry. Interestingly, the largest off-diagonal circle in the finance sector is that formed by employees moving from banking and insurance into asset management and investment banking, implying that it is not uncommon for banking and insurance careers to include stints in asset management and investment banking. The reason why the circles in the last column are the largest reflects the sheer magnitude and heterogeneity of the service sector, which mechanically implies that other sectors’ entrants may eventually end up in the services sector.
Figure 3 illustrates the 10-year transition matrix across sectors. The size of each circle measures the fraction of the entrants in sector $ i $
on the vertical axis who are employed in the sector
$ i $
on the vertical axis who are employed in the sector $ j $
on the horizontal axis after 10 years in the labor market. The sectors are asset management and investment banking (AM&IB), commercial banking and insurance (CB& IN), manufacturing (MN), high tech (HT), and services (S).
$ j $
on the horizontal axis after 10 years in the labor market. The sectors are asset management and investment banking (AM&IB), commercial banking and insurance (CB& IN), manufacturing (MN), high tech (HT), and services (S).

The strong persistence of occupational choices observed in our data aligns with extensive evidence on occupational path dependence and industry-specific human capital. Early contributions by Neal (Reference Neal1999) and Sullivan (Reference Sullivan2010) show that human capital is largely sector-specific, implying that switching industries entails significant skill losses and adjustment costs. Subsequent research has emphasized that educational specialization and early-career sorting generate lasting effects on occupational trajectories (Kirkeboen et al. (Reference Kirkeboen, Leuven and Mogstad2016), Wiswall and Zafar (Reference Wiswall and Zafar2021)). Moreover, macroeconomic conditions at the time of entry into the labor market shape lifetime outcomes by influencing both initial job matching and long-term earnings growth (Oyer (Reference Oyer2008), Oreopoulos et al. (Reference Oreopoulos, von Wachter and Heisz2012), and Schoar and Zuo (Reference Schoar and Zuo2017)).
Our finding that more than three-quarters of individuals remain in their initial industry even after 2 decades corroborates the notion that occupational choices are highly persistent and self-reinforcing, likely reflecting the accumulation of industry-specific human capital and social networks. Importantly for our subsequent analysis, this finding supports the idea that talent allocation responds primarily to expected lifetime career values rather than to transitory wage differentials, consistent with dynamic models of occupational choice and human capital investment under uncertainty (Keane and Wolpin (Reference Keane and Wolpin1997), Hendricks (Reference Hendricks2014)).
B. Finance Versus Nonfinance Careers
To illustrate how career profiles differ across sectors over the whole sample, we purge compensation data from their aggregate yearly variation by regressing them on year effects and adding the estimated residuals to the 2010 average wages. This eliminates potential spurious variation in relative wages across sectors arising from differences in sample composition over time.
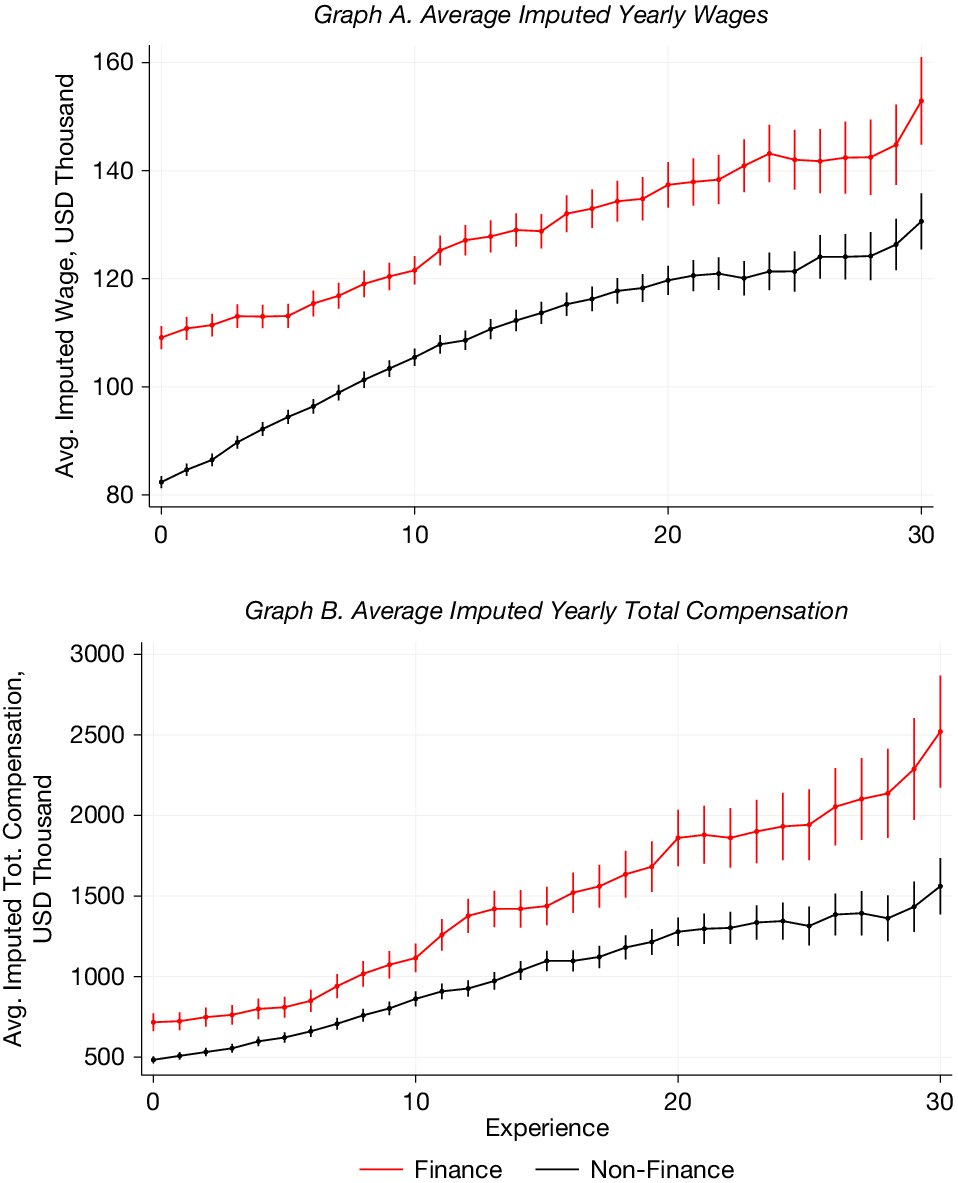
Figure 4 compares the typical career profile of finance and nonfinance workers in our sample. The top graph plots the average real imputed wage (excluding bonus pay) in thousand dollars: the average wage of finance workers exceeds that of nonfinance workers by 37% at the time of entry, and the differential remains sizeable throughout the career. These estimates of the finance wage premium are considerably smaller than the 50% estimate reported by Philippon and Reshef (Reference Philippon and Reshef2012): the difference probably reflects the fact that our sample is more homogeneous than the U.S. population, being skewed toward educated professionals. Indeed, the wage difference between financiers and engineers reported by Philippon and Reshef (Reference Philippon and Reshef2012) ranges between 0% and 40% over the 1980–2005 period, and therefore, it is closer to our estimate.
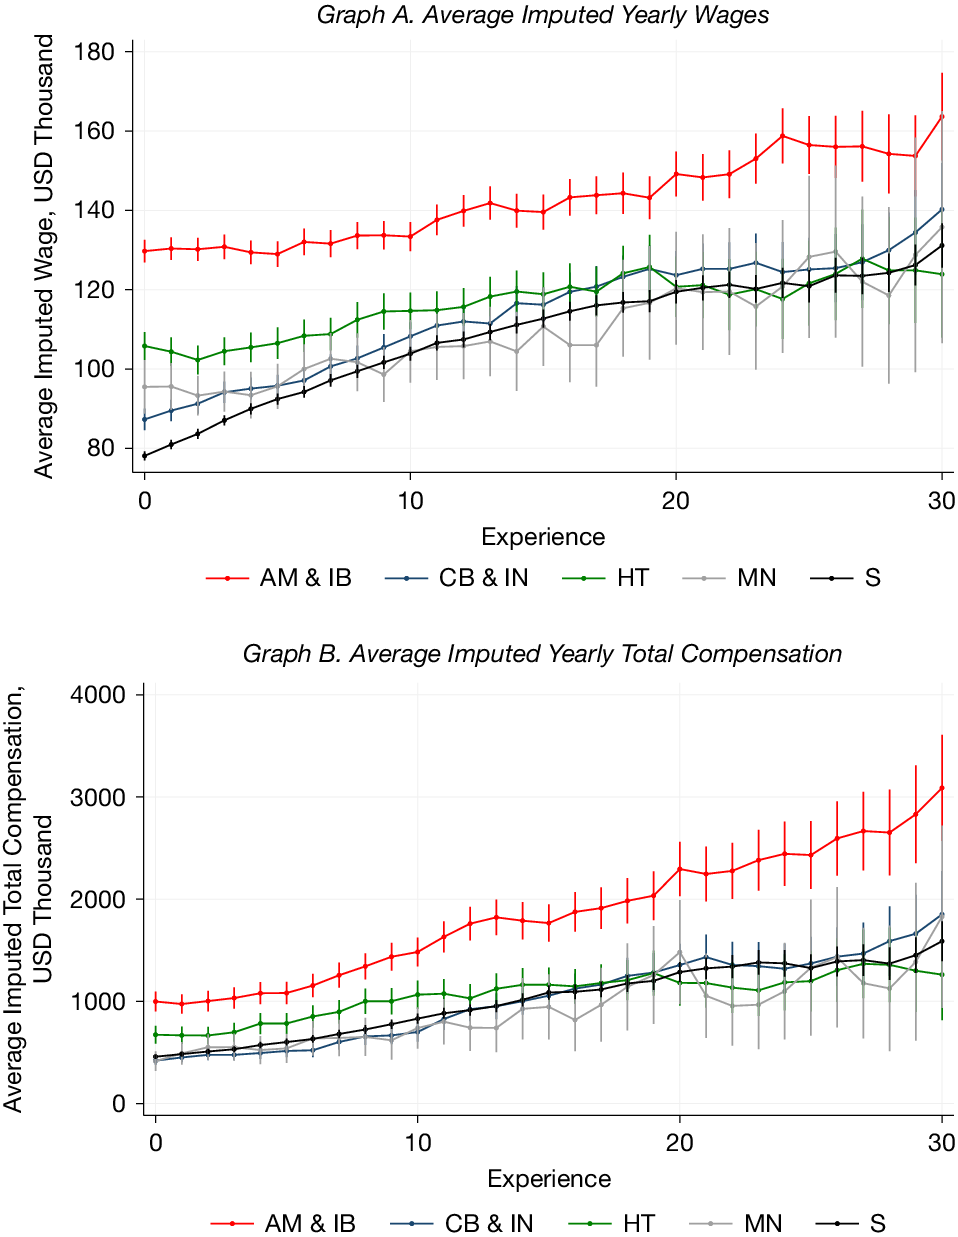
Graph A of Figure 4 reports the average imputed yearly wage of finance and nonfinance professionals, by experience level, and the corresponding 95% confidence intervals. Graph B reports the average imputed yearly total compensation of finance and nonfinance employees, including wages and bonuses by experience level, and the corresponding 95% confidence intervals. We purge compensation data from their aggregate yearly variation by regressing them on year effects and adding the estimated residuals to the 2010 average wages.

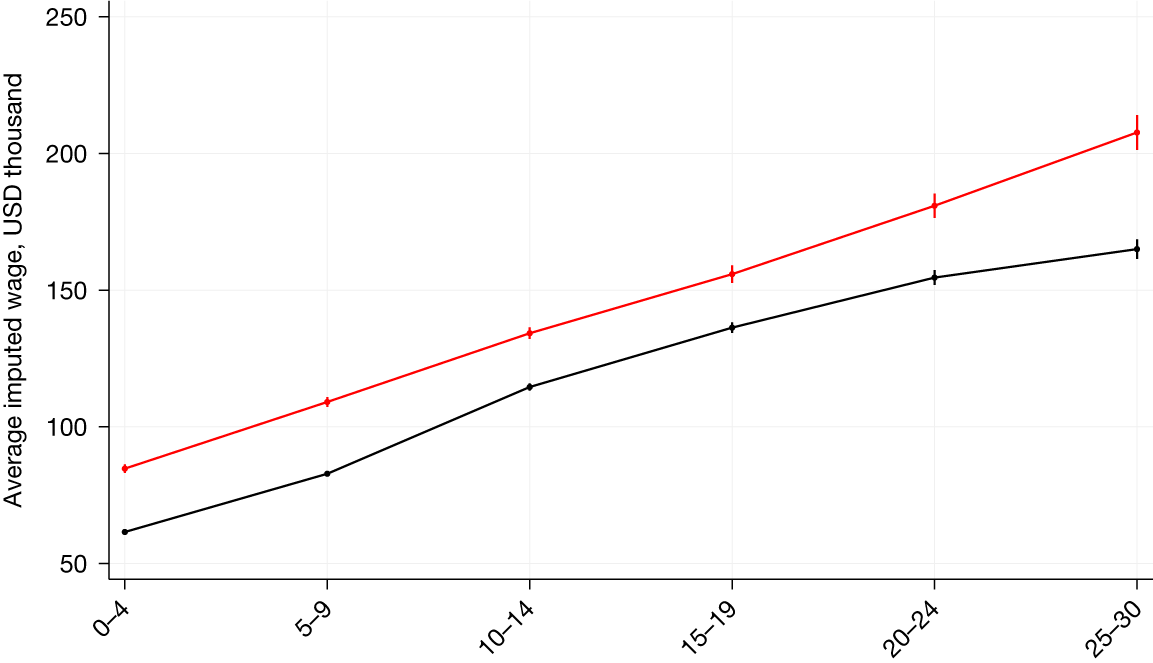
As explained in Section II, the compensation data used in our imputation are average wages within cells defined by occupation, sector, and year. Accordingly, the observed upward-sloping relationship between imputed wages and experience documented by Figure 4 indicates that more experienced individuals tend to be employed in occupations that, on average, pay higher wages. A limitation of this approach is that it disregards within-occupation differences in pay associated with experience. As a robustness check, we repeat the imputation using finer cells defined by 5-year experience bins, gender, and education, in addition to occupation, sector, and year. The resulting profiles, which are shown in Figure A1 in the Appendix, feature a larger pay gap between finance and nonfinance careers than that shown in Figure 4: the entry-level gap is about 49%, hence, very close in magnitude to that reported by Philippon and Reshef (Reference Philippon and Reshef2012). Furthermore, the two profiles are parallel, except for the final part of the career (25–30 years of experience) where yearly finance wages grow 18% faster than nonfinance ones.
Graph B of Figure 4 instead plots the average total imputed compensation of finance and nonfinance employees: this includes also bonus pay, which is so large as to raise total compensation by a factor of 4–10 relative to the wage compensation shown in the top graph. For total imputed compensation, the differential with nonfinance workers is not only larger than for the wage, but increases over the career: the average differential is 40% at entry, as well as over the first 10 years, and then grows steadily, ending at 67% after 30 years. This evidence partly reflects the fact that careers in finance are faster, as witnessed by finance workers being significantly more likely to attain top executive positions. For this part of the analysis, we cannot perform the robustness check described previously for the wage profiles because our data on executive compensation do not include information about the managers’ experience, gender, and education.
C. Diversity Within Finance
The overall picture emerging from Figure 4 masks great diversity within finance, as well as some diversity between high tech and other nonfinance sectors, as shown by Figure 5. Graph A of the figure shows average imputed real wages paid over workers’ careers in various sectors within finance and nonfinance: in asset management and investment banking, entry-level wages significantly exceed both those in banking and insurance and those in nonfinance sectors. High-tech careers offer the second-highest wages over the first 15 years of experience, significantly larger than careers in manufacturing and services, as well as in commercial banking and insurance. A qualitatively similar picture emerges from data for total imputed compensation, shown in Graph B of Figure 5. The only significant difference relative to Graph A is that the inclusion of bonus pay significantly magnifies the extent to which the premium in asset management and investment banking rises with experience.
Figure 5 shows the average imputed yearly wage (Graph A) and the average imputed yearly total compensation (Graph B) of professionals in each sector by experience level and the corresponding 95% confidence intervals. The sectors are asset management and investment banking (AM&IB), commercial banking and insurance (CB& IN), manufacturing (MN), high tech (HT), and services (S). We purge compensation data from their aggregate yearly variation by regressing them on year effects and adding the estimated residuals to the 2010 average wages.

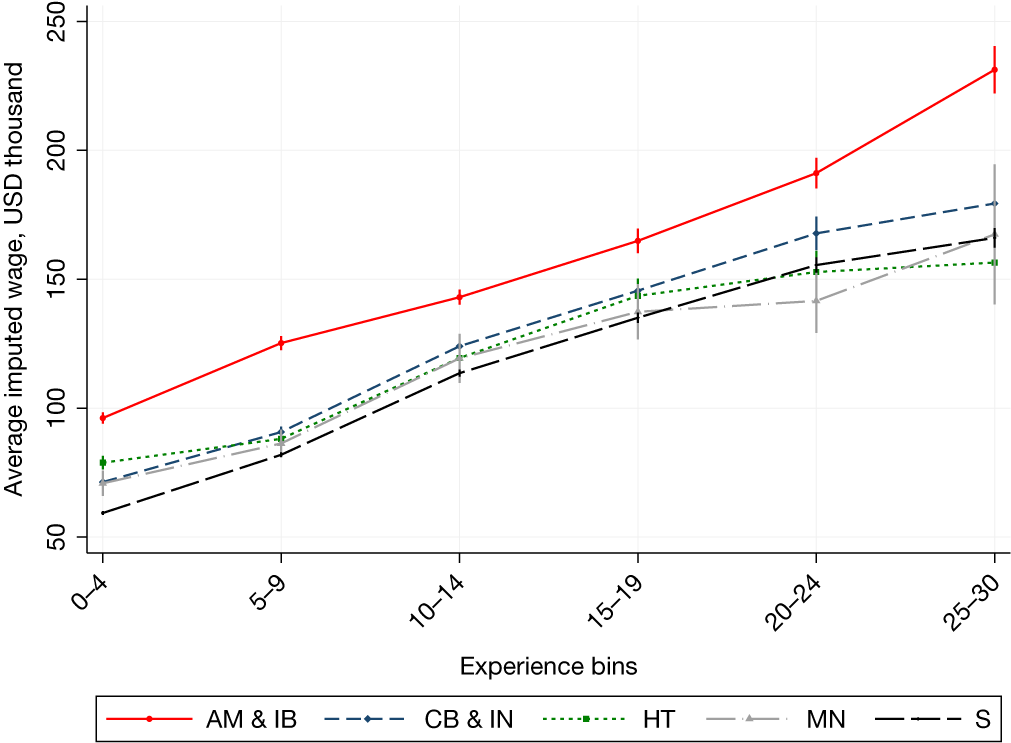
As in the previous subsection, we replicate Figure 5 using an alternative imputation method that takes into account experience, gender, and education, in addition to occupation, sector, and year. The resulting profiles, reported in Figure A2, confirm that careers in asset management and investment banking feature the highest wages over the entire experience profile. Moreover, these careers also appear to display faster wage growth than those in other sectors, especially in their final years.
Careers in finance appear to benefit from education: graduate training increases annual pay by $8,200 in commercial banking and insurance, while a degree from a top-15 university is associated with a $12,230 annual pay increase in asset management and investment banking, $14,630 in banking and insurance, $9,680 in manufacturing, and $13,150 in services (while there is no significant effect in high tech). On the whole, female workers earn significantly less than males, in line with findings on the gender gap reported by many studies (Bertrand and Hallock (Reference Bertrand and Hallock2001), Mulligan and Rubinstein (Reference Mulligan and Rubinstein2008), and Bertrand, Goldin, and Katz (Reference Bertrand, Goldin and Katz2010), and, within finance, Adams and Kirchmaier (Reference Adams and Kirchmaier2016)). The gender gap does not differ significantly across sectors but is significantly different from zero only in manufacturing (where it is largest), high tech, and services. Instead, it is barely significant in finance. However, this result may be partly due to selection: finance features the lowest female participation (see Table 1), so that average female finance employees may be of higher unobserved ability relative to women working in other sectors.
D. Career Premia
While the graphic comparison of average wage and total compensation profiles presented so far enables us to effect a broad comparison of career paths across industries and sectors, it fails to provide a synthetic measure of the different dimensions of career paths that may naturally affect the valuation by a (risk-averse) worker. Indeed, careers may differ in their intercept (i.e., entry-level pay level), slope (i.e., return to on-the-job experience), and risk (i.e., predictability of the pay level within the relevant sector). For instance, career paths may cross: for instance, in Figure 5, the average total compensation in high tech exceeds that of services in the first part of the career, but not in the last. Moreover, the average pay profile in one sector may lie entirely above its analogue in another one, having both a higher intercept and slope, yet it may feature greater risk; hence, a sufficiently risk-averse worker may prefer the latter to the former.
To overcome these problems, we devise synthetic measures of career characteristics. The most basic one, which does not include risk, is the present discounted value (PDV) of the average wage (or total compensation) that workers earn in our sample over the same interval of on-the-job experience, that is, the risk-neutral valuation of their human capital when invested in a given sector. Such valuation can also be conditioned on the worker’s characteristics in terms of education, gender, and cohort and therefore enables us to control for workers’ heterogeneity. Importantly, this metric enables us to compute the “career premium” (or “discount”) of one sector (say, asset management) against a common benchmark (say, services), defined as the percentage difference between the PDVs of the respective average wages (or total compensation).
However, the presence of such a “career premium” (or “discount”) as just defined may reflect the different risk characteristics of careers in different sectors. For instance, if asset managers face higher labor income risk for each level of experience than employees in banking, irrespective of their education and gender, then individuals may require a higher expected labor income PDV to enter asset management. The risk associated with entering a given sector not only stems from the sector-specific variability of pay over time but also arises from cross-sectional variation across worker-specific trends in that sector. Both dimensions of risk can be taken into account by viewing entry in a given sector as a draw from a distribution of possible career paths in that sector.
Accordingly, we estimate the expected utility associated with entry in a given sector as the average utility obtained by the subsample of workers in that sector, using the wage (or total compensation) data over the observed careers. Specifically, we estimate the expected discounted utility that worker $ i\in \left(1,\dots, {N}_j\right) $
obtains from a career in sector
$ i\in \left(1,\dots, {N}_j\right) $
obtains from a career in sector $ j $
as the sample mean of the discounted utility of the career paths observed in that sector, assuming constant relative risk aversion instantaneous utility:
$ j $
as the sample mean of the discounted utility of the career paths observed in that sector, assuming constant relative risk aversion instantaneous utility:
 $$ E\left({U}_j\right)=\sum \limits_{i=1}^{N_j}\frac{1}{N_j}\sum \limits_{t=0}^T\;{\beta}^t\frac{w_{ijt}^{1-\gamma }}{1-\gamma }, $$
where $ {w}_{ijt} $
is the observed wage of worker
$ {w}_{ijt} $
is the observed wage of worker $ i $
in sector
$ i $
in sector $ j $
and experience
$ j $
and experience $ t $
,
$ t $
, $ \beta $
is the discount factor, and
$ \beta $
is the discount factor, and $ {N}_j $
is the number of employees in sector
$ {N}_j $
is the number of employees in sector $ j $
. We assume
$ j $
. We assume $ \beta =0.97 $
and evaluate expression (2) for the six sectors in our data, using the first 20 years of imputed compensation data for each employee, that is, setting
$ \beta =0.97 $
and evaluate expression (2) for the six sectors in our data, using the first 20 years of imputed compensation data for each employee, that is, setting $ T=20 $
. Then, we compute the constant certainty-equivalent yearly compensation (
$ T=20 $
. Then, we compute the constant certainty-equivalent yearly compensation ( $ \overline{w} $
) under four alternative assumptions about the coefficient of relative risk aversion (RRA)
$ \overline{w} $
) under four alternative assumptions about the coefficient of relative risk aversion (RRA) $ \gamma $
, that is, 0 (risk neutrality), 0.5, 1 (logarithmic utility), and 2, which is shown by Chetty (Reference Chetty2006) to be the upper bound on
$ \gamma $
, that is, 0 (risk neutrality), 0.5, 1 (logarithmic utility), and 2, which is shown by Chetty (Reference Chetty2006) to be the upper bound on $ \gamma $
consistent with existing estimates of labor supply elasticity:
$ \gamma $
consistent with existing estimates of labor supply elasticity:
 $$ E\left({U}_j\right)=\sum \limits_{t=0}^T{\beta}^t\frac{{\overline{w}}_j^{1-\gamma }}{1-\gamma }. $$
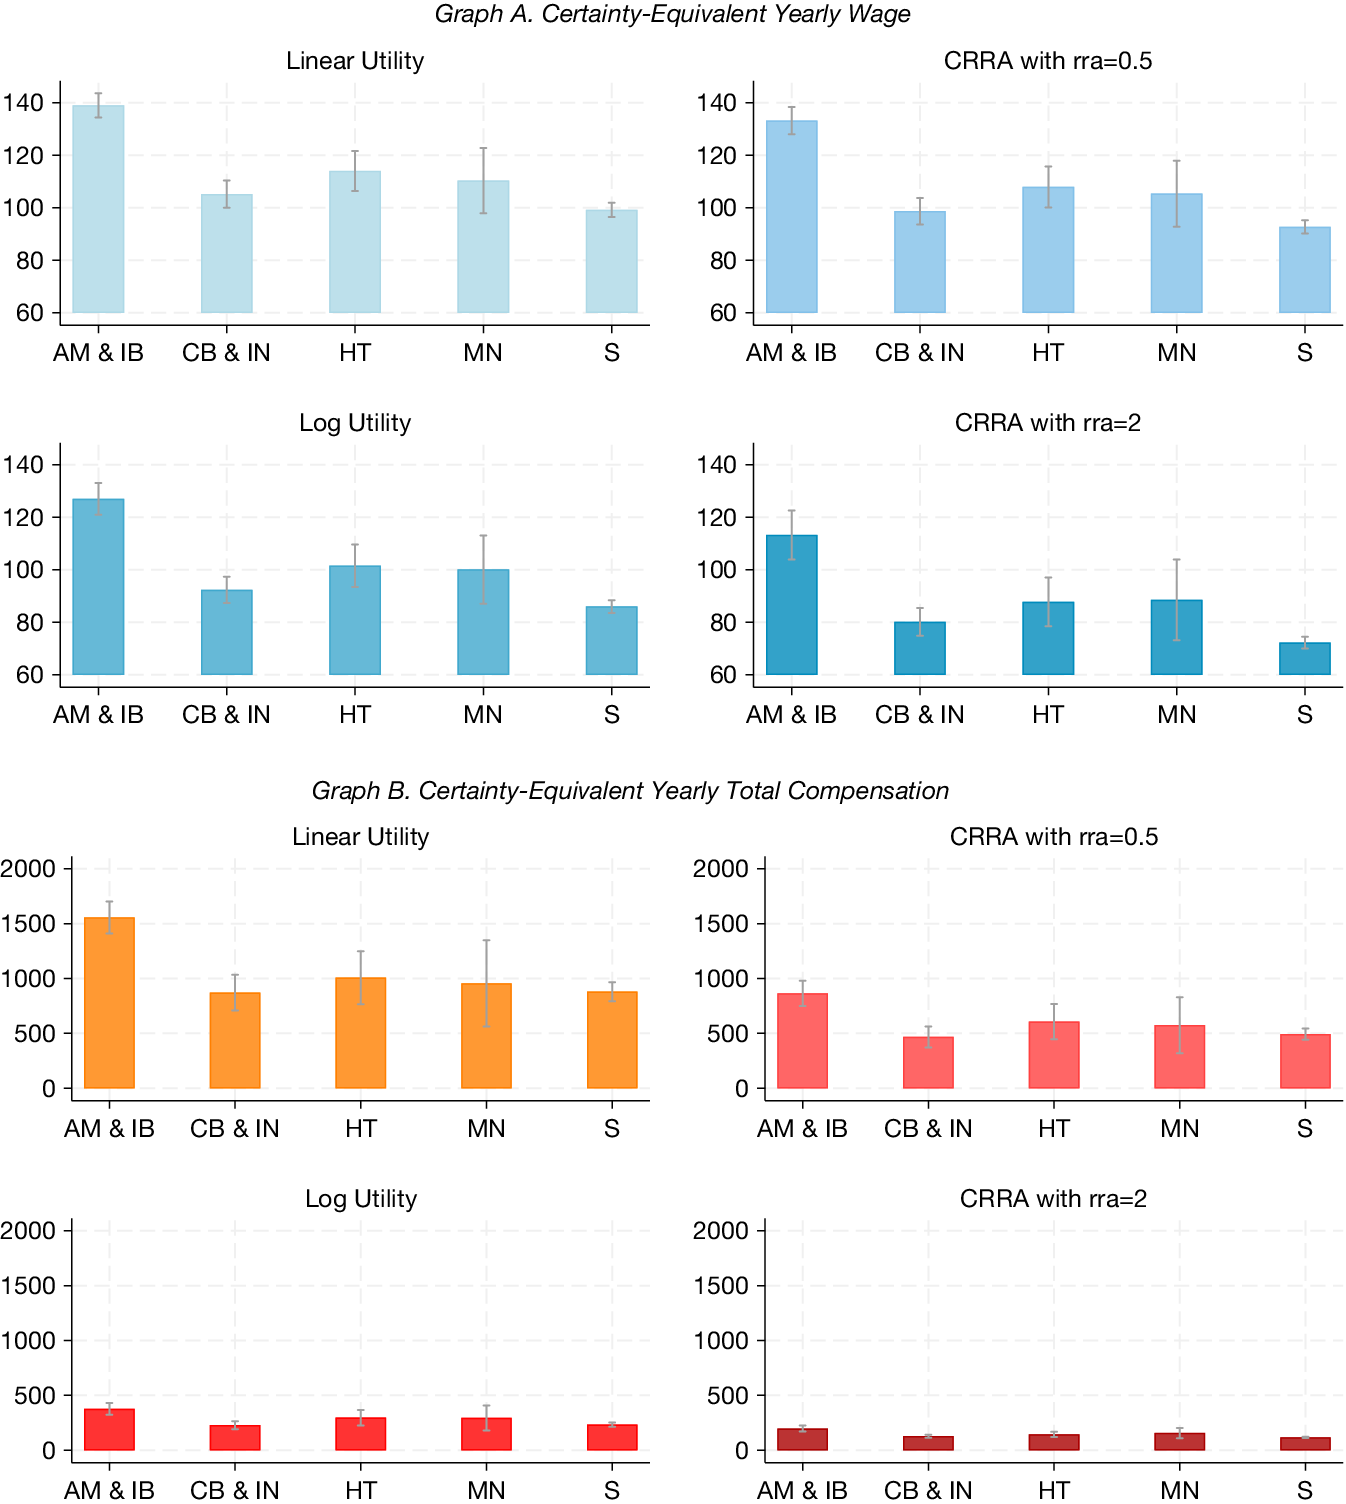
Figure 6 plots the certainty equivalent (CE) of the imputed annual wages (in Graph A) and of total compensation (in Graph B) for each sector. It also shows the respective confidence bounds, computed using the Delta method to approximate the asymptotic variance of the nonlinear transformations of the estimated expected utilities. The figure shows that in asset management and investment banking, the CE annual wage is significantly larger than in services, irrespective of the assumed RRA coefficient. The magnitude of the CE is decreasing in the assumed risk aversion for all sectors. But the ranking between the CE annual wage in the five sectors stays unchanged irrespective of the assumed risk aversion: even for $ \gamma =2 $
, asset management yields a sizeable premium relative to all other sectors, and high tech yields the second highest premium relative to the service sector: the CE annual wage is $113,000 in asset management and investment banking and $87,800 in high tech, and the respective career premia relative to the $72,250 CE in services are both statistically significant.
$ \gamma =2 $
, asset management yields a sizeable premium relative to all other sectors, and high tech yields the second highest premium relative to the service sector: the CE annual wage is $113,000 in asset management and investment banking and $87,800 in high tech, and the respective career premia relative to the $72,250 CE in services are both statistically significant.
In Figure 6, certainty equivalent of the imputed yearly wage (Graph A) and of the imputed yearly total compensation (Graph B) in each sector over a 20-year experience horizon, assuming a constant relative risk aversion (CRRA) utility function, for CRRA coefficient alternatively equal to 0 (linear utility), 0.5 (square root utility), 1 (log utility), or 2. The certainty equivalent is computed using equation (2). The sectors are asset management and investment banking (AM & IB), commercial banking and insurance (CB & IN), high tech (HT), manufacturing (MN), and services (S).

The results shown in Graph B, which refer to the CE of imputed total compensation in each sector, are qualitatively similar to those obtained in the previous figure using wage data. Of course, the CE of imputed total compensation exceeds that of imputed salaries and is more sensitive to the assumed level of relative risk aversion: as $ \gamma $
increases, the CE of imputed total compensation gets closer to the CE of imputed salaries. The CE of total compensation in asset management and investment banking also exceeds that of other sectors: for
$ \gamma $
increases, the CE of imputed total compensation gets closer to the CE of imputed salaries. The CE of total compensation in asset management and investment banking also exceeds that of other sectors: for $ \gamma =2 $
, the CE of total compensation is $197,000 in asset management, with a statistically significant premium over its analogue of $117,200 in services. Instead, the CE of total compensation does not differ significantly across banking and insurance, high tech, manufacturing, and services.
$ \gamma =2 $
, the CE of total compensation is $197,000 in asset management, with a statistically significant premium over its analogue of $117,200 in services. Instead, the CE of total compensation does not differ significantly across banking and insurance, high tech, manufacturing, and services.
Hence, the differential career premium in asset management and investment banking cannot be entirely accounted for by the greater risk of careers in this sector. This accords with other evidence that, in asset management and investment banking, liquidations and bankruptcies appear to have much more limited scarring effects than in other sectors. Ellul et al. (Reference Ellul, Pagano and Scognamiglio2019) find that hedge fund liquidations do not affect the careers of the majority of their employees, except for those of the top managers of previously underperforming funds, and Fedyk and Hodson (Reference Fedyk and Hodson2021) show that the Lehman Brothers bankruptcy had no significant effect on employees’ career trajectories, except for senior management, in sharp contrast with the severe and widespread scarring effects of bankruptcies on careers in other sectors documented for instance by Eliason and Storrie (Reference Eliason and Storrie2006), Graham, Kim, Li, and Qiu (Reference Graham, Kim, Li and Qiu2023), and Huttunen, Møen, and Salvanes (Reference Huttunen, Møen and Salvanes2011).
IV. Evolution of Careers in Finance and Nonfinance
The methodology presented so far can be used not only to measure the relative attractiveness of careers in different sectors of the economy but also to assess whether and how this has changed over time and whether its changes are systematically correlated with the allocation of labor market inflows across sectors. In particular, it enables us to inquire whether the asset management and investment banking career premium documented so far has been a stable feature of the economy, and whether the observed choices of labor market entrants are consistent with them considering careers in asset management and investment banking and those in other sectors as substitutes, namely, competing for a common pool of talents.
In this section, we apply the methodology presented in the previous section to bear on these issues, by estimating the CE of the annual pay for the first 10 years of experience received by successive cohorts entering each sector between 1990 and 2006. We discard the earliest cohorts, because those from the 1980s are not numerous enough to yield reliable estimates of their CE of annual pay. For the same reason, we omit careers in manufacturing, for which too few profiles are available to perform this cohort-based estimation. Finally, the last cohort for which we can perform the estimation is that entering in 2006, since for subsequent cohorts less than 10 years of pay data are available. Note that the CE of annual pay may vary across cohorts not only due to changes in the level and slope of their typical career paths but also due to changes in career risk. We assume logarithmic utility, but the results are qualitatively unaffected assuming different values of relative risk aversion.
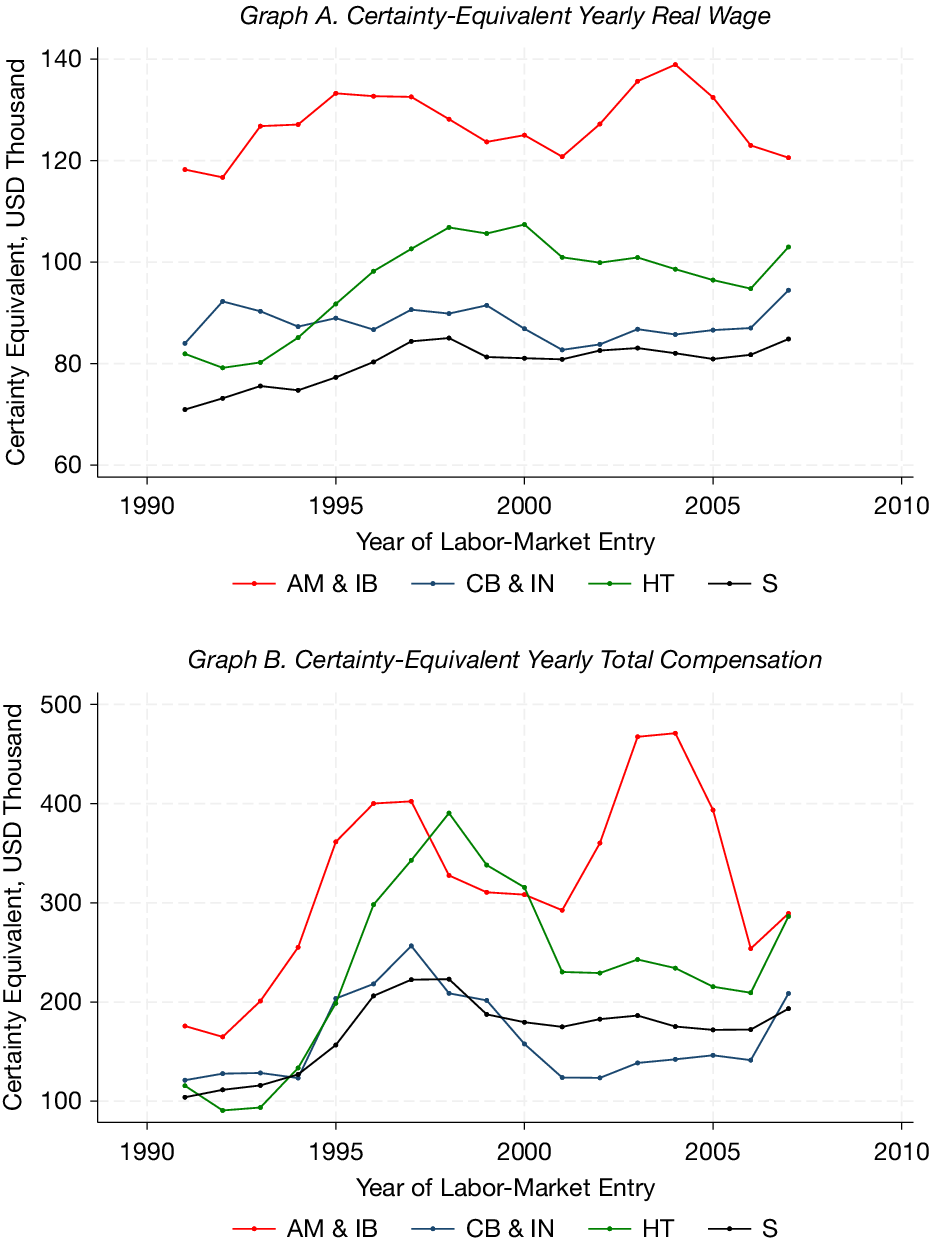
Graph A of Figure 7 shows 3-year moving averages of the CE annual wages in each sector, for each cohort entering the labor market between 1990 and 2006. Graph B of the figure repeats the exercise using data for the first 10 years of total compensation (including bonus pay) instead of wages. Graph A of the figure reveals that although careers in asset management and investment banking dominated careers in other sectors for all cohorts, their relative attractiveness, that is, the asset management and investment banking career premium, has gradually decreased over time: its CE annual wage in 2006 is almost the same as in 1990, that is, about $120,000, while in all other sectors, it has grown over time. This is especially evident when they are compared to careers in high tech: the percentage career premium of asset management relative to high tech declined from about 50% in 1990 to about 20% in 2006. This evidence differs sharply from the steady rise in the finance wage premium documented by Philippon and Reshef (Reference Philippon and Reshef2012) since the 1990s, reflecting the fact that our metric has a forward-looking nature and refers to a whole cohort rather than to a cross section of employees at a point in time.
In Figure 7, 3-year moving average of certainty-equivalent (CE) annual imputed wage (Graph A) and annual total compensation (Graph B) in each sector, computed over a 10-year experience horizon, assuming logarithmic utility. The certainty equivalent is computed using equation (2). The sectors are asset management and investment banking (AM&IB), commercial banking and insurance (CB&IN), high tech (HT), and services (S).

Besides the different time trends, Figure 7 also reveals interesting cycles: careers in asset management and investment banking became more attractive in the early 1990s and 2000s, but in each case, a reversal followed, possibly reflecting the setbacks of the asset management and investment banking industry in the 2000–2001 and 2008–2009 financial crises. The contraction of the high-tech sector after the burst of the dotcom bubble in 2000–2001 is also likely to account for the decline in the attractiveness of the high-tech sector in the early 2000s. This is consistent with the evidence by Hombert and Matray (Reference Hombert and Matray2018), who show that the cohort of skilled workers entering the high-tech sector during the high-tech boom of the late 1990s experienced a persistent drop in wages after the burst of the bubble, using matched employer–employee data from France: this cohort of high-tech skilled workers starts with 5% higher wages but then faces lower wage growth and ends up with 6% lower wages 15 years out, relative to similar workers who started outside the high-tech sector. Our evidence indicates that in the United States, this effect materializes for high-tech employees entering the workforce soon before, concomitantly with, or soon after the 2001 dot-com crash. But our data also indicate that in 2006, the prospective attractiveness of the high tech sector rose again, while that of asset management and investment banking kept declining.
Graph B of Figure 7 broadly confirms these findings for the CE of total compensation, which includes bonus pay in addition to wages. The only substantive differences with the previous figure are that, when bonus pay is taken into account, the CE of annual compensation features a positive trend in all sectors, including asset management and investment banking, and much wider fluctuations over time, especially in the asset management and investment banking sector and in the high-tech sector, reflecting the much greater volatility of bonus pay relative to the base wage in these sectors. But perhaps, the most remarkable finding is that the differential between the CE of total compensation in asset management and investment banking and high tech drops to zero both for cohorts entering the labor market in the late 1990s and for those entering in 2006.
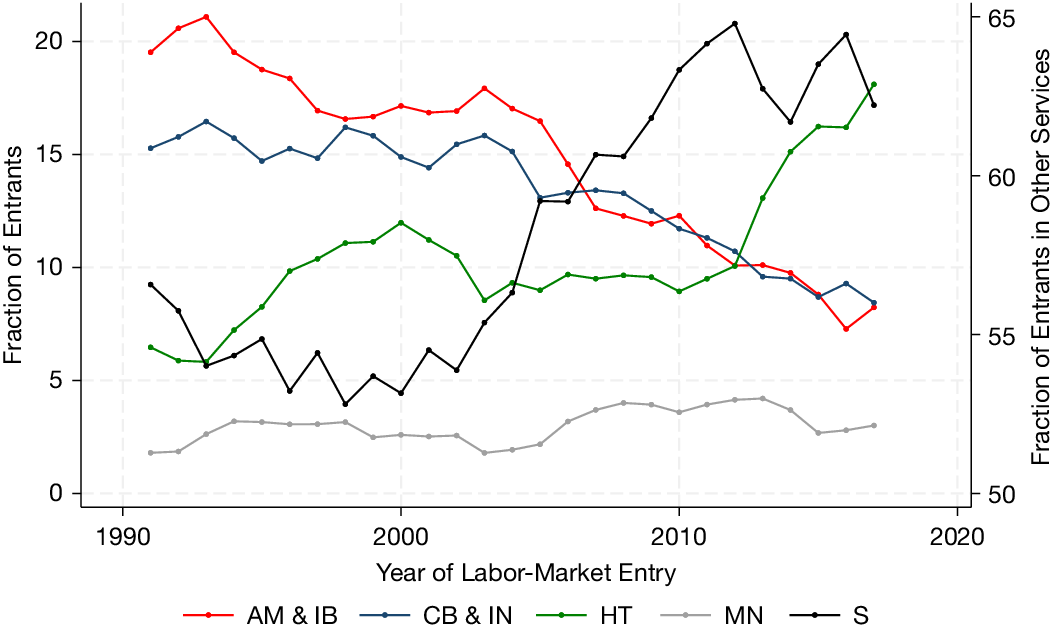
This evidence gains further interest when it is considered alongside the data on the flow of labor market entrants in each sector as a percentage of total entrants in the same year: Figure 8 plots the 3-year moving averages of these fractional flows from 1991 to 2017 based on our data. The figure shows that the choices of labor market entrants have changed remarkably over time: finance, and especially asset management and investment banking, features a trend decline of labor inflows, particularly since the 2008–2009 financial crisis; conversely, the high-tech sector attracted two waves of entry, one in 1993–2000 (during the dotcom bubble) and a second one after 2010, and services attracted a strong wave of entrants in 2000–2010. This is in line with the evidence by Shu (Reference Shu2018) that, during the financial crisis, elite science graduates opted for careers in science and engineering rather than in finance. Hence, the overall picture is one of a declining labor inflow into asset management and investment banking, and an expanding one into high tech and services, symmetrically with the shrinking career premium of asset management and investment banking observed in Figure 7.
In Figure 8, 3-year moving average of fractional flows of entrants by sectors: asset management and investment banking (AM&IB), commercial banking and insurance (CB&IN), high tech (HT), and services (S). For each year $ t $
and sector
$ t $
and sector $ j $
, the flow of entrants is computed as the ratio between the number of professionals that record their first year of labor market experience in year
$ j $
, the flow of entrants is computed as the ratio between the number of professionals that record their first year of labor market experience in year $ t $
and sector
$ t $
and sector $ j $
and the total number of professionals recording their first year of labor market experience in year
$ j $
and the total number of professionals recording their first year of labor market experience in year $ t $
.
$ t $
.

The previous figures suggest that the reallocation of labor across industries may have been driven by changes in the relative attractiveness of careers over time. To investigate this hypothesis, we estimate a multinomial logit model relating the entry choices of individuals in our sample to the risk-adjusted career premia of each sector, that is, the ratios of the cohort-specific CE of each sector to that of the service sector (used as benchmark), controlling for individual entrants’ characteristics: gender, quality of education (degree from a top-15 school), education level (dummy for Master of Ph.D.), and subject of the highest degree. The observations used in the estimation refer to individuals who entered the labor market between 1989 and 2007, but the career premia used to account for their choices are based on wage data up to 2017, being forward-looking.
Figure 9 shows the estimates of the marginal effects of career premia on the probability of entry in each sector. Where significant, the coefficient estimates indicate that labor entry in a given sector is positively associated with increases in the career premium of that sector and negatively associated with increases in the career premium of other sectors. Specifically, entry in asset management and investment banking and in high tech responds positively to a rise in their own career premium relative to services: a 1-standard-deviation increase in their own career premium is associated with a 2.8 percentage points increase in the probability of entry in asset management (about 11% of its mean) and a 1.8 percentage points increase in the probability of entry in high tech (about 19% of the mean). Careers in finance and high tech appear to be substitutes: the probability of entry in high tech decreases by 1 percentage point (about 10% of its mean) for a 1-standard-deviation increase in the asset management and investment banking career premium and 2.1 percentage points (about 22% of its mean) for a 1-standard-deviation increase in the banking and insurance career premium. Following the same logic, careers in asset management, investment banking, and services also appear to be substitutes.
In Figure 9, marginal effects of career premia (measured by ratios of salaries’ certainty equivalents relative to services) estimated via a multinomial logit model of entry choices in different sectors. Certainty equivalents are computed using equation (2). Pr( $ x $
) stands for the probability of choosing sector
$ x $
) stands for the probability of choosing sector $ x $
at labor market entry, with
$ x $
at labor market entry, with $ x $
being one of the following sectors: asset management and investment banking (AM&IB), commercial banking and insurance (CB&IN), high tech (HT), and services (S).
$ x $
being one of the following sectors: asset management and investment banking (AM&IB), commercial banking and insurance (CB&IN), high tech (HT), and services (S).

Interestingly, when the same models are estimated replacing career premia with wage premia, defined as the average entry wage in the relevant sector divided by the entry wage in the service sector, the estimates of the marginal effects of wage premia on the probability of entry in each sector are never significantly different from zero. The corresponding estimates are not shown for brevity. Hence, career premia appear to have more explanatory power for career choices than the typical entry wage.
The results shown in Figure 9 are consistent with entry choices being affected by rationally anticipated shifts in labor demand, triggered by changes in the distribution of future labor earnings: for instance, an expected rise in labor productivity in high tech relative to other sectors should lead to an expected rise in the demand for labor by high-tech firms and thus to an expected rise in the wage profile (and the CE annual wage) in that sector, which in turn prompts greater current entry in high tech and lower entry in other sectors, especially in those that labor market entrants view as closest substitutes of high tech.
Note that concurrent shifts in labor supply are likely to reduce the size of the estimated coefficients: for instance, a supply-driven increase in the entry into asset management and investment banking can be expected to lead to a decrease in future realized labor earnings in that sector, hence to a negative relation between entry into asset management and investment banking and the corresponding career premium.
The estimates of the marginal effects of workers’ characteristics on their entry choices (unreported for brevity) show that obtaining one’s highest degree in a top-15 school is associated with a greater probability of entry in asset management and investment banking and a lower probability of entry in banking and insurance and in high tech. Conversely, holding a Master or a Ph.D. is associated with a lower probability of entry in asset management and investment banking and banking and insurance and a higher probability of entry in high tech. The estimates also imply that female labor market entrants are less likely to start a career in asset management and investment banking or high tech, while they are more likely to start it in services.
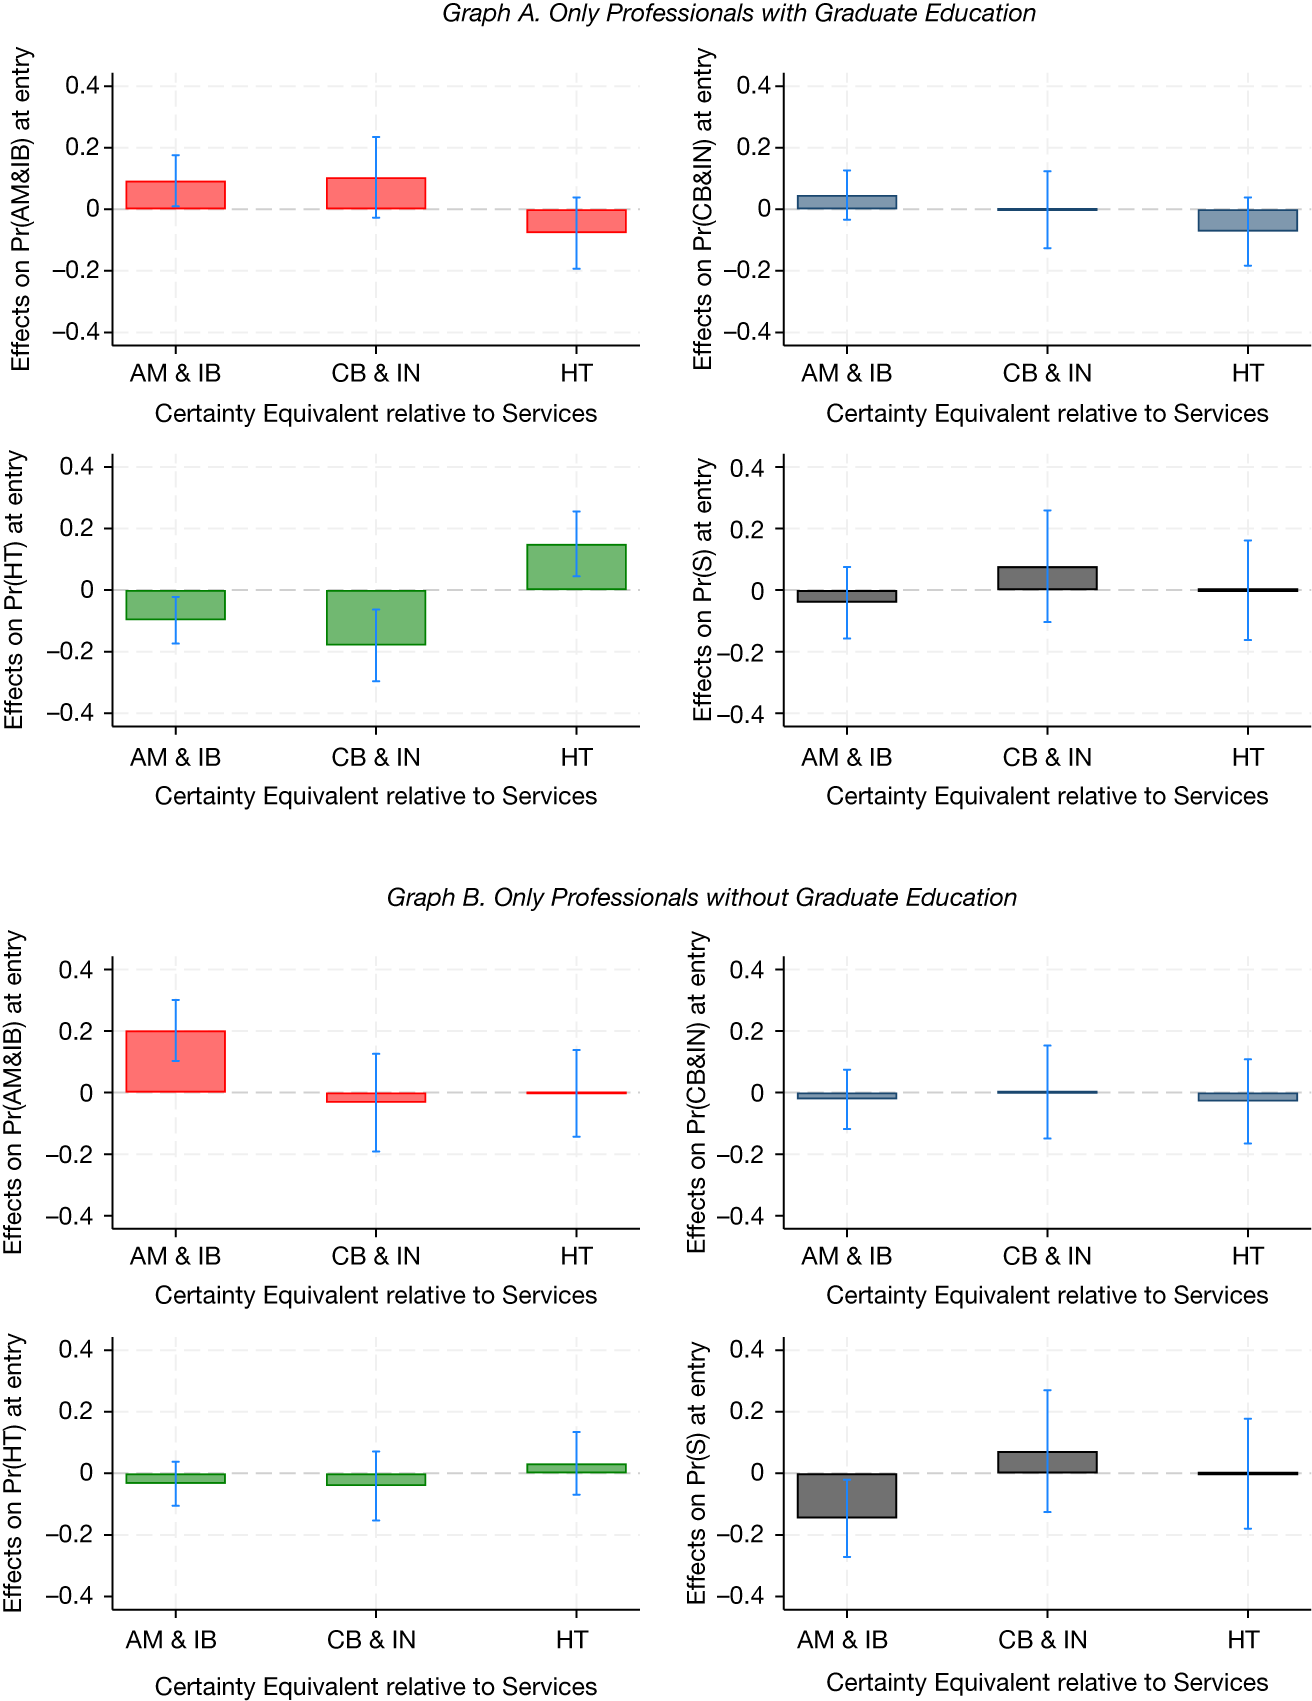
To dig deeper into the response of talent allocation to sectoral career premia, we re-estimate the multinomial logit model separately for individuals with and without graduate education. The resulting estimates are shown in Figure A3, reported in the Appendix. Consistently with the idea that the asset management and investment banking industries and high-tech industries compete for a common pool of talent, we find significant evidence of substitutability across these two sectors only for professionals holding a master or a Ph.D.: the marginal effect of the asset management and investment banking career premium on entry in high tech is negative and significantly different from zero only for individuals holding a Master or a Ph.D. This suggests that the set of skills typically acquired with graduate education are to some extent fungible between jobs in asset management and investment banking and those in high-tech industries.Footnote 5
As a robustness check, we repeat the estimation of the multinomial logit model measuring the career premia of each sector based on the CE ratio of total compensation, including bonus pay, instead of the sole wages. The results are qualitatively unchanged relative to those illustrated by the previous two figures. Only the magnitude of the estimated marginal effects of career premia is smaller because the magnitude of the premia is larger.
V. Conclusions
This article investigates how careers differ between finance and nonfinance sectors, as well as across their sectors. To do so, we introduce a synthetic measure of the attractiveness of careers, that is, the certainty equivalent of the annual compensation along the career paths of individuals who initially entered a given sector. This measure encompasses all the dimensions of career paths, that is, the level, slope, and risk of compensation over time. By scaling these certainty equivalents against a benchmark sector, we define the notion of career premium, which measures the attractiveness of careers in the relevant sector relative to the benchmark. When applied to the comparison between careers in finance and in other sectors, this metric defines the finance career premium, which differs conceptually from the wage premium used so far in the literature because it refers to the lifetime income of a cohort of workers, rather than the cross-sectional average of the incomes of employees in a given period.
We apply this methodology to data on the careers of professionals employed in finance, manufacturing, services, and high tech and find that those choosing a career in finance earn a career premium, reflecting higher and steeper compensation profiles, compared to nonfinance employees, but this result masks significant differences within finance. While asset managers start with better-paid jobs than workers in other sectors, featuring faster advances, greater returns to education, and no offsettingly high career risk, this is not true for those choosing banking and insurance.
However, we also find that the attractiveness of careers changes considerably over time, especially in asset management and investment banking, high tech, and services. Hence, by estimating a multinomial logit model, we test whether individual choices of entry sector are related to changes in the relative attractiveness of careers, as measured by their respective career premia, controlling for worker characteristics. The estimates indicate that entry in the asset management and investment banking sector and the high-tech sector responds positively to a rise in their own career premia relative to services, and that labor market entrants—especially those with graduate education—appear to consider careers in finance and high tech as substitutes. These results are consistent with evidence by Gupta and Hacamo (Reference Gupta and Hacamo2019) and Shu (Reference Shu2018) about the ebb and flow of young numerate entrants across these two sectors, as well as with the practitioners’ view that asset management firms and investment banks have faced increasingly tough competition for talent from high-tech firms, forcing them to raise the compensation offered to job market candidates:
Year after year, investment banks were among those shelling out more as they vied with ascendant Silicon Valley giants for the best candidates and tried to head off poaching by investment firms, such as buyout and hedge funds. College grads are particularly valuable to tech firms, because they’re trained on the fast-moving frontier of computer science.Footnote 6
Appendix. Further Analysis and Robustness Checks
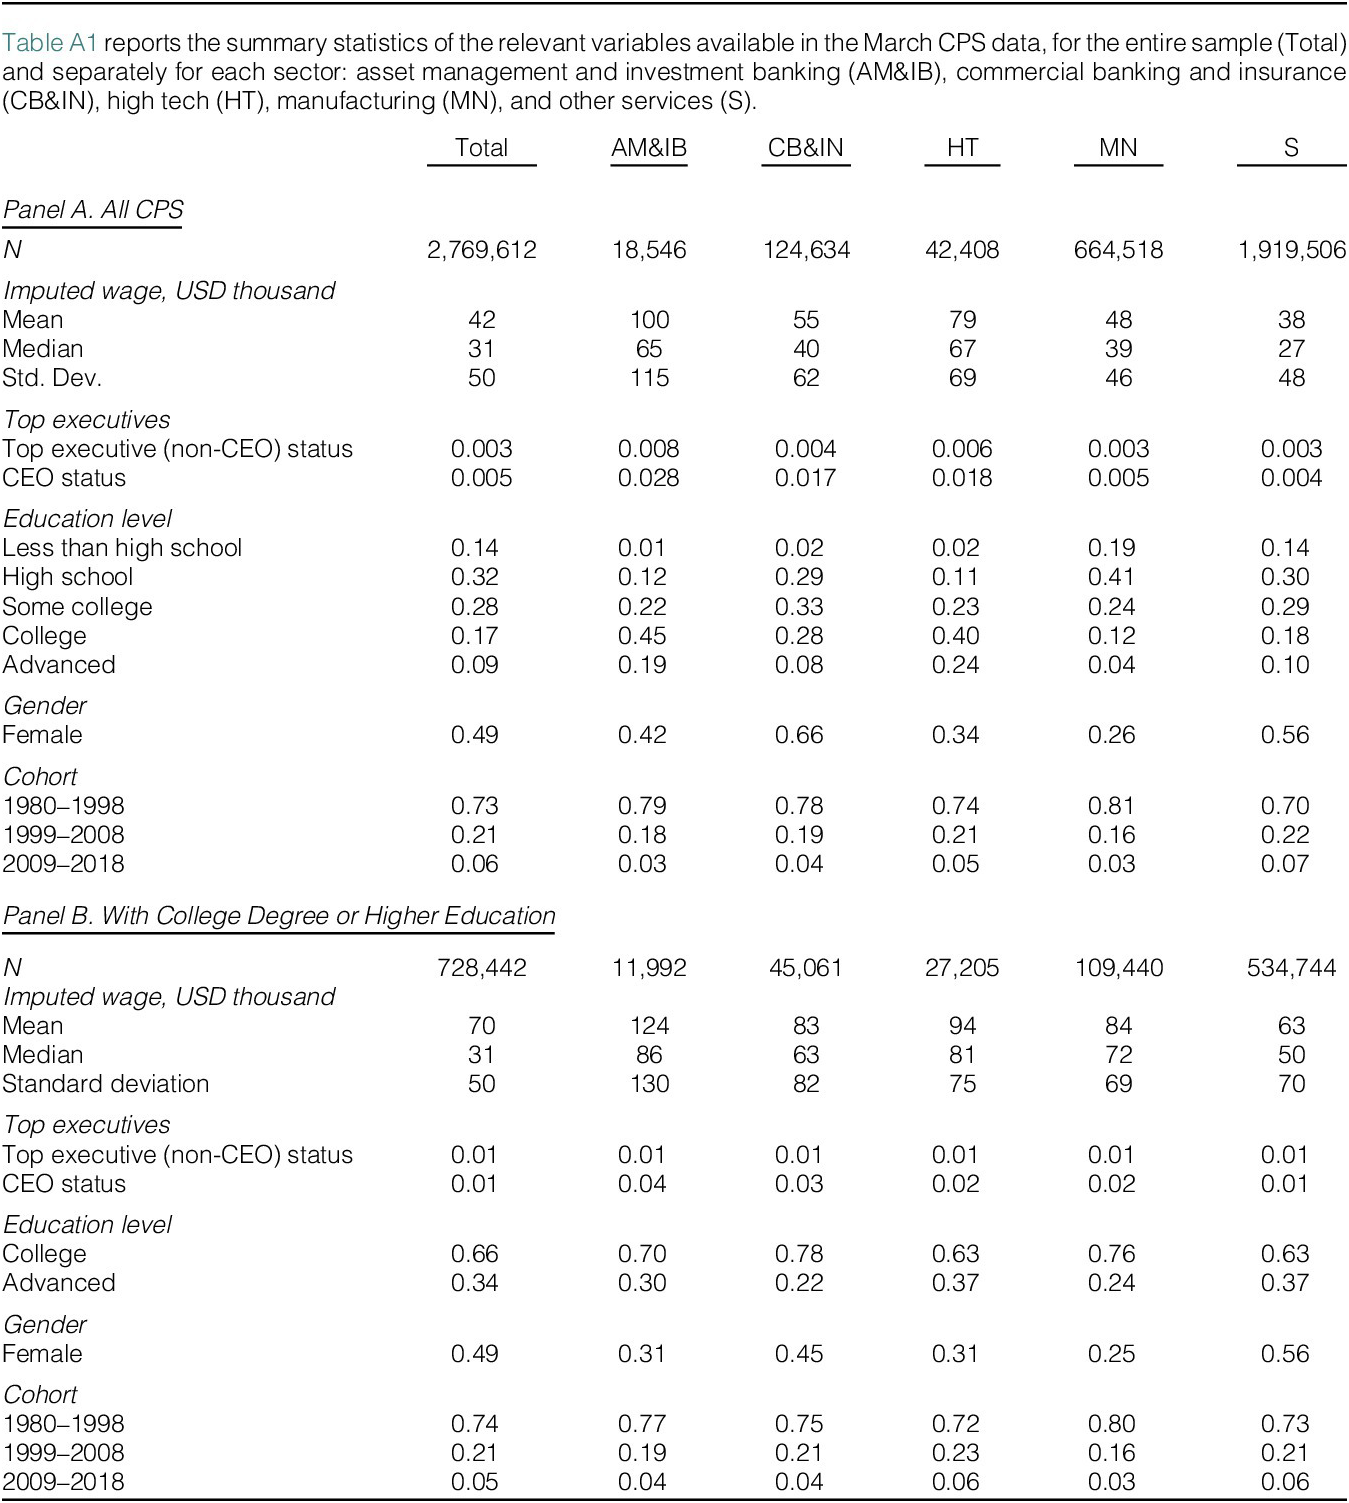
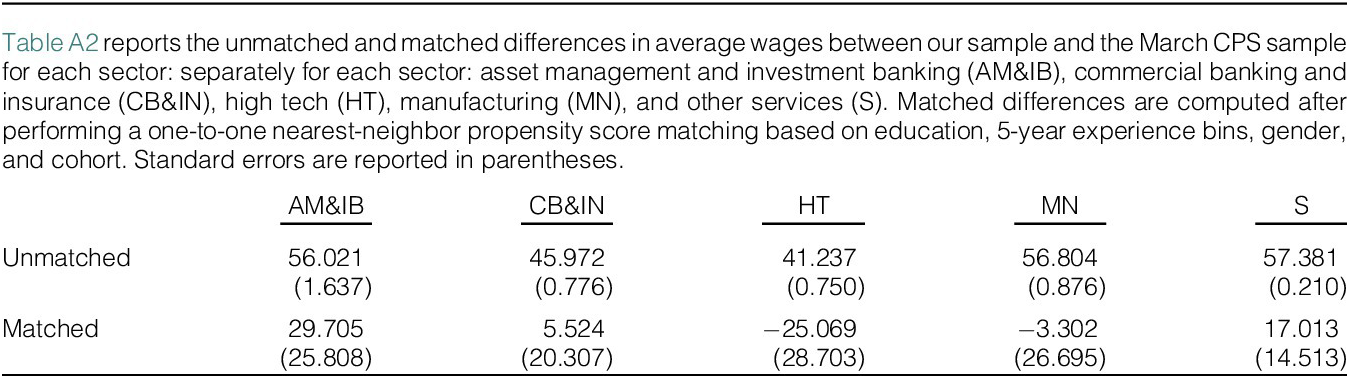
Figure A1 plots the average imputed wage by 5-year experience bins for finance and nonfinance professionals. The imputation of wages is based on cells defined by education level, gender, 5-year experience bins, occupation, sector, and year. We purge compensation data from their aggregate yearly variation by regressing them on year effects and adding the estimated residuals to the 2010 average wages. This eliminates potential spurious variation in relative wages across sectors arising from differences in sample composition over time.

Figure A2 plots the average imputed wage by 5-year experience bins for the different sectors: asset management and investment banking (AM & IB), commercial banking and insurance (CB & IN), high tech (HT), manufacturing (MN), and services (S). The imputation of wages is based on cells defined by education level, gender, 5-year experience bins, occupation, sector, and year. We purge compensation data from their aggregate yearly variation by regressing them on year effects and adding the estimated residuals to the 2010 average wages.

In Figure A3, Marginal effects of career premia, measured by ratios of salaries’ certainty equivalents relative to services, in a multinomial logit model of entry choices of professionals with graduate education (Graph A) and without graduate education (Graph B). Pr( $ x $
) stands for the probability of choosing sector
$ x $
) stands for the probability of choosing sector $ x $
at labor market entry, with
$ x $
at labor market entry, with $ x $
being one of the following sectors: asset management and investment banking (AM&IB), commercial banking and insurance (CB&IN), high tech (HT), and services (S).
$ x $
being one of the following sectors: asset management and investment banking (AM&IB), commercial banking and insurance (CB&IN), high tech (HT), and services (S).










 Open access

