


I. Introduction
Historically, value stocks have outperformed growth stocks. Since the global financial crisis of 2008–2009, however, value stocks have persistently underperformed. The value premium based on the Fama–French HML factor averaged 5.20% per annum between July 1926 and December 2007, but only −0.86% between January 2008 and March 2025.Footnote 1 Moreover, while value outperformed growth in 55% of months during the earlier period, it did so in only 43% of months in the later period. Alternate measures of value based on earnings and cash flows also performed poorly post-2007 (see Section III.B), indicating the value underperformance was not limited to the traditional B/M ratio. As Figure 1 illustrates, this recent underperformance mirrors value’s pre-World War II underperformance, when it outperformed growth in only 42% of months from July 1926 to December 1940. This raises the question: Is the recent underperformance a permanent disappearance of the traditional value premium, or does it reflect a predictable time variation?Footnote 2
Graph A of Figure 1 plots the entire time series from 1927 to 2024, and Graph B plots the time series from 1977 to 2024. The data are from Kenneth French’s web page. The purple recession years correspond to NBER-defined recession periods, as follows: October 1926–November 1927, August 1929–March 1933, May 1937–June 1938, February 1945–October 1945, November 1948–October 1949, July 1953–May 1954, August 1957–April 1958, April 1960–February 1961, December 1969–November 1970, November 1973–March 1975, January 1980–July 1980, July 1981–November 1982, July 1990–March 1991, March 2001–November 2001, December 2007–June 2009, and February 2020–April 2020.

Indeed, the ex post value premium exhibits considerable time variation over the years. Figure 1 reveals multiple value/growth cycles over the 1927–2024 time period. Value cycles seem to last 5–7 years, while growth cycles last 2–3 years, at least until 2007. The last significant value cycle occurred after the Dotcom bubble, from 2000 to 2007. This time variation does not appear to be related to business cycles. Value outperformed during the 1981–1982 and 2001 recessions, but underperformed in the 2008–2009 and 2020 recessions, as well as the 1998–1999 expansion. Consistent with this mixed pattern, the correlation between HML and a NBER recession dummy over 1977–2023 is only 0.05 ( $ p $
= 0.23).
$ p $
= 0.23).
While much of the literature on the value premium has focused on cross-sectional asset pricing, relatively little attention has been paid to explaining its substantial time variation. This article contributes to that emerging line of research in three ways. First, we introduce a measure of ex ante value premium, referred to as the implied value premium (IVP), constructed from the implied cost of capital (ICC), to predict the ex post value premium.Footnote 3 The traditional measure used in the literature is the value spread (VS), based on B/M ratios. Second, we compare the predictive power of IVP and VS for HML, controlling for various countercyclical risk proxies (e.g., default spread, term spread). Third, we explore whether this predictability arises from risk or mispricing, and conclude that mispricing is at least a partial explanation for the time variation in the value premium.
The implied value premium (IVP) is the difference in the implied costs of capital between value and growth stocks, serving as a direct estimate of the difference in their expected returns. Since the ICC methodology takes into account differences in forward earnings growth rates and payout ratios, we argue that IVP is a more precise estimate of the ex ante value premium than traditional valuation metrics such as earnings yields, book-to-market ratios, and other related measures.Footnote 4 We use IVP to predict the ex post value premium and show that it more effectively captures its time variation.
We compute the implied value premium IVP in three ways: i) using value/growth portfolios based on book-to-market (B/M) ratios, following Fama and French (Reference Fama and French1993), ii) using value/growth portfolios based on a composite value measure that includes book-to-market (B/M), cash flow-to-price (C/P), and 1-year and 2-year ahead forecasted earnings-to-price ratios (FE1/P and FE2/P), and iii) using value/growth portfolios (ex-financials) based on the operating cash flow-to-market ratio (OCF/M), where operating cash flows are defined as EBITDA plus R&D expenses minus the change in working capital, following Ball, Gerakos, Linnainmaa, and Nikolaev (Reference Ball, Gerakos, Linnainmaa and Nikolaev2015), (Reference Ball, Gerakos, Linnainmaa and Nikolaev2016) and Hou, Mo, Xue, and Zhang (Reference Hou, Mo, Xue and Zhang2024). The last two measures are motivated by the fact that B/M has not performed well over the past two decades (see Asness, Frazzini, Israel, and Moskowitz (Reference Asness, Frazzini, Israel and Moskowitz2015), Fama and French (Reference Fama and French2015), Park (Reference Park2022), and Gonçalves and Leonard (Reference Gonçalves and Leonard2023)). These additional measures, based on cash flows and forward-looking earnings, show that our results are robust to alternative definitions of value and growth.
We forecast four measures of ex post value premium: i) the Fama and French HML factor (Fama and French (Reference Fama and French1993), (Reference Fama and French1996)), ii) an HML factor based on B/M ratios, iii) an HML factor based on the composite value measure, and iv) an HML factor based on OCF/M. The HML factors in ii)–iv) are constructed using only firms in our sample. Our sample includes all firms with available analyst earnings forecasts from January 1977 to December 2023.
We conduct long-horizon forecasting regression tests to evaluate the predictive power of IVP, with all statistical inference based on Monte Carlo simulations. These tests control for the value spread, business cycle proxies including the term spread and the default spread, and a smoothed HML, defined as the average Fama–French HML returns over the past 3 years. IVP emerges as the strongest predictor of the ex post value premium across horizons ranging from 6 to 36 months. None of the other variables exhibit any predictive power. This result remains robust when controlling for real interest rates, which fell sharply after 2007, a period of value underperformance. Our findings are also robust across model assumptions, portfolio construction methods, and firm size categories. We further rule out analyst forecast bias as a primary driver.
Our in-sample analysis shows that IVP is an excellent predictor of ex post value premium. We also evaluate its out-of-sample performance for two forecast periods: December 2001–December 2023 and December 1993–December 2023. In both periods, IVP is the best predictor of HML, outperforming the value spread and business cycle variables, and providing distinct predictive information beyond these measures.Footnote 5 We next examine potential sources of IVP’s predictive power for the ex post value premium.
Zhang (Reference Zhang2017) shows that under the Investment CAPM, the value premium arises from firm investment behavior rather than mispricing and is linked to the investment premium, the return spread between low- and high-investment firms. In this framework, value firms have fewer growth opportunities, invest less, and consequently earn higher expected returns than growth firms. Consistent with this interpretation, we find that the correlations between the four HML factors and the investment premium range from 43% to 64% (see Section IV.C.1), suggesting common sources of return variation. Further reinforcing this view, we find that IVP strongly predicts the investment factor from the q-factor model (Hou, Xue, and Zhang (Reference Hou, Xue and Zhang2015), Hou, Mo, Xue, and Zhang (Reference Hou, Mo, Xue and Zhang2019), (Reference Hou, Mo, Xue and Zhang2021), and Hou et al. (Reference Hou, Mo, Xue and Zhang2024)).
La Porta, Lakonishok, Shleifer, and Vishny (Reference La Porta, Lakonishok, Shleifer and Vishny1997) show that value stocks earn positive, and growth stocks negative, abnormal returns, around quarterly earnings announcements, suggesting investors are systematically surprised. We extend this analysis to the time series by averaging cumulative abnormal returns (CARs) from day −1 to +1 around earnings announcements over the next 12 quarters. CAR(HML), defined as the difference between the average CARs of value and growth portfolios, captures relative price reactions to earnings surprises. We find that IVP positively predicts CAR(HML). Lakonishok et al. (Reference Lakonishok, Shleifer and Vishny1994) argue that value stocks become undervalued and growth stocks overvalued because investors extrapolate past performance too far into the future. Building on this, Barberis and Shleifer (Reference Barberis and Shleifer2003) develop a style-investing model in which investors with extrapolative expectations switch between styles based on past returns, generating time-varying relative expectations, mispricing, and a dynamic value premium. IVP’s ability to predict CAR(HML) is consistent with these interpretations.
At first pass, our findings appear inconsistent with rational asset pricing models, since risk is unlikely to vary significantly over the short windows surrounding earnings announcements. Within the Investment CAPM framework (see Liu, Whited, and Zhang (Reference Liu, Whited and Zhang2009), Wu, Zhang, and Zhang (Reference Wu, Zhang and Zhang2010), Lin and Zhang (Reference Lin and Zhang2013), Liu and Zhang (Reference Liu and Zhang2014), Zhang (Reference Zhang2017), and Gonçalves, Xue, and Zhang (Reference Gonçalves, Xue and Zhang2020)), however, owning a stock is equivalent to owning the firm’s investment, so stock returns theoretically equal fundamental returns. A positive (negative) earnings surprise implies a higher (lower) fundamental return and, hence, a higher (lower) stock return, providing a direct profitability channel from earnings surprises to stock returns. As noted earlier, a widening IVP is associated with higher CAR(HML), consistent with value stocks experiencing systematically more positive earnings surprises than growth stocks. Investigating the potential role of rational asset pricing, including both the Investment CAPM and the Consumption CAPM, in explaining this link between IVP and CAR(HML) remains a fruitful area for future research.
We return to the question posed at the outset: Is the recent underperformance a permanent disappearance of the traditional value premium, or does it reflect predictable time variation? Our evidence supports the latter, suggesting that the post-2007 underperformance may be part of a cyclical pattern. While value managers may welcome this view, the rise of AI, quantum computing, and other technological disruptions suggests that traditional valuation ratios may no longer suffice. More sophisticated approaches, such as DCF and real-option models, may be needed to uncover intrinsic value. We leave these issues and their broader implications to future research.
The rest of the article proceeds as follows: Section II describes our methodology for constructing the implied value premium. Section III discusses the data and summary statistics. Section IV presents the in-sample and out-of-sample predictability results and investigates the sources behind IVP’s strong predictive power. Section V concludes the article.
II. Construction of Implied Value Premium
This section outlines the methodology for estimating firm-level implied cost of capital (ICC), constructing value and growth portfolios, and calculating the implied value premium (IVP) as the difference between their respective ICCs.
A. Firm-Level Implied Cost of Capital
Following Pastor, Sinha, and Swaminathan (Reference Pastor, Sinha and Swaminathan2008), Lee, Ng, and Swaminathan (Reference Lee, Ng and Swaminathan2009), and Li, Ng, and Swaminathan (Reference Li, Ng and Swaminathan2013), we define firm-level ICC as the internal rate of return that equates the present value of expected future dividends or free cash flows to the current stock price:Footnote 6
 $$ {P}_t=\sum \limits_{k=1}^{\infty}\frac{E_t\left({D}_{t+k}\right)}{{\left(1+{r}_e\right)}^k}. $$
We make two key assumptions in implementing the free cash flow model: i) short-run earnings growth rates converge in the long run to the growth rate of the overall economy, and ii) competition will drive economic profits on new investments to zero in the long run, that is, the marginal rate of return on investment (the ROI on the next dollar invested) converges to the cost of capital. As discussed later, these assumptions are used to forecast earnings growth rates and free cash flows during the transition from the short-run to the long-run steady state. We implement equation (1) in two parts: i) the present value of free cash flows up to a terminal period $ t+T $
, and ii) a continuing value that captures free cash flows beyond the terminal period. Free cash flows through year
$ t+T $
, and ii) a continuing value that captures free cash flows beyond the terminal period. Free cash flows through year $ t+T $
are estimated as the product of annual earnings forecasts and one minus the plowback rate:
$ t+T $
are estimated as the product of annual earnings forecasts and one minus the plowback rate:
 $$ {E}_t\left({FCFE}_{t+k}\right)={FE}_{t+k}\times \left(1-{b}_{t+k}\right), $$
where $ {FE}_{t+k} $
and
$ {FE}_{t+k} $
and $ {b}_{t+k} $
are the earnings forecasts and the plowback rate forecasts for year
$ {b}_{t+k} $
are the earnings forecasts and the plowback rate forecasts for year $ t+k $
, respectively.
$ t+k $
, respectively.
We forecast earnings up to year $ t+T $
in three stages:
$ t+T $
in three stages:
-
i) We explicitly forecast earnings (in dollars) for year $ t+1 $
using analyst forecasts. IBES analysts provide earnings per share (EPS) forecasts for the next two fiscal years,
$ {FY}_1 $
and
$ {FY}_2 $
, for each firm in the IBES database. We construct a 12-month ahead earnings forecast
$ {FE}_1 $
as a weighted average of the median
$ {FY}_1 $
and
$ {FY}_2 $
forecasts:
$ {FE}_1=w\times {FY}_1+\left(1-w\right)\times {FY}_2 $
, where
$ w $
is the number of months remaining until the next fiscal year-end divided by 12. We use median forecasts instead of means in order to alleviate the effects of extreme forecasts.
$ t+1 $
using analyst forecasts. IBES analysts provide earnings per share (EPS) forecasts for the next two fiscal years,
$ {FY}_1 $
and
$ {FY}_2 $
, for each firm in the IBES database. We construct a 12-month ahead earnings forecast
$ {FE}_1 $
as a weighted average of the median
$ {FY}_1 $
and
$ {FY}_2 $
forecasts:
$ {FE}_1=w\times {FY}_1+\left(1-w\right)\times {FY}_2 $
, where
$ w $
is the number of months remaining until the next fiscal year-end divided by 12. We use median forecasts instead of means in order to alleviate the effects of extreme forecasts. -
ii) We use the growth rate implied by
$ {FY}_1 $
and
$ {FY}_2 $
forecasts to forecast earnings for year
$ t+2 $
. The implied growth is
$ {g}_2={FY}_2/{FY}_1-1 $
, and the 2-year-ahead earnings forecast is given by
$ {FE}_2={FE}_1\left(1+{g}_2\right) $
. Constructing
$ {FE}_1 $
and
$ {FE}_2 $
in this way ensures a smooth transition from
$ {FY}_1 $
to
$ {FY}_2 $
throughout the fiscal year and guarantees that our forecasts are always 12 and 24 months ahead from the current month. To avoid extreme values, we limit growth rates to between 1% and 75%. -
iii) We forecast earnings from year
$ t+3 $
through year
$ t+T+1 $
by assuming that the year
$ t+2 $
earnings growth rate,
$ {g}_2 $
, mean-reverts exponentially to a long-run steady-state growth by year
$ t+T+2 $
. Starting in year
$ t+T+2 $
, we assume earnings grow at the long-run nominal GDP growth rate,
$ g $
, computed as a rolling average of annual nominal GDP growth rates. The EPS growth rates and the resulting EPS forecasts are computed for years
$ t+3 $
to
$ t+T+1 $
(
$ k=3,\dots, T+1 $
) using an exponential rate of mean reversion:









 $$ {g}_{t+k}={g}_{t+k-1}\times \exp \left[\log \left(g/{g}_2\right)/T\right]\;\mathrm{and} $$
 $$ {FE}_{t+k}={FE}_{t+k-1}\times \left(1+{g}_{t+k}\right). $$
The exponential rate of mean reversion corresponds to linear interpolation in logs and results in a faster decay for higher growth rates, consistent with the empirical evidence in Nissim and Penman (Reference Nissim and Penman2001).
We forecast plowback rates using a two-stage approach.
-
i) We explicitly forecast the plowback rate for year
$ t+1 $
as one minus the most recent year’s dividend payout ratio. The payout ratio is estimated as actual dividends paid during the most recent fiscal year divided by earnings over the same period.Footnote
7 We exclude share repurchases and new equity issues due to the practical challenges associated with assessing their recurrence in future periods.Footnote
8 Payout ratios below zero (above one) are capped at zero (one). -
ii) We assume that the plowback rate in year
$ t+1 $
, denoted
$ {b}_1 $
, reverts linearly to a steady-state value by year
$ t+T+1 $
, computed using the sustainable growth rate formula. In the steady state, the product of the return on new investments and the plowback rate,
$ ROE\times b $
, equals the sustainable earnings growth rate,
$ g $
. We further impose the condition that
$ ROE $
equals the cost of equity,
$ {r}_e $
, in the steady state, reflecting the idea that competition will drive return on new investment down to the cost of equity. Substituting
$ {r}_e $
for
$ ROE $
in the sustainable growth rate formula and solving for the steady-state plowback rate gives
$ b=g/{r}_e $
. Intermediate plowback rates from
$ t+2 $
to
$ t+T $
(
$ k=2,\dots, T $
) are computed as follows:


 $$ {b}_{t+k}={b}_{t+k-1}-\frac{b_1-b}{T}. $$
The terminal value $ TV $
is computed as the present value of a perpetuity equal to the ratio of the year
$ TV $
is computed as the present value of a perpetuity equal to the ratio of the year $ t+T+1 $
earnings forecast divided by the cost of equity:
$ t+T+1 $
earnings forecast divided by the cost of equity:
 $$ {TV}_{t+T}=\frac{FE_{t+T+1}}{r_e}, $$
where $ {FE}_{t+T+1} $
is the earnings forecast for year
$ {FE}_{t+T+1} $
is the earnings forecast for year $ t+T+1 $
.Footnote
9 It is straightforward to show that the constant growth model simplifies to equation (5) when
$ t+T+1 $
.Footnote
9 It is straightforward to show that the constant growth model simplifies to equation (5) when $ ROE $
equals
$ ROE $
equals $ {r}_e $
.
$ {r}_e $
.
Substituting equations (2) to (5) into the infinite horizon free cash flow valuation model in equation (1) provides the following empirically tractable finite horizon model:
 $$ {P}_t=\sum \limits_{k=1}^T\frac{FE_{t+k}\times \left(1-{b}_{t+k}\right)}{{\left(1+{r}_e\right)}^k}+\frac{FE_{t+T+1}}{r_e{\left(1+{r}_e\right)}^T}. $$
Following Li et al. (Reference Li, Ng and Swaminathan2013), we use a $ 15 $
-year horizon
$ 15 $
-year horizon $ \left(T=15\right) $
to implement the model in (6) and compute
$ \left(T=15\right) $
to implement the model in (6) and compute $ {r}_e $
as the rate of return that equates the present value of free cash flows to the current stock price. The resulting
$ {r}_e $
as the rate of return that equates the present value of free cash flows to the current stock price. The resulting $ {r}_e $
is the firm-level ICC measure used in our empirical analysis. To reduce the influence of outliers, we trim the firm-level ICC by removing the top and bottom
$ {r}_e $
is the firm-level ICC measure used in our empirical analysis. To reduce the influence of outliers, we trim the firm-level ICC by removing the top and bottom $ 0.5\% $
in each month.
$ 0.5\% $
in each month.
B. Value and Growth Portfolios and Realized Value Premium
For each month $ t $
from January 1977 to December 2023, all NYSE stocks in CRSP are ranked by size (market capitalization). The median NYSE market cap is used to split NYSE, Amex, and NASDAQ stocks into two size portfolios: small (S) and big (B). Stocks are also sorted into three book-to-market (B/M) portfolios using NYSE breakpoints: the bottom 30% form the low B/M group (L), the middle 40% the medium group (M), and the top 30% the high B/M group (H). Book equity is calculated as stockholders’ equity plus balance sheet-deferred taxes and investment tax credits, minus the book value of preferred stock. Depending on data availability, we use redemption value, liquidation value, or par value, in that order, to represent preferred stock. Book-to-market equity (B/M) is then computed as the most recent Compustat book equity, lagged by 3 months to ensure public availability, divided by market equity at the end of month
$ t $
from January 1977 to December 2023, all NYSE stocks in CRSP are ranked by size (market capitalization). The median NYSE market cap is used to split NYSE, Amex, and NASDAQ stocks into two size portfolios: small (S) and big (B). Stocks are also sorted into three book-to-market (B/M) portfolios using NYSE breakpoints: the bottom 30% form the low B/M group (L), the middle 40% the medium group (M), and the top 30% the high B/M group (H). Book equity is calculated as stockholders’ equity plus balance sheet-deferred taxes and investment tax credits, minus the book value of preferred stock. Depending on data availability, we use redemption value, liquidation value, or par value, in that order, to represent preferred stock. Book-to-market equity (B/M) is then computed as the most recent Compustat book equity, lagged by 3 months to ensure public availability, divided by market equity at the end of month $ t $
. Following Fama and French (Reference Fama and French1993), we exclude firms with negative book equity when calculating breakpoints and when forming portfolios. Intersecting the two size groups and three B/M groups yields six size–B/M portfolios: S/L, S/M, S/H, B/L, B/M, and B/H. We define the value portfolio (H) as the equal-weighted average of S/H and B/H,
$ t $
. Following Fama and French (Reference Fama and French1993), we exclude firms with negative book equity when calculating breakpoints and when forming portfolios. Intersecting the two size groups and three B/M groups yields six size–B/M portfolios: S/L, S/M, S/H, B/L, B/M, and B/H. We define the value portfolio (H) as the equal-weighted average of S/H and B/H, $ \left(\mathrm{S}/\mathrm{H}+\mathrm{B}/\mathrm{H}\right)/2 $
, and the growth portfolio (L) as the equal-weighted average of S/L and B/L,
$ \left(\mathrm{S}/\mathrm{H}+\mathrm{B}/\mathrm{H}\right)/2 $
, and the growth portfolio (L) as the equal-weighted average of S/L and B/L, $ \left(\mathrm{S}/\mathrm{L}+\mathrm{B}/\mathrm{L}\right)/2 $
. The value premium, HML, is the difference in returns between
$ \left(\mathrm{S}/\mathrm{L}+\mathrm{B}/\mathrm{L}\right)/2 $
. The value premium, HML, is the difference in returns between $ \left(\mathrm{S}/\mathrm{H}+\mathrm{B}/\mathrm{H}\right)/2 $
and
$ \left(\mathrm{S}/\mathrm{H}+\mathrm{B}/\mathrm{H}\right)/2 $
and $ \left(\mathrm{S}/\mathrm{L}+\mathrm{B}/\mathrm{L}\right)/2 $
.
$ \left(\mathrm{S}/\mathrm{L}+\mathrm{B}/\mathrm{L}\right)/2 $
.
Although B/M is the most commonly used measure to define value and growth stocks in the academic literature, it has several well-documented limitations. Since at least 2015, the literature has raised concerns about the traditional book-to-market ratio (see Asness et al. (Reference Asness, Frazzini, Israel and Moskowitz2015), Fama and French (Reference Fama and French2015), Eisfeldt, Kim, and Papanikolaou (Reference Eisfeldt, Kim and Papanikolaou2022), Park (Reference Park2022), and Gonçalves and Leonard (Reference Gonçalves and Leonard2023)), citing factors such as rising amounts of intangible assets and changes in accounting standards. Gonçalves and Leonard (Reference Gonçalves and Leonard2023) propose a fundamental equity-to-price ratio as a potentially better proxy than B/M. Motivated by these limitations, we introduce two alternative measures of value in addition to B/M.
The first measure is a composite value rank combining B/M, the cash flow-to-price ratio (C/P), and two earnings-to-price ratios: FE $ {}_1 $
/P and FE
$ {}_1 $
/P and FE $ {}_2 $
/P based on 1- and 2-year-ahead earnings forecasts, respectively. Following Lakonishok et al. (Reference Lakonishok, Shleifer and Vishny1994), C/P is defined as net income before extraordinary items plus depreciation and amortization from the most recent Compustat data (lagged by 3 months), divided by market equity at month t. For each measure, firms are ranked monthly from 0 (most expensive) to 1 (most value-like). The composite rank is calculated as a weighted average:
$ {}_2 $
/P based on 1- and 2-year-ahead earnings forecasts, respectively. Following Lakonishok et al. (Reference Lakonishok, Shleifer and Vishny1994), C/P is defined as net income before extraordinary items plus depreciation and amortization from the most recent Compustat data (lagged by 3 months), divided by market equity at month t. For each measure, firms are ranked monthly from 0 (most expensive) to 1 (most value-like). The composite rank is calculated as a weighted average:
 $$ \frac{1}{3} RnkB/M+\frac{1}{3}\left(\frac{1}{2}{RnkFE}_1/P+\frac{1}{2}{RnkFE}_2/P\right)+\frac{1}{3} RnkC/P, $$
where $ RnkB/M $
,
$ RnkB/M $
, $ {RnkFE}_1/P $
,
$ {RnkFE}_1/P $
, $ {RnkFE}_2/P $
, and
$ {RnkFE}_2/P $
, and $ RnkC/P $
are the individual ranks of corresponding value measures.Footnote
10 Each month from January 1977 to December 2023, we form value and growth portfolios based on a two-way sort using size and the composite value rank. The sorting procedure follows the same portfolio construction steps as with the B/M-based portfolios: (S/H + B/H)/2 is the value portfolio (H), (S/L + B/L)/2 is the growth portfolio (L), and HML = (S/H + B/H)/2 –(S/L + B/L)/2.
$ RnkC/P $
are the individual ranks of corresponding value measures.Footnote
10 Each month from January 1977 to December 2023, we form value and growth portfolios based on a two-way sort using size and the composite value rank. The sorting procedure follows the same portfolio construction steps as with the B/M-based portfolios: (S/H + B/H)/2 is the value portfolio (H), (S/L + B/L)/2 is the growth portfolio (L), and HML = (S/H + B/H)/2 –(S/L + B/L)/2.
Finally, we use a value measure based on operating cash flows, motivated by Ball et al. (Reference Ball, Gerakos, Linnainmaa and Nikolaev2015), (Reference Ball, Gerakos, Linnainmaa and Nikolaev2016) and Hou et al. (Reference Hou, Mo, Xue and Zhang2024), who show that the operating cash flow-to-market ratio (OCF/M) is a superior measure of value compared to B/M. For nonfinancial firms, OCF is defined as EBITDA plus R&D expenses minus the change in working capital. We further require that (EBITDA + R&D) be positive for the operating cash flow-to-market measure to prevent loss firms from distorting the portfolio rankings. Similar to B/M, OCF/M is calculated using the most recent Compustat data (lagged by 3 months), divided by market equity at the end of month $ t $
. High OCF/M stocks are classified as value stocks, while low OCF/M stocks are considered growth stocks. Each month from January 1977 to December 2023, we form value and growth portfolios based on a two-way sort using size and OCF/M.
$ t $
. High OCF/M stocks are classified as value stocks, while low OCF/M stocks are considered growth stocks. Each month from January 1977 to December 2023, we form value and growth portfolios based on a two-way sort using size and OCF/M.
We construct three HML factors within our sample, in addition to the Fama and French HML factor, yielding four HML factors in total for our empirical tests:
-
i) HML(FF), the Fama and French HML based on B/M ratios from Ken French’s data library (https://mba.tuck.dartmouth.edu/pages/faculty/ken.french/data_library.html).
-
ii) HML(B/M), also based on B/M ratios but constructed using only the firms in our sample.
-
iii) HML(Comp), based on the composite value measure, again using only the firms in our sample.
-
iv) HML(OCF/M), based on the OCF/M measure, again using only the firms in our sample.
C. Implied Value Premium and Value Spread
We construct the implied value premium (IVP) as follows: Each month, we form value and growth portfolios using the latest B/M ratio, the composite value rank, or the OCF/M ratio. We compute the ICCs of S/L, B/L, S/H, and B/H by value weighting the ICCs of constituent firms using month-end market capitalizations. The ICC for the H portfolio is the simple average of S/H and B/H, and the ICC for the L portfolio is the average of S/L and B/L. The implied value premiums are then:
 $$ {\displaystyle \begin{array}{c} IVP{\left(B/M\right)}_t= ICCH{\left(B/M\right)}_t- ICCL{\left(B/M\right)}_t,\\ {} IVP{(Comp)}_t= ICCH{(Comp)}_t- ICCL{(Comp)}_t,\\ {} IVP{\left( OCF/M\right)}_t= ICCH{\left( OCF/M\right)}_t- ICCL{\left( OCF/M\right)}_t,\end{array}} $$
where $ ICCH $
is the ICC for the value portfolio (H) and
$ ICCH $
is the ICC for the value portfolio (H) and $ ICCL $
is the ICC for the growth portfolio (L).
$ ICCL $
is the ICC for the growth portfolio (L).
An important control variable in our regression analysis is the value spread (VS) (e.g., Asness et al. (Reference Asness, Friedman, Krail and Liew2000), Cohen et al. (Reference Cohen, Polk and Vuolteenaho2003)). For value and growth portfolios based on B/M and composite value rank, VS is defined as the difference in the log book-to-market ratios of value and growth portfolios. The book-to-market ratio of the value portfolio is computed as the simple average of the value-weighted ratios of S/H and B/H, while the growth portfolio ratio is computed analogously using S/L and B/L. The value spreads based on B/M and the composite value rank are denoted as VS(B/M) and VS(Comp), respectively:
 $$ {VS}_t= logB/M{(H)}_t- logB/M{(L)}_t. $$
For OCF/M, since operating cash flows can be negative, we construct a scaled value spread by dividing the raw value spread by the cross-sectional median absolute deviation (MAD). Thus, the OCF/M-based value spread is
 $$ {VS}_t=\left( OCF/M{(H)}_t- OCF/M{(L)}_t\right)/ MAD. $$
III. Data and Summary Statistics
A. Data
We obtain market capitalization and return data from CRSP; accounting data, including common dividends, net income, EBITDA, book value of common equity, depreciation and amortization, working capital items, and fiscal year-end date, from COMPUSTAT; and analyst earnings forecasts and share prices from IBES. To ensure that we use only publicly available information, we obtain accounting data items for the most recent fiscal year ending at least 3 months prior to the month in which the ICC is computed. Data on nominal GDP growth rates are obtained from the Bureau of Economic Analysis. Our GDP data begin in 1930. Each year, we compute the steady-state GDP growth rate as the historical average of GDP growth rates using annual data up to that year.
The control variables used in the forecasting regressions include the business cycle variables term spread (Term) and default spread (Default). The term spread is defined as the difference between Moody’s AAA bond yield and the 3-month T-bill rate, and represents the slope of the Treasury yield curve. The default spread is the difference in yields between BAA- and AAA-rated corporate bonds. All data are obtained from the economic research database at the Federal Reserve Bank of St. Louis (FRED) (https://fred.stlouisfed.org/).
B. Summary Statistics
Table 1 presents summary statistics for the variables used in this article. Panel A reports the implied value premiums based on B/M (IVP(B/M)), the composite measure (IVP(Comp)), and OCF/M (IVP(OCF/M)) for the full sample period (January 1977–December 2023) and for two subperiods: January 1977–December 2007 and January 2008–December 2023. Over the full sample, the means of IVP(B/M), IVP(Comp), and IVP(OCF/M) are 3.44%, 4.28%, and 2.99%, respectively. Across the two subperiods, the means of all three measures declined. For example, the mean of IVP(B/M) fell from 3.81% to 2.70%, IVP(Comp) decreased from 4.49% to 3.87%, and IVP(OCF/M) decreased from 3.07% to 2.85%.

Panel B reports summary statistics for the four HML measures. Our in-sample HML(B/M) closely tracks the standard HML(FF), with mean annualized returns of 2.78% and 2.62%, respectively. By contrast, HML(Comp) delivers a stronger premium of 4.39%, while HML(OCF/M) is highest at 5.43%, consistent with Hou et al. (Reference Hou, Mo, Xue and Zhang2024). The four measures are highly correlated (0.73–0.93 in Panel D). Except for HML(OCF/M), all exhibit negative long-horizon autocorrelations, most pronounced at the 3-year horizon, motivating our use of the smoothed HML as a control.
The ex post value premium declined sharply across all four measures when comparing the pre-2007 and post-2007 periods. From 1977 to 2007, the average annualized returns for HML(B/M), HML(Comp), HML(OCF/M), and HML(FF) were 3.79%, 5.92%, 7.09%, and 4.54%, respectively. In contrast, over 2008–2023 the corresponding values dropped to 0.82%, 1.43%, 2.21%, and −1.09%. A nonparametric perspective confirms this pattern: the proportion of months in which HML was positive fell from 55.38% to 47.92% for HML(B/M), from 57.80% to 45.31% for HML(Comp), from 58.60% to 51.56% for HML(OCF/M), and from 55.65% to 43.75% for HML(FF). While HML(OCF/M) continues to perform best post-2007, its average return of 2.21% is far below its pre-2007 level of 7.09%, underscoring that the weak post-2007 value premium is not simply a B/M phenomenon.
The average implied value premium in Panel A is of similar magnitude to the ex post value premium in Panel B over the full sample. The means of IVP(B/M), IVP(Comp), and IVP(OCF/M) are 3.44%, 4.28%, and 2.99%, respectively, comparable to the means of the four HML factors, which range from 2.62% to 5.43%. The implied value premium is also highly persistent, with first-order autocorrelations of 0.90 for IVP(B/M), 0.89 for IVP(Comp), and 0.91 for IVP(OCF/M). Unit root tests strongly reject the null of non-stationarity for all IVP measures. Panel C reports summary statistics for the value spread and the business cycle variables. With the exception of VS(OCF/M), all variables exhibit first-order autocorrelations between 0.95 and 0.98, indicating much higher persistence than IVP.
Panel D shows that all three measures of IVP exhibit modest positive correlations with the business cycle variables, suggesting that some of the time variation in the implied value premium may be related to the business cycle. This supports the view that the underperformance of value strategies, and the time variation in IVP, may be linked to changing macroeconomic conditions. Figures 2–4 plot the time series of IVP(B/M), IVP(Comp), and IVP(OCF/M), with NBER recessions shaded. All three exhibit similar time variation and mean reversion: the implied value premium was high in January 2000, low in June 2007, and high again in March 2009 and March 2020.
Figure 2 plots the implied value premium based on B/M ratios, IVP(B/M), expressed in annualized percentages. The three lines surrounding the time-series correspond to the rolling median and the + or – 2-standard deviation bounds calculated using a rolling average up to that month, starting from January 1987. The shaded areas indicate the NBER recession periods.

Figure 3 plots the implied value premium based on the composite value rank, IVP(Comp), expressed in annualized percentages. The three lines surrounding the time-series correspond to the rolling median and the + or – 2-standard deviation bounds calculated using a rolling average up to that month, starting from January 1987. The shaded areas indicate the NBER recession periods.

Figure 4 plots the implied value premium based on OCF/M ratios, IVP(OCF/M), expressed in annualized percentages. The three lines surrounding the time-series correspond to the rolling median and the + or – 2-standard deviation bounds calculated using a rolling average up to that month, starting from January 1987. The shaded areas indicate the NBER recession periods.

IV. Predictability of Implied Value Premium
In our predictability tests, we conduct both univariate and multiple regression analyses involving the implied value premium. Our initial objective is to examine whether IVP predicts HML and to compare its predictive power, if any, to that of the value spread and the business cycle variables. We then turn to examining the sources of time variation in the ex post value premium, specifically, whether it arises from mispricing, risk, or both.
A. Univariate Regressions
We examine the univariate predictive power of IVP for HML based on the following multiperiod forecasting regression:
 $$ \frac{Y_{t,t+K}}{K}=a+b\times {X}_t+{u}_{t,t+K}, $$
where $ b $
is the slope coefficient,
$ b $
is the slope coefficient, $ K $
is the forecasting horizon in months or quarters, and
$ K $
is the forecasting horizon in months or quarters, and $ {u}_{t,t+K} $
is the regression residual.
$ {u}_{t,t+K} $
is the regression residual. $ {Y}_{t,t+K} $
is the cumulative return from
$ {Y}_{t,t+K} $
is the cumulative return from $ t $
to
$ t $
to $ t+K $
, which is computed based on either the Fama–French HML factor, HML(FF), or our constructed HML factors: HML(B/M), HML(Comp), or HML(OCF/M). If a stock is delisted, its cumulative return is computed using the corresponding value-weighted market return.
$ t+K $
, which is computed based on either the Fama–French HML factor, HML(FF), or our constructed HML factors: HML(B/M), HML(Comp), or HML(OCF/M). If a stock is delisted, its cumulative return is computed using the corresponding value-weighted market return. $ {X}_t $
represents the implied value premium, IVP(B/M), IVP(Comp), or IVP(OCF/M), the value spread, the business cycle variables, or the smoothed HML.Footnote
11
$ {X}_t $
represents the implied value premium, IVP(B/M), IVP(Comp), or IVP(OCF/M), the value spread, the business cycle variables, or the smoothed HML.Footnote
11
We estimate the forecasting regression for multiple horizons: $ K=6 $
,
$ K=6 $
, $ 12 $
,
$ 12 $
, $ 24 $
, and
$ 24 $
, and $ 36 $
months for monthly regressions, and
$ 36 $
months for monthly regressions, and $ K=2 $
,
$ K=2 $
, $ 4 $
,
$ 4 $
, $ 8 $
, and
$ 8 $
, and $ 12 $
quarters for quarterly regressions. We use the generalized method of moments (GMM) standard errors with the
$ 12 $
quarters for quarterly regressions. We use the generalized method of moments (GMM) standard errors with the $ K-1 $
Newey–West lag correction (Newey and West (Reference Newey and West1987)) to correct for both autocorrelation and heteroscedasticity. We refer to the resulting statistic as the
$ K-1 $
Newey–West lag correction (Newey and West (Reference Newey and West1987)) to correct for both autocorrelation and heteroscedasticity. We refer to the resulting statistic as the $ Z $
statistic. While GMM standard errors consistently estimate the asymptotic variance–covariance matrix, Richardson and Smith (Reference Richardson and Smith1991) show these standard errors are biased in small samples due to the sampling variation in estimating the autocovariances. To address this issue, we generate small sample distributions of the test statistics using Monte Carlo simulations (see Hodrick (Reference Hodrick1992), Nelson and Kim (Reference Nelson and Kim1993), Swaminathan (Reference Swaminathan1996) and Lee, Myers, and Swaminathan (Reference Lee, Myers and Swaminathan1999)). The Appendix describes the Monte Carlo simulation methodology.
$ Z $
statistic. While GMM standard errors consistently estimate the asymptotic variance–covariance matrix, Richardson and Smith (Reference Richardson and Smith1991) show these standard errors are biased in small samples due to the sampling variation in estimating the autocovariances. To address this issue, we generate small sample distributions of the test statistics using Monte Carlo simulations (see Hodrick (Reference Hodrick1992), Nelson and Kim (Reference Nelson and Kim1993), Swaminathan (Reference Swaminathan1996) and Lee, Myers, and Swaminathan (Reference Lee, Myers and Swaminathan1999)). The Appendix describes the Monte Carlo simulation methodology.
Since the forecasting regressions use overlapping data across horizons, the regression slopes are correlated. Richardson and Stock (Reference Richardson and Stock1989) propose a joint test based on the average slope coefficient to test the null hypothesis that the slopes across horizons are jointly zero. Following their methodology, we compute the average slope statistic as the arithmetic average of regression slope coefficients at different horizons, and conduct Monte Carlo simulations to assess its statistical significance.
If the implied value premium is a good proxy for the expected value premium, it should positively predict HML. Accordingly, the slope coefficients associated with IVP(B/M), IVP(Comp), and IVP(OCF/M) in (7) should be positive. We also expect a positive sign for the value spread, as Asness et al. (Reference Asness, Friedman, Krail and Liew2000) and Cohen et al. (Reference Cohen, Polk and Vuolteenaho2003) find that it positively predicts the ex post value premium. If the value premium is countercyclical, as argued in risk-based theories, then business cycle variables might also positively predict future realized value premium. Due to mean reversion in HML, we expect the smoothed HML to negatively predict future value premium. Therefore, a one-sided test of the null hypothesis is appropriate for all forecasting variables.
Table 2 presents univariate regression results for the implied value premium, IVP(B/M), IVP(Comp), and IVP(OCF/M), the value spread, VS(B/M), VS(Comp), and VS(OCF/M), the business cycle variables, and the smoothed HML. Panel A presents results for predicting HML(FF), while Panels B, C, and D present results for predicting HML(B/M), HML(Comp), and HML(OCF/M), respectively. We include Panels B–D to show that our results are robust to using value factors constructed from a smaller sample. In Panels B–D, we omit the business cycle variables and the smoothed HML results to save space and avoid repetition.

The regression results provide strong evidence that the implied value premium predicts future realized value premium. The slope coefficients of IVP(B/M), IVP(Comp), and IVP(OCF/M) are uniformly positive and statistically significant at the 1% level (based on simulated $ p $
values) at every horizon. Not surprisingly, the average slope statistics are also strongly significant at the 1% level or better. The adjusted
$ p $
values) at every horizon. Not surprisingly, the average slope statistics are also strongly significant at the 1% level or better. The adjusted $ R $
2s are also high: for example, in Panel A, the adjusted
$ R $
2s are also high: for example, in Panel A, the adjusted $ R $
2 of IVP(B/M) is 14% at the 12-month horizon and 36% at the 36-month horizon. Results in Panels B–D yield adjusted
$ R $
2 of IVP(B/M) is 14% at the 12-month horizon and 36% at the 36-month horizon. Results in Panels B–D yield adjusted $ R $
2s of similar magnitude.
$ R $
2s of similar magnitude.
The results are also economically significant. At the 12-month horizon, a 1-standard-deviation increase in IVP(B/M) ( $ 1.97\% $
) translates into an annualized increase of about
$ 1.97\% $
) translates into an annualized increase of about $ 5.36\% $
(
$ 5.36\% $
( $ 1.97\%\times 2.72 $
) for HML(FF) (Panel A) and
$ 1.97\%\times 2.72 $
) for HML(FF) (Panel A) and $ 5.87\% $
(
$ 5.87\% $
( $ 1.97\%\times 2.98 $
) for HML(B/M) (Panel B). Similarly, a 1-standard-deviation increase in IVP(Comp) (
$ 1.97\%\times 2.98 $
) for HML(B/M) (Panel B). Similarly, a 1-standard-deviation increase in IVP(Comp) ( $ 2.10\% $
) leads to an annualized increase of
$ 2.10\% $
) leads to an annualized increase of $ 5.71\% $
(
$ 5.71\% $
( $ 2.10\%\times 2.72 $
) for HML(Comp) (Panel C), while a 1-standard-deviation increase in IVP(OCF/M) (
$ 2.10\%\times 2.72 $
) for HML(Comp) (Panel C), while a 1-standard-deviation increase in IVP(OCF/M) ( $ 2.07\% $
) results in an annualized increase of
$ 2.07\% $
) results in an annualized increase of $ 5.24\% $
(
$ 5.24\% $
( $ 2.07\%\times 2.53 $
) for HML(OCF/M) (Panel D).
$ 2.07\%\times 2.53 $
) for HML(OCF/M) (Panel D).
Neither VS nor the business cycle variables reliably predict HML(FF), and the estimated slope coefficients on the business cycle variables display inconsistent signs. The smoothed HML exhibits the expected negative signs but is not statistically significant. Overall, the implied value premium remains the strongest predictor of the ex post value premium in univariate regressions.
B. IVP Predictability Controlling for Other Predictors
In this section, we examine whether the implied value premium continues to predict ex post value premium in regressions that include the value spread, the business cycle variables, and the smoothed HML. Table 3 presents the regression results. The dependent variable is HML(FF) in Panel A, HML(B/M) in Panel B, HML(Comp) in Panel C, and HML(OCF/M) in Panel D.

The results show that the implied value premium strongly predicts future realized value premium, even after controlling for the value spread, business cycle variables, and the smoothed HML. In all four panels, IVP has positive slope coefficients that are statistically significant at every horizon. The average slope statistics are all significant at the 1% level or better. By contrast, none of the other variables exhibit any consistent predictive power. The unavoidable conclusion is that the implied value premium is the most robust predictor of the ex post value premium.
The underperformance of value stocks since 2007 coincides with a period of historically low global interest rates, raising the possibility that value’s relative performance may depend on the interest rate environment. To test this, we examine the predictive power of IVP controlling for long-term and short-term real interest rates. Monthly inflation is computed as the rolling 12-month average of annualized changes in the Consumer Price Index for All Urban Consumers. The short-term real interest rate (Real Tbill) is calculated as the difference between the 3-month Treasury bill rate and inflation, and the long-term real interest rate (Real Yield) is the difference between the 10-year Treasury constant maturity rate and inflation. All data are obtained from FRED. Panel E of Table 3 shows that IVP remains a strong predictor of realized value premium, whereas neither interest rate is statistically significant.
In Table A1 in the Supplementary Material, we conduct a variety of robustness checks on our implied value premium measures and confirm that the predictive power of IVP for future realized value premium remains strong and significant. For instance, we demonstrate that our results are robust to using alternative steady-state earnings growth rates and plowback rates in constructing firm-level ICCs. Our IVP measures are based on value and growth portfolios formed monthly using the most recent data (e.g., B/M, C/P). Additionally, we show that our findings hold when using IVP constructed from value and growth portfolios following Fama and French (Reference Fama and French1993), where portfolios are formed annually instead of monthly. Furthermore, we confirm that IVP derived from small-cap firms predicts the small-cap value premium, while IVP from large-cap firms predicts the large-cap value premium. Finally, we demonstrate that time variations in relative analyst forecast bias between value and growth stocks do not account for our findings.
C. Sources of Predictability
In this section, we examine the sources of the strong predictive power of the implied value premium (IVP). Recent studies by Hou et al. (Reference Hou, Xue and Zhang2015) and Zhang (Reference Zhang2017) emphasize the close link between the investment premium and the value premium. We first analyze this relationship through the lens of the investment CAPM. Second, because earnings announcements convey important information about firms’ fundamental values, we investigate whether IVP predicts the cumulative return differences between value and growth stocks around these announcements.
1. IVP and the Investment Premium
Zhang (Reference Zhang2017) shows that within the Investment CAPM framework, the value premium can be explained by the investment premium, defined as the return spread between low- and high-investment firms. The investment premium arises because, holding profitability constant, firms with lower costs of capital face higher marginal q, invest more, and subsequently earn lower average returns. In the same framework, the value premium arises because value firms have lower marginal q, fewer growth opportunities, and invest less, which leads them to earn higher expected returns than growth firms. Thus, the value premium originates from firm investment behavior rather than mispricing. In this subsection, we examine whether the implied value premium (IVP) predicts the investment premium, proxied by the investment factor from the q-factor model.
We obtain the investment factor data from the q-factor website (https://global-q.org/factors.html). Table 4 reports summary statistics and correlations for the investment premium. Overall, the investment premium is strongly positive, with an average annualized return of 3.68% over the full sample period from January 1977 to December 2023. Similar to HML, the investment premium has declined in the post-2007 period, falling from 5.06% in the early sample (1977–2007) to just 0.99% in the later period (2008–2023). The fraction of months with positive investment premium also declined, from 59.14% to 45.31%. Panel B of Table 4 further shows that the investment factor is highly correlated with realized value premium, with the correlations between various HML measures and the investment factor ranging from 0.43 to 0.64. The strong positive correlation suggests that value and investment premia may be driven by similar sources of return variation. To investigate this link more directly, we test whether the implied value premium predicts the investment factor, with results reported in Table 5.


Panel A of Table 5 shows that all measures of IVP strongly predict the investment premium in univariate regressions. The slope coefficients are statistically significant at the 1% or 5% level across forecasting horizons, with adjusted R $ {}^2 $
values ranging from 9% to 16% at the 12-month horizon. The economic significance is also substantial: at the 12-month horizon, a 1-standard-deviation increase in IVP(OCF/M) corresponds to a 3.44% (
$ {}^2 $
values ranging from 9% to 16% at the 12-month horizon. The economic significance is also substantial: at the 12-month horizon, a 1-standard-deviation increase in IVP(OCF/M) corresponds to a 3.44% ( $ 2.07\%\times 1.66 $
) increase in the investment premium. Panel B further shows that all three IVP measures remain strong predictors after controlling for value spreads, business cycle variables, and a smoothed investment factor measured as the past 3-year average of the monthly investment premium. These results suggest that the value and investment premia share common sources of time variation, consistent with the Investment CAPM interpretation of the value premium.
$ 2.07\%\times 1.66 $
) increase in the investment premium. Panel B further shows that all three IVP measures remain strong predictors after controlling for value spreads, business cycle variables, and a smoothed investment factor measured as the past 3-year average of the monthly investment premium. These results suggest that the value and investment premia share common sources of time variation, consistent with the Investment CAPM interpretation of the value premium.
2. Predicting Price Reactions Around Quarterly Earnings Announcements
La Porta et al. (Reference La Porta, Lakonishok, Shleifer and Vishny1997) find that value stocks earn positive abnormal returns, while growth stocks earn negative abnormal returns in the days surrounding their future quarterly earnings announcements. We extend this test to a time-series context. For each stock in each quarter, we compute cumulative (market-adjusted) abnormal returns (CAR) from day −1 to +1 around its quarterly earnings announcement. We then average the CAR over the next $ K $
quarters (where
$ K $
quarters (where $ K=\mathrm{2,4,8,12} $
). CAR(HML) is calculated by subtracting the average CAR of the growth portfolio, CAR(L), from that of the value portfolio, CAR(H). This difference captures the relative price reaction to earnings surprises between value and growth stocks.
$ K=\mathrm{2,4,8,12} $
). CAR(HML) is calculated by subtracting the average CAR of the growth portfolio, CAR(L), from that of the value portfolio, CAR(H). This difference captures the relative price reaction to earnings surprises between value and growth stocks.
We consider four measures of CAR(HML) corresponding to the four measures of HML discussed earlier: i) CAR(HML(FF)) for the Fama and French value and growth portfolios, ii) CAR(HML(B/M)) for value and growth portfolios formed using B/M ratios within our sample, iii) CAR(HML(Comp)) for portfolios formed using the composite value rank, and iv) CAR(HML(OCF/M)) for portfolios formed using OCF/M. Quarterly earnings announcement dates are obtained from the quarterly COMPUSTAT file, while daily stock and market returns are obtained from the daily CRSP files. We use the WRDS value-weighted market return with dividends as the market return. Quarterly values of the implied value premium and other forecasting variables are as of the end of each quarter. Unreported results are similar when quarterly values are computed as the average of monthly observations within the quarter. The sample period spans 1977:Q1 to 2023:Q4.
To save space, the univariate regression results are reported in Table A2 in the Supplementary Material. Table 6 presents regression results controlling for other forecasting variables. The results show that the implied value premium strongly predicts CAR(HML). For all measures of IVP, the coefficients are statistically significant at every horizon, with the average slope significant at the 1% level.

What explains the CAR results? Under the mispricing scenario, a high IVP, indicating that value stocks are more undervalued relative to growth stocks due to investors’ pessimistic expectations about future profitability, should predict a high CAR(HML), reflecting larger positive earnings surprises for value stocks than for growth stocks. Thus, the finding that IVP positively predicts future CAR(HML) is consistent with this mispricing interpretation. Because CAR measures returns over only a few days, neither risk nor the price of risk is likely to change meaningfully over this period. Consequently, these results are difficult to reconcile with rational asset pricing models, though we cannot entirely rule it out.
The investment CAPM predicts firm characteristics should explain the cross section of average stock returns and is able to explain a number of anomalies including accruals (Wu, Zhang, and Zhang (Reference Wu, Zhang and Zhang2010)), price and earnings momentum (Liu and Zhang (Reference Liu and Zhang2014)), and others (Lin and Zhang (Reference Lin and Zhang2013), Zhang (Reference Zhang2017)). In this framework, owning a stock is economically equivalent to owning the firm’s investment, so stock returns theoretically equal fundamental returns. A positive (negative) earnings surprise implies a higher (lower) fundamental return and, hence, a higher (lower) stock return, providing a direct profitability channel from earnings surprises to stock returns. Our results show that a widening IVP is associated with higher CAR(HML), which is consistent with value stocks experiencing more positive earnings surprises than growth stocks. Why this pattern arises, and whether rational asset pricing, including both the Investment CAPM and the Consumption CAPM, can account for it, remains an open question for future research.
D. Out-of-Sample Analysis
So far, we have shown strong in-sample evidence that the implied value premium is a powerful predictor of the ex post value premium. In this section, we evaluate its out-of-sample predictive power, an issue that has received considerable attention in the literature (e.g., Spiegel (Reference Spiegel2008), Welch and Goyal (Reference Welch and Goyal2008)).
1. Econometric Specification and Forecast Evaluation
Consider the following predictive regression:
 $$ {r}_{t+1}={\alpha}_i+{\beta}_i{x}_{i,t}+{\varepsilon}_{i,t+1}, $$
where $ {r}_{t+1} $
is HML(FF), HML(Comp), HML(OCF/M), or the investment premium (InvPrem) at month
$ {r}_{t+1} $
is HML(FF), HML(Comp), HML(OCF/M), or the investment premium (InvPrem) at month $ t+1 $
,
$ t+1 $
, $ {x}_{i,t} $
is the
$ {x}_{i,t} $
is the $ i $
th monthly predictive variable, which includes the implied value premium IVP(B/M), IVP(Comp), or IVP(OCF/M), as well as other variables: the value spread VS(B/M), VS(Comp), or VS(OCF/M); the term spread Term; the default spread Default; and the smoothed factor (smoothed HML or smoothed InvPrem).
$ i $
th monthly predictive variable, which includes the implied value premium IVP(B/M), IVP(Comp), or IVP(OCF/M), as well as other variables: the value spread VS(B/M), VS(Comp), or VS(OCF/M); the term spread Term; the default spread Default; and the smoothed factor (smoothed HML or smoothed InvPrem). $ {\varepsilon}_{i,t+1} $
is the error term.
$ {\varepsilon}_{i,t+1} $
is the error term.
Following Welch and Goyal (Reference Welch and Goyal2008), we use a recursive method to estimate (8) and generate out-of-sample forecasts of the value premium. A similar procedure is applied to forecasting the investment premium. Specifically, we divide the full sample $ T $
into two periods: an estimation period with the first
$ T $
into two periods: an estimation period with the first $ m $
observations and an out-of-sample forecast period with the remaining
$ m $
observations and an out-of-sample forecast period with the remaining $ q=T-m $
observations.
$ q=T-m $
observations.
We begin by using the first $ m $
observations to estimate (8) and obtain the OLS estimators
$ m $
observations to estimate (8) and obtain the OLS estimators $ {\hat{\alpha}}_{i,m} $
and
$ {\hat{\alpha}}_{i,m} $
and $ {\hat{\beta}}_{i,m} $
, which gives us the first out-of-sample forecast:
$ {\hat{\beta}}_{i,m} $
, which gives us the first out-of-sample forecast:
 $$ {\hat{r}}_{i,m+1}={\hat{\alpha}}_{i,m}+{\hat{\beta}}_{i,m}{x}_{i,m}. $$
We then re-estimate the model using $ m+1 $
observations to obtain
$ m+1 $
observations to obtain $ {\hat{\alpha}}_{i,m+1} $
and
$ {\hat{\alpha}}_{i,m+1} $
and $ {\hat{\beta}}_{i,m+1} $
to generate the second out-of-sample forecast:
$ {\hat{\beta}}_{i,m+1} $
to generate the second out-of-sample forecast:
 $$ {\hat{r}}_{i,m+2}={\hat{\alpha}}_{i,m+1}+{\hat{\beta}}_{i,m+1}{x}_{i,m+1}. $$
Proceeding in this manner through the end of the sample, for each predictive variable $ {x}_i $
, we obtain a time series of predicted value premium
$ {x}_i $
, we obtain a time series of predicted value premium $ {\left\{{\hat{r}}_{i,t+1}\right\}}_{t=m}^{T-1} $
. We use the historical average realized value premium returns
$ {\left\{{\hat{r}}_{i,t+1}\right\}}_{t=m}^{T-1} $
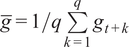
. We use the historical average realized value premium returns $ {\overline{r}}_{t+1}={\sum}_{j=1}^t{r}_j $
as a benchmark forecasting model (e.g., Campbell and Thompson (Reference Campbell and Thompson2008), Welch and Goyal (Reference Welch and Goyal2008), and Rapach, Strauss, and Zhou (Reference Rapach, Strauss and Zhou2010)). To compare the performance of different predictors, we use the out-of-sample
$ {\overline{r}}_{t+1}={\sum}_{j=1}^t{r}_j $
as a benchmark forecasting model (e.g., Campbell and Thompson (Reference Campbell and Thompson2008), Welch and Goyal (Reference Welch and Goyal2008), and Rapach, Strauss, and Zhou (Reference Rapach, Strauss and Zhou2010)). To compare the performance of different predictors, we use the out-of-sample $ {R}^2 $
statistic,
$ {R}^2 $
statistic, $ {R}_{os}^2 $
, which measures the reduction in mean squared error (MSPE) achieved by using the predictive regression (8) with a given predictor, relative to the historical average forecast:
$ {R}_{os}^2 $
, which measures the reduction in mean squared error (MSPE) achieved by using the predictive regression (8) with a given predictor, relative to the historical average forecast:
 $$ {R}_{os}^2=1-\frac{\sum_{k=1}^q{\left({r}_{m+k}-{\hat{r}}_{i,m+k}\right)}^2}{\sum_{k=1}^q{\left({r}_{m+k}-{\overline{r}}_{m+k}\right)}^2}. $$
A positive $ {R}_{os}^2 $
indicates that the predictive variable improves forecast accuracy relative to the historical average. A predictive variable that has a higher
$ {R}_{os}^2 $
indicates that the predictive variable improves forecast accuracy relative to the historical average. A predictive variable that has a higher $ {R}_{os}^2 $
performs better in the out-of-sample forecasting test. We formally test the null of
$ {R}_{os}^2 $
performs better in the out-of-sample forecasting test. We formally test the null of $ {R}_{os}^2\le 0 $
against the alternative of
$ {R}_{os}^2\le 0 $
against the alternative of $ {R}_{os}^2>0 $
by using the adjusted MSPE statistic of Clark and West (Reference Clark and West2007).Footnote
12
$ {R}_{os}^2>0 $
by using the adjusted MSPE statistic of Clark and West (Reference Clark and West2007).Footnote
12
Finally, we explore the information content of IVP relative to other forecasting variables by conducting a forecast encompassing test developed by Harvey, Leybourne, and Newbold (Reference Harvey, Leybourne and Newbold1998) (see also Rapach et al. (Reference Rapach, Strauss and Zhou2010)). The null hypothesis is that the model $ i $
forecast encompasses the model
$ i $
forecast encompasses the model $ j $
forecast against the one-sided alternative that the model
$ j $
forecast against the one-sided alternative that the model $ i $
forecast does not encompass the model
$ i $
forecast does not encompass the model $ j $
forecast.Footnote
13
$ j $
forecast.Footnote
13
2. Out-of-Sample Forecasting Results
We focus on the forecast period from December 2000 to December 2023, which represents roughly half of the full sample. In Table A3 in the Supplementary Material, we also consider an alternative forecast period from December 1993 to December 2023, and the results remain robust under this specification. The 12-month moving averages of IVP(B/M), IVP(Comp), and IVP(OCF/M) are used as out-of-sample predictors. We examine four forecasting scenarios: i) $ Y= HML(FF) $
,
$ Y= HML(FF) $
, $ IVP= IVP\left(B/M\right) $
,
$ IVP= IVP\left(B/M\right) $
, $ VS= VS\left(B/M\right) $
; ii)
$ VS= VS\left(B/M\right) $
; ii) $ Y= HML(Comp) $
,
$ Y= HML(Comp) $
, $ IVP= IVP(Comp) $
,
$ IVP= IVP(Comp) $
, $ VS= VS(Comp) $
; iii)
$ VS= VS(Comp) $
; iii) $ Y= HML\left( OCF/M\right) $
,
$ Y= HML\left( OCF/M\right) $
, $ IVP= IVP\left( OCF/M\right) $
,
$ IVP= IVP\left( OCF/M\right) $
, $ VS= VS\left( OCF/M\right) $
; and iv)
$ VS= VS\left( OCF/M\right) $
; and iv) $ Y= InvPrem $
,
$ Y= InvPrem $
, $ IVP= IVP\left( OCF/M\right) $
,
$ IVP= IVP\left( OCF/M\right) $
, $ VS= VS\left( OCF/M\right) $
.
$ VS= VS\left( OCF/M\right) $
.
Panel A of Table 7 reports the $ {R}_{os}^2 $
test results. We find that all three implied value premium measures are the strongest out-of-sample predictors of HML. Specifically, when predicting HML(FF), IVP(B/M) yields an
$ {R}_{os}^2 $
test results. We find that all three implied value premium measures are the strongest out-of-sample predictors of HML. Specifically, when predicting HML(FF), IVP(B/M) yields an $ {R}_{os}^2 $
of 2.11%; when predicting HML(Comp), IVP(Comp) yields 2.85%; and when predicting HML(OCF/M), IVP(OCF/M) yields 2.27%. In addition, IVP(OCF/M) achieves an
$ {R}_{os}^2 $
of 2.11%; when predicting HML(Comp), IVP(Comp) yields 2.85%; and when predicting HML(OCF/M), IVP(OCF/M) yields 2.27%. In addition, IVP(OCF/M) achieves an $ {R}_{os}^2 $
of 2.58% when predicting the investment premium. All estimates are statistically significant at the 1% level. Campbell and Thompson (Reference Campbell and Thompson2008) argue that for monthly data, even
$ {R}_{os}^2 $
of 2.58% when predicting the investment premium. All estimates are statistically significant at the 1% level. Campbell and Thompson (Reference Campbell and Thompson2008) argue that for monthly data, even $ {R}_{os}^2 $
values as low as 0.5% can indicate an economically meaningful degree of return predictability for a mean–variance investor, which provides a simple assessment of predictability in practice. Against this benchmark, the out-of-sample forecasting performance of the implied value premium is quite impressive. Among the other predictors, the term spread and default spread produce positive
$ {R}_{os}^2 $
values as low as 0.5% can indicate an economically meaningful degree of return predictability for a mean–variance investor, which provides a simple assessment of predictability in practice. Against this benchmark, the out-of-sample forecasting performance of the implied value premium is quite impressive. Among the other predictors, the term spread and default spread produce positive $ {R}_{os}^2 $
values, but neither is statistically significant. All remaining variables generate negative out-of-sample
$ {R}_{os}^2 $
values, but neither is statistically significant. All remaining variables generate negative out-of-sample $ {R}^2 $
values, indicating that they fail to outperform the naïve historical average benchmark.
$ {R}^2 $
values, indicating that they fail to outperform the naïve historical average benchmark.

We further examine whether IVP(B/M), IVP(Comp) and IVP(OCF/M) contain distinct information relative to existing variables such as the value spread. The forecast encompassing test results of Harvey et al. (Reference Harvey, Leybourne and Newbold1998), presented in Panel B of Table 7, provide strong support for this view. We strongly reject the null hypothesis that IVP(B/M), IVP(Comp) or IVP(OCF/M) is encompassed by any other predictor at the 1% (or 5%) level. In contrast, we cannot reject the null that IVP(B/M), IVP(Comp), or IVP(OCF/M) encompasses the other variables, indicating that IVP contains incremental information not captured by existing predictors.
V. Conclusion
This article introduces the implied value premium (IVP) as a new measure of expected value premium, estimated using the ICC methodology which carefully controls for differences in earnings growth rates and payout ratios between value and growth stocks. We find that IVP is the strongest predictor of the ex post value premium from 1977 to 2023, substantially outperforming measures such as the value spread, term spread, default spread, and the smoothed HML, both in sample and out of sample. We also find that IVP significantly predicts the investment premium, consistent with the Investment CAPM.
Additional tests provide strong evidence for a mispricing-based explanation. In particular, IVP predicts future differences in cumulative abnormal returns around earnings announcements between value and growth stocks, an effect unlikely to be driven by changes in risk or the price of risk, given the short duration of the announcement window. These results suggest that time-varying relative mispricing between value and growth stocks might play a role in IVP’s ability to predict ex post value premium.
This predictable time variation has important implications for style timing. It suggests that investors should allocate more to value stocks when they are relatively cheap, and scale back when they are not. Our results, both in sample and out of sample, indicate that the implied value premium may be a more effective tool for timing the value/growth trade than the widely used value spread.
Returning to the question posed at the outset, whether the post-2007 underperformance of value reflects a permanent disappearance of the value premium or a predictable time variation, our findings point to the latter. The value premium may not have vanished; rather, its recent underperformance may be part of a predictable time variation driven by shifting expectations and market conditions: patterns that can potentially be anticipated using forward-looking measures like IVP. That said, in an era marked by rapid advances in AI, technological disruption, and intangible asset growth, traditional valuation ratios may no longer fully capture intrinsic value. Going forward, more sophisticated tools, such as implied cost of capital models and real-option-based approaches, may be required to uncover the drivers of value. We leave the exploration of these broader implications to future research.
Appendix. Monte Carlo Simulation Methodology
For each regression, we conduct a Monte Carlo simulation using a VAR procedure to assess the statistical significance of relevant statistics. We illustrate our procedure for the univariate regression using IVP(B/M) to predict HML(FF). The simulation method is conducted in the same way for other regressions. Define $ {Z}_t={\left( HML{(FF)}_t, IVP{\left(B/M\right)}_t\right)}^{\prime } $
, where
$ {Z}_t={\left( HML{(FF)}_t, IVP{\left(B/M\right)}_t\right)}^{\prime } $
, where $ {Z}_t $
is a
$ {Z}_t $
is a $ 2\times 1 $
column vector. We first fit a first-order VAR to
$ 2\times 1 $
column vector. We first fit a first-order VAR to $ {Z}_t $
using the following specification:
$ {Z}_t $
using the following specification:
 $$ {Z}_{t+1}={A}_0+{A}_1{Z}_t+{u}_{t+1}, $$
where $ {A}_0 $
is a
$ {A}_0 $
is a $ 2\times 1 $
vector of intercepts and
$ 2\times 1 $
vector of intercepts and $ {A}_1 $
is a
$ {A}_1 $
is a $ 2\times 2 $
matrix of VAR coefficients, and
$ 2\times 2 $
matrix of VAR coefficients, and $ {u}_{t+1} $
is a
$ {u}_{t+1} $
is a $ 2\times 1 $
vector of VAR residuals. The point estimates in (A.1) are used to generate artificial data for the Monte Carlo simulations. We impose the null hypothesis of no predictability on
$ 2\times 1 $
vector of VAR residuals. The point estimates in (A.1) are used to generate artificial data for the Monte Carlo simulations. We impose the null hypothesis of no predictability on $ HML{(FF)}_t $
in the VAR. This is done by setting the slope coefficients on the explanatory variables to zero, and by setting the intercept in the equation of
$ HML{(FF)}_t $
in the VAR. This is done by setting the slope coefficients on the explanatory variables to zero, and by setting the intercept in the equation of $ HML{(FF)}_t $
to be its unconditional mean. We use the fitted VAR under the null hypothesis of no predictability to generate
$ HML{(FF)}_t $
to be its unconditional mean. We use the fitted VAR under the null hypothesis of no predictability to generate $ T $
observations of the state variable vector,
$ T $
observations of the state variable vector, $ \left( HML{(FF)}_t, IVP{\left(B/M\right)}_t\right) $
. The initial observation for this vector is drawn from a multivariate normal distribution with mean equal to the historical mean and variance–covariance matrix equal to the historical estimated variance–covariance matrix of the vector of state variables. Once the VAR is initiated, shocks for subsequent observations are generated by randomizing (sampling without replacement) among the actual VAR residuals. The VAR residuals for
$ \left( HML{(FF)}_t, IVP{\left(B/M\right)}_t\right) $
. The initial observation for this vector is drawn from a multivariate normal distribution with mean equal to the historical mean and variance–covariance matrix equal to the historical estimated variance–covariance matrix of the vector of state variables. Once the VAR is initiated, shocks for subsequent observations are generated by randomizing (sampling without replacement) among the actual VAR residuals. The VAR residuals for $ HML{(FF)}_t $
are scaled to match its historical standard errors. These artificial data are then used to run multivariate regressions and generate regression statistics. This process is repeated 1,000 times to obtain empirical distributions of regression statistics. The MATLAB numerical recipe mvnrnd is used to generate standard normal random variables.
$ HML{(FF)}_t $
are scaled to match its historical standard errors. These artificial data are then used to run multivariate regressions and generate regression statistics. This process is repeated 1,000 times to obtain empirical distributions of regression statistics. The MATLAB numerical recipe mvnrnd is used to generate standard normal random variables.
Supplementary Material
To view supplementary material for this article, please visit http://doi.org/10.1017/S0022109026102609.







 Open access

