

The prevalence of childhood overweight and obesity has increased rapidly worldwide over the last decades and the rates are significantly higher in Southern compared with Northern European countries( Reference Brug, van Stralen and Chinapaw 1 – Reference Lobstein and Frelut 3 ). In Greece, 29·9 and 11·2 % of children are overweight and obese, respectively( Reference Moschonis, Kalliora and Costarelli 4 ).
Childhood obesity has been associated with several health problems such as hypertension, dyslipidaemia and insulin resistance, which track into adulthood( Reference Abrams and Levitt Katz 5 ). Several risk factors that increase childhood obesity have been separately identified, including parental anthropometric measures, lifestyle factors (i.e. dietary habits and physical activity levels) and sociodemographic indices( Reference Daniels, Arnett and Eckel 6 ). Identification of these factors is very significant in order to improve our knowledge on the aetiology and to shape any future prevention programmes. However, childhood obesity has a multifactorial aetiology, which accentuates the need for studies highlighting the leading factors associated with childhood obesity within the sociodemographic, anthropometric and lifestyle characteristics of the family. Previously, our team identified several perinatal and parental characteristics as important risk factors for children’s elevated BMI( Reference Birbilis, Moschonis and Mougios 7 ). However, it is already reported that total and especially visceral fat mass is a more accurate indicator not only of childhood obesity but also for cardiometabolic risk than BMI( Reference Javed, Jumean and Murad 8 ), rendering investigation of the determinants of elevated total and regional fat mass in children essential.
Thus, the aim of the current study was to examine the possible independent associations of perinatal, sociodemographic and lifestyle factors with childhood obesity estimated by total and visceral body fat.
Materials and methods
Sampling
The Healthy Growth Study is a cross-sectional epidemiological study initiated in May 2007. Approval to conduct the study was granted by the Greek Ministry of National Education and the Ethics Committee of the Harokopio University of Athens. The study population comprised schoolchildren attending the 5th and 6th grades of primary schools located in municipalities within the counties of Attica, Etoloakarnania, Thessaloniki and Iraklion. The sampling of schools was random, multistage and stratified by parental educational level and by the total population of students attending schools within the municipalities. The exact sampling methodology is described in detail elsewhere( Reference Moschonis, Tanagra and Vandorou 9 ). An appropriate number of schools was randomly selected from each of these municipalities, in proportion to the population of schoolchildren registered in the 5th and 6th grades, on the basis of data obtained from the Greek Child Institute. All seventy-seven primary schools that were invited to participate in the present study responded positively. More specifically, an extended letter explaining the aims of the present study and a consent form for taking full measurements were provided to all parents or guardians having a child in the 5th and 6th grade in these schools. Parents who agreed to the participation of their children in the study had to sign the consent form and provide their contact details. Signed parental consent forms were collected for 2655 out of 4145 children (response rate 64·1 %). Complete socio-economic, demographic and perinatal data (collected by the parents) and anthropometric data (measured in children) were collected for 2294 of the 2655 children (49·7 % boys and 50·3 % girls) whose parents had signed the consent forms (participation rate 86·4 %).
Anthropometric measurements and definition of overweight and obesity
Children underwent a physical examination by two trained members of the research team. The protocol and equipment used were the same in all schools. Weight was measured to the nearest 10 g using a digital scale (Seca Alpha, model 770; Seca, Hamburg, Germany). Pupils were weighed without shoes in the minimum clothing possible. Height was measured to the nearest 0·1 cm using a commercial stadiometer (Leicester Height Measure; Invicta Plastics, Oadby, UK) with the pupil standing barefoot, keeping shoulders in a relaxed position, arms hanging freely and head in the Frankfort horizontal plane. Weight and height were used to calculate BMI. The International Obesity Task Force cut-off points( 10 ) were used to categorize participants as normal weight, overweight or obese.
Assessment of percentage body fat and visceral fat mass
Bioelectrical impedance analysis was used for the assessment of percentage body fat (Akkern BIA 101; Akkern Srl, Florence, Italy) and for abdominal-visceral fat mass (Viscan AB-140; Tanita, Kowloon, Hong Kong). In abdominal bioelectrical impedance analysis, an electric current is passed between the regions near the umbilicus and spinal cord at the umbilicus level, and the voltage generated in the lateral abdomen is recorded. Because the equipotential line that passes through visceral fat appears on the lateral abdominal surface, the amount of visceral fat can be estimated by measurement of the voltage generated at this location using a regression equation determined by computed tomography( Reference Ryo, Maeda and Onda 11 ). Participants were instructed to abstain from any food or liquid intake and from any intensive exercise for 4 h before measurement. They were also instructed not to wear any metal object during measurement. The assessments took place with the pupils lying on a non-conductive surface at ambient room temperature. Percentage body fat was calculated from the resistance and reactance values using valid equations derived from a similar pre-adolescent population. The equations used for this calculation were the following( Reference Nielsen, Dencker and Ward 12 ).
Boys:
 $$\eqalignno{ {\rm FFM}{\equals}& {\minus}7 \!\cdot \!13(\!\pm\!2\!\cdot\!79){\plus}{\rm Ht}^{2} /{\rm R}{\times}0\!\cdot\!66(\!\pm\!0\!\cdot\!07) \cr &{\plus}{\rm Xc}{\times}0\!\cdot\!07(\!\pm\!0\!\cdot\!02) {\plus}{\rm Ht}{\times}0\!\cdot\!06(\!\pm\!0\!\cdot\!03) \cr &{\plus}{\rm Wt}{\times}0\!\cdot\!06(\!\pm\!0\!\cdot\!03). $$
Girls:
 $$\eqalignno{ {\rm FFM}{\equals}& {\minus}0\!\cdot\!86(\!\pm\!3\!\cdot\!40){\plus}{\rm Ht}^{2} /{\rm R}{\times}0\!\cdot\!46(\!\pm\!0\!\cdot\!07) \cr &{\plus}{\rm Xc}{\times}0\!\cdot\!04(\!\pm\!0\!\cdot\!02) {\plus}{\rm Ht}{\times}0\!\cdot\!05(\!\pm\!0\!\cdot\!03) \cr &{\plus}{\rm Wt}{\times}0\!\cdot\!14(\!\pm\!0\!\cdot\!04). $$
In the above, FFM is fat-free mass, Ht is height, R is resistance, Xc is reactance and Wt is weight. We first calculated fat free mass and, from the result of these equations, we calculated fat mass levels. Percentage trunk fat mass and visceral fat rating (rating scale from 1 to 59 units, with 0·5 increment) were read directly from the instrument. In the absence of valid and widely used thresholds for defining total and central adiposity in children, the third (highest) tertile of total (i.e. 24·53–34·02) and visceral (i.e. 3·00–5·13) fat mass levels were used as the key outcomes in the present study in order to identify the potential risk factors associated with these specific outcomes. As there were only two Tanita Viscan devices available, data on trunk-visceral fat mass were collected for a representative sub-sample of 1500 children. Taking missing values into consideration, the current study presents results on 1228 children having full total and visceral fat mass data, as well as anthropometric, dietary, physical activity, physical examination, socio-economic and perinatal data.
Family sociodemographic, parental weight status and perinatal data obtained by parents and birth certificates
Sociodemographic data, parental weight and height, and perinatal data were either reported by the parents or taken from the children’s birth certificates and medical records that the parents were instructed to bring along during scheduled interviews. If parents were unable to attend (approximately 5 % of the total sample), data were collected via telephone interviews and parents reported all necessary data using the birth certificates of their children. All interviews were conducted with the use of a standardized questionnaire by members of the research team who had been rigorously trained to minimize the interviewer effect. The information collected included: (i) father’s and mother’s age, which was grouped using tertiles; (ii) self-reported parental weight and height, from which BMI was calculated and used to categorize into underweight/normal weight, overweight and obese on the basis of the International Obesity Task Force cut-off points; (iii) parental years of education, which were stratified into <9 years (9 years being the duration of compulsory education in Greece that leads to a junior high school degree), 9–12 years (corresponds to having a high school degree), 12–16 years (corresponds to having a college or a university degree); and >16 years (corresponds to having a Master’s or a PhD diploma)); (iv) parental and child nationality; (v) family type based on parental marital status (two-parent families, one-parent families); (vi) mean annual family income over the past 3 years, mother’s current employment status and number of cars owned by the family; and (vii) household size (m2/family member). Mothers were asked to recall the following perinatal information: (i) type of conception (i.e. natural conception or in vitro fertilization); (ii) medical history of gestational diabetes mellitus and high blood pressure; (iii) smoking during pregnancy; (iv) weight before pregnancy and weight gained during pregnancy, based on the classification recommended by the US Institute of Medicine( 13 ); and (v) parity.
The following information was taken from each child’s birth certificate and medical record: (i) birth date, this was used for the estimation of the exact age of each child; (ii) birth weight and gestational age for the classification into small for gestational age (<10th percentile), appropriate for gestational age (10th to 89th percentile) and large for gestational age (≥90th percentile); (iii) change in weight-for-length from birth to 6 months of age for the classification into poor (Z-score change<−1), average (Z-score change=−1 to +1) and rapid (Z-score change > +1) weight gain during infancy; (vi) type of delivery (normal v. caesarean); and (v) feeding pattern from birth to 6 months of age (i.e. breast-feeding, age at which formula was introduced and solid food initiation).
Dietary intake assessment
Dietary intake data were obtained by trained dietitians and nutritionists via morning interviews with the children at the school site for two consecutive weekdays and one weekend day, using the 24 h recall technique. Specifically, all study participants were asked to describe the types and amounts of foods and beverages consumed during the previous day, provided that it was a usual day according to the participant’s perception. To improve the accuracy of food description, standard household measures (cups, tablespoons, etc.) and food models were used to define amounts. At the end of each interview, the interviewers, who were dietitians rigorously trained to minimize the interviewer effect, reviewed the collected data with the respondent in order to clarify entries, servings and possible forgotten foods. Food intake data were analysed using the Nutritionist V diet analysis software (version 2.1, 1999; First Databank, San Bruno, CA, USA), which was extensively amended to include traditional Greek recipes( Reference Trichopoulou 14 ). Furthermore, the database was updated with nutritional information on processed foods provided by independent research institutes, food companies and fast-food chains. Daily energy intake was expressed as a percentage of estimated energy requirement.
Breakfast consumption habits
Using data from the 24 h recalls, the portions of each food group were distributed to meals during the day (i.e. breakfast, morning snack, lunch, afternoon snack, dinner, before-bed snack). We considered as breakfast the first things the participant ate and/or drank within 2 h after getting up in the morning. This could be at home, on the way to school or just before entering school. During the weekend, breakfast was considered as anything the participant drank and/or ate before 11.00 hours. Participants were considered as regular breakfast consumers based on whether they had breakfast on all three typical days as recorded from the 24 h recalls, whereas participants who did not have any portion of food and/or drink at breakfast on at least one out of three days were considered as irregular breakfast consumers( Reference O’Neil, Byrd-Bredbenner and Hayes 15 ).
Physical activity assessment
Step count
To assess physical activity, study participants were provided with and instructed to wear a waist-mounted pedometer (Yamax SW-200 Digiwalker; Yamax Corporation Corporation, Tokyo, Japan) for 1 week (i.e. from Monday to Sunday). A number of approximately 200 pedometers were provided to the children in rotation. The pedometer was positioned in accordance with the manufacturer’s instructions on the right waistband, vertically aligned with the patella. The pedometer used in the present study displayed the cumulative number of steps from the time it was worn in the morning until the time it was removed at bedtime. Participants were provided with a diary template and instructed to record the total number of daily steps displayed by the pedometer at bedtime and then zero the pedometer. Participants were also instructed to take off the pedometers when bathing or swimming and to record these activities in the diary. Finally, in cases where some children or adolescents forgot to wear the pedometer for a whole day, the relevant cells in the diary were left blank and the calculation for the mean daily number of steps was made using the appropriate number of days. For example, if a child had recorded steps for 7 d, the mean daily number of steps was calculated by dividing the sum of steps recorded for the 7 d by 7. If a child had recorded steps for 6 d, the mean daily number of steps was calculated by dividing the sum of steps recorded for the 6 d by 6.
Screen time
Children’s screen time (i.e. time spent viewing television (TV)/videos and playing computer games) was assessed by children’s report with regard to a usual weekday and a usual weekend. The mean daily screen time was calculated using the following equation:
 $$\eqalignno{\rm Daily\,screen\,time {\equals}&[(\rm weekday\,screen\,time{\times}2\!\cdot\!5) \cr &{\plus}\rm weekend\,screen\,time]/7.$$
Statistical analysis
Gender differences were tested using either Student’s t test for continuous variables or the χ 2 test and the two-sample Z-test for proportions for categorical variables. Furthermore, in order to examine the associations of perinatal, sociodemographic and behavioural indices with total and visceral fat mass levels, univariate logistic regression analyses were performed. In order to test whether the significant associations observed at a univariate level were independent, multivariate logistic regression analyses were also performed. Crude and adjusted odds ratios with 95 % confidence intervals were computed from the univariate and the multivariate regression analyses, respectively. Statistical power was set at 80 % and statistical significance at P=0·05. The statistical software package IBM SPSS Statistics Version 21.0 was used for all analyses.
Results
Table 1 displays the mean values for age and certain anthropometric characteristics (weight, height, BMI) and body composition indices (total fat mass, visceral fat rating), resistance and reactance, and the prevalence of normal weight, overweight and obesity among children for the total sample and by gender. Overall, the mean age of children was 11·2 (sd 0·6) years and the observed prevalence was 30·9 % for overweight and 11·4 % for obesity. The prevalence of obesity was significantly higher in male than female children (13·3 v. 9·6 %, P<0·05). The mean resistance was 654·2 (sd 81·8) Ω. The resistance was significantly higher in female than male children (673·9 (sd 85·1) v. 634·0 (sd 73·0) Ω, P=0·003).
Anthropometric characteristics, body composition indices and prevalence of overweight/obesity among 9–13-year-old children from four regions of Greece; Healthy Growth Study

* Statistically significant difference between genders (P<0·05, derived from the two-sample Z-test for proportions).
† Total fat was assessed using the resistance and reactance measurements provided by the Akkern BIA 101 device using the following equations: FFM=−7·13(±2·79)+Ht2/R×0·66(±0·07)+Xc×0·07(±0·02)+Ht×0·06(±0·03)+Wt×0·06(±0·03) (boys) and FFM=−0·86(±3·40)+Ht2/R×0·46(±0·07)+Xc×0·04(±0·02)++Ht×0·05(±0·03)+Wt×0·14(±0·04) (girls). Fat-free mass was calculated and then fat mass was estimated.
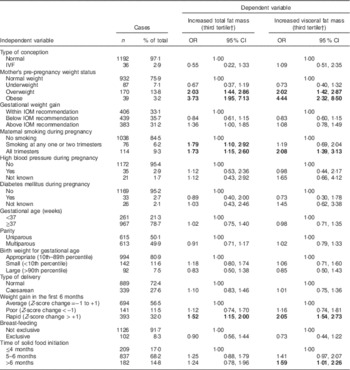
Table 2 presents the univariate associations of several perinatal factors with increased children’s total fat mass and visceral fat mass rating (i.e. third tertile). Children whose mothers were overweight or obese before pregnancy were more likely to have increased total fat mass (OR=2·03; 95 % CI 1·44, 2·86 and OR=3·73; 95 % CI 1·95, 7·13, respectively) and visceral fat mass rating (OR=2·02; 95 % CI 1·42, 2·87 and OR=4·44; 95 % CI 2·32, 8·50, respectively) compared with children whose mothers were within the normal weight range before pregnancy. Regarding maternal smoking during pregnancy, children whose mothers were smoking at any one or two trimesters of pregnancy were more likely to have increased total fat mass rating (OR=1·79; 95 % CI 1·10, 2·92) compared with children born to mothers who were not smoking during pregnancy; moreover, children whose mothers were smoking during all trimesters of pregnancy were more likely to have increased total fat mass and visceral fat mass rating (OR=1·73; 95 % CI 1·15, 2·60 and OR=2·08; 95 % CI 1·39, 3·13, respectively) than children born to mothers who were not smoking during pregnancy. As far as weight gain during the first 6 months of age is concerned, rapid weight gain was found to increase the likelihood of children’s increased total fat mass and visceral fat mass rating (OR=1·52; 95 % CI 1·15, 2·00 and OR=2·05; 95 % CI 1·54, 2·73, respectively) compared with children who had average weight gain during this time. Regarding time of solid food initiation, introducing solid food to children’s diet after the 6th month of age was found to increase the likelihood of higher visceral fat mass rating (OR=1·59; 95 % CI 1·01, 2·26) compared with solid food initiation before or at the 4th month of age.
Logistic regression analysis examining the associations between several perinatal factors (independent variables) and increased total and visceral fat mass levels (dependent variables) among 9–13-year-old children from four regions of Greece; Healthy Growth Study
IVF, in vitro fertilization; IOM, Institute of Medicine.
Bold font indicates statistically significant OR (P<0·05).
OR and 95 % CI derived from univariate logistic regression models, i.e. with its model including one perinatal variable as independent variable and the highest total or visceral fat mass level as dependent variable.
† As no specific and widely used cut-off points for total and visceral fat mass are available, the third tertiles of children with the highest levels with total and visceral fat mass were used as independent variables.
Table 3 presents the univariate associations of parental anthropometrics, family sociodemographics, dietary and physical activity indices with increased children’s total fat mass and visceral fat mass rating (i.e. third tertile). Regarding age categories, children in the age group of 11–13 years were more likely (OR=1·42; 95 % CI 1·09, 1·86) to be in the highest tertile of total body fat mass compared with children in the age group of 9–11 years. Regarding parental anthropometrics, having overweight and obese parents (either mother or father) was found to increase the odds for children’s higher fat mass levels and visceral fat mass rating. Regarding family sociodemographic characteristics, children whose father was >46 years old were less likely (OR=0·68; 95 % CI 0·50, 0·95) to have increased total fat mass levels than children having a younger (<42 years old) father. Furthermore, paternal and maternal educational level >12 years, compared with <9 years, was found to decrease the odds for children’s higher fat mass levels and visceral fat mass rating. Regarding breakfast consumption, children who consumed breakfast had decreased likelihood of having increased total fat mass and visceral fat mass rating (OR=0·56; 95 % CI 0·42, 0·74 and OR=0·58; 95 % CI 0·44, 0·76, respectively) than irregular breakfast consumers. Concerning physical activity, children who watched TV for >2 h/d were more likely to have increased visceral fat mass rating (OR=1·35; 95 % CI 1·05, 1·75) than children who watched TV for <2 h/d, while girls who had ≥12 000 steps per day and boys who had ≥13 000 steps per day were less likely to have increased total fat mass and visceral fat mass rating (OR=0·45; 95 % CI 0·34, 0·60 and OR=0·63; 95 % CI 0·48, 0·81, respectively) compared with their counterparts who had fewer daily steps.
Logistic regression analysis examining the associations between parental anthropometric, family sociodemographic and children’s dietary and physical activity indices (independent variables) and increased total and visceral fat mass levels (dependent variables) among 9–13-year-old children from four regions of Greece; Healthy Growth Study

Bold font indicates statistically significant OR (P<0·05).
OR and 95 % CI derived from univariate logistic regression models, i.e. with its model including one parental anthropometric, family sociodemographic or children’s dietary or physical activity variable as independent variable and highest total or visceral fat mass level as dependent variable.
† As no specific and widely used cut-off points for total and visceral fat mass are available, the third tertiles of children with the highest levels with total and visceral fat mass were used as independent variables.
‡ Based on recommendations by the Institute of Medicine( 13 ).
Table 4 presents the multivariate associations between those perinatal, anthropometric, family sociodemographic, dietary and physical activity indices that were found to be significantly associated with total fat mass and visceral fat mass rating at a univariate level. Maternal smoking during pregnancy (OR=1·72; 95 % CI 1·06, 2·80), rapid weight gain in the first 6 months (OR=1·42; 95 % CI 1·03, 1·97), maternal (OR=3·03; 95 % CI 1·76, 5·23) and paternal obesity (OR=1·62; 95 % CI 1·04, 2·54) and watching TV for >2 h/d (OR=1·40; 95 % CI 1·03, 1·90) remained significantly and positively associated with children’s increased total fat mass levels. Furthermore, maternal pre-pregnancy obese weight status (OR 2·46; 95 % CI 1·02, 5·90), maternal smoking during pregnancy (OR=1·93; 95 % CI 1·19, 3·13), rapid weight gain in the first 6 months (OR=1·96; 95 % CI 1·41, 2·72), maternal (OR=1·77; 95 % CI 1·01, 3·10) and paternal obesity (OR=1·78; 95 % CI 1·12, 2·83) remained significantly and positively associated with children’s increased visceral fat mass levels. On the other hand, father’s age >46 years (OR=0·57; 95 % CI 0·39, 0·83), maternal educational level of 9–12 years (OR=0·62; 95 % CI 0·41, 0·94) and 12–16 years (OR=0·53; 95 % CI 0·33, 0·86) and daily steps ≥12 000 for girls and ≥13 000 for boys (OR=0·66; 95 % CI 0·49, 0·89) remained significantly and negatively associated with children’s total fat mass levels. Finally, maternal educational level of 12–16 years (OR= 0·58; 95 % CI 0·36, 0·94) and >16 years (OR=0·45; 95 % CI 0·22, 0·95) and daily steps ≥12 000 for girls and ≥13 000 for boys (OR=0·47; 95 % CI 0·34, 0·64) remained significantly and negatively associated with children’s visceral fat mass levels.
Multiple logistic regression models examining the associations between perinatal data, parental anthropometrics, family sociodemographic and children’s dietary and physical activity indices (independent variables) and increased total and visceral fat mass levels (dependent variables) among 9–13-year-old children from four regions of Greece; Healthy Growth Study

Bold font indicates statistically significant OR (P<0·05).
Adjustment was made for dietary energy intake.
Adjusted OR and 95 % CI were derived from multivariate logistic regression models, i.e. with its model including one perinatal, parental anthropometric, family sociodemographic or children’s dietary or physical activity variable as independent variable and highest total or visceral fat mass level as dependent variable.
† As no specific and widely used cut-off points for total and visceral fat mass are available, the third tertiles of children with the highest levels with total and visceral fat mass were used as independent variables.
‡ Based on recommendations by the Institute of Medicine( 13 ).
Discussion
The current study sought to examine the possible independent associations of perinatal, sociodemographic and lifestyle characteristics with childhood obesity, assessed as total and visceral body fat, using data from a large, cross-sectional epidemiologic study: the Healthy Growth Study.
Results regarding obesity prevalence in our population show that childhood obesity in Greece is very high, as 31·5 % of boys and 30·4 % of girls were overweight and 13·3 % of boys and 9·6 % of girls were obese. Unfortunately there are no national estimates of childhood obesity in Greece, but another large epidemiological study conducted in 4786 children aged 10–12 years old showed similar obesity prevalence rates (29·9 and 29·2 % for overweight and 12·9 and 10·6 % for obesity in boys and girls, respectively)( Reference Farajian, Risvas and Karasouli 16 ).
Maternal overweight and obesity before pregnancy were found to be the strongest perinatal predictors of childhood elevated total and visceral fat mass in the present study. Many previous studies have shown the association of maternal weight before pregnancy with childhood obesity. More specifically, Franca-Neto et al.( Reference Franca-Neto, Amorim and de Oliveira Barros 17 ) showed a positive association between mother’s pre-pregnancy higher waist circumference and child’s subcutaneous and visceral fat in a study of 116 mother and child dyads. Overweight and obese pregnant women are more likely to have insulin resistance, even those with normal glucose tolerance, compared with lean or average-weight pregnant women( Reference Catalano and Ehrenberg 18 ). As a result of insulin resistance, there is a greater availability of glucose and lipids, the energy sources and substrates for fetoplacental growth( Reference Radaelli, Lepercq and Varastehpour 19 ). In the study of Catalano et al.( Reference Catalano, Farrell and Thomas 20 ) results strongly supported the argument that maternal pre-pregnancy obesity is a significant risk factor for childhood obesity and that obesity may be programmed in utero through the adverse metabolic status of obese mothers. One hypothesis is that during pregnancy of an obese mother, pathways for intracellular lipid biosynthesis are selectively up-regulated( Reference Radaelli, Lepercq and Varastehpour 19 ).
Another risk factor found to be associated with increased visceral fat and total body fat in the present children was the growth rate during infancy. In particular, rapid weight gain during the first 6 months and until 2 years of age was found to increase the likelihood of higher total body and visceral fat mass compared with normal development. The association of rapid weight gain during the first half-year of infancy with overweight in childhood or adolescence has been constantly reported in a plethora of studies( Reference Stettler, Kumanyika and Katz 21 – Reference Singhal 25 ). Related reviews have shown a significant association of rapid growth in early life with overweight or obesity in subsequent life stages( Reference Monteiro and Victora 26 – Reference Ong and Loos 28 ), although different exposures (various definitions and timings of rapid weight gain, linear growth) and various outcomes (continuous BMI, obesity/overweight, weight) were used in these four systematic reviews. Overall, data support a hypothesis called the ‘growth acceleration hypothesis’, which proposes that early nutrition and growth rate make a major contribution to obesity and other components of the metabolic syndrome, such as hypertension or dyslipidaemia, that predispose to cardiovascular morbidity and mortality( Reference Singhal and Lucas 29 ).
In the present study, smoking during pregnancy was also positively associated with total and visceral fat mass in children. Smoking in pregnancy has been suggested as further supporting the theory of the ‘fetal origins of adult diseases’, as there are several studies showing an association between maternal smoking during pregnancy and overweight in children that could also be justified via low birth weight caused by maternal smoking( Reference Oken, Levitan and Gillman 30 – Reference Koshy, Delpisheh and Brabin 34 ). Only a few studies have assessed fat accumulation rather than BMI in order to determine overweight( Reference Leary, Smith and Rogers 35 – Reference Oken, Huh and Taveras 37 ). BMI is a less accurate assessment index of adiposity, especially in children, compared with body fat distribution. Von Schnurbein and co-workers( Reference Von Schnurbein, Klenk and Galm 38 ) showed a positive association between maternal smoking during pregnancy and higher proportion of visceral fat in children. Additionally, no association of smoking with fat distribution was found in early puberty, whereas in late puberty, maternal smoking was associated with both higher subcutaneous and intra-abdominal fat mass( Reference Syme, Abrahamowicz and Mahboubi 39 ). Most recently, in the KOALA Birth Cohort Study( Reference Timmermans, Mommers and Gubbels 40 ) maternal smoking during pregnancy was associated with lower birth weight and higher weight gain in the first year after birth, even exceeding the initial birth weight deficit. Children had a higher risk of exceeding the 85th percentile of waist circumference, but not central-to-peripheral skinfold thickness ratio. Results herein confirm the positive association of maternal smoking with higher total fat mass in children. A possible mechanism underlying the association between smoking during pregnancy and increased children’s adiposity/body weight is abnormal regulation of central endocrine control of body weight homeostasis, particularly abnormal hypothalamic regulation of appetite and energy expenditure( Reference Wilding 41 , Reference Wideroe, Vik and Jacobsen 42 ).
Besides perinatal factors, higher socio-economic factors were inversely associated with childhood obesity or increased total body fat in the current study. Parental higher educational level and particularly maternal educational level showed a negative association with occurrence of childhood obesity, higher total body fat and visceral body fat mass levels. Results herein are in accordance with previous data. For example, in a study by von Schnurbein et al.( Reference Von Schnurbein, Klenk and Galm 38 ) of 1046 children, a negative association between maternal education and high levels of visceral fat in children was reported. A possible explanation would be that parental high educational level entails a better knowledge and understanding of the impact of systemic and increased physical activity or consumption of fruits, vegetables and whole grains v. high-energy diet though poor in nutrient content.
Regarding parental BMI, parental obesity in the present study was positively associated with the occurrence of high levels of total body and visceral body fat mass in children, in line with other surveys( Reference Von Schnurbein, Klenk and Galm 38 , Reference Cooper, Hypponen and Berry 43 ). Apart from the inherited genetic risk, children who grow up with obese parents are more likely to adapt their parents’ eating behaviour and sedentary physical activity that further contribute to the obesity phenotype.
In the present study, another important factor associated with childhood obesity was the time spent by children watching TV. It was found that watching TV for >2 h/d is associated with elevated total fat mass in children. As shown previously in 369 children and adolescents having a bedroom TV, TV viewing time is related to high waist circumference, fat mass and abdominal subcutaneous adiposity( Reference Staiano, Harrington and Broyles 44 ). Evidently, a negative association between steps per day (≥12 000 steps for girls and ≥13 000 steps for boys) and increased total and visceral body fat was found in the present study, which is in agreement with other studies. Specifically, visceral abdominal fat was associated with elevated whole-body fat and more sedentary activities among 8-year-old children at risk of obesity( Reference Saelens, Seeley and van Schaick 45 ). Additionally, food company advertisements also have a significant contribution to these associations, as they predominantly promote foods high in sugar, fat and/or salt( Reference Batada, Seitz and Wootan 46 , Reference Huang, Mehta and Wong 47 ).
Judging from the overall findings, the present study showed that some of the independent variables tested were significantly associated with total fat mass level while others with visceral fat mass rating. Although in many cases increased total body fat mass also reflects increased visceral fat mass level, this is not always the case, since in many individuals increased total body fat mass level may reflect mainly high subcutaneous fat mass level. Considering the above, as well as the fact that in the present study total body and visceral fat mass were measured by two different devices, observing significant associations with total body fat mass levels is not a prerequisite of finding significant associations also with visceral fat mass levels or vice versa.
The findings of the present study should be interpreted under the light of its strengths and limitations. Regarding strengths, the Healthy Growth Study was a large-scale epidemiological study conducted using a representative sample of children from four prefectures within the wider region of Greece. However, one of the main limitations of the study is that, due to its cross-sectional design, it cannot support causal relationships between perinatal or sociodemographic or lifestyle correlates and body composition indices. Moreover, the retrospective collection of data via the parental recall could be considered a methodological bias that should be kept in mind when interpreting the findings of the present study. Lastly, although some variables included in the multivariate regression analysis model could act as confounders in certain associations between the independent and dependent variables, some other variables could act as mediators. Nevertheless, the multivariate regression analyses performed in the present study to identify potential independent associations of perinatal, sociodemographic and lifestyle factors with increased fat mass levels in children cannot discern potential confounders from mediators and this could be accounted as another limitation of the present work.
Overall, the results of the present study showed that smoking during pregnancy, the rate of child development during the first months of life, parental BMI, father’s age, maternal educational level, daily energy expenditure due to exercise and sedentary behaviours such as daily hours spent on TV are associated with children’s higher levels of total and visceral fat mass. The present study is the first to examine possible independent associations of a large number of perinatal, socio-economic factors and lifestyle characteristics of children and families in relation to children’s total and visceral fat mass. These results highlight the importance of intervention programmes beginning early in life because of the strength of the associations between preconception factors and fat mass levels in childhood. In this regard, future intervention programmes starting from early life stages need to be designed and implemented in order to pave the way for new, more effective and sustainable approaches for tackling the childhood obesity epidemic and its cardiometabolic complications in adult life.
Acknowledgements
Acknowledgements: The authors would like to thank the Healthy Growth Study Group for the valuable contribution to the completion of the study. Financial support: This research was co-financed by the European Union (European Social Fund; ESF) and Greek national funds through the Operational Programme ‘Education and Lifelong Learning’ of the National Strategic Reference Framework (NSRF) – Research Funding Programme: ‘Heracleitus II. Investing in knowledge society through the European Social Fund’. The funders had no role in the design, analysis or writing of this article. Conflicts of interest: None. Authorship: G.M., study design, data collection, data analysis, data interpretation. A.C.K., data analysis, data interpretation. K.K., data analysis, data interpretation. M.A., data collection, literature review. C.-P.L., data collection, literature review. A.K.K., data collection, literature review. G.P.C., study design, data interpretation. C.L., study design, data interpretation. Y.M., study design, data interpretation. All authors contributed in drafting the manuscript, reviewed and approved the final version. Ethics of human subject participation: This study was conducted according to the guidelines laid down in the declaration of Helsinki and all procedures involving human subjects were approved by the Greek Ministry of National Education and the Ethics Committee of the Harokopio University of Athens. Written informed consent was obtained from all subjects. The Healthy Growth Study Group: Harokopio University Research Team/Department of Nutrition and Dietetics: Yannis Manios (Coordinator), George Moschonis (Project Manager), Katerina P. Skenderi, Evangelia Grammatikaki, Odysseas Androutsos, Sofia Tanagra, Alexandra Koumpitski, Paraskevi-Eirini Siatitsa, Anastasia Vandorou, Aikaterini-Efstathia Kyriakou, Vasiliki Dede, Maria Kantilafti, Aliki-Eleni Farmaki, Aikaterini Siopi, Sofia Micheli, Louiza Damianidi, Panagiota Margiola, Despoina Gakni, Vasiliki Iatridi, Christina Mavrogianni, Kelaidi Michailidou, Aggeliki Giannopoulou, Efstathoula Argyri, Konstantina Maragkopoulou, Maria Spyridonos, Eirini Tsikalaki, Panagiotis Kliasios, Anthi Naoumi, Konstantinos Koutsikas, Epistimi Aggelou, Zoi Krommyda, Charitini Aga, Manolis Birbilis, Ioanna Kosteria, Amalia Zlatintsi, Elpida Voutsadaki, Eleni-Zouboulia Papadopoulou, Zoi Papazi, Maria Papadogiorgakaki, Fanouria Chlouveraki, Maria Lyberi, Nora Karatsikaki-Vlami, Eva Dionysopoulou and Efstratia Daskalou.


