



Type 2 diabetes mellitus (T2DM), a chronic life-threatening metabolic disorder( Reference Zimmet, Alberti and Shaw 1 ), is spreading globally at an alarming rate( Reference Yach, Stuckler and Brownell 2 ). For instance, reports show that its prevalence has doubled during the last 20 years in the USA( Reference King, Aubert and Herman 3 ) and it is predicted that the number of diabetic people will reach 380 million in 2025, worldwide( Reference Harris, Flegal and Cowie 4 ). While the wide range of accompanying disabilities and life-affecting complications can decrease life expectancy by nearly 10 years, the disease and its concerning outcomes are preventable by controlling its contributing factors( Reference Seidell 5 ).
Several factors including weight gain, physical activity, smoking and also dietary behaviours like fruit and vegetable consumption have been related to T2DM risk in previous studies( 6 ). Dietary intakes of individual nutrients and food groups have long been studied in relation to diabetes( Reference Cooper, Sharp and Lentjes 7 – Reference Villegas, Shu and Gao 9 ); however, it is proposed that foods may affect chronic disease risk synergistically rather than individually( Reference Jacobs and Steffen 10 ). Dietary pattern analysis has emerged recently to combine multiple foods or food groups as a single exposure by using scores assigned to foods or food groups (a priori defined dietary patterns) or statistical approaches (a posteriori defined or empirically derived dietary patterns)( Reference Newby and Tucker 11 ). Empirical methods use different statistical methods like factor analysis, reduced rank regression or cluster analysis to derive dietary patterns( Reference Newby and Tucker 11 ). Using a posteriori methods helps researchers to combine numerous foods or food groups to derive dietary patterns as single exposure variables( Reference Hu 12 ). It has been assumed that dietary patterns can provide a better and more general insight into diet–disease relationships( Reference Hu 12 ) and may be more predictive of chronic disease risk than individual nutrients or foods because the effects from single nutrients or foods are too small to be detectable( Reference Newby and Tucker 11 ).
Several studies have tried to assess the effects of dietary patterns in relation to diabetes risk and their results have been contradictory. Some studies have shown a significant association between dietary patterns high in fruits and vegetables and incident T2DM( Reference Erber, Hopping and Grandinetti 13 ), while others could not show the same results( Reference Hodge, English and O’Dea 14 ). Studies have also reached conflicting results about the effect of unhealthy dietary patterns highly loaded by red meat and high-fat foods in association with T2DM( Reference Nanri, Shimazu and Takachi 15 , Reference Fung, Schulze and Manson 16 ).
Cohort studies are the best epidemiological approach to reveal the casual role of diet in disease development. Therefore, in the present study, we tried to summarize prospective data about the effect of empirically derived dietary patterns in association with diabetes risk and if possible to quantify the association between the same dietary food patterns and T2DM risk and also search for the sources of the difference between studies’ results, using meta-analysis.
Materials and methods
Search strategy
Our search was focused on the keywords selected from Medical Subject Headings (MeSH) database and non-MeSH terms related to the topic, including: ‘diabetes mellitus’, ‘diabetes mellitus type 2’, ‘diabetes’, ‘dietary pattern’, ‘food pattern’, ‘eating pattern’, ‘dietary habit’, ‘food habit’, ‘eating habit’, ‘dietary behaviour’, ‘food behaviour’, ‘eating behaviour’, ‘diet habit’, ‘feeding behaviour’ and ‘feeding pattern’. We searched several databases including PubMed, ISI Web of Science and SCOPUS, up to 15 January 2015. Assurance of finding the maximum related publications was achieved by searching the mentioned keywords in Google Scholar. All of the databases were searched with no language or date limitation. The relevant studies were detected with a hierarchical approach on the basis of titles, abstracts and full text of articles in the first step. In the next step, the full text of all related articles was inspected by reviewers to check the eligibility of the selected papers. Furthermore, reference lists of related articles were checked for any other related paper. All of the steps were performed by two authors (Z.A. and A.S.-A.) separately and any disagreements were resolved through discussion with R.G. as the third author.
Inclusion criteria
Studies meeting the following criteria were included in our systematic review and meta-analysis: (i) original prospective cohort study; (ii) performed on an adult population; and (iii) as the majority of studies examining the association between dietary patterns and T2DM used exploratory factor analysis or principal component analysis to derive dietary patterns, we included the studies which used the mentioned statistical methods to define the major dietary food patterns.
Exclusion criteria
Eligible surveys were reviewed carefully by Z.A. for any methodological difference. Studies with the following characteristics were excluded: (i) studies that used an a priori method or statistical methods other than factor analysis to derive dietary food patterns; and (ii) studies that selected different outcomes other than T2DM like insulin resistance, homeostasis model of assessment (HOMA).
Study quality assessment
The quality of relevant articles was determined using the Newcastle–Ottawa quality assessment scale for cohort studies. An eight-question checklist was filled in for eligible studies( Reference Wells, Shea and O’Connell 17 ).
Data extraction
The following data were extracted from related papers: (i) first author’s family name; (ii) publication year; (iii) country in which the study was performed; (iv) participants’ sex; (v) participants’ age; (vi) statistical analysis method; (vii) duration of follow-up; (viii) study sample size at baseline; (ix) number of cases found after follow-up; (x) food items that highly loaded on each dietary pattern; and (xi) confounding variables adjusted for in the multivariate model.
Studies conducted on the association between dietary patterns and T2DM found several dietary patterns and named these dietary patterns based on the foods or food groups loaded on each pattern. In the current study we also divided the derived dietary patterns based on the foods loaded on each pattern. If food groups known as healthy – like vegetables, fruits, whole grains and seeds – loaded highly on one of these dietary patterns, we named it as a ‘healthy’ dietary pattern. In contrast, if unhealthy foods – like red meat, processed foods, high-fat dairy and refined grains – loaded highly, we named it as an ‘unhealthy’ dietary pattern.
The reported relative risks (RR) for T2DM in participants who had the highest adherence to the derived dietary patterns in comparison to those who had the lowest adherence, and their 95 % confidence intervals, were extracted to compute effect sizes. It should be mentioned that some studies used several models to adjust for confounding variables; therefore, we opted for the models with the maximum number of variables. In addition, if multiple publications were found from the same cohort study, data from the most recent report and with the longer follow-up period were included. The information was extracted independently by two reviewers (Z.A. and A.S.-A.) and discrepancies were resolved by discussion with the third author (R.G.).
Statistical analysis
The relative risks and their 95 % confidence limits were extracted to compute log(RR) values and their corresponding standard errors, which were used as effect size in the current meta-analysis. In addition, to incorporate between-study variation, a random-effects model was used to combine effect sizes. This model takes between-study heterogeneity into account( Reference Egger, Smith and Altman 18 ). Statistical heterogeneity among studies was evaluated using Cochran’s Q test and the I 2 statistic( Reference Higgins and Thompson 19 ). The sources of heterogeneity were checked by several subgroup analyses( Reference Higgins and Thompson 19 ) based on foods or food groups loaded on dietary patterns, sex, study region, studies’ overall quality score, follow-up time, person-years, adjustment for physical activity, adjustment for family history of T2DM, ethnic differences and adjustment for education. To explore the extent of dependency of analyses on a specific study or a particular group of studies, sensitivity analysis was done. Publication bias was evaluated by visual inspection of Begg’s funnel plots( Reference Egger, Davey Smith and Schneider 20 ) and the statistical asymmetry of the funnel plot was assessed using Egger’s regression asymmetry test and Begg’s adjusted rank correlation test( Reference Egger, Smith and Altman 18 ). Statistical analyses were performed by using the STATA statistical software package version 11·2. P values lower than 0·05 were considered statistically significant.
Results
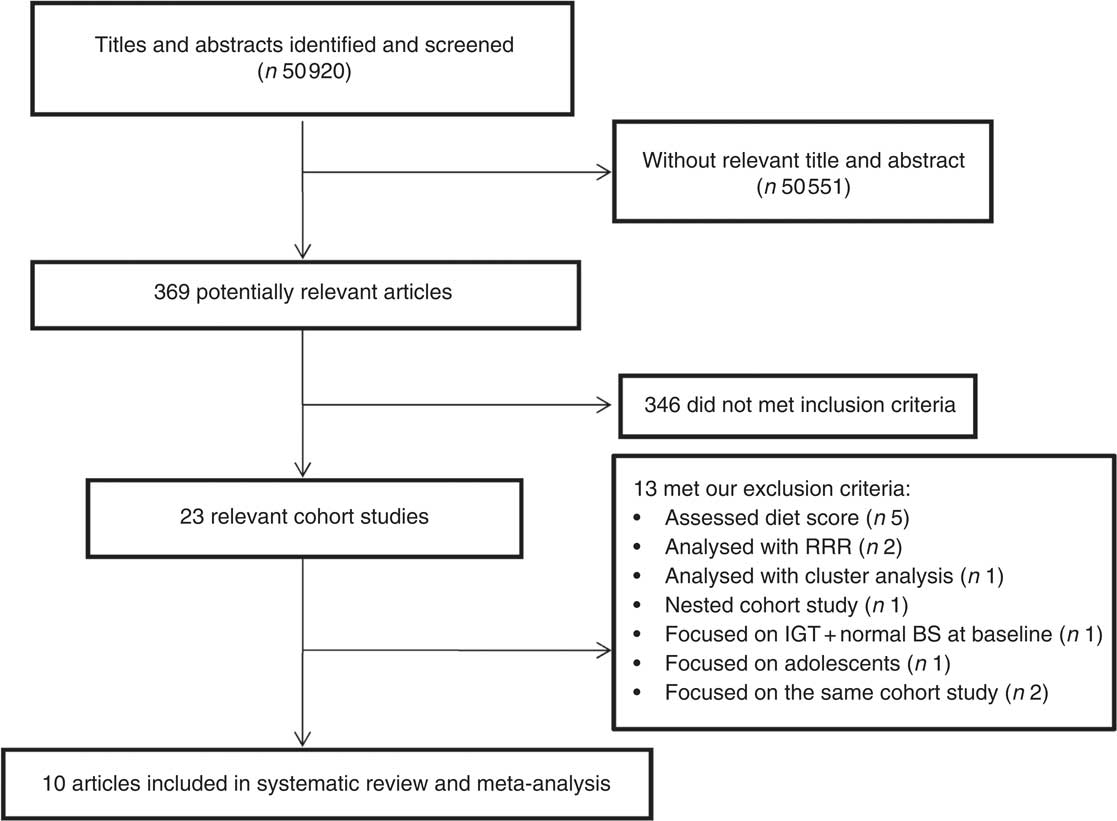
The study selection process is described in Fig. 1. Our search retrieved 50 920 articles. After scanning titles and abstracts, ten articles were eligible to be included in our systematic review and meta-analysis( Reference Erber, Hopping and Grandinetti 13 – Reference Fung, Schulze and Manson 16 , Reference Bauer, Beulens and van der A 21 – Reference Odegaard, Koh and Butler 26 ); all of the eligible studies reported a relative risk or hazard ratio for the association between a dietary pattern and risk of T2DM. Four studies were conducted in the USA( Reference Erber, Hopping and Grandinetti 13 , Reference Fung, Schulze and Manson 16 , Reference van Dam, Rimm and Willett 25 ), two in Europe( Reference Bauer, Beulens and van der A 21 , Reference Montonen, Knekt and Harkanen 22 ), one in Australia( Reference Hodge, English and O’Dea 14 ) and three in Asia (two in Japan( Reference Nanri, Shimazu and Takachi 15 , Reference Morimoto, Ohno and Tatsumi 23 ) and one in China( Reference Odegaard, Koh and Butler 26 )). A total of 404 528 individuals free of T2DM were included in the selected studies at baseline and 18 584 cases were diagnosed during the follow-up period. Participants’ age ranged between 27 and 84 years. Diabetes incidence was defined according to the WHO classification, as elevated random or fasting plasma glucose level, or elevated plasma glucose 2 h after a glucose load. All studies used a validated FFQ with sixteen to 178 food items to assess dietary intake. Studies adjusted the estimated risk for confounding variables such as age, sex, smoking, physical activity, energy intake, BMI and history of diseases. Table 1 shows detailed information about the studies included in the systematic review and meta-analysis.
Flowchart of the study selection process (RRR, reduced rank regression; IGT, impaired glucose tolerance; BS, blood sugar)
Observational prospective studies eligible to include in the systematic review and meta-analysis

M, male; F, female; PA, physical activity; HTN, hypertension; DM, diabetes mellitus.
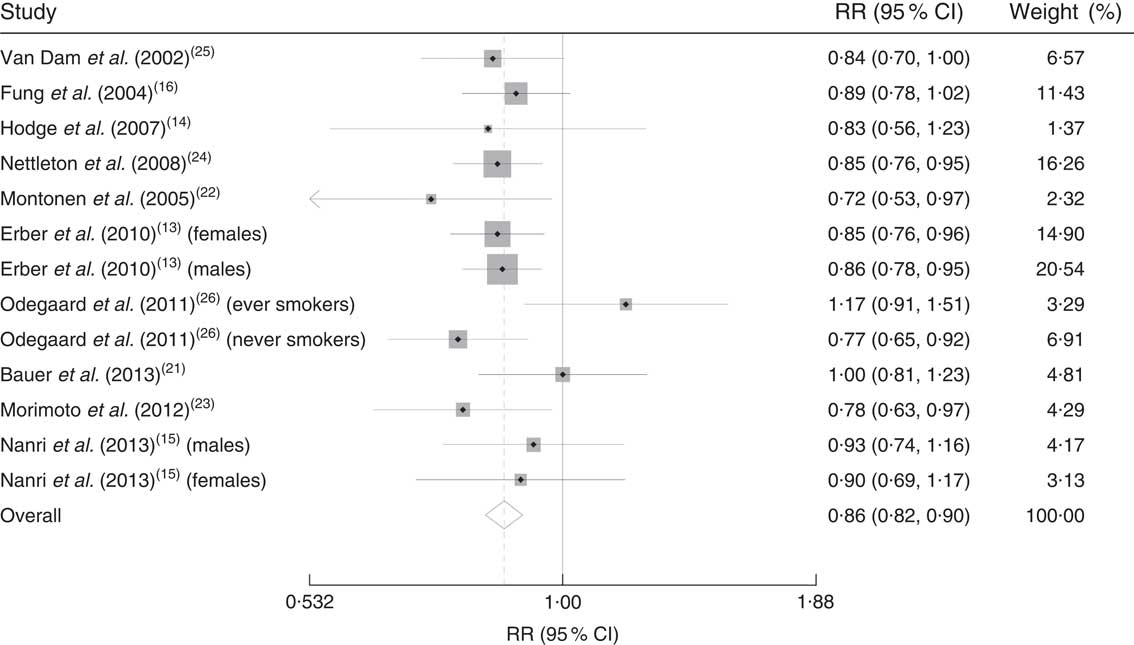
Two major dietary patterns were derived in almost all included studies, based on the foods and food groups highly loaded on each pattern. Food groups like vegetables, fruits, whole grains and seeds loaded highly on one of these dietary patterns which we called ‘healthy’ dietary patterns, while in another group of patterns unhealthy foods like red meat, processed foods, high-fat dairy and refined grains loaded highly; therefore we called them ‘unhealthy’ dietary patterns (Table 1). Our analysis revealed that adhering to the ‘healthy’ dietary patterns led to a decreased risk of T2DM (RR=0·86; 95 % CI 0·82, 0·90; Fig. 2); while adhering to the ‘unhealthy’ dietary patterns increased T2DM risk (RR=1·30; 95 % CI 1·18, 1·43; Fig. 3). There was no evidence of significant between-study heterogeneity for ‘healthy’ dietary patterns (Cochrane Q test, P=0·423; I 2=2·3 %); however, we observed statistically significant heterogeneity for ‘unhealthy’ dietary patterns (Cochrane Q test, P=0·001; I 2=64·1 %). Therefore we performed a subgroup analysis based on the food groups loading on ‘unhealthy’ dietary patterns derived in each study. Beans and tomatoes loaded highly on the derived ‘unhealthy’ dietary pattern in the study done by Nettelton et al.( Reference Nettleton, Steffen and Ni 24 ), and food items like coffee, black tea and oolong tea also loaded highly on the ‘unhealthy’ dietary pattern in the study accomplished by Nanri et al.( Reference Nanri, Shimazu and Takachi 15 ). Although these food groups loaded highly on ‘unhealthy’ dietary patterns, they are known as sources of bioactive phytochemical compounds; therefore we categorized studies based on whether foods with high phytochemical content loaded on ‘unhealthy’ dietary patterns or not (Fig. 4). Our subgroup analysis revealed that high consumption of ‘unhealthy’ foods without consumption of phytochemical-rich foods significantly increased the risk of T2DM (RR=1·39; 95 % CI 1·28, 1·52), the between-study heterogeneity was not statistically significant in this subgroup (Cochrane Q test, P=0·142, I 2=34·5 %); while consumption of foods with high photochemical content along with ‘unhealthy’ foods did not increase the disease risk (RR=1·06; 95 % CI 0·87, 1·30), heterogeneity was not statistically significant in this subgroup too (Cochrane Q test, P=0·06; I 2=65·7 %).
Forest plot illustrating weighted relative risk (RR) using a random-effects model for the comparison of incident type 2 diabetes mellitus in participants with highest v. lowest adherence to ‘healthy’ dietary patterns. The study-specific RR and 95 % CI are represented by the grey square and horizontal line, respectively; the area of the grey square is proportional to the specific-study weight to the overall meta-analysis. The centre of the diamond presents the pooled RR risk and its width represents the pooled 95 % CI
Forest plot illustrating weighted relative risk (RR) using a random-effects model for the comparison of incident type 2 diabetes mellitus in participants with highest v. lowest adherence to ‘unhealthy’ dietary patterns. The study-specific RR and 95 % CI are represented by the grey square and horizontal line, respectively; the area of the grey square is proportional to the specific-study weight to the overall meta-analysis. The centre of the diamond presents the pooled RR risk and its width represents the pooled 95 % CI

Forest plot illustrating weighted relative risk (RR) using random-effects models for the comparison of incident type 2 diabetes mellitus in participants with highest v. lowest adherence to ‘unhealthy’ dietary patterns: subgroup analysis based on loading of foods with high phytochemical content in the ‘unhealthy’ dietary pattern. The study-specific RR and 95 % CI are represented by the grey square and horizontal line, respectively; the area of the grey square is proportional to the specific-study weight to the overall meta-analysis. The centre of the diamond presents the pooled RR risk and its width represents the pooled 95 % CI

We also performed several subgroup analyses based on sex, study region, studies’ overall quality score, follow-up time, person-years, adjustment for physical activity, adjustment for family history of T2DM, ethnic differences and adjustment for education for the effect of ‘healthy’ and ‘unhealthy’ dietary patterns on T2DM risk. Our analyses showed that ‘healthy’ dietary patterns reduced the risk of diabetes in all subgroups (Table 2); however, ‘unhealthy’ dietary patterns did not significantly increase the risk of diabetes among female participants, studies conducted in Eastern countries, Japanese or Chinese participants and studies with fewer than 10 years of follow-up (Table 3).
Pooled risks of type 2 diabetes mellitus (T2DM; and 95 % confidence intervals) in association with ‘healthy’ dietary patterns in different subgroup analyses

Pooled risks of type 2 diabetes mellitus (T2DM; and 95 % confidence intervals) in association ‘unhealthy’ dietary patterns in different subgroup analyses

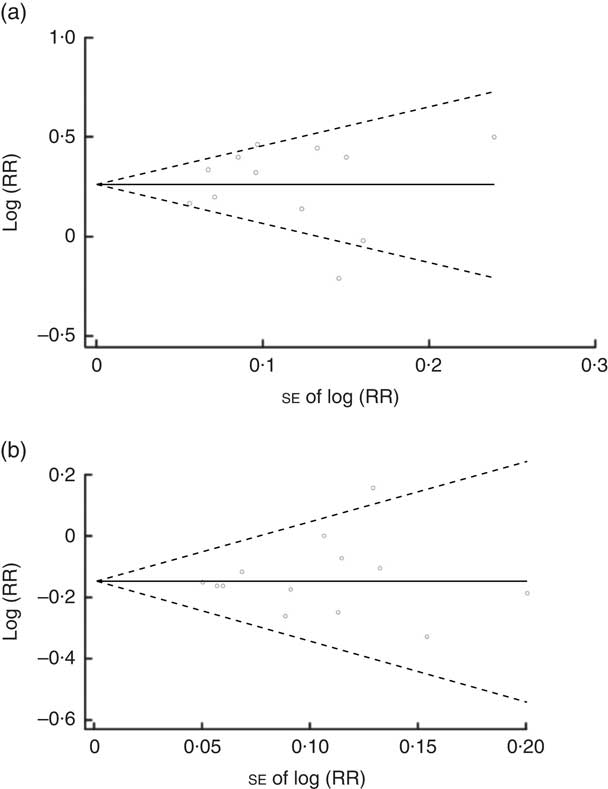
No evidence of publication bias was revealed by the funnel plots (Fig. 5(a) and (b)) and asymmetry tests for both dietary patterns (Egger’s test: P=0·96 and P=0·66 for ‘unhealthy’ and ‘healthy’ dietary patterns, respectively; Begg’s test: P=0·89 for ‘unhealthy’ dietary patterns and P=0·807 for ‘healthy’ dietary patterns). Sensitivity analysis showed that excluding none of the studies notably changed the summary effects or turned the summary effects to non-significant.
Begg’s funnel plot (with 95 % confidence intervals; – – –) of the logarithm of relative risk (RR) v. standard error of the RR in studies that assessed the effect of adherence to ‘unhealthy’ (a) and ‘healthy’ (b) dietary patterns on type 2 diabetes mellitus incidence. The horizontal line (——) shows the combined RR calculated with the random-effects model
Discussion
Our meta-analysis of prospective cohort studies investigating the effects of dietary patterns on T2DM revealed that high adherence to a ‘healthy’ dietary pattern decreases diabetes risk by 14 %, while the risk of diabetes in individuals with high adherence to an ‘unhealthy’ dietary pattern is 30 % greater than in individuals who have the lowest adherence.
‘Healthy’ dietary patterns, which are defined by higher consumption of vegetables, fruits, whole grains, low-fat dairy, fish, poultry and legumes, may play a protective role in T2DM incidence and these effects can be explained via their main nutrients such as antioxidants( Reference Zhang, Lee and Cowan 27 ), magnesium, potassium( Reference van Dam 28 ), carotenoids( Reference Smith, Wingard and Smith 29 ) and fibre content( Reference van Dam 28 ). Also, it seems that several useful components such as flavones, isoflavones( Reference Thompson 30 ), lignans( Reference Kuhad, Sharma and Chopra 31 ) and phytates( Reference Kuhad, Sethi and Chopra 32 ) may have synergistic effects in protecting against diabetes incidence( Reference Villegas, Yang and Gao 33 ).
‘Unhealthy’ dietary patterns are defined by high loadings of red meat, fried and processed foods( Reference Odegaard, Koh and Butler 26 , Reference Bendinelli and Palli 34 ), French fries( Reference Halton, Willett and Liu 35 ) and sausage, as the major sources of saturated and trans-fatty acid contents( Reference Meyer, Kushi and Jacobs 36 ), and of foods with high glycaemic index( Reference Sahyoun, Anderson and Tylavsky 37 ) like refined grains( Reference Sun, Spiegelman and van Dam 38 ), sweets and desserts whose association with the risk of T2DM has been shown previously. Nitrate is one of the common added preservatives in ready-to-use meat products that can convert to nitrosamine and increase T2DM risk. Moreover, advanced glycation of high-fat products and meats can enhance oxidative stress and inflammatory factors that may be accompanied with insulin resistance and increase the possibility of developing T2DM( Reference Bendinelli and Palli 34 ).
Our analysis showed that consumption of foods with high content of phytochemicals along with ‘unhealthy’ foods may change the effect of ‘unhealthy’ food patterns to non-significant. Phytochemicals like flavonoids, polyphenols, phenolic acids, phytates and lignans( Reference Thompson, Winham and Hutchins 39 ) act as effective antioxidants and metal chelators( Reference van Dam 28 ); in addition, the vitamins and minerals like magnesium( Reference Zhang, Lee and Cowan 27 ) and potassium( Reference van Dam 28 , Reference Winham, Webb and Barr 40 ) in these foods might counteract the harmful effects of other unhealthy items loaded on these patterns, which might explain this result.
Subgroup analysis showed significant differences according to sex. Risk of T2DM incidence in men with the highest adherence to ‘unhealthy’ dietary patterns was 39 % higher than in those with the lowest adherence, while this association was not significant in women. The oestrogen concentration of women might influence the overall effect( Reference Newby, Muller and Hallfrisch 41 ). In the current analysis, long-term studies showed stronger health effects of the ‘unhealthy’ dietary pattern than studies which were done over a shorter period of <10 years. The effect of the ‘unhealthy’ dietary pattern in studies that followed-up for ≥10 years showed a 39 % higher risk of T2DM in participants with higher adherence to the ‘unhealthy’ dietary pattern compared with participants with lower adherence.
In Western countries including American, European and Australian adults, participants with the highest adherence to an ‘unhealthy’ dietary pattern, v. those with the lowest adherence, showed significantly different risk for T2DM as compared with their counterparts from Eastern countries. This observation was confirmed in the second subgroup analysis, which was performed based on ethnicity.
Based on our knowledge, there is one previous systematic review and meta-analysis that assessed the relationship between ‘healthy’ dietary patterns and diabetes risk in both a priori and a posteriori methods. In fact, these methods are very different. In the a priori method, researchers score participants’ dietary intake based on defined food patterns, while the a posteriori analytical method tries to use statistical methods to derive dietary patterns from all consumed food items( Reference Newby, Muller and Hallfrisch 41 ). In comparison with our study, Alzahmi et al. included studies with different statistical analyses such as reduced rank regression, cluster analysis and factor analysis, and also studies that assessed the effects of different dietary indices (a priori dietary patterns), in relation to T2DM risk( Reference Alhazmi, Stojanovski and McEvoy 42 ). Including studies with different methods of assessing the dietary intake leads to a high degree of heterogeneity and a biased overall estimation of the effect of dietary patterns on T2DM. Furthermore, we tried to conduct several subgroup analyses to investigate possible sources of heterogeneity between studies included in our meta-analysis.
There are several limitations regarding the present review. Our findings might be affected by strengths and weaknesses of the study designs and measurement errors of the assessment tools. Measurement errors and misclassification arising from the various loading factors and variation in the extracted dietary patterns’ type and number can be identified, too. Although there is the possibility of wide variation in conducting factor analysis, studies reflect a strong association between information derived from FFQ and diet histories. Reproducibility and validity of the used FFQ confirm the stability of the observed relationships. We selected patterns across different studies based on authors’ identified name and similarity in food loadings, which helped us to minimize the risk of bias. In addition, there is some inconsistency in the confounding factors adjusted for in the association between dietary patterns and T2DM among included studies.
Conclusion
Our systematic review and meta-analysis provides confident evidence that following an ‘unhealthy’ dietary pattern including refined grains, processed and red meat, French fries, sweet and desserts can significantly increase T2DM incidence risk, while consuming higher amounts of vegetables, fruits, whole grains and seeds in the context of a ‘healthy’ dietary pattern can significantly reduce the risk of T2DM.
Acknowledgements
Financial support: This research received no specific grant from any funding agency in the public, commercial or not-for-profit sectors. Conflict of interest: None. Authorship: Z.A. and R.G. contributed in conception, design and manuscript drafting. Z.A. and A.S.-A. contributed in statistical analyses and data interpretation. All authors contributed in the approval of the final manuscript for submission. Ethics of human subject participation: Ethical approval was not required.



