





In 2024, ∼150 million children under 5 years of age globally were stunted(1), defined as having a height-for-age z-score more than two sd below the WHO Child Growth Standards median(2). This high burden reflects, in part, the pervasive and well-established combined influences of chronic nutrient inadequacy and repeated enteric infections(Reference Humphrey3–Reference Black, Allen and Bhutta5). Notably, these two processes reinforce one another as inadequate intake of energy, essential fatty acids and micronutrients limits growth and immune function(Reference Maggini, Wintergerst and Beveridge6,Reference Golden7) , while high exposure to enteric pathogens impairs intestinal barrier function, reduces nutrient absorption and contributes to long-term growth and developmental deficits(Reference Petri, Miller and Binder8–Reference Harper, Mutasa and Prendergast10). As a result, interventions that target only one part of this cycle have shown modest effects(Reference Bhutta, Das and Rizvi11,Reference Humphrey, Mbuya and Ntozini12) , underscoring the need to better understand how nutrition interventions might also influence gut-mediated pathways.
Small-quantity lipid-based nutrient supplements (SQ-LNS) are specially formulated nutrition supplements typically provided in small daily doses (20 g sachets) to infants and young children ages 6–24 months with the goal of filling critical nutrient gaps during the complementary feeding period. In a meta-analysis of fourteen randomised controlled trials, provision of SQ-LNS was found to reduce the prevalence of severe stunting by 17 % and the prevalence of severe wasting by 31 % in children 6–24 months of age(Reference Dewey, Arnold and Wessells13). Additionally, SQ-LNS have been shown to reduce the prevalence of micronutrient deficiencies(Reference Wessells, Arnold and Stewart14), improve developmental outcomes(Reference Prado, Arnold and Wessells15) and reduce the risk of mortality(Reference Stewart, Wessells and Arnold16).
While evidence on the beneficial effects of SQ-LNS continues to grow, the mechanisms underlying these effects on child growth and development, as well as the relative contributions of individual pathways, are not fully understood. One proposed pathway is through improvements in intestinal health, including modulation of the gut microbiome and reductions in environmental enteric dysfunction (EED), an acquired, sub-clinical disorder of the small intestine characterised by chronic mucosal inflammation, increased intestinal permeability and villous blunting, thought to result from poor environmental sanitation and repeated enteric infections(Reference Humphrey3,Reference Keusch, Denno and Black4,Reference Prendergast and Kelly17) . Specifically, SQ-LNS may improve intestinal health by providing essential fatty acids and micronutrients (e.g. Zn and vitamin A) that strengthen epithelial barrier integrity and reduce intestinal inflammation and permeability(Reference Maggini, Wintergerst and Beveridge6,Reference Farré, Fiorani and Abdu Rahiman18,Reference Masri, Chalhoub and Sharara19) . A more stable intestinal environment may favour colonisation by beneficial gut microbial taxa while also limiting microbial dysbiosis through reduced enteric infections and mucosal inflammation. Notably, however, unlike emerging microbiome-directed complementary foods, which are specifically formulated with fermentable substrates to promote targeted microbial taxa and functional maturation(Reference Hartman, Hibberd and Mostafa20–Reference Mostafa, Sthity and Lamiya22), SQ-LNS are not designed to directly modulate microbial community structure.
To date, few trials have rigorously evaluated the effects of SQ-LNS on intestinal health. Studies conducted among young children in Malawi(Reference Liu, Ashorn and Chingwanda23), Bangladesh(Reference Lin, Ali and Arnold24) and Zimbabwe(Reference Gough, Moulton and Mutasa25) found little to no impact of SQ-LNS on a range of EED biomarkers. Similarly, studies from Malawi examining the gut microbiome found no significant changes in composition or maturation(Reference Cheung, Xu and Mangani26,Reference Aakko, Grześkowiak and Asukas27) , although one trial observed a modest increase in microbial diversity without corresponding evidence of improved maturation(Reference Kamng’ona, Young and Arnold28).
Although prior studies have shown limited effects of SQ-LNS on intestinal health, key gaps remain. Previous studies were conducted in rural settings, used different EED biomarker panels and/or did not simultaneously assess markers of EED along with gut microbiome composition and diversity. In addition, few studies have evaluated these outcomes after extended supplementation periods. Finally, while SQ-LNS are designed to improve nutritional status, an additional consideration is whether they may influence intestinal health in unintended or potentially harmful ways, as observed in some micronutrient interventions(Reference Paganini and Zimmermann29). These uncertainties are particularly pertinent given the central role of gut structure and microbial ecology in child growth and development(Reference Prendergast and Kelly17,Reference Owino, Ahmed and Freemark30) . This study addresses these research gaps by providing a comprehensive assessment of intestinal health, including both microbiome and EED biomarker outcomes, after 18 months of SQ-LNS supplementation in an urban Zambian population.
Methods
Description of parent trial
The ZamCharts study (ClinicalTrials.gov identifier: NCT05120427) was a 2 × 2 cluster- randomised controlled trial conducted between 2021 and 2023 across three districts in Zambia (Lusaka, Choma and Mansa). A total of 2291 caregiver–child dyads across 282 study clusters were included in the study. Clusters were allocated in a 1:1:1:1 ratio with equal probability to receive: (1) home-installed growth charts, (2) SQ-LNS, (3) home-installed growth charts + SQ-LNS or (4) no intervention. The trial aimed to evaluate the independent and combined effects of home-installed growth charts and monthly distributions of SQ-LNS on child growth and developmental outcomes. Caregiver–child dyads were eligible for the parent trial if the child was between 2 and 10 months of age at baseline, at least 6 months old when the intervention began and the caregiver provided written informed consent. Dyads were excluded if the family planned to move out of the study area within 12 months of enrollment. Detailed methods and findings for the parent trial have previously been published(Reference Fink, Locks and Lauer31–Reference Lauer, Pyykkö and Chembe33). Overall, the trial found that SQ-LNS reduced the odds of stunting by 37 % and the odds of anemia by 26 %, and improved child development as indicated by a 0·28 standard deviation increase in the Global Scales for Early Development scores(Reference Fink, Locks and Lauer31).
Description of endline biomarkers sub-study
At endline, following 18 months of intervention, participants residing in Lusaka district were invited to enroll in the biomarker sub-study conducted at Chawama First Level Hospital, which comprised a venous blood draw, a rectal swab and an eye-tracking assessment. Eligibility for the biomarker sub-study was restricted to participants in Lusaka district to enable evaluation within an urban population while ensuring timely specimen transport, processing and analysis.
Approximately 6 ml of venous blood was collected via cannula into a 10 ml Vacutainer serum tube (Becton, Dickinson and Company). Rectal swabs (FecalSwab, Copan Diagnostics Inc.) were obtained by inserting the swab 1–2 cm beyond the anal verge, rotating 360° while avoiding contact with perianal skin and immediately transferring the swab into Cary Blair transport medium. Rectal swabs were selected for microbiome sampling due to their feasibility in the study setting, including ease of collection and reduced participant burden. Although stool samples are more commonly used and may provide greater microbial biomass, rectal swabs have been shown to yield broadly comparable microbial community profiles(Reference Budding, Grasman and Eck34,Reference Bassis, Moore and Lolans35) . Specimens were transported in a cooler box with ice packs from the clinic to the Centre for Infectious Disease Research in Zambia for processing and analysis.
Approvals
This study was conducted according to the guidelines laid down in the Declaration of Helsinki, and all procedures involving human subjects were approved by the University of Zambia Biomedical Research Ethics Committee (protocol 1411-2020) and the Ethics Committee of Northwestern Switzerland (AO_2021_00016). Written informed consent was obtained from all caregivers prior to enrollment in both the parent trial and the biomarker sub-study. The parent trial is registered at ClinicalTrials.gov (NCT05120427; https://clinicaltrials.gov/ct2/show/NCT05120427).
Laboratory methods
Assessment of biomarkers of environmental enteric dysfunction and inflammation
Blood samples were centrifuged at 1800 g for 10 min to separate serum, which was then aliquoted and stored at −80 °C until analysis. Serum concentrations of soluble CD14 (sCD14), intestinal fatty acid-binding protein (I-FABP), α-1-acid glycoprotein (AGP) and C-reactive protein were measured using a quantitative chemiluminescent assay (Q-Plex™ Human Environmental Enteric Dysfunction 11-plex (MEEDAT), Quansys Biosciences) following previously described methods(Reference Arndt, Cantera and Mercer36). MEEDAT’s two EED biomarkers, sCD14 and I-FABP, assess microbial translocation and gut epithelial barrier integrity, respectively. Concentrations were calculated using calibrator curves. Values below the lower limit of quantification were assigned as half the LLOQ, while values above the upper limit of quantification were retained. All analytes were validated to meet intra- and inter-assay coefficients of variation of < 10 % and < 15 %, respectively.
DNA extraction and quantification for microbiome analysis
DNA was extracted from rectal swabs using a modified DNeasy® PowerSoil® Pro Kit (Qiagen). Swabs stored at −80°C were thawed, vortexed and 500 µl of sample transferred into a bead-beating tube containing glass beads. Following addition of 800 µl CD1 lysis buffer, samples were homogenised twice for 30 s each with a 30 s rest on a FastPrep-24 homogeniser (MP Biomedicals). The homogenate was centrifuged (15 000 × g, 1 min), and 600 µl of supernatant transferred to a clean 2 ml microcentrifuge tube. After addition of 200 µl chilled CD2 and centrifugation (15 000 × g, 1 min), 700 µl of supernatant was mixed with 600 µl CD3, vortexed and applied to an MB spin column in two 650 µl loads (15 000 × g, 1 min each). The column was washed sequentially with 500 µl Solution EA and 500 µl Solution C5, centrifuged after each wash (15 000 × g, 1 min) and transferred to a clean tube. DNA was eluted with 100 µl nuclease-free water by centrifugation (16 000 × g, 2 min) and stored at –20°C until use.
Bacterial 16S rRNA library preparation and sequencing
Bacterial libraries, based on the 16S rRNA V3-V4 region, were prepared using the Quick-16S™ Plus NGS Library Prep Kit (V3-V4, UDI) (Zymo Research), and sequencing was conducted on MiSeq using a 600-cycle v3 reagent kit (Illumina). Briefly, microbial community DNA was amplified using the Quick-16S™ Plus NGS Library Prep Kit (V3–V4, UDI). The kit employs a single-step PCR in which target-specific primers (341f/806r) containing Illumina-compatible adapters and unique dual indices simultaneously amplify the V3-V4 region of the 16S rRNA gene and barcode individual samples. PCR amplification was carried out with up to 10 ng input DNA per reaction on an ABI 7500 Fast qPCR instrument (Thermo Fisher Scientific) following quantification and normalisation, including a ZymoBIOMICS™ Microbial Community DNA Standard as a positive control and a no-template control as a negative control.
Following amplification, libraries were pooled by equal volume without the need for normalisation. The pooled library underwent a single magnetic bead-based purification using Select-a-Size™ MagBeads to remove contaminants and primer-dimers. DNA was eluted in nuclease-free water, and the final library was quantified using a Qubit® dsDNA HS Assay Kit (Thermo Fisher Scientific) on a Qubit 3.0 Fluorometer (Thermo Fisher Scientific). The average amplicon size was ∼ 606 bp. Sequencing was performed on an Illumina MiSeq® platform using a 600-cycle v3 reagent kit, following the manufacturer’s recommendations, with a 12 pM library loading concentration and a 15 % PhiX spike-in.
Quality control and taxonomic assignment
FASTQ files containing 16S rRNA gene sequence data were processed for downstream analysis. Primers (341F and 806R) from the 16S library preparation were removed using Cutadapt v4.1(Reference Martin37). Quality trimming was performed using Trimmomatic v0.39(Reference Bolger, Lohse and Usadel38) with the following parameters: SLIDINGWINDOW:4:20 MINLEN:36. After quality trimming, an average of 92·19 % of read pairs remained as paired reads, with an average of 1·0 % of reads dropped due to low quality. The majority of samples (92 %) retained ≥ $90\,\%$
of read pairs. FastQC v0.12.1(Reference Andrews, Krueger and Segonds-Pichon39) was used to perform quality control for the sequencing data before and after trimming. Post-trimming FastQC analysis confirmed successful primer removal and high read quality, with a mean Phred score above Q30 throughout most of the read length.
$90\,\%$
of read pairs. FastQC v0.12.1(Reference Andrews, Krueger and Segonds-Pichon39) was used to perform quality control for the sequencing data before and after trimming. Post-trimming FastQC analysis confirmed successful primer removal and high read quality, with a mean Phred score above Q30 throughout most of the read length.
16S rRNA gene sequencing data were aligned against reference genomes SILVA 138 SSU Database(Reference Quast, Pruesse and Yilmaz40) and profiled using MetaScope(Reference Lu, Odom and Shah41) for taxonomic assignment. The resulting dataset contains 3173 genera and 11 772 species. To focus on abundant taxa, genera representing less than 1 % average relative abundance were filtered out and grouped as ‘Other’. After filtering, the dataset comprised twenty-three genera and 399 species.
Statistical analysis
Because there was no statistically significant interaction between the home-installed growth charts and SQ-LNS interventions on intestinal health outcomes, children who received SQ-LNS were compared with those who did not, adjusting for receipt of the growth charts intervention. Baseline characteristics for participating households, caregivers and infants were calculated and presented as mean (sd) or n (%). Biomarkers of EED and inflammation were analysed as continuous variables and transformed to the log base 2 scale due to their skewed distribution. Differences by SQ-LNS assignment were assessed using unadjusted and adjusted ordinary least squares regression models with cluster-robust standard errors at the study cluster level to account for within-cluster correlation. Adjusted models controlled for baseline characteristics selected a priori based on their potential to confound the relationship between SQ-LNS and intestinal health, including child age, child sex, child birthweight, caregiver age, caregiver education level and assignment to home-installed growth charts.
Microbiome taxonomic composition was visualised using stacked bar plots created with the LegATo R package (https://wejlab.github.io/LegATo-docs/). Samples were aggregated and stratified by genus abundance. Alpha diversity was assessed using the Shannon diversity index. Kruskal–Wallis test was used to compare α diversity, with significance set at P < 0·05. Beta diversity was evaluated using non-metric multidimensional scaling ordination based on Bray-Curtis dissimilarity matrices calculated with the vegan R package (https://vegandevs.github.io/vegan/). PERMANOVA was performed to test for significant differences in microbial community composition. PERMANOVA with cluster identity as the grouping variable was also performed to assess the impact of clustering on microbiome composition.
Per-protocol analyses were conducted among participants who adhered to the intervention protocol, defined as caregivers reporting provision of SQ-LNS to their children for at least 12 months during the endline survey. Additional subgroup analyses were performed among children who were stunted at baseline (length-for-age z-score < −2 sd). Finally, exploratory species-level analyses were also conducted to investigate potential associations between SQ-LNS assignment and the relative abundance of specific microbial taxa. To identify differentially abundant genera between treatment arms, a consensus approach incorporating three differential abundance methods was used: DESeq2(Reference Love, Huber and Anders42), LEfSe via the lefser R package(Reference Khleborodova, Gamboa-Tuz and Ramos43), and ANCOM-II via the ANCOMBC R package(Reference Lin and Peddada44–Reference Lin and Peddada46). DESeq2 was applied to genus-level counts with Benjamini–Hochberg correction for multiple comparisons. LEfSe was run with a Kruskal–Wallis significance threshold of 0·05, a linear discriminant analysis score threshold of 2·0 and Benjamini–Hochberg correction. ANCOM-II was run with a 10 % prevalence filter, a minimum library size of 1000 reads and structural zero detection enabled. All three methods were applied to the full cohort, the adherence subgroup and the stunted-at-baseline subgroup, with SQ-LNS assignment as the primary variable of interest.
Results
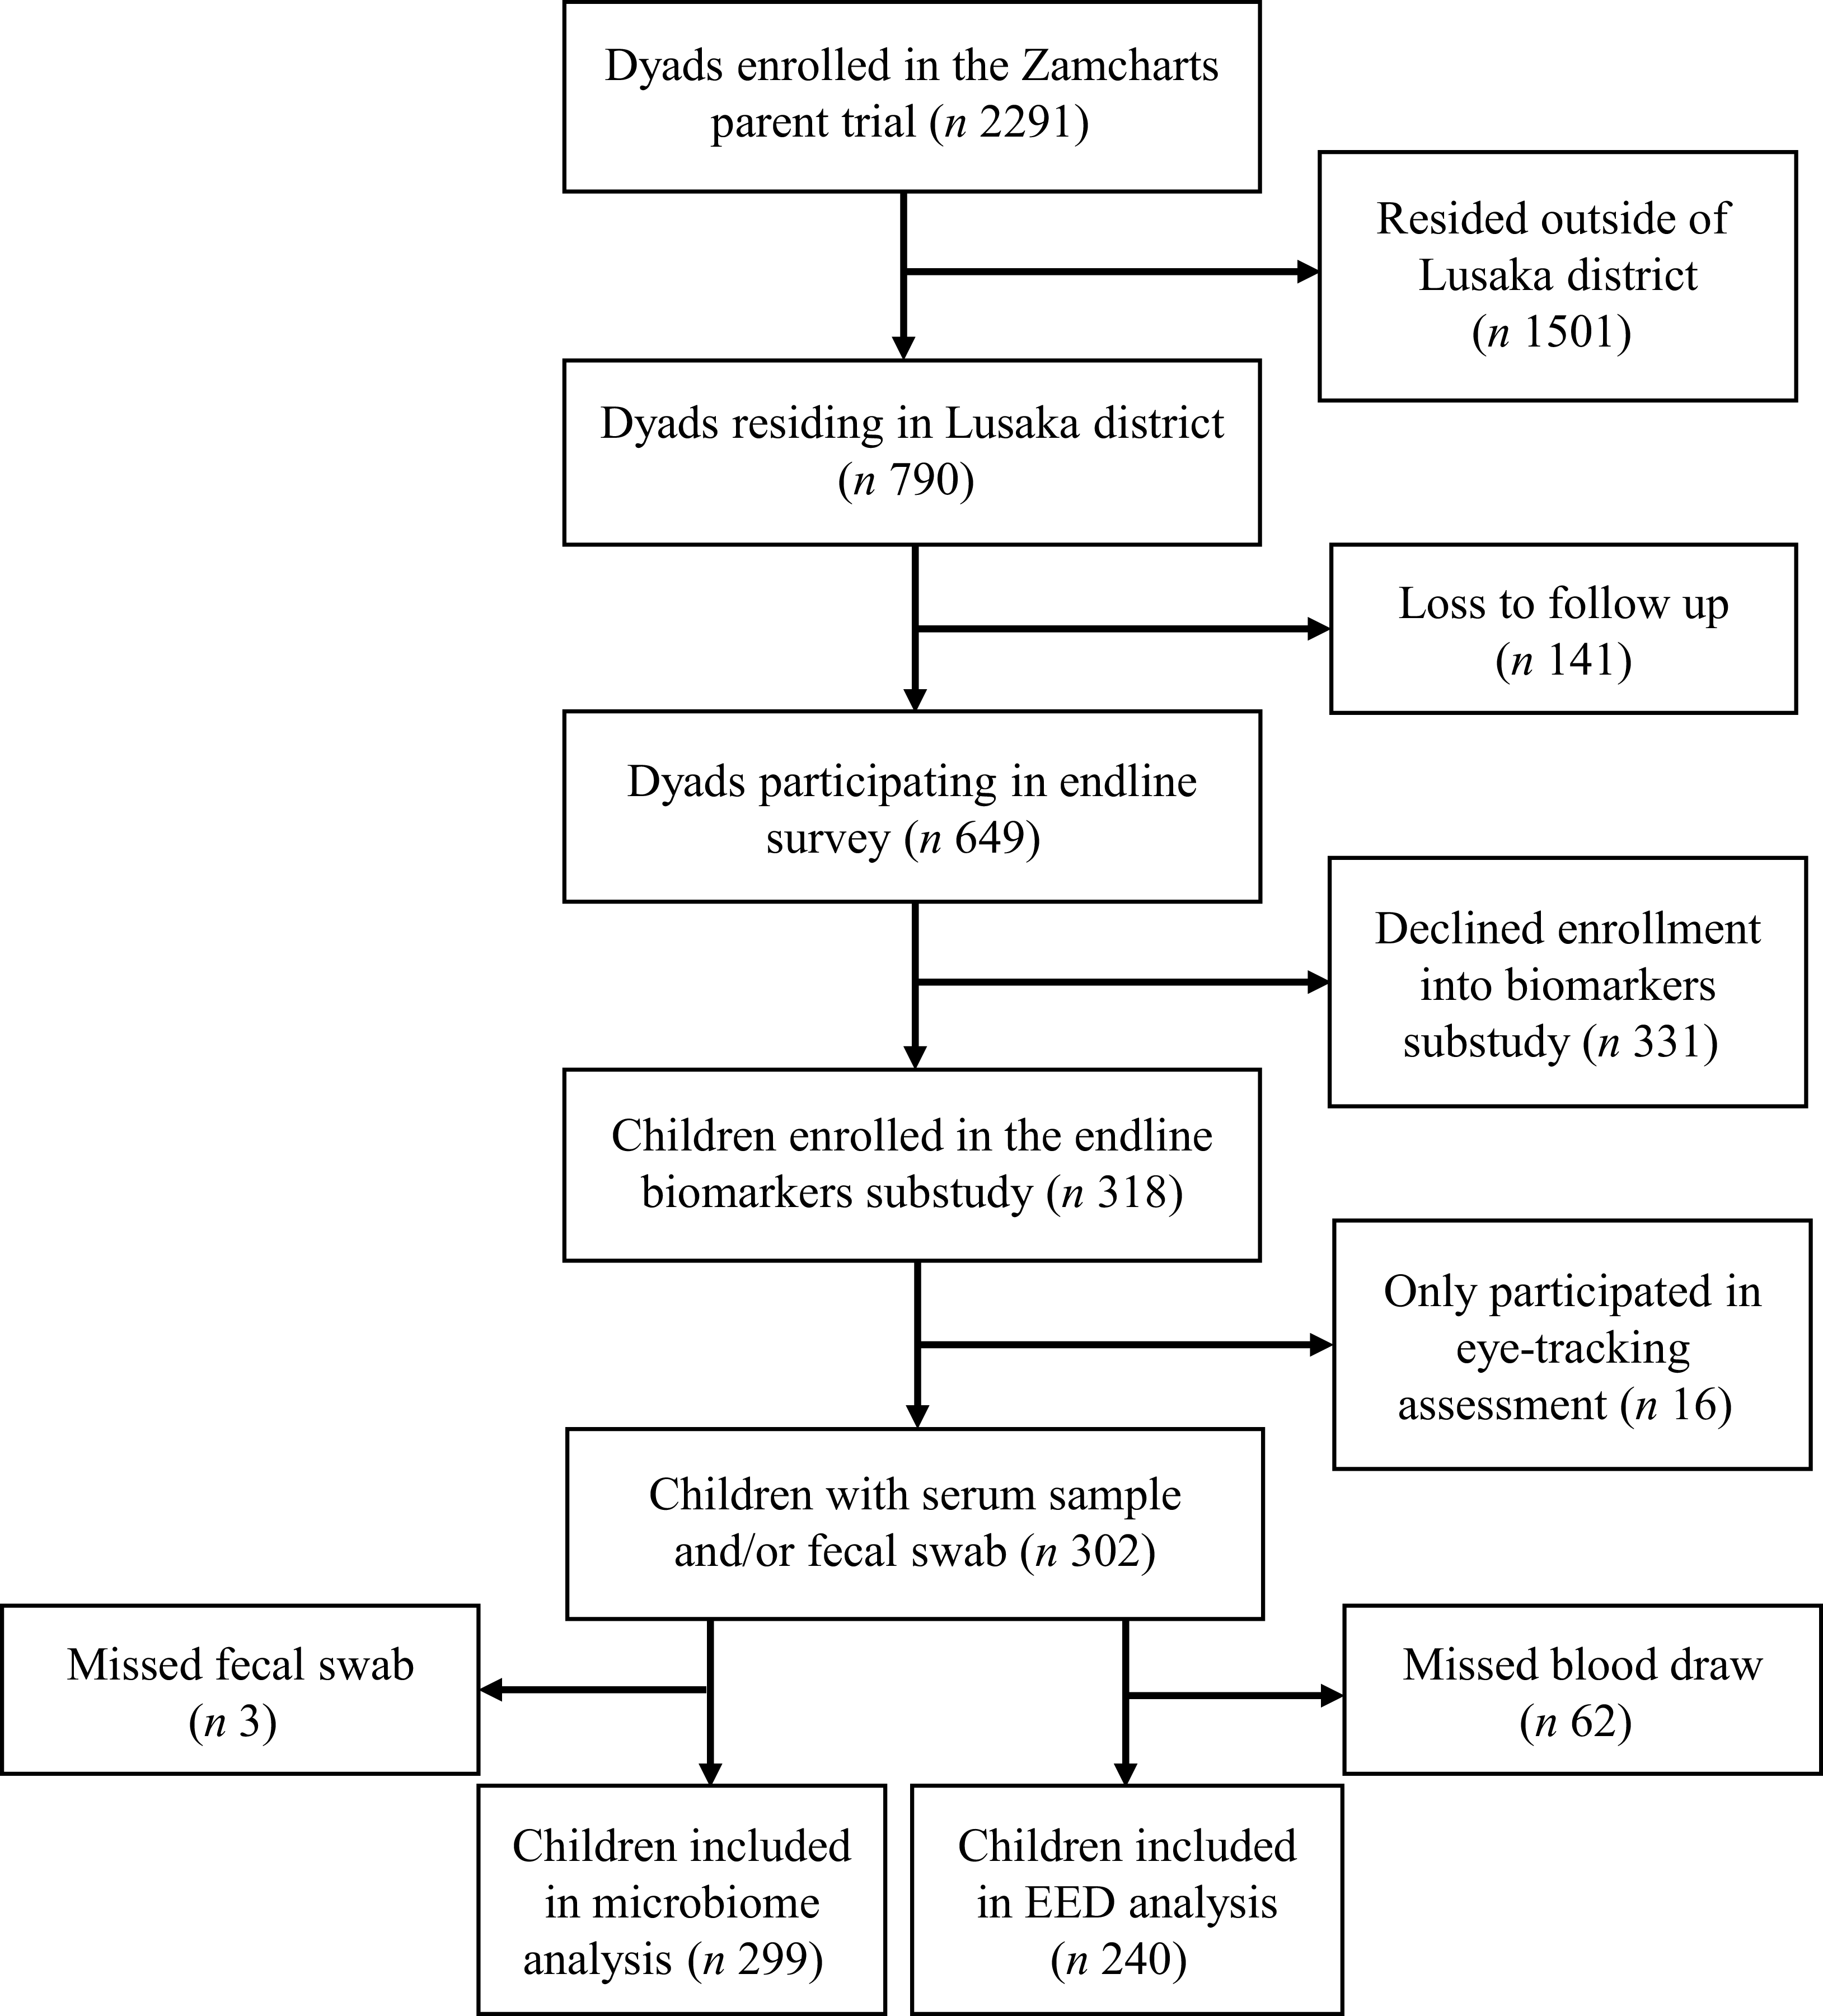
Figure 1 presents the flow diagram for this sub-study. A total of 2291 caregiver–child dyads were enrolled in the parent trial, including 790 from Lusaka district. At endline, 649 caregiver–child dyads from Lusaka district participated in the survey, of whom 318 were enrolled in the biomarker sub-study. Overall, 302 children from seventy-nine clusters (mean cluster size = 3·82) were included in these analyses. Among these, 240 were included in the analyses of EED and inflammation biomarkers and 299 were included in the microbiome analyses. The relatively low uptake of the biomarker sub-study may be attributable to the additional participant burden associated with study procedures, including venous blood draws and rectal swab collection. Notably, however, no statistically significant differences in baseline characteristics were observed among children from Lusaka district who participated in the biomarker sub-study compared with children from Lusaka district who did not participate (online Supplementary Table 1).
Flow diagram for study.

A sample size of 240 provides ∼96 % power to detect a medium effect size (Cohen’s d = 0·5) in serum EED biomarker concentrations between groups at a two-sided significance level of 0·05, assuming a two-sample comparison (G * Power software), corresponding to a difference of approximately half a standard deviation between groups(Reference Cohen47). A simulation-based power analysis for the beta diversity endpoint was also conducted using the micropower R package(Reference Kelly, Gross and Bittinger48). In this case, sample size of 299 provides 80 % power to detect an effect as small as an ω2 of 0·0082 and 90 % power to detect an ω2 of 0·0115 using weighted Jaccard distance.
Baseline characteristics of study participants
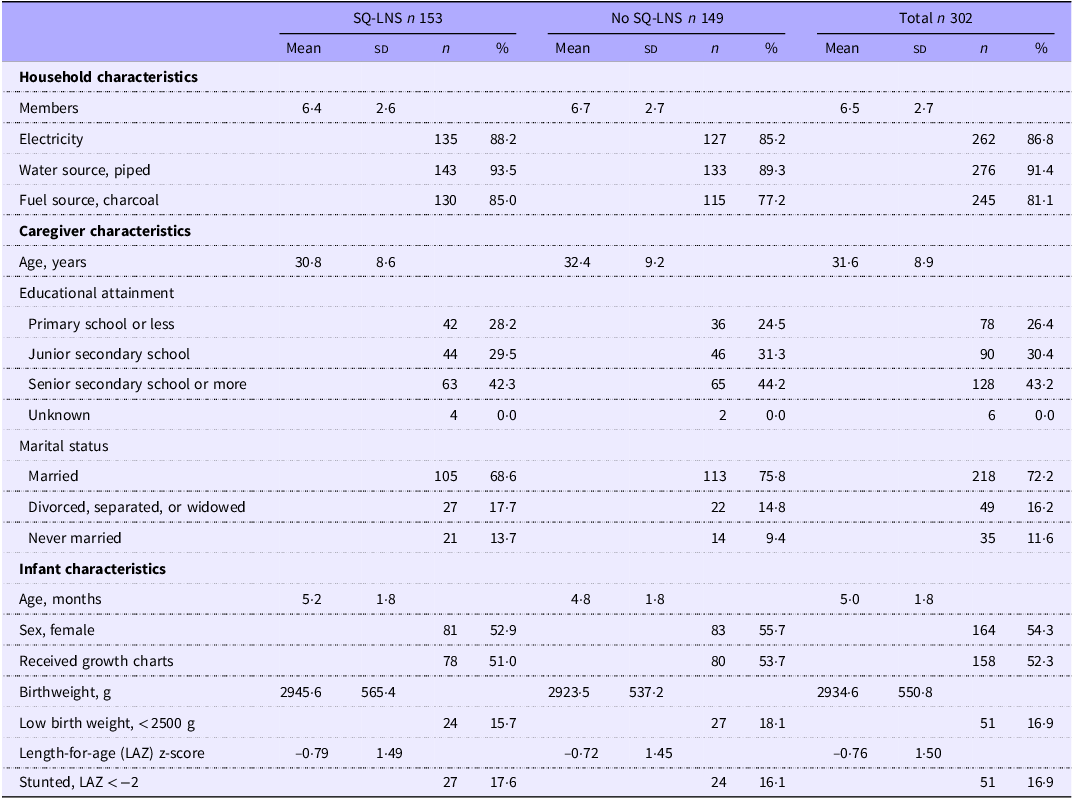
Table 1 summarises baseline characteristics of the 302 Zambian children, both overall and by SQ-LNS assignment. The majority of households had electricity (∼87 %), piped water (∼91 %) and used charcoal for fuel (∼81 %). Caregivers were on average ∼32 years old, ∼72 % were married and ∼74 % had attended some secondary or higher education. Just over half (∼54 %) of children were female, ∼17 % were born low birth weight and ∼17 % were stunted at baseline, or at ∼5 months of age.
Baseline characteristics of 302 young Zambian children by SQ-LNS assignment *

Table 1. Long description
The table compares household and caregiver characteristics of Zambian children by SQ-LNS assignment. It has 15 rows and 12 columns. The columns are labeled as follows: SQ-LNS n 153, No SQ-LNS n 149, and Total n 302. Each of these columns is further divided into Mean, SD, n, and % sub-columns. The rows are grouped into Household characteristics, Caregiver characteristics, and Infant characteristics. Household characteristics include Members, Electricity, Water source (piped), and Fuel source (charcoal). Caregiver characteristics include Age (years), Educational attainment (Primary school or less, Junior secondary school, Senior secondary school or more, Unknown), and Marital status (Married, Divorced, separated, or widowed, Never married). Infant characteristics include Age (months), Sex (female), Received growth charts, Birthweight (g), Low birth weight (<2500 g), Length-for-age (LAZ) z-score, and Stunted, LAZ < -2. Each row provides data for the respective characteristic under the columns SQ-LNS n 153, No SQ-LNS n 149, and Total n 302.
SQ-LNS, small-quantity lipid-based nutrient supplements.
* Values are mean (sd) or n (%).
Effect of small-quantity lipid-based nutrient supplements on intestinal health
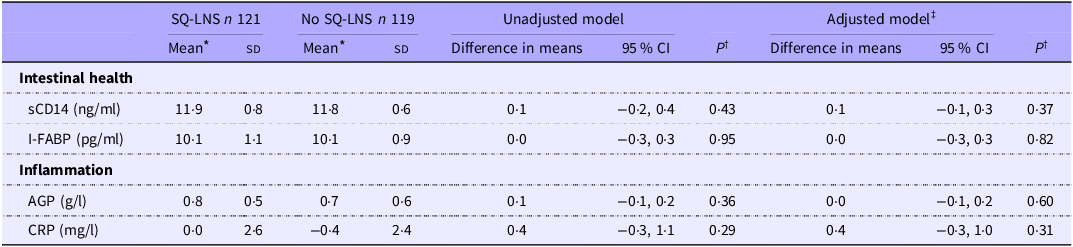
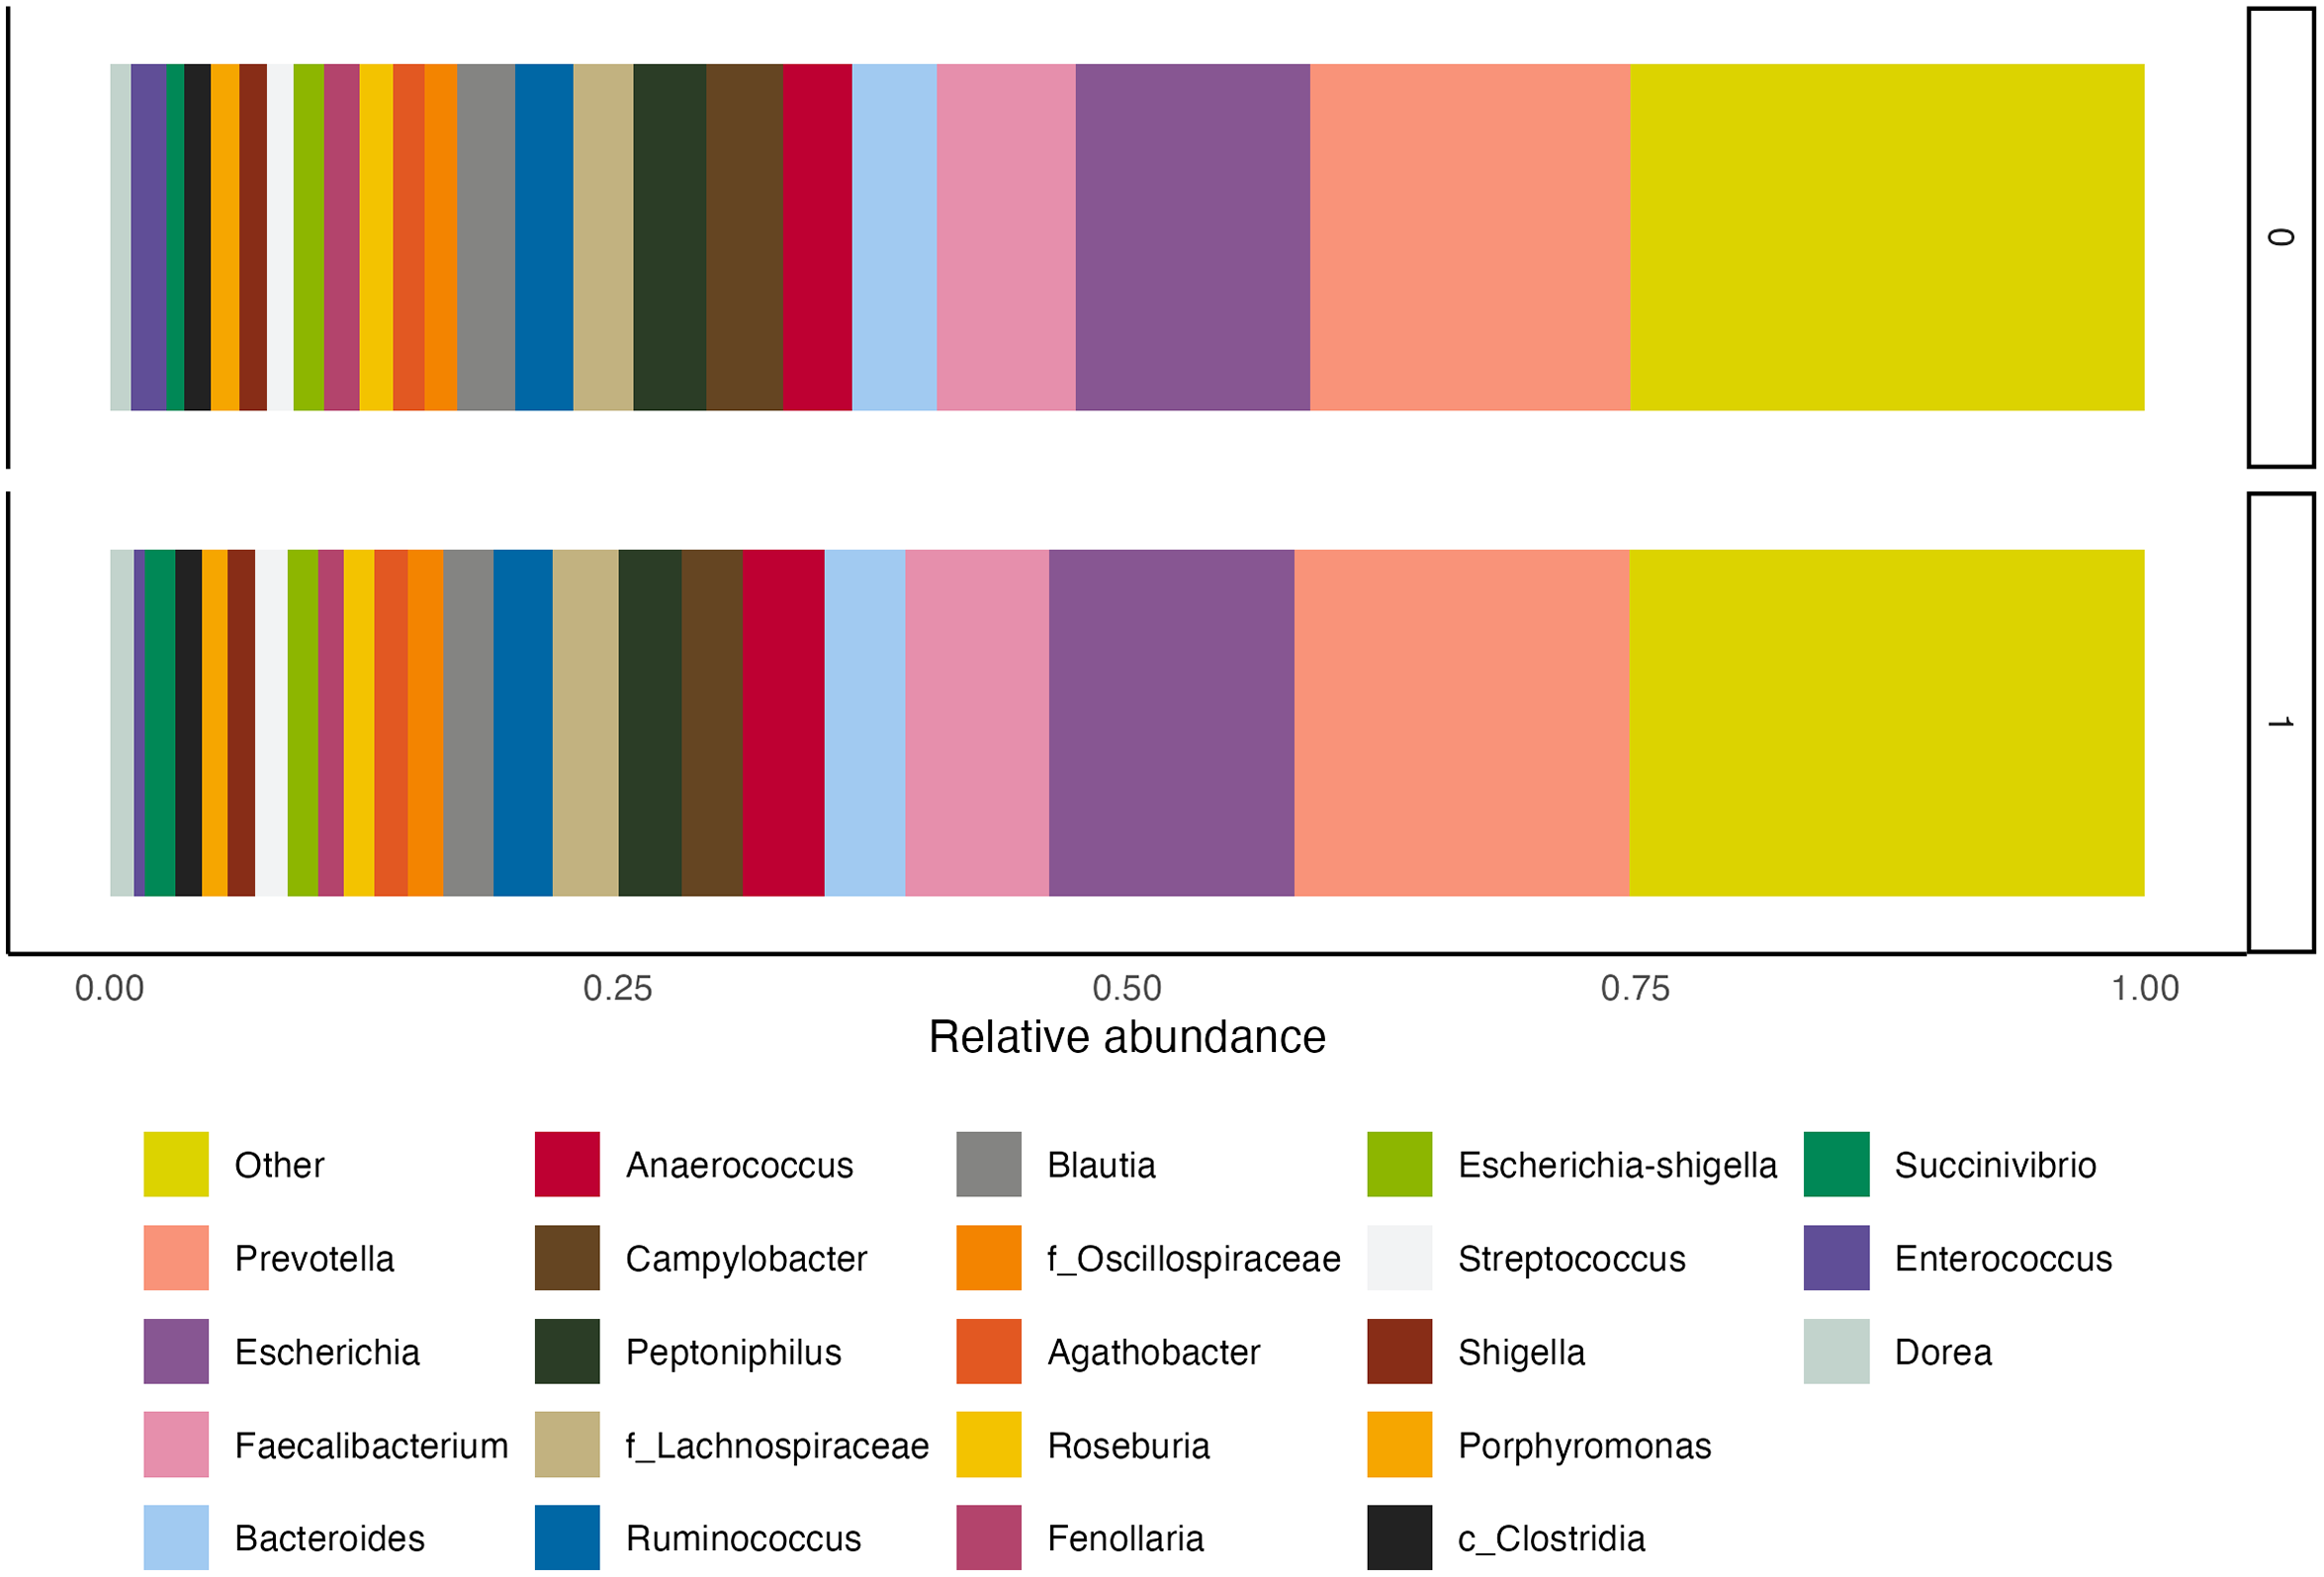
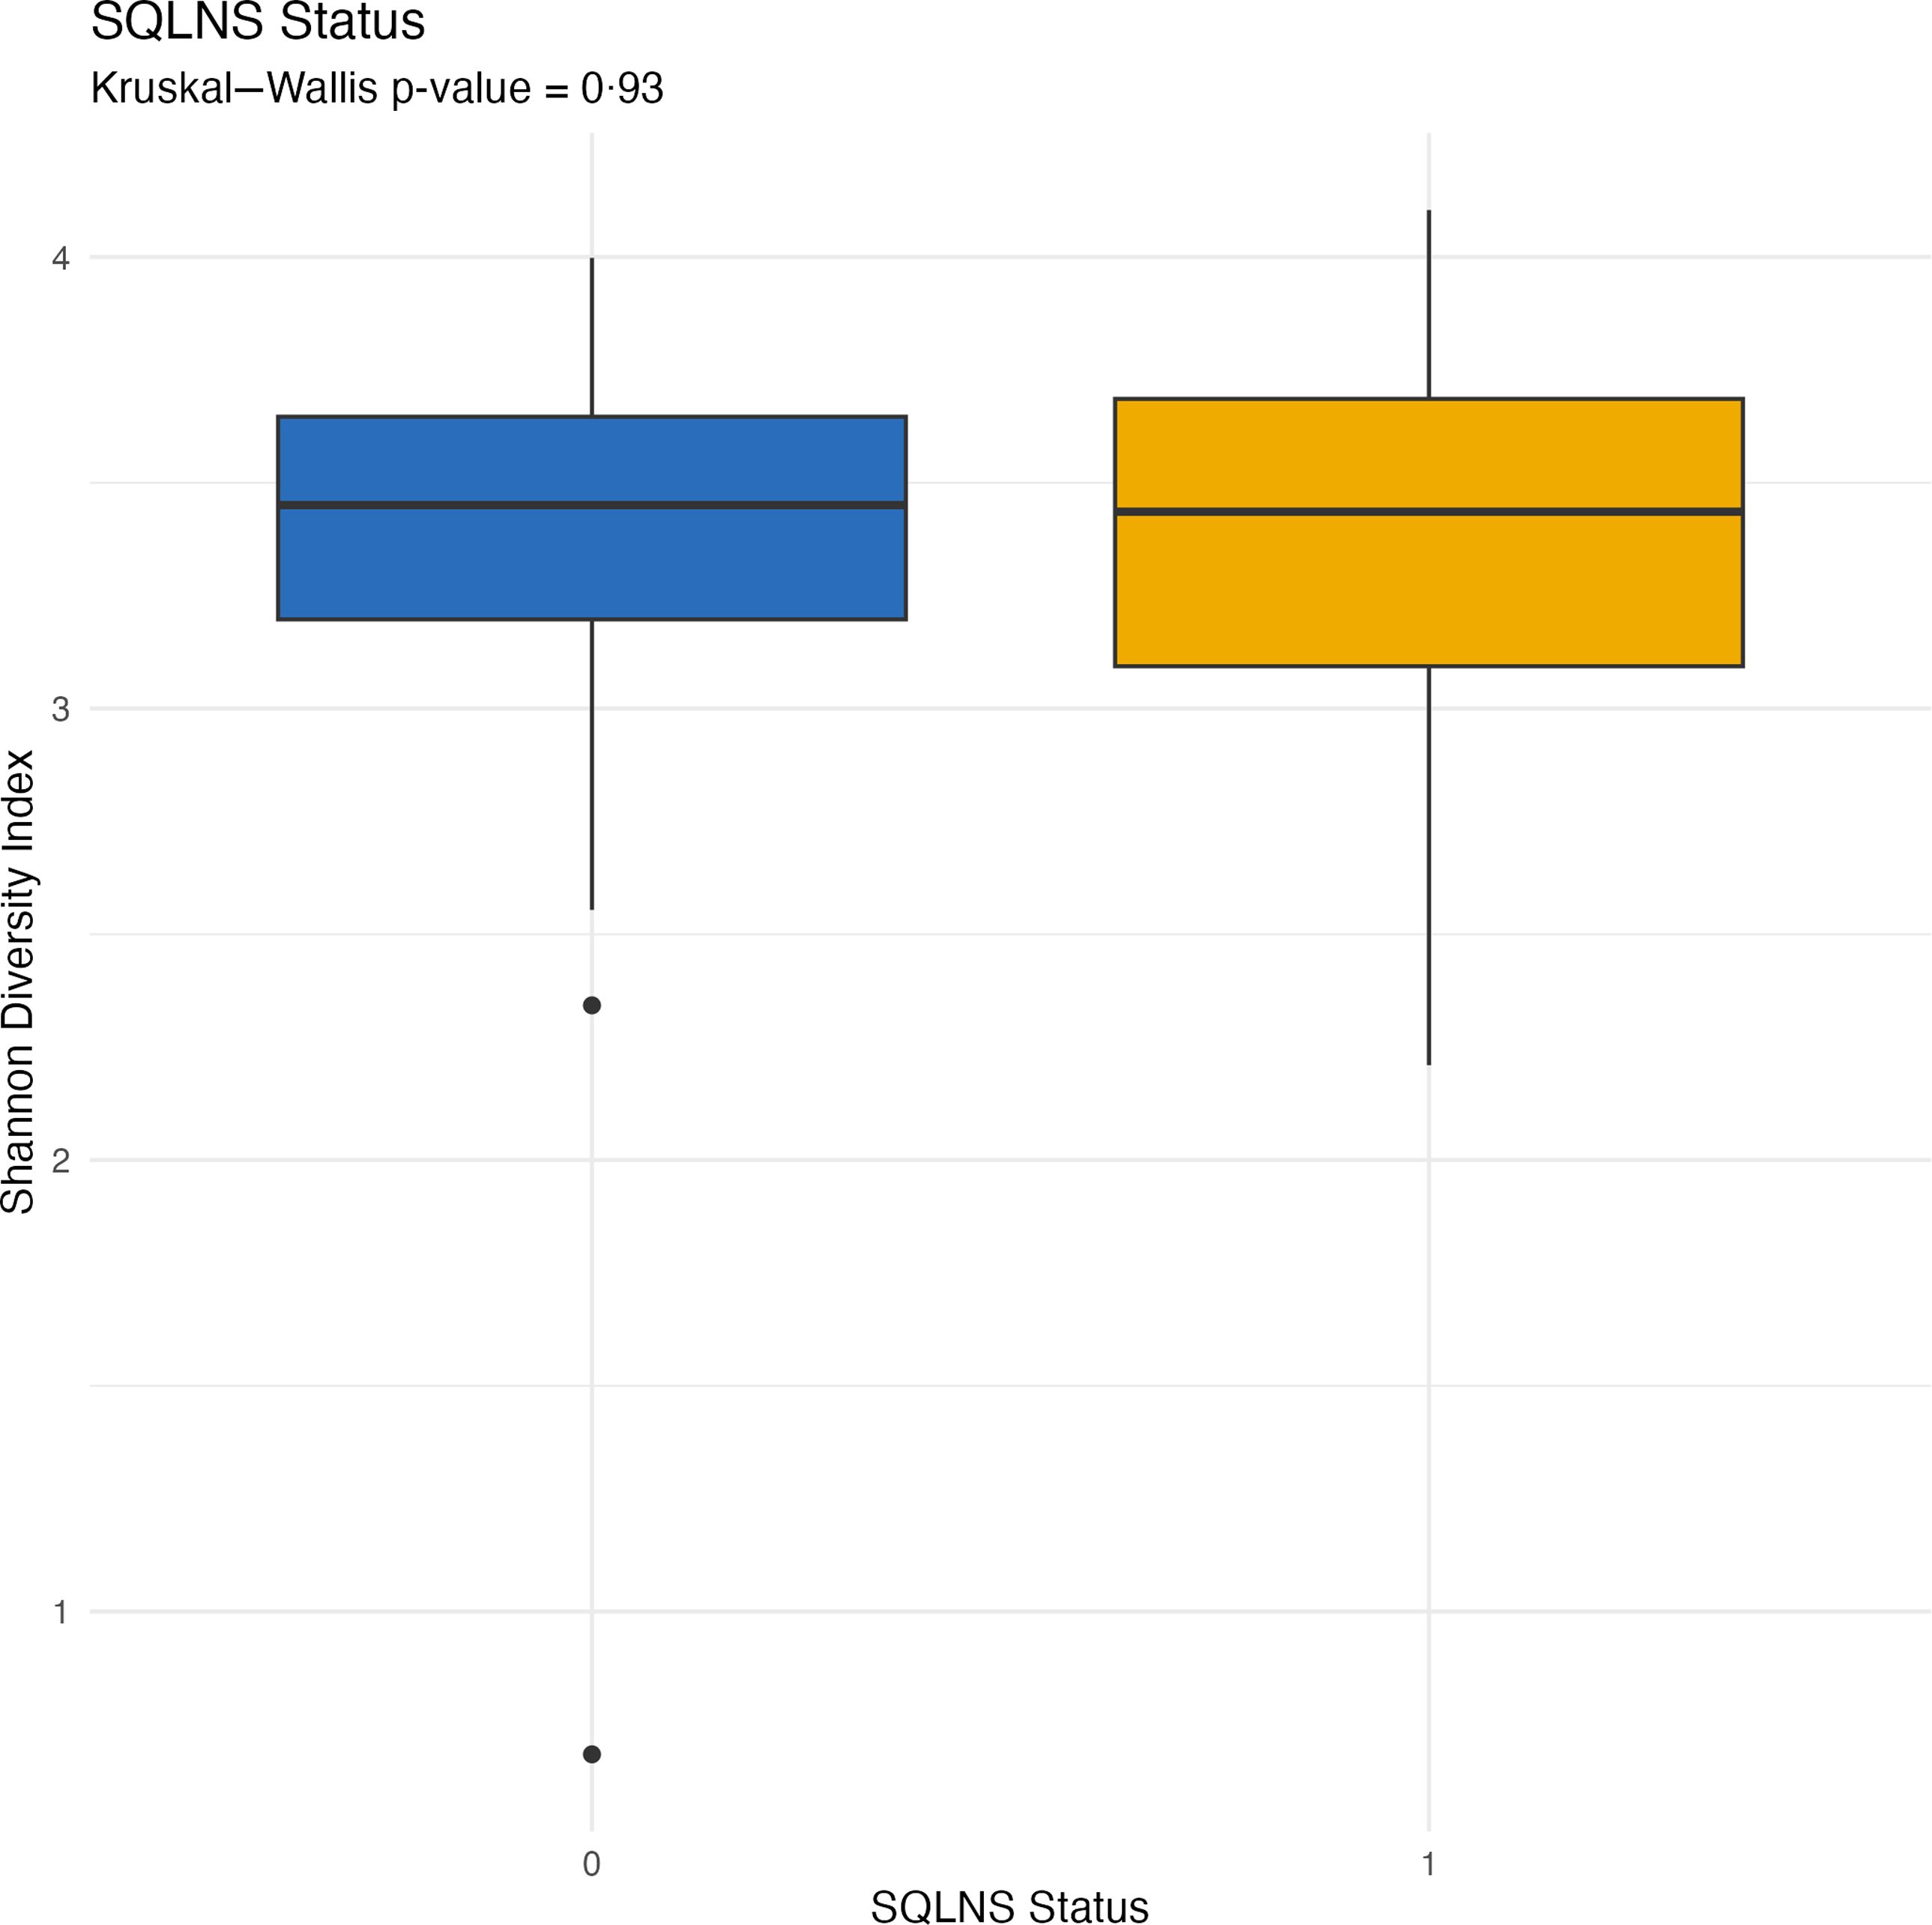
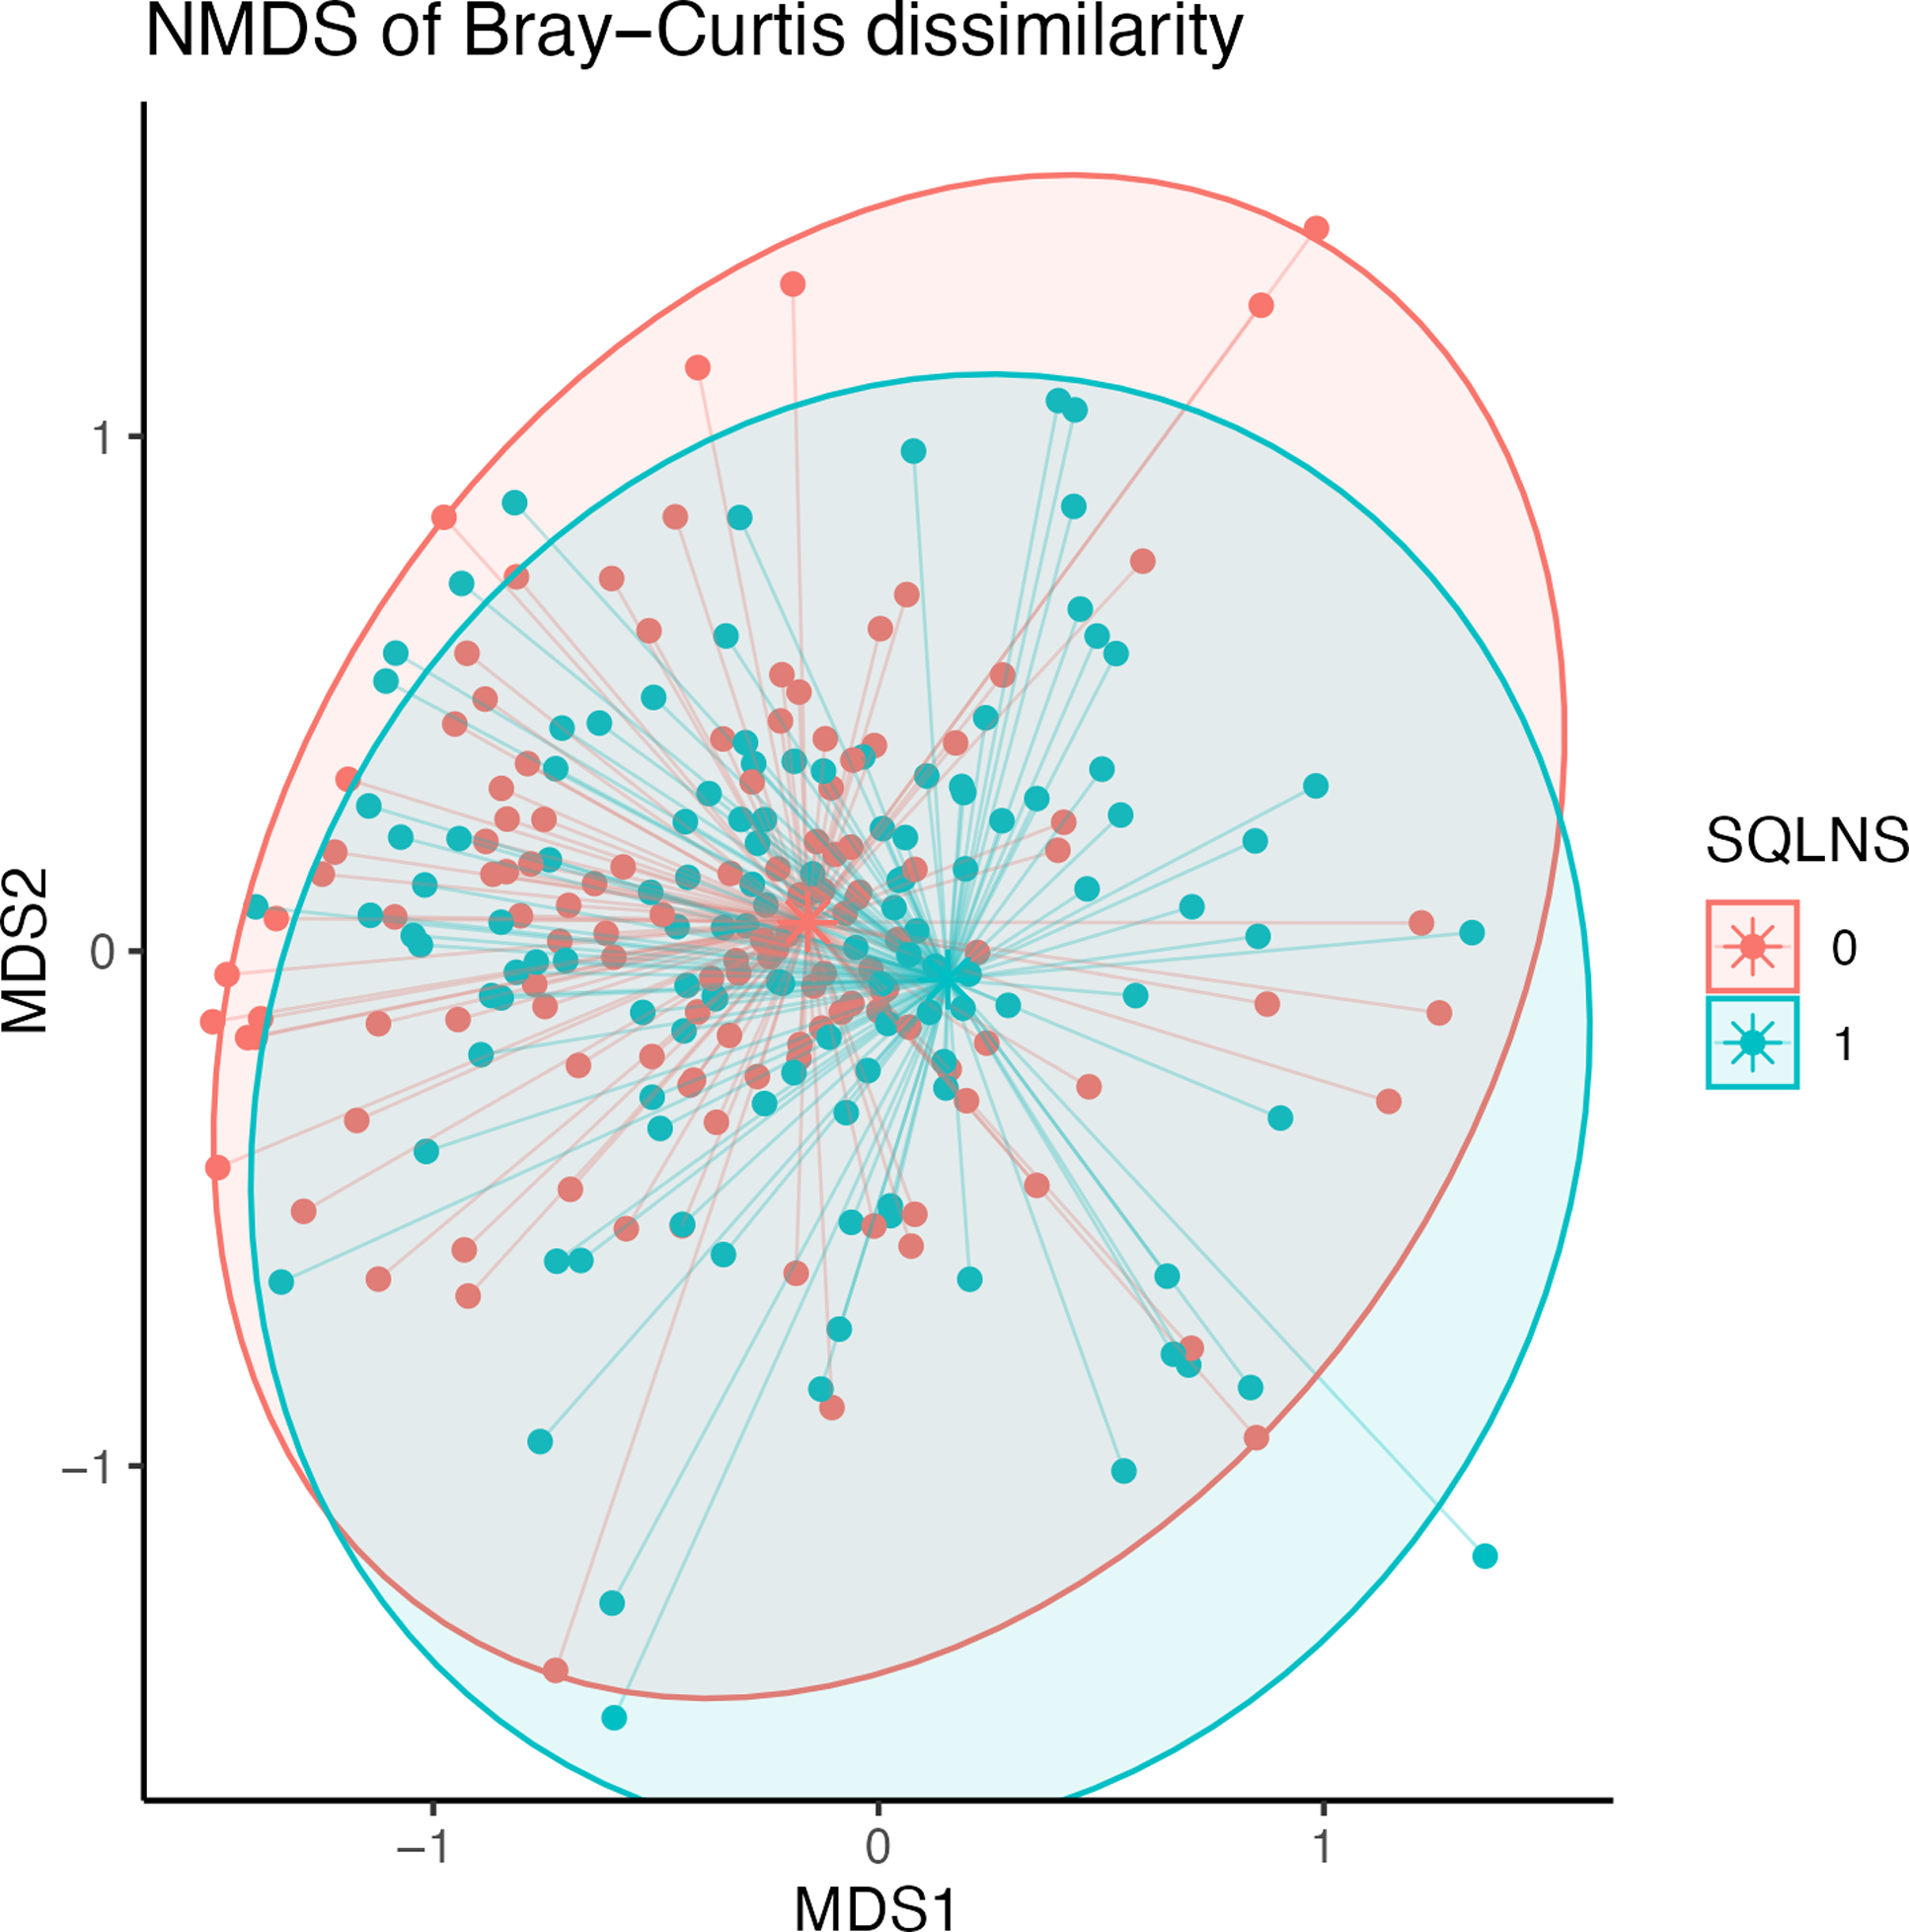
At endline, children were, on average, 30·7 (sd 1·8) months of age. Among those assigned to receive SQ-LNS, ∼73 % of caregivers reported provision of SQ-LNS to their children for at least 12 months at the endline survey. Overall, no statistically significant differences in biomarkers of EED (sCD14, I-FABP) or inflammation (AGP, C-reactive protein) were observed by SQ-LNS assignment (Table 2). The genus-level composition of the gut microbiome was similar between groups (Figure 2). Stacked bar plots indicated that Prevotella, Escherichia, Faecalibacterium, Bacteroides and other common genera were dominant across all groups, with no notable differences in relative abundance between treatment arms. As shown in Figure 3, α diversity, measured by the Shannon diversity index, also did not differ significantly by SQ-LNS assignment (Kruskal–Wallis test: P = 0·93). Finally, the non-metric multidimensional scaling plot revealed substantial overlap between groups, with no distinct clustering by SQ-LNS assignment. Betadisper analysis confirmed homogeneous within-group variation, and PERMANOVA indicated a non-significant trend (P = 0·092) (Figure 4). Cluster membership did not significantly explain Bray–Curtis community composition (F = 0·996, P = 0·56). PERMANOVA F < 1 suggests that the between-cluster variance is smaller than the within-cluster variance, suggesting no meaningful clustering effect on gut microbiome community.
Effects of SQ-LNS on biomarkers of EED and inflammation

Table 2. Long description
The table compares biomarkers of intestinal health and inflammation between two groups: SQ-LNS and No SQ-LNS. It has 6 rows and 9 columns. The columns are labeled as follows: SQ-LNS n 121, No SQ-LNS n 119, Unadjusted model, and Adjusted model. The rows are labeled with biomarkers: sCD14 (ng/ml), I-FABP (pg/ml), AGP (g/l), and CRP (mg/l). Each row provides the mean and standard deviation for both groups, the difference in means, and the 95% confidence interval for both the unadjusted and adjusted models. Row 1: sCD14 (ng/ml), SQ-LNS Mean 11.9, SD 0.8, No SQ-LNS Mean 11.8, SD 0.6, Unadjusted model Difference in means 0.1, 95% CI -0.2, 0.4, P 0.43, Adjusted model Difference in means 0.1, 95% CI -0.1, 0.3, P 0.37. Row 2: I-FABP (pg/ml), SQ-LNS Mean 10.1, SD 1.1, No SQ-LNS Mean 10.1, SD 0.9, Unadjusted model Difference in means 0.0, 95% CI -0.3, 0.3, P 0.95, Adjusted model Difference in means 0.0, 95% CI -0.3, 0.3, P 0.82. Row 3: AGP (g/l), SQ-LNS Mean 0.8, SD 0.5, No SQ-LNS Mean 0.7, SD 0.6, Unadjusted model Difference in means 0.1, 95% CI -0.1, 0.2, P 0.36, Adjusted model Difference in means 0.0, 95% CI -0.1, 0.2, P 0.60. Row 4: CRP (mg/l), SQ-LNS Mean 0.0, SD 2.6, No SQ-LNS Mean -0.4, SD 2.4, Unadjusted model Difference in means 0.4, 95% CI -0.3, 1.1, P 0.29, Adjusted model Difference in means 0.4, 95% CI -0.3, 1.0, P 0.31.
AGP, alpha-1-acid glycoprotein; CRP, C-reactive protein; EED, environmental enteric dysfunction; I-FABP, intestinal fatty acid-binding protein; sCD14, soluble CD14; SQ-LNS, small-quantity lipid-based nutrient supplements.
* Biomarkers are mean (sd) of log2-transformed biomarkers.
† P values obtained from ordinary least squares regression models with cluster-robust standard errors.
‡ Adjusted model controls for select baseline characteristics, including child age, child sex, child birthweight, caregiver age, caregiver education level and assignment to home-installed growth charts.
Genus-level relative abundance stacked bar plot by SQ-LNS assignment. SQ-LNS, small-quantity lipid-based nutrient supplements.

Boxplots of Shannon diversity index illustrating alpha diversity by SQ-LNS assignment. SQ-LNS, small-quantity lipid-based nutrient supplements.

Non-metric multidimensional scaling (NMDS) biplot.

Sensitivity and exploratory analyses
No statistically significant differences in biomarkers of EED (sCD14, I-FABP) or inflammation (AGP, C-reactive protein) were observed by SQ-LNS assignment among children who adhered to the intervention protocol (online Supplementary Table 2) or among those who were stunted at baseline (online Supplementary Table 3). Differences by SQ-LNS assignment in these sub-groups were also not observed for genus-level composition of the gut microbiome (online Supplementary Figure 1 and Figure 2) or for α diversity (online Supplementary Figure 3 and Figure 4). As shown in online Supplementary Figure 5, among children who adhered to the intervention protocol, PERMANOVA indicated a significant difference in beta diversity by SQ-LNS assignment (P = 0·039), though non-metric multidimensional scaling ordination plots across all dimension combinations revealed substantial overlap by SQ-LNS assignment. Among children who were stunted at baseline, PERMANOVA (P = 0·588) indicated no differences (online Supplementary Figure 6).
DESeq2 identified Enterococcus as the sole significantly differentially abundant genus (log2 fold change = –2·30, P_adj = 4·3 × 10−10), with lower relative abundance in the SQ-LNS group. This finding was replicated among children who adhered to the intervention protocol with a larger effect size (log2 fold change = –2·84, P_adj = 4·0 × 10−13). ANCOM-II matched the Enterococcus finding at a relaxed detection threshold (W = 16, detected at 0·7), while LEfSe did not identify any significant features in any comparison. No differentially abundant genera were identified among children who were stunted at baseline by any method.
Discussion
In this secondary analysis of a randomised controlled trial, we evaluated the effect of SQ-LNS on intestinal health, including gut microbiome composition and diversity, as well as serum biomarkers of EED and inflammation, among urban Zambian children aged 27–35 months. Overall, in a sample of 302 children with available data, 18 months of SQ-LNS supplementation was not associated with changes in EED or inflammation biomarkers and was not associated with differences in gut microbiome alpha diversity, beta diversity or overall microbial community composition. These results were consistent across examined sub-groups, including children who adhered to the intervention protocol and those who were stunted at baseline.
Notably, exploratory differential abundance analyses identified a lower relative abundance of Enterococcus among children receiving SQ-LNS. This finding was also observed among children who adhered to the intervention protocol and was supported by DESeq2 and, to a lesser extent, ANCOM-II, although it was not identified by LEfSe. However, because this finding emerged from exploratory analyses and was not accompanied by broader changes in community structure, diversity or biomarkers of EED and inflammation, its biological significance remains uncertain and thus should be interpreted cautiously.
Our finding that SQ-LNS supplementation had no effect on examined biomarkers of EED is consistent with the majority of studies that have examined this question. Among children in rural Malawi, fecal biomarkers of EED, including calprotectin, and regenerating 1B protein, and α-1-antitrypsin, did not differ between the SQ-LNS and control groups at 18 months of age, after 12 months of supplementation(Reference Liu, Ashorn and Chingwanda23). Similarly, among children in rural Zimbabwe participating in the Sanitation Hygiene Infant Nutrition Efficacy trial, there was little evidence of an effect of SQ-LNS across a range of fecal and plasma biomarkers of EED(Reference Gough, Moulton and Mutasa25). Finally, among children in rural Bangladesh participating in the WASH Benefits trial, SQ-LNS provided for 18 months between 6 and 24 months of age reduced intestinal inflammation (neopterin) at 14 months of age but increased intestinal inflammation (myeloperoxidase) and permeability (α-1-antitrypsin) at 28 months of age(Reference Lin, Ali and Arnold24).
Our findings of no broad changes in microbiome composition or diversity are also consistent with previous studies. In the Lungwena Child Nutrition Intervention Study (LCNI-5), the provision of SQ-LNS did not alter the gut microbiome at 18 months of age, after 12 months of supplementation(Reference Dubin and Pamer49), and more detailed analysis of Bifidobacterium composition also revealed no effect(Reference Aakko, Grześkowiak and Asukas27). In contrast, the International Lipid-based Nutrient Supplements DYAD (iLiNS-DYAD) trial, also conducted in Malawi, reported that provision of SQ-LNS during the prenatal and postnatal periods increased gut microbiota diversity in children at 18 months of age, after 12 months of child supplementation, but did not influence microbiota maturation(Reference Kamng’ona, Young and Arnold28).
Several mechanisms may explain the lack of observed effect of SQ-LNS on intestinal health. Although SQ-LNS provide essential fatty acids and micronutrients with the potential to influence intestinal health, supplementation alone may be insufficient to counteract the effects of sustained pathogen exposure and recurrent enteric infections during early childhood. Furthermore, by 27–35 months of age, the gut microbiome is relatively stable and may therefore be less responsive to nutritional interventions, including SQ-LNS. Finally, SQ-LNS are not specifically formulated to modulate microbial communities, unlike emerging microbiome-directed complementary foods, which may further explain the absence of detectable effects.
Notably, however, the aforementioned findings may be viewed positively. Micronutrient supplementation, particularly Fe, has, in some cases, been shown to negatively affect the developing gut microbiota by reducing beneficial commensal bacteria and promoting a more pathogenic microbial profile, changes that are often accompanied by increased gut inflammation(Reference Paganini and Zimmermann29). Therefore, the absence of detectable disruption in microbial community structure in our study suggests that SQ-LNS supplementation does not adversely affect gut microbial ecology in this population.
Although no differences were observed in overall microbial composition or diversity, exploratory analyses identified Enterococcus as significantly less abundant among children receiving SQ-LNS. Enterococcus is a diverse genus that includes commensal species as well as opportunistic pathogens, some associated with intestinal inflammation, antibiotic resistance and dysbiosis in vulnerable populations(Reference Dubin and Pamer49,Reference Krawczyk, Wityk and Gałęcka50) . While species-level resolution and microbial function were not assessed in this study, the observed reduction does not suggest harm and may reflect a modest shift away from taxa associated with intestinal stress.
Several strengths and limitations should be acknowledged. With regard to strengths, this sub-study was nested within a large, well-designed randomised controlled trial with high rates of adherence and balanced baseline characteristics across study groups. This design enhanced internal validity and enabled us to draw valid inferences regarding the effects of SQ-LNS on the intestinal health of young Zambian children. Furthermore, the extended intervention period of 18 months allowed for assessment of sustained supplementation effects during a critical window of child growth and microbiome development. Finally, the inclusion of both EED biomarkers and microbiome analyses enabled a more comprehensive assessment of intestinal health than previous studies, which have typically examined only one.
With regard to limitations, this sub-study included only children 27–35 months of age from urban Lusaka district, where electricity and piped water were nearly ubiquitous, limiting the external validity of our results. Additionally, only about half of the caregiver–child dyads from Lusaka district participated in the sub-study, and the sample size for EED analyses was further reduced due to attrition from the blood draw component. However, the final sample size remained adequately powered to detect moderate effect sizes, and baseline characteristics were comparable between groups, strengthening internal validity despite reduced participation. Furthermore, our assessment of EED was limited to sCD14 and I-FABP, which serve as indicators of microbial translocation and epithelial damage, respectively, in addition to two measures of systemic inflammation (AGP, C-reactive protein). However, as EED is a complex, multifactorial condition involving additional domains (e.g. intestinal permeability, intestinal inflammation and structural changes)(Reference Harper, Mutasa and Prendergast10), there was limited ability to fully capture the spectrum of EED and detect intervention effects.
In conclusion, this sub-study contributes to understanding the biological pathways through which nutritional interventions, particularly SQ-LNS, may influence child growth and developmental outcomes. Importantly, we found no evidence of adverse effects of SQ-LNS on intestinal health. While SQ-LNS was not associated with changes in overall gut microbial composition, diversity or biomarkers of EED and inflammation, exploratory analyses identified a lower relative abundance of Enterococcus among supplemented children. Overall, our findings suggest that the benefits of SQ-LNS may be mediated through mechanisms other than improvements to intestinal health, such as nutritional and metabolic pathways. Future studies incorporating metagenomic sequencing and functional profiling may help elucidate whether SQ-LNS influences specific microbial taxa and whether such changes have implications for child health.
Supplementary material
For supplementary material/s referred to in this article, please visit https://doi.org/10.1017/S0007114526107818
Acknowledgements
None.
The parent trial was funded by Sint Antonius Stichting (D.P., G.F., P.C.R.). The endline biomarker sub-study was funded by Child Relief International (CRI) Foundation (D.P., G.F., P.C.R.). Funders had no role in the design, analysis or writing of this article.
J. M. L.: Conceptualisation-Equal, Formal analysis-Equal, Writing – original draft-Lead; Y. L.: Formal analysis-Equal, Writing – review & editing-Equal; M. C.: Project administration-Equal; S. H.: Project administration-Equal; D. P.: Conceptualisation-Equal, Funding acquisition-Equal; K. C.: Investigation-Equal; A. M.: Investigation-Equal; G. F.: Conceptualisation-Equal, Funding acquisition-Equal, Writing – review & editing-Equal; P. C. R.: Conceptualisation-Equal, Funding acquisition-Equal, Writing – review & editing-Equal; L. M. L.: Conceptualisation-Equal, Writing – review & editing-Equal.
The authors declare no conflicts of interest.


 Open access

