

Asia has become the epicentre of type 2 diabetes (T2D)( Reference Yoon, Lee and Kim 1 ), predominantly because of the consumption of carbohydrate-rich and high-glycaemic-index (GI) diets. The consumption of white rice, a major carbohydrate staple in Asian diet, has been linked to rise in T2D in this region( Reference Fitzgerald, McCouch and Hall 2 , Reference Hu, Pan and Malik 3 ). In addition, Asians have a unique phenotype that makes them more susceptible to diabetes compared with Caucasians( Reference Hu 4 ). Asian populations have a high prevalence of pre-diabetes, impaired fasting glucose, impaired glucose tolerance and a more rapid progression to diabetes( Reference Katulanda, Constantine and Mahesh 5 – Reference Yang, Lu and Weng 7 ). The transition and severity of pre-diabetes to diabetes is more marked in this population. It has been estimated that, by 2025, the prevalence of T2D will continue to increase from 4 to 5·4 %( Reference Fall 8 ).
Although the prevalence of T2D is rising rapidly in Asia and worldwide, making a few lifestyle changes such as eating healthy diets can markedly lower the chances of developing pre-diabetes and diabetes. It is well known that white rice elicits a relatively large glycaemic response (GR) and is thus associated with impaired glucose tolerance( Reference Sun, Spiegelman and van Dam 9 ). On the other hand, there is growing evidence that the consumption of low-GI diets minimises blood glucose excursions, thus helping in the management and prevention of diabetes and pre-diabetes( Reference Foster-Powell, Holt and Brand-Miller 10 ). It could therefore be hypothesised that devising simple culinary procedures to reduce the GR of rice is beneficial for those with diabetes and pre-diabetes in Asia. Dietary interventions are the most effective and economical methods in diabetes management and prevention compared with drug-based therapy( Reference Kelley 11 ).
There is an increased interest in the use of food ingredients and components such as β-glucan, galactomannan and isomaltulose to lower GR of carbohydrate-rich foods( Reference Cavallero, Empilli and Brighenti 12 – Reference Sharma 14 ). Besides these functional food components, dietary proteins have recently attracted considerable interest, not only because protein is the principle macronutrient involved in all structural units of the body but also because high-protein diets have been shown to be beneficial in affecting blood glucose, blood pressure, heart health and CVD( Reference Appel 15 , Reference Erdman 16 ). Previous studies have shown a reduction in postprandial glucose response when proteins and carbohydrates were co-ingested compared with the uptake of carbohydrates alone in both normal individuals( Reference Krezowski, Nuttall and Gannon 17 ) and in patients with T2D( Reference Gannon, Nuttall and Neil 18 , Reference Nuttall, Mooradian and Gannon 19 ). However, the metabolic effects of proteins when co-ingested with a carbohydrate were found to be conditional upon their quality and quantity, largely because of the differences in their amino acid composition( Reference Gannon, Nuttall and Lane 20 , Reference Nuttall and Gannon 21 ). It has been demonstrated that amino acids play an important role in insulin secretion and glucose homoeostasis( Reference Newsholme, Brennan and Rubi 22 ). When consumed in combination with carbohydrates, amino acids, including Arg, Pro, Phe, Glu and branched chain amino acids (BCAA), showed greater effects on blood glucose, insulin and glucagon. For example, the consumption of a beverage containing an amino acid mixture, that is, Ile, Leu, Cys, Met and Val, and carbohydrate (100 g dextrose) by healthy overweight subjects significantly increased the plasma glucagon and decreased plasma glucose response compared with the consumption of 100 g of dextrose. There were no differences in insulin responses (IR)( Reference Wang, Kammer and Ding 23 ). In contrast, the amino acid mixture consisting of Leu, Ile, Val, Lys and Thr resulted in similar glycaemic and insulinaemic responses as whey in another study( Reference Nilsson, Holst and Bjorck 24 ).
Given the high intake of white rice in Asia, the development of methods to reduce the GR is imperative in order to avoid the development of pre-diabetes and diabetes. The notable effects of proteins on insulin secretion and glycaemic control prompted us to explore whether commonly consumed proteins in Asia could lower the GR of white rice. The early work on the influence of proteins on carbohydrates was mostly based on feeding graded amounts of protein in the presence of pure glucose( Reference Gannon, Nuttall and Neil 18 , Reference Gannon, Nuttall and Lane 20 ). Our study, in contrast, uses white rice, a widely consumed carbohydrate staple, to determine the glucose-lowering effects of protein in mixed meals, that is, fish, chicken, egg white and soya beancurd. It is generally recognised that Asians consume a composite meal predominantly consisting of rice and at least a protein source and a vegetable. However, the effects of consuming a composite meal comprising protein on postprandial GR cannot be predicted reliably using in vitro studies or predictive models. Thus, the aim of this study was to examine the effects of co-ingesting a protein-rich meal on GR elicited by rice in healthy subjects.
Methods
Test subjects
In all, fifteen healthy Chinese male participants were recruited through advertisements and posters that were placed within the National University of Singapore. Potential participants were briefed on all aspects of the study before informed consent was obtained. Upon obtaining informed consent, participants were tasked to complete a health questionnaire in which details of food allergies/intolerance, metabolic diseases, special dietary needs and smoking habits were acquired. Anthropometric measurements were determined and those who fulfilled all the inclusion criteria (age, 21–40 years; BMI, 18·0–24·9 kg/m2; systolic blood pressure, 110–120 mmHg; diastolic blood pressure, 75–85 mmHg; fasting blood glucose, 4–6 mmol/l; no glucose-6-phosphate dehydrogenase deficiency; not on any prescription medication that affects glucose-related metabolism; non-smoking; no genetic or metabolic diseases) were included in the study. Physical activity was quantified using the questionnaire of Baecke et al.( Reference Baecke, Burema and Frijters 25 ), and only those not participating in competitive and/or endurance sports were included. Before the test day, participants were asked to restrict alcohol and caffeine-containing drinks, as well as to restrict their participation in intense physical activity.
The study was conducted at the Clinical Nutrition Research Centre (CNRC), Singapore Institute for Clinical Sciences (SICS), Singapore. All participants gave written informed consent before starting, and the study was initiated after ethical approval by the Domain Specific Review Board of National Healthcare Group, Singapore. The study was conducted according to the ethical guidelines founded on the Declaration of Helsinki.
Study protocol
The study had a randomised, controlled, non-blind, cross-over design in which participants were required to come for five test sessions on non-consecutive days. Standardised dinner was given to the participants to consume the evening before each test day. All test sessions lasted approximately 4 h and were identical in all aspects except for the test foods consumed. At each test session, participants arrived at CNRC between 08.00 and 09.00 hours following a 10-h overnight fast. An indwelling catheter was inserted into the antecubital fossa upon the participant’s arrival and kept patent. Participants had the option to choose whether they would prefer to apply EMLA cream 5 % at least 60 min (self application at home) before insertion of the catheter to prevent any associated pain. Baseline finger-prick (two baseline values taken 5 min apart) and venous blood samples were collected after the insertion of the catheter. The test meal was consumed within 12 min. During the test sessions, participants were instructed to maintain low physical activity throughout the following 3·5 h of blood sampling (every 15 min for the first hour and every 30 min for the subsequent hours). Working space, free Wi-Fi access and a television were provided for their use. Snacks were given at the end of the test session. Upon completion of all five sessions, they were debriefed and compensated for their time and travel.
Test meals
Five rice-based test meals (including one control meal with rice only) were served with different protein-rich foods: steamed fish fillet, boiled egg white, soya beancurd (taukwa) and chicken breast. All test meals were given in isoglycaemic proportions of 50 g of available carbohydrate and 29·5 g of protein. The control consisting of only rice contained 50 g of available carbohydrate. The nutrient contents of the test meals were analysed using the Kjeldahl method( Reference Chang 26 ) and Soxhlet method( Reference David and Min 27 ) before the start of recruitment of participants (Table 1).
Nutrient composition and serving sizes of the test meals
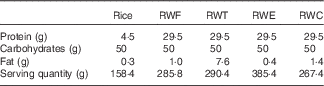
RWF, rice with fish; RWT, rice with soya beancurd (taukwa); RWE, rice with egg white; RWC, rice with chicken.
Preparation and cooking of test meals
All of the meals were freshly prepared in the morning on test days and served to the participants within 30 min of preparation.
White rice (Thai Hom Mali Fragrant Rice) was purchased from a local supermarket (FairPrice NTUC). A quantity of 500 ml of water was boiled before 63·6 g of rice was added. The rice was brought to a boil and was allowed to simmer for 10 min. After cooking, the rice was drained immediately using a sieve and served.
Fresh sea bass (Dicentrarchus labrax) fillet was purchased from a local supermarket (Giant). The fish was filleted and one teaspoon (5 ml) of standard light soya sauce (Tai Hua, FairPrice NTUC) was added. Fish was wrapped in aluminium foil and steamed at 100°C for 10 min. Rice was eventually served with the fish (RWF).
Whole eggs (Seng Choon) were purchased from a local supermarket (FairPrice NTUC). In all, eight eggs were boiled at 100°C for 15 min. One teaspoon of standard light soya sauce was added to the boiled egg whites. Similarly, rice was served with the egg whites (RWE).
Soya beancurd (taukwa) (Fortune) was purchased from a local supermarket (FairPrice NTUC). Soya beancurd (taukwa) was sliced into approximately 0·5-cm cubes and steamed in a bowl with one teaspoon of standard light soya sauce at 100°C for 5 min. Rice was then served with the soya beancurd (taukwa) (RWT).
Fresh chicken breast meat without skin was purchased from a local supermarket (Giant). The chicken was cut into 0·5-cm cubes, and one teaspoon (5 ml) of standard light soya sauce (Tai Hua, FairPrice NTUC) was added. Chicken was wrapped in aluminium foil and steamed at 100°C for 10 min before serving with rice (RWC).
Blood analysis
Blood was obtained by finger-prick using the Accu-Chek sterile single-use lancing device (Abbott). The first two drops of blood expressed were discarded and the next drop was used for testing. Two finger-prick capillary blood samples were obtained for determining blood glucose concentration using the HemoCue 201+RT Glucose analyzer (HemoCue Ltd). In addition, 3 ml of venous blood was collected into Vacutainers (Becton, Dickinson Diagnostics) containing dipotassium EDTA for insulin analysis. A quantity of 3 ml of venous blood was collected into Vacutainers containing dipotassium EDTA that was added with dipeptidyl peptidase-4 inhibitor (Ile–Pro–Ile; Sigma Aldrich) and protease inhibitor (complete, mini, EDTA-free; Roche) for glucagon analysis. Blood samples were separated by centrifugation at 4500 rpm for 10 min at 4°C, and plasma aliquots were stored at −80°C until analysis. Plasma insulin (µIU/ml) was measured using the immunochemistry analyzer COBAS e411 (Roche, HITACHI). Plasma glucagon was analysed using a glucagon EIA kit (RayBiotech).
Data processing and statistical analysis
The total GR over 120 min was expressed as the incremental AUC (iAUC) using the trapezoidal rule ignoring the area beneath the baseline( Reference Allison, Paultre and Maggio 28 , Reference Brouns, Bjorck and Frayn 29 ). The data were converted to ‘the change in GR’. The change in GR was calculated by computing the difference between the blood glucose concentration at a specific time point and mean baseline blood glucose concentration. Similarly, insulin and glucagon data were processed the same way GR data were processed. Statistics were determined by repeated-measures ANOVA, which was Bonferroni-corrected for multiple comparisons. Data are presented as mean values with their standard errors.
The BCAA:essential amino acids (EAA) ratios were calculated by taking the ratio of the total BCAA (Val, Leu and Ile) to individual EAA including Met, His, Lys, Thr, Phe and Trp.
All statistical significance was evaluated at an α-value of 0·05.
Results
Postprandial glycaemic response
The postprandial blood glucose responses to the different test meals showed different temporal profiles (Fig. 1(a)). Although all test meals induced a glucose response that reached a peak at 30 min after consumption, the control meal (rice alone) peaked at 45 min (with incremental blood glucose of 2·56 mmol/l). When expressed as iAUC, RWT showed a statistically significant reduction in glucose response over 120 min compared with the control meal (P<0·05; Fig. 1(b)). However, no significant differences were observed in the other test meals containing protein sources.
(a) Changes in plasma glucose of fifteen healthy male volunteers after consumption of five different test meals: rice (Control, ![]() ), rice with fish (RWF,
), rice with fish (RWF, ![]() ), rice with egg white (RWE,
), rice with egg white (RWE, ![]() ), rice with soya beancurd (taukwa) (RWT,
), rice with soya beancurd (taukwa) (RWT, ![]() ) and rice with chicken (RWC,
) and rice with chicken (RWC, ![]() ), respectively, following the standardised dinner. (b) Net incremental AUC (iAUC) using fasting values as baseline. Values are means, with standard errors represented by vertical bars. * Significantly different when compared with control meal using repeated-measures test: P<0·05.
), respectively, following the standardised dinner. (b) Net incremental AUC (iAUC) using fasting values as baseline. Values are means, with standard errors represented by vertical bars. * Significantly different when compared with control meal using repeated-measures test: P<0·05.

Postprandial plasma insulin
Fig. 2(a) shows that all test meals and the control meal induced an IR that reached a peak at 30 min after consumption. The incremental peak IR was highest for RWF (46·1 µIU/ml) followed by RWC (44·7 µIU/ml). Interestingly, all the test meals showed a decrease in IR after 30 min, except RWF and RWE, which sustained a longer insulin release between 30 and 60 min before decreasing. The control meal had the lowest incremental peak (33·9 µIU/ml) and it showed the lowest rate of insulin released compared with test meals that contained protein sources. Expressed as iAUC, both RWF and RWE demonstrated statistically significant increases in IR compared with the control meal (P<0·02). In contrast, there was no significant difference in the iAUC for RWT (2860·6 µIU/ml) compared with rice control (2606·5 µIU/ml) (Fig. 2(b)).
(a) Changes in plasma insulin of fifteen healthy male volunteers after consumption of five different test meals: rice (Control, ![]() ), rice with fish (RWF,
), rice with fish (RWF, ![]() ), rice with egg white (RWE,
), rice with egg white (RWE, ![]() ), rice with soya beancurd (taukwa) (RWT,
), rice with soya beancurd (taukwa) (RWT, ![]() ) and rice with chicken (RWC,
) and rice with chicken (RWC, ![]() ), respectively, following the standardised dinner. (b) Net incremental AUC (iAUC) using fasting values as baseline. Values are means, with standard errors represented by vertical bars. * Significantly different when compared with control meal using repeated-measures test: P<0·05.
), respectively, following the standardised dinner. (b) Net incremental AUC (iAUC) using fasting values as baseline. Values are means, with standard errors represented by vertical bars. * Significantly different when compared with control meal using repeated-measures test: P<0·05.

Postprandial plasma glucagon
The plasma glucagon concentration after consuming the control meal was suppressed to a level beneath the baseline throughout the postprandial period, except at 90 and 120 min (Fig. 3(a)). However, all test meals based on 25 g of protein resulted in a marked increase in glucagon concentrations. Expressing the result as an iAUC, the plasma glucagon concentration after RWF (P=0·023) and RWT (P=0·007) was significantly higher when compared with the control meal (Fig. 3(b)). It should be noted that the glucagon concentrations reached its peak at varied time points for RWF (90 min) and RWT (30 min), although the maximum glucagon increments for RWF (14·7 ng/l) and RWT (15·0 ng/l) were similar.
(a) Changes in plasma glucagon of fifteen healthy male volunteers after consumption of five different test meals: rice (Control, ![]() ), rice with fish (RWF,
), rice with fish (RWF, ![]() ), rice with egg white (RWE,
), rice with egg white (RWE, ![]() ), rice with soya beancurd (taukwa) (RWT,
), rice with soya beancurd (taukwa) (RWT, ![]() ) and rice with chicken (RWC,
) and rice with chicken (RWC, ![]() ), respectively, following the standardised dinner. (b) Net incremental AUC (iAUC) using fasting values as baseline. Values are means, with standard errors represented by vertical bars. * Significantly different when compared with control meal using repeated-measures test: P<0·05.
), respectively, following the standardised dinner. (b) Net incremental AUC (iAUC) using fasting values as baseline. Values are means, with standard errors represented by vertical bars. * Significantly different when compared with control meal using repeated-measures test: P<0·05.

Amino acid profiles
In all, eighteen amino acids were detected and identified, as shown in Table 2. The ratio of BCAA:individual EAA, such as Met, His, Lys, Thr, Phe and Trp, was also evaluated for all protein sources. As compared with the animal protein sources, that is, fish, egg white and chicken, soya beancurd (taukwa) had the lowest content of BCAA and EAA levels. However, soya beancurd (taukwa) had a notably much higher BCAA:Met ratio compared with chicken, fish and egg white (Table 2). A regression analysis (Spearman’s ρ) was carried out between the ratio of BCAA:EAA with GR. Table 3 shows that an increase in BCAA:Met ratio was significantly associated with a decrease in GR (P=0·004). However, no statistical association was observed for GR with the ratios of BCAA:His, Lys, Thr, Phe and Trp, respectively.
Amino acid levels in different protein sources

BCAA, branched chain amino acids; EAA, essential amino acids; TAA, total amino acids.
Spearman’s correlation coefficients and P values for the relations between branched chain amino acids (BCAA):essential amino acids ratio and glycaemic response of different test meals
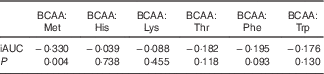
iAUC, net incremental AUC.
Discussion
The present study shows a promising effect of co-ingesting a carbohydrate source with a protein-rich meal in reducing postprandial blood glucose response. Proteins have previously been shown to stimulate insulin secretion and reduce GR( Reference Gannon, Nuttall and Neil 18 , Reference Nuttall, Mooradian and Gannon 19 , Reference Gannon, Nuttall and Nuttall 30 , Reference Nuttall, Gannon and Jordan 31 ). Our study demonstrates that all protein-rich meals are not equivalent in the way they affect glucose homoeostasis. As proteins have differing amino acid composition, these appear to affect blood glucose regulations, insulin and glucagon secretion.
The addition of soya protein beancurd to white rice (RWT) showed a significant reduction in blood glucose response when compared with consuming rice on its own (control meal). The benefits of soya protein on blood glucose have previously been reported with most studies conducted in diabetics( Reference Odegaard, Koh and Butler 32 , Reference Mueller, Odegaard and Gross 33 ). To the best of our knowledge, this is the first study to show that when a soya protein food (i.e. soya beancurd (taukwa)) was consumed with rice, a lowering of the blood glucose response was observed in healthy individuals. Moreover, unlike RWF and RWE, which significantly increased postprandial IR, RWT did not result in a significant rise in IR, which is consistent with previous studies( Reference Claessens, Calame and Siemensma 34 , Reference Moghaddam, Entezari and Iraj 35 ). These results, when combined, suggest that co-ingestion of soya protein with carbohydrate markedly attenuates the postprandial GR without a change in IR. However, consumption of RWT significantly increased plasma glucagon response. It is likely that certain amino acids present in soya protein may have little effect on insulin secretion but stimulate glucagon( Reference Gannon and Nuttall 36 ). Although a previous study showed that soya protein given in combination with Lys increased total insulin secretions( Reference Sugano, Ishiwaki and Nagata 37 ), we found that soya protein showed the lowest Lys content compared with the other protein foods (Table 2). Although soya protein contained low levels of Lys, Gly and Phe, which are known as glucogonogenic( Reference Gannon and Nuttall 36 ), the consumption of RWT in the present study showed an increase in glucagon secretion, which is required to raise blood glucose level and prevent hypoglycaemia( Reference Jiang and Zhang 38 ). A study conducted by Claessens et al.( Reference Claessens, Calame and Siemensma 34 ) also showed the same trend, where there was a significant reduction in GR and an increase in glucagon response despite not having an increase in insulin secretion.
Soyabean, as a member of the legume family, is a rich source of protein, fibre, vitamins, minerals, fat, isoflavones and phyto-oestrogens that may affect glycaemic control and lipid profile( Reference Yang, Chen and Xu 39 ). There is evidence to suggest that, besides protein, fat and isoflavones in soyabeans may also have glucose-lowering effects. Although the two major metabolically active isoflavones, namely genistein and daidzein, are generally present in soya( Reference Rekha and Vijayalakshmi 40 ), the amounts are minute (online Supplementary Table S1)( Reference Liu, Chang and Wiesenborn 41 ). Moreover, several studies have shown statistically significant associations of both genistein and daidzein in glycaemia amongst women but not in men( Reference Ko, Kim and Ahn 42 , Reference Koh, Wu and Wang 43 ). As the present study comprised only males, it implies that the presence of isoflavones in soya protein would be an unlikely confounding factor that may have reduced blood glucose levels. We, however, hypothesise that the significant glucose reduction in RWT was partly attributed to the high fat content (7·6 g), as shown in Table 1. Previous studies suggest that across a range of 0–30 g of protein and fat, both components reduced the GR of glucose. However, protein had a two to three times greater effect than fat( Reference Moghaddam, Vogt and Wolever 44 ). Therefore, we surmise that the glucose-lowering effects of fat in RWT should be modest compared with the effects of protein, which was four times the fat content. Further investigation of the effects of fat on GR is ongoing in our laboratory.
In the present study, the test meals of RWE and RWF resulted in a significant increase in insulin secretion. Previously, Gannon et al.( Reference Gannon, Nuttall and Neil 18 ) showed that consuming fish with a carbohydrate source (glucose) produced one of the highest IR compared with other protein foods. On the other hand, in another study, egg white consumed with glucose had the lowest IR, where it was estimated that 47 % of egg white protein was metabolised compared with 70 % of cottage cheese protein( Reference Nuttall and Gannon 45 ). IR has also been shown to be related to protein digestion rate( Reference Gannon, Nuttall and Damberg 46 ). We found that the consumption of RWF resulted in significantly high glucagon secretion. This is probably because amino acids present in fish protein have a direct or synergistic effect on glucagon secretion. Kuhara et al.( Reference Kuhara, Ikeda and Ohneda 47 ) assessed the metabolic response to seventeen individual amino acids and found that all the amino acids potentiating glucagon release also stimulated insulin. In our study, we have demonstrated that the consumption of a protein meal stimulates glucagon secretion with RWF and RWT both showing a statistically significant increase in glucagon concentration (P<0·05). This is in agreement with RWT having the lowest blood glucose response (Fig. 1). An increase in glucagon secretion is necessary to raise the blood glucose level to prevent hypoglycaemia( Reference Jiang and Zhang 38 ). This implies that the consumption of protein such as soya beancurd (taukwa) attenuates the effect of glucagon.
Although BCAA are known to influence insulin and GR( Reference Calbet and MacLean 48 ), it is impossible to describe which precise amino acid in soya protein is influencing glycaemic reduction. It is interesting to note that soya proteins compared with all other types of protein are deficient in Met( Reference Friedman and Brandon 49 ). We evaluated the ratio of BCAA:EAA to its relationship with GR (Table 3). Results have shown that a change in BCAA:Met is statistically associated with a change in GR; that is, increase intake in BCAA:Met is associated with a reduction in GR. In contrast, the association between the ratio of BCAA:His, Lys, Thr, Phe and Trp and the change in GR is absent (Table 3). It appears that soya beancurd (taukwa) has an optimum amino acid ratio in reducing GR.
Although Layman( Reference Layman 50 ) reported that Leu, a BCAA found mostly in soya beancurd (taukwa), chicken and fish, was involved in the critical metabolic processes, the more important factor that influenced the nutritional value of a protein source was the relative content and metabolic availability of an individual EAA. Without the correct proportions of the EAA in the diet, the utilisation of other amino acids will be limited, thus preventing normal rates of protein synthesis despite the adequate total N intake level( Reference Layman 50 ). It was also shown that soya protein supported N balance and is on par with beef and milk protein( 51 ). Cell culture studies demonstrated that Leu promotes glucose uptake independent of the insulin signalling pathway; in other words, amino acids activate mechanistic target of rapamycin (mTOR) for glucose uptake in the absence of insulin( Reference Bernard, Liao and Doerner 52 , Reference Liu, Liu and Xiong 53 ). Human studies have shown that feeding high proportions of BCAA with glucose promotes activation of mTOR( Reference Dreyer, Drummond and Pennings 54 , Reference Fujita, Dreyer and Drummond 55 ). This implies the possibility that amino acids promote glucose uptake synergistically with insulin. The effect was demonstrated in our study with soya beancurd (taukwa) as an example.
Our study demonstrated that there is a hierarchy of effect on glucose reduction between the test protein-based meals. Protein source appears to partly determine the nature of the metabolic response presumably because of differences in amino acid composition( Reference Pal and Ellis 56 , Reference Uhe, Collier and O’Dea 57 ). RWT had the best effect followed by RWC, RWF and RWE sequentially. The substantial reduction in postprandial glycaemia observed with RWT was comparable to what was observed with the addition of pharmacological therapies such as metformin and sulphonylurea( Reference Turner, Cull and Frighi 58 ). This observation was also consistent with epidemiological studies in which the consumption of unsweetened soya products is inversely associated with the risk of T2D; however, the effects were not observed in meat proteins( Reference Mueller, Odegaard and Gross 33 , Reference Sluijs, Beulens and Spijkerman 59 ).
In Asia, soya is consumed in various forms, namely soya beancurd (taukwa; firm tofu), silken tofu (soft), beancurd skin (foo pei), tau pok, tau huay, soyabean drink, etc.( Reference Mueller, Odegaard and Gross 33 ). According to the Shanghai Women’s Health Study, there was an observable protective effect of T2D when there was a small increase of soyabean intake from 2·8 to 6·8 g/d( Reference Villegas, Gao and Yang 60 ). On average, it was reported that soyabean intake was 11·0 g/d( Reference Villegas, Gao and Yang 60 ). We can infer from this that long-term consumption of soyabean products is achievable and will be beneficial in the management of T2D.
Conclusion
Co-ingestion of soya protein beancurd together with rice is capable of reducing blood glucose. However, there is a hierarchy of protein meal effect on GR. Of particular interest is the finding for the first time that the inclusion of soya protein beancurd, that is, RWT, induced a significant effect on blood glucose reduction. Given that soya protein-based foods are extensively and widely consumed in the form of soya beancurd, soya milk and beancurd skin in Asia, their inclusion in the diet would be highly desirable( Reference Mueller, Odegaard and Gross 33 ). These results suggest that it may be possible to tailor low GR to rice meals with the inclusion of soya beancurd (taukwa). This dietary advocacy may facilitate glycaemic regulation and be useful in managing T2D in populations that consume a diet rich in rice. The inclusion of soya protein appears to be a simple, acceptable and palatable means of reducing the GR of rice. Rice-based diets are popular in Asia. The observation presented may have a direct impact on reducing the risk in Asians transiting from pre-diabetics to diabetics.
Acknowledgements
The authors thank Lim Zhi’En Joseph for his support on statistical analysis.
The authors are grateful to the SICS for funding the study.
C. J. H. contributed to the conception and the design of the study. R. Q. carried out the study, analysis of glucose and insulin blood samples and statistical analysis of data. X. B. carried out analysis of glucagon blood samples. R. Q., X. B. and C. J. H. drafted the manuscript. All authors critically reviewed the contents of the manuscript and approved the final version of the manuscript.
None of the authors has any conflicts of interest to declare.
Supplementary material
For supplementary material/s referred to in this article, please visit http://dx.doi.org/doi:10.1017/S0007114515005498


