

Introduction
Sauropodomorph and ornithischian dinosaurs were the foremost herbivorous terrestrial vertebrates of the Mesozoic Era in terms of species richness, abundance, and functional diversity (Weishampel and Norman Reference Weishampel and Norman1989; Sereno Reference Sereno1999; Weishampel et al. Reference Weishampel, Dodson and Osmolska2004; Barrett Reference Barrett2014). Both groups survived two extinction events—the end-Triassic mass extinction (Tr/J) and a smaller extinction at the Jurassic/Cretaceous boundary (J/K)—and persisted through several episodes of floral turnover, including the decline of cycadophytes and the proliferation of angiosperms (Sereno Reference Sereno1997; Barrett and Willis Reference Barrett and Willis2001; Lloyd et al. Reference Lloyd, Davis, Pisani, Tarver, Ruta, Sakamoto, Hone, Jennings and Benton2008; Butler et al. Reference Butler, Barrett, Kenrick and Penn2009b). However, relatively few studies have attempted to quantify the responses of nonavian dinosaurs to these extrinsic environmental drivers.
A number of studies have investigated the ecological and evolutionary responses of dinosaurs to the Tr/J mass extinction in terms of diversity analyses, but only a handful of studies have quantified morphological disparity (Brusatte et al. Reference Brusatte, Benton, Ruta and Lloyd2008a,Reference Brusatte, Benton, Ruta and Lloydb) or the evolution of other traits across this interval (Irmis Reference Irmis2011; Sookias et al. Reference Sookias, Butler and Benson2012). These studies found that dinosaur morphospace occupation was not greatly affected by the Tr/J extinction (Brusatte et al. Reference Brusatte, Benton, Ruta and Lloyd2008a,Reference Brusatte, Benton, Ruta and Lloydb): dinosaurian disparity remained essentially unchanged across the Tr/J boundary, whereas crurotarsans became almost completely extinct (Brusatte et al. Reference Brusatte, Benton, Ruta and Lloyd2008a). With respect to dinosaurs the J/K extinction has been studied in terms of diversity analyses (e.g., Upchurch and Barrett Reference Upchurch and Barrett2005; Barrett et al. Reference Barrett, McGowan and Page2009; Butler et al. Reference Butler, Barrett, Penn and Kenrick2010, Reference Butler, Benson, Carrano, Mannion and Upchurch2011; Upchurch et al. Reference Upchurch, Mannion, Benson, Butler and Carrano2011), and the potential ecological consequences of this event have been discussed qualitatively in terms of changes to dinosaur browsing regimes and community composition (Bakker Reference Bakker1978; Barrett and Willis Reference Barrett and Willis2001; Barrett and Upchurch Reference Barrett and Upchurch2005). Possible associations between paleobotanical turnovers and dinosaur evolution have been proposed (e.g., Bakker Reference Bakker1978; Weishampel and Norman Reference Weishampel and Norman1989; Tiffney Reference Tiffney1992; Mustoe Reference Mustoe2007), with the suggestion that changes in the prevalent mode of dinosaur herbivory (e.g., high-browsing vs. low browsing; extensive oral processing vs. lack of oral processing) were reciprocally related to changes in the taxonomic and ecological composition of contemporary plant communities. In particular, it has been suggested that a decline in sauropodomorph and stegosaur abundance and diversity might be associated with a decline in cycadophyte diversity during the Early Cretaceous and that the ecological radiation of angiosperms during the same period may have been fostered by a coincident taxonomic radiation of low-browsing ornithischian dinosaurs with complex jaw mechanisms (e.g., Bakker Reference Bakker1978; Weishampel and Norman Reference Weishampel and Norman1989; Tiffney Reference Tiffney1992; Mustoe Reference Mustoe2007). Hypotheses regarding dinosaur–plant coevolution have been more recently tested quantitatively and qualitatively using spatiotemporal comparisons between the dinosaur and paleobotanical records (Barrett and Willis Reference Barrett and Willis2001; Butler et al. Reference Butler, Barrett, Kenrick and Penn2009a,Reference Butler, Barrett, Kenrick and Pennb, Reference Butler, Barrett, Penn and Kenrick2010). These diversity-based spatiotemporal studies found no definitive evidence for the coradiation of any Mesozoic plant and dinosaur group, although some temporal correlations were suggestive of possible interactions. Physiological limits on some of these coevolutionary hypotheses have also been proposed on the basis of the possible nutritional value of potential food plants (e.g., Hummel et al. Reference Hummel, Gee, Südekum, Sander, Nogge and Clauss2008; Gee Reference Gee2011).
Disparity analyses quantify morphological diversity within a group of organisms, rather than merely documenting taxonomic richness (Wills et al. Reference Wills, Briggs and Fortey1994; Ciampaglio et al. Reference Ciampaglio, Kemp and McShea2009). Unlike species-richness estimates, disparity analyses can be robust to sampling biases and document the variation in morphology and potential function within taxonomic groups (Wills et al. Reference Wills, Briggs and Fortey1994). Assessments of morphological disparity using either anatomical measurements or cladistic characters have been conducted on various extinct vertebrate groups, including dinosaurs (Brusatte et al. Reference Brusatte, Benton, Ruta and Lloyd2008a,Reference Brusatte, Benton, Ruta and Lloydb, Reference Brusatte, Butler, Prieto-Márquez and Norell2012; Young and Larvan Reference Young and Larvan2010; Butler et al. Reference Butler, Benson, Carrano, Mannion and Upchurch2011; Foth and Rauhut Reference Foth and Rauhut2013; Button et al. Reference Button, Rayfield and Barrett2014). By contrast, a new method for assessing the diversity of biomechanical profiles, multivariate biomechanical disparity (Anderson Reference Anderson2009; Anderson et al. Reference Anderson, Friedman, Brazeau and Rayfield2011, Reference Anderson, Friedman and Ruta2013; Stubbs et al. Reference Stubbs, Pierce, Rayfield and Anderson2013), has not been widely applied. Biomechanical disparity offers a novel means to quantify variation in biomechanically relevant traits and to infer their potential ecological significance: for example, biomechanical traits might include mechanical advantage (the ratio of muscle moment arms indicating the efficiency of force transfer during biting), polar moment of inertia (a proxy for flexural stiffness), and mandibular articulation offset (dictating simultaneous occlusion of the entire tooth row, or scissor-like occlusion) (Anderson Reference Anderson2009; Anderson et al. Reference Anderson, Friedman, Brazeau and Rayfield2011, Reference Anderson, Friedman and Ruta2013; Stubbs et al. Reference Stubbs, Pierce, Rayfield and Anderson2013). Other studies have explored disparity of individual biomechanical traits such as mechanical advantage (Sakamoto Reference Sakamoto2010; Brusatte et al. Reference Brusatte, Butler, Prieto-Márquez and Norell2012), average maximum stress, or a metric of skull strength (Foth and Rauhut Reference Foth and Rauhut2013). Continuous measurements can be projected into multivariate “biomechanical morphospace.” Previous work in this area has used two-dimensional (2D) views of mandibular elements to investigate the appearance and diversity of biomechanical profiles during the radiation of Paleozoic fishes (Anderson Reference Anderson2009; Anderson et al. Reference Anderson, Friedman, Brazeau and Rayfield2011), the water-to-land transition in tetrapods (Anderson et al. Reference Anderson, Friedman and Ruta2013), the Mesozoic diversification of crocodylomorphs (Stubbs et al. Reference Stubbs, Pierce, Rayfield and Anderson2013), and niche partitioning in sauropod dinosaurs (Button et al. Reference Button, Rayfield and Barrett2014).
Despite previous work, the functional responses to these potential evolutionary drivers, and hence how the organism interacted with its environment and potential drivers of selection, have not been quantified. Without this information we lack a complete picture of how dinosaur communities and clades interacted with and exploited Mesozoic environments over time. In addressing these questions, assessing the morphological variation evident from the fossil record may not be sufficient, as we do not know whether morphology and morphological diversity are reliable predictors of function and functional diversity. Therefore, in order to assess the relationship between jaw shape, function, and extrinsic evolutionary drivers, we provide the first quantitative assessment of the morphological and biomechanical disparity of an individual functional unit (the lower jaw) in herbivorous nonavian dinosaurs through time. This approach complements previous attempts to examine these questions though spatiotemporal comparisons of species-richness patterns and provides the only rigorous biomechanically and functionally based analysis of these issues attempted to date. We hypothesize that ornithischians and sauropodomorphs will show distinct morphologies and biomechanical profiles (i.e., in both the shape and mechanical capabilities of the jaw). We also hypothesize that the shift in plant community structure after the J/K boundary will trigger a corresponding shift in dinosaurian jaw biomechanical profiles, due to the differing physiognomies, digestibility, and mechanical properties of the varied potential food plant clades that were ecologically important at different times throughout the Mesozoic (Bakker Reference Bakker1978; Weishampel Reference Weishampel1984; Niklas Reference Niklas1992; Hummel et al. Reference Hummel, Gee, Südekum, Sander, Nogge and Clauss2008; Gee Reference Gee2011). We use a geometric morphometric landmark analysis to compare dinosaur mandibular shape variability to variation in mandibular biomechanical profiles. We then compare these data with the timing of several extrinsic events (tetrapod extinctions, changes in floral communities) that have been proposed to influence dinosaur evolutionary history, in order to determine whether coincident patterns are present.
Materials and Methods
Data for 2D landmark and biomechanical trait analyses were compiled from 167 sauropodomorph and ornithischian dinosaur taxa (see Supplementary Information, Appendix 6). Herbivorous nonavian theropods were excluded from this data set, as complete mandibular material for these animals is rare. A mandibular biomechanical profile represents a good proxy for characterizing the feeding system, as the mandible is primarily adapted for feeding, whereas the cranium has multiple functional roles, some of which are unrelated to feeding, such as housing the brain and sensory organs (Hylander et al. Reference Hylander, Picq and Johnson1991; Hylander and Johnson Reference Hylander and Johnson1997).
Morphology
The archosaur mandible is a primarily planar structure, although its morphology does differ between groups, with varying degrees of inturning and bowing, particularly with respect to its symphyseal region (Romer Reference Romer1956). However, to include as many taxa as possible, in order to account for the greatest amount of biomechanical and mandibular and dental shape variation, we selected a standard lateral view of the mandible as the basis for this study. The 2D landmarks were applied to homologous and analogous points on lateral images of dinosaur jaws using tpsDig II software (Rohlf Reference Rohlf2004; Zelditch et al. Reference Zelditch, Swiderski and Sheets2012). Six fixed landmarks were described, identifying biologically and operationally homologous points on both sauropodomorph and ornithischian jaws (see Supplementary Fig.1). The overall morphology of each jaw was described by a series of sliding semilandmarks (sLM). Six sLM curves, each bracketed by two of the fixed landmarks, were used to define the shape of the jaw. In total, 88 landmarks (both fixed and sliding) were described. sLMs were slid using the Chord-d2 technique to minimize Procrustes distances rather than bending energy (Rohlf Reference Rohlf2008); this was performed in tpsRelw. Described curves were appended to landmarks in tpsUtil (Rohlf Reference Rohlf2004); appended landmarks were then superimposed using generalized least-squares (Procrustes) methods in tpsRelw (Rohlf Reference Rohlf2008). Procrustes superimposition aligned jaws, eliminating scale, location, and rotational differences between specimens (Rohlf Reference Rohlf2004). Consensus models, partial warps, and relative warps were then calculated using tpsRelw software. Relative warp scores were subjected to principal components analysis (PCA) to produce shape-based morphospace plots.
Biomechanics
Eighteen continuous biomechanical characters or traits were quantified, many of which have important functional consequences in extant organisms (Table 1). Full details of the biomechanical characters are described in the Supplementary Material. Biomechanical trait measurements were standardized using a z-transformation technique, giving all characters a mean of 0 and a variance of 1 (Anderson et al. Reference Anderson, Friedman, Brazeau and Rayfield2011). A standardized matrix of biomechanical character scores was then subjected to principal coordinates analysis (PCoA), using the Gower model to correct for missing data to produce biomechanical morphospace plots. PCoA and creation of morphospace plots was performed in Past, Version 3 (Hammer et al. Reference Hammer, Harper and Ryan2001).
Continuous biomechanical characters used in this study.
Significant differences in morphospace occupation were tested using nonparametric multivariate analysis of variance (NPMANOVA) in Past, Version 3 (Hammer et al. Reference Hammer, Harper and Ryan2001). All principal axes accounting for more than 1% of variation were used in the NPMANOVA, resulting in 12 axes for shape-based and 15 axes for biomechanical morphospace. Principal axes were used to display two types of morphospace comparisons: overall shape-based and biomechanical morphospace between sauropodomorphs and ornithischians. We also created a series of morphospace plots representing eight 20 Myr time slices. These time slices were constructed by combining taxa from two adjacent 10Myr time bins used for the disparity analyses (see following section). Combining time bins allowed for good sample size and enabled comparisons across major ecological transitions, for example, mass extinction events.
Disparity
Disparity through time was calculated across sixteen 10Myr time bins. The lengths of the time bins either side of the Tr/J boundary were adjusted to accommodate the date of the boundary as in Butler et al. (Reference Butler, Brusatte, Andres and Benson2012). Use of 10Myr time bins enables comparisons across both the Tr/J and J/K boundaries, standardizes bin length, and provides greater sample sizes per bin than those available for strict stage-level comparisons. Sauropodomorph disparity was also analyzed for vertical feeding envelopes in 3 m intervals. Species assignment to each maximum feeding envelope is listed in the Supplementary Material. To account for variation in the published literature, maximum sauropodomorph feeding envelopes were taken from published works, including reconstructions from new material (e.g., Upchurch and Barrett Reference Upchurch and Barrett2000; Apesteguía Reference Apesteguía2004; Sander et al. Reference Sander, Mateus, Laven and Knótschke2006; Peyer and Allain Reference Peyer and Allain2010; Whitlock Reference Whitlock2011; Stevens Reference Stevens2013). Disparity analyses were carried out using the Morphological Disparity Analysis (MDA) package for Matlab (Navarro Reference Navarro2003). For all disparity tests, two variance-based disparity metrics were tested: the sum of variance and mean pairwise distance. Both these metrics are robust to sample size variation (Ciampaglio et al. Reference Ciampaglio, Kemp and McShea2009). The sum of variance metric is plotted in the main text. Mean pairwise distance results can be viewed in the Supplementary Material. Data were bootstrapped (1000 replicates), and 95% confidence intervals were calculated and graphically presented. Significant differences and likelihood ratios between each time bin were calculated using pairwise t-tests and marginal-likelihood assessment on sum of variance measures (Finarelli and Flynn Reference Finarelli and Flynn2007). A likelihood ratio >8 is considered a likely result (Finarelli and Flynn Reference Finarelli and Flynn2007). Results of t-tests were subsequently corrected for multiple comparisons, using Bonferroni corrections where appropriate (Holm Reference Holm1979). Results for mean pairwise distance can be found in the Supplementary Material.
Results
Shape Morphospace Occupation
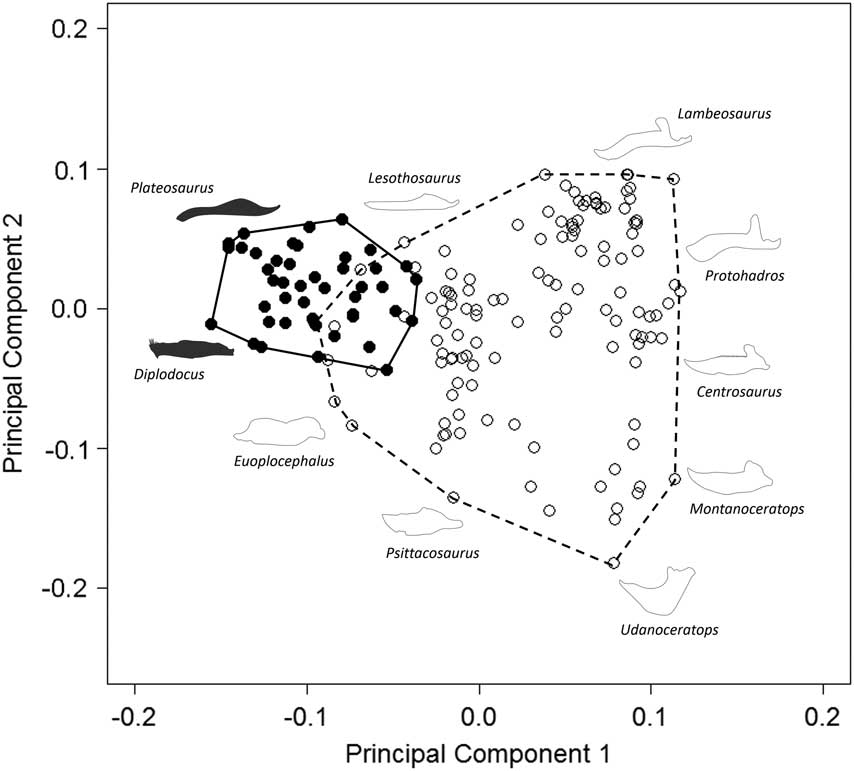
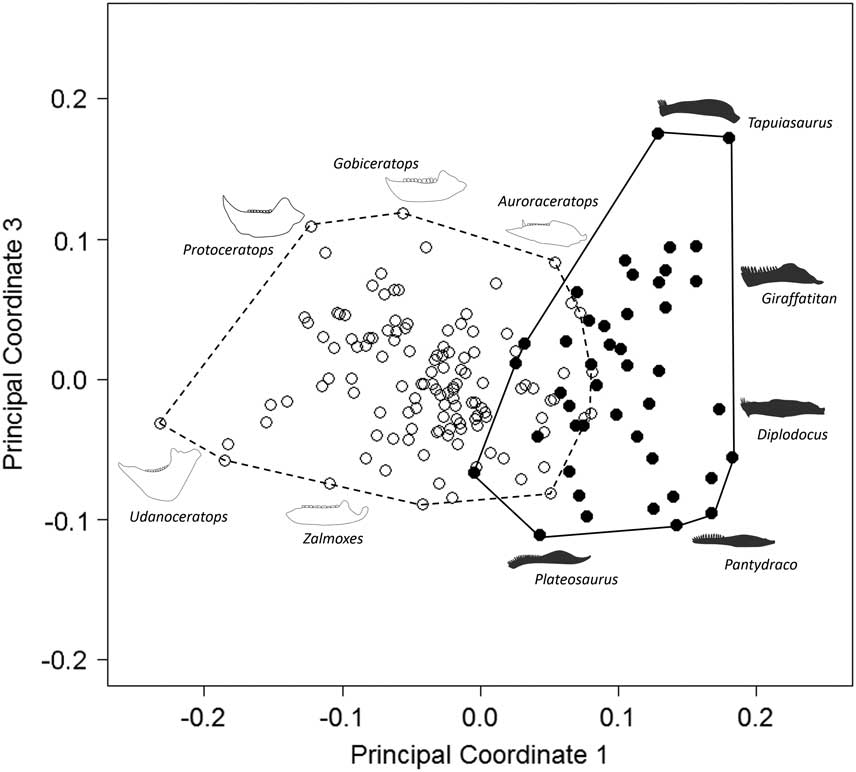
Our results demonstrate that sauropodomorph and ornithischian jaws occupy significantly different regions of morphological morphospace (p<0.01; Fig. 1; Table 2). There is minimal overlap between sauropodomorphs and ornithischians along PC1, with only seven ornithischian jaw morphologies occupying similar regions to sauropodomorphs. Overlapping ornithischian taxa represent basal members of their respective groups (basal ornithischians: Agilisaurus and Pisanosaurus; thyreophorans Emausaurus and Gigantspinosaurus; and the basal ceratopsian Yinlong), with the exception of Stegosaurus (two species). Regions of overlap are occupied by a wide range of both basal and derived sauropodomorphs; these include: Plateosaurus gracilis, Lamplughsaura, mamenchisaurids, brachiosaurids, and two South American titanosaurids (Antarctosaurus and Bonitasaura). Sauropodomorphs occupy morphospace exclusively in the −PC1 region: this region is characterized by dorsoventrally narrow jaws and the lack of a prominent coronoid process. Noneusauropod sauropodomorphs (e.g., Plateosaurus, Melanorosaurus), for the most part, account for sauropodomorph occupation of morphospace in +PC2: this region is typified by very narrow anterior jaws. Macronarian and diplodocoid taxa (including Diplodocus and Tapuiasaurus) primarily occupy −PC2 regions of morphospace (Fig. 1). The center of the morphospace (0.0 PC1; 0.0 PC2) is occupied by nonhadrosaurid iguanodontians (Parksosaurus, Theiophytalia, and Dryosaurus). Jaws in this region exhibit a greater gap between landmarks 1 and 2 than in sauropodomorph morphospace (due to the presence of the predentary in iguanodontians). Disparate groups of nonthyreophoran ornithischians expand morphospace occupation into +PC1 and +PC2 (hadrosaurids) and −PC2 regions (leptoceratopsids and psittacosaurids). +PC1 and +PC2 regions typically contain jaws with prominent coronoid processes and downwardly deflected predentaries; −PC2 regions contain robust, dorsoventrally broad jaws. Nonceratopsid marginocephalian jaw morphologies, such as those of psittacosaurids and leptoceratopsids, contribute strongly to the expansion of ornithischian shape morphospace, predominantly into +PC1/−PC2. Taxa are absent in a region of morphospace around +0.05 PC1/−0.075 PC2.
Patterns of morphospace occupation for herbivorous nonavian ornithischian and sauropodomorph dinosaurs. PC1 and PC2 account for 50.4% of variation. Ornithischian and sauropodomorph taxa occupy significantly different regions of shape-based morphospace (p<0.05). Filled circles, Sauropodomorpha; open circles, Ornithischia. Silhouettes represent jaw profiles found in that region of morphospace.
Results of significance testing (NPMANOVA) on morphospace occupation (PC1 and PC2) and biomechanical occupation (PCo1 and PCo2; PCo1 and PCo3) between Ornithischia and Sauropodomorpha (at p<0.05).
Biomechanical Morphospace Occupation
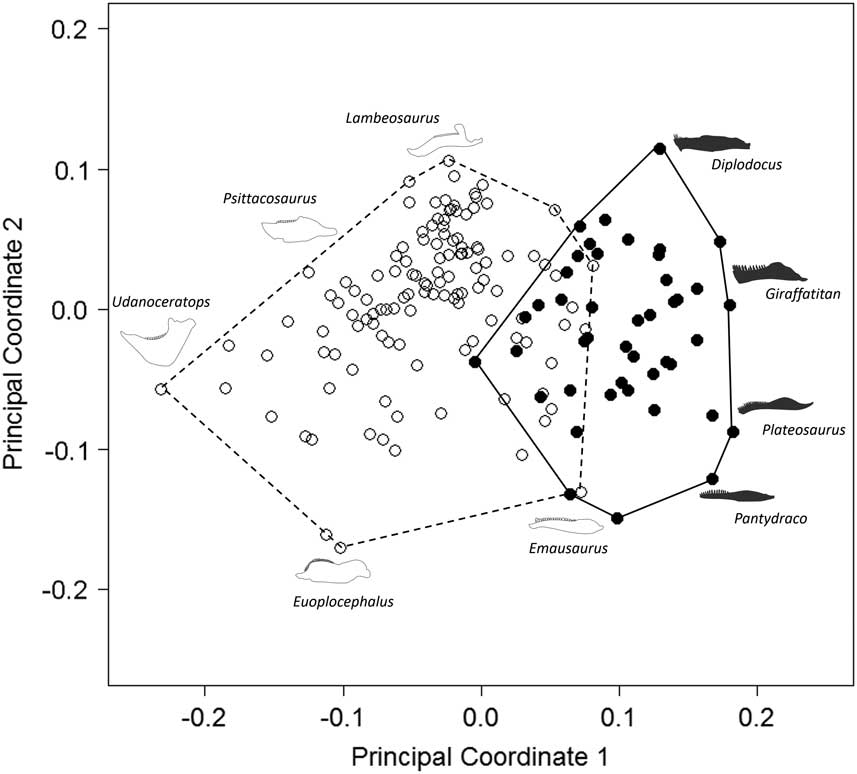
Our results demonstrate that sauropodomorph and ornithischian taxa also occupy significantly different regions of biomechanical morphospace (p<0.01; Figs. 2, 3; Table 2). There is greater overlap in biomechanical morphospace occupation than shape morphospace, with 16–20 ornithischian taxa occupying morphospace that is shared with sauropodomorphs (Figs. 2, 3). Overlapping ornithischian taxa include basal ornithischians (Pisanosaurus, heterodontosaurids) and basal members of Thyreophora (Emausaurus, stegosaurs), Marginocephalia (Yinlong), and Ornithopoda (Changchunsaurus, Dysalotosaurus). Sauropodomorphs occupy regions of +PCo1. Noneusauropod sauropodomorphs (e.g., Coloradisaurus, Pantydraco) predominate in +PCo1/−PCo2. This region is characterized by jaws with a high mechanical advantage and a large adductor muscle attachment area. Diplodocids, nonneosauropods, and nontitanosaurian macronarians (e.g., Mamenchisaurus, Camarasaurus) stretch sauropodomorph occupation into +PCo2. Jaws in this region also display high mechanical advantages, coupled with high aspect ratios. Many iguanodontian, ceratopsid, and psittacosaurid jaw profiles occupy similar regions of +PCo2 biomechanical morphospace (Fig. 2). Occupation is spread deeper into −PCo1 by leptoceratopsids (e.g., Montanoceratops). This region of functional space is characterized by deep jaws with short adductor muscle attachment and a high posterior mechanical advantage. Expansion into −PCo2 is accounted for by deep-jawed ankylosaurs (Euoplocephalus, Silvisaurus), with low tooth:jaw depth ratios and high relative dental length (Fig. 2). Similar patterns are observed in PCo3, with more basal sauropodomorphs occupying −PCo3, with a large cluster of iguanodontians and ceratopsids occupying regions of central morphospace (0.0 PCo1; 0.0 PCo3). Functional loadings, interpretations for the first four principal axes, and individual species placement in morphospace can be found in the Supplementary Material.
Patterns of biomechanical morphospace occupation for herbivorous nonavian ornithischian and sauropodomorph dinosaurs. PCo1 and PCo2 account for 25.2% of variation. Ornithischian and sauropodomorph taxa occupy significantly different regions of biomechanical morphospace (p<0.05). Filled circles, Sauropodomorpha; open circles, Ornithischia. Silhouettes represent jaw biomechanical profiles found in that region of biomechanical morphospace.
Patterns of biomechanical morphospace occupation for herbivorous nonavian ornithischian and sauropodomorph dinosaurs. PCo1 and PCo3 account for 23.9% of variation. Ornithischian and sauropodomorph taxa occupy significantly different regions of biomechanical morphospace (p<0.05). Filled circles, Sauropodomorpha; empty circles, Ornithischia. Silhouettes represent jaw biomechanical profiles found in that region of biomechanical morphospace.
Morphospace Occupation through Time
Breakdown of shape and biomechanical morphospace into 20 Myr time bins highlights patterns of morphospace occupation by each clade through time (Figs. 4–6). Initial occupation during the Late Triassic–Middle Jurassic is dominated by sauropodomorphs, with low numbers of contemporaneous basal ornithischians (e.g., heterodontosaurids and thyreophorans). In the bin representing the 20 Myr prior to the J/K boundary (165–145 Ma), thyreophorans, ornithopods, marginocephalians, and heterodontosaurids all occupy similar regions of shape morphospace, yet at this time, the same clades occupy disparate regions of biomechanical morphospace with little overlap (Figs. 5, 6; 165–145 Ma, Table 3). Sauropodomorphs at this time show significantly different biomechanical occupation to stegosaurs and ornithopods, but not heterodontosaurids or the basal ceratopsian Yinlong (NPMANOVA, p<0.01; Table 3). The sauropodomorphs are biomechanically diverse prior to the J/K boundary, occupying the region of morphospace that correlates to high tooth height:base, high mechanical advantages, and large mandibular fenestrae. After the J/K boundary, morphospace and biomechanical morphospace plots show a drop in sauropodomorph morphological and biomechanical variation as sample size diminishes and expansion in disparity by marginocephalians and, later, ornithopods (Figs. 4–6, 145–65 Ma). By the Early Cretaceous, the surviving Jurassic herbivorous dinosaur clades (sauropodomorphs, marginocephalians, ornithopods, and thyreophorans) are statistically distinct in both shape and biomechanical morphospace (Table 2). Sauropodomorphs display substantially reduced variation, whereas ankylosaurs, ceratopsians, and ornithopods expand into hitherto unoccupied regions of biomechanical morphospace. Marginocephalians (e.g., Psittacosaurus) share areas of biomechanical morphospace with iguanodontians but occupy very different regions of shape space (Fig. 4, 145–105 Ma).
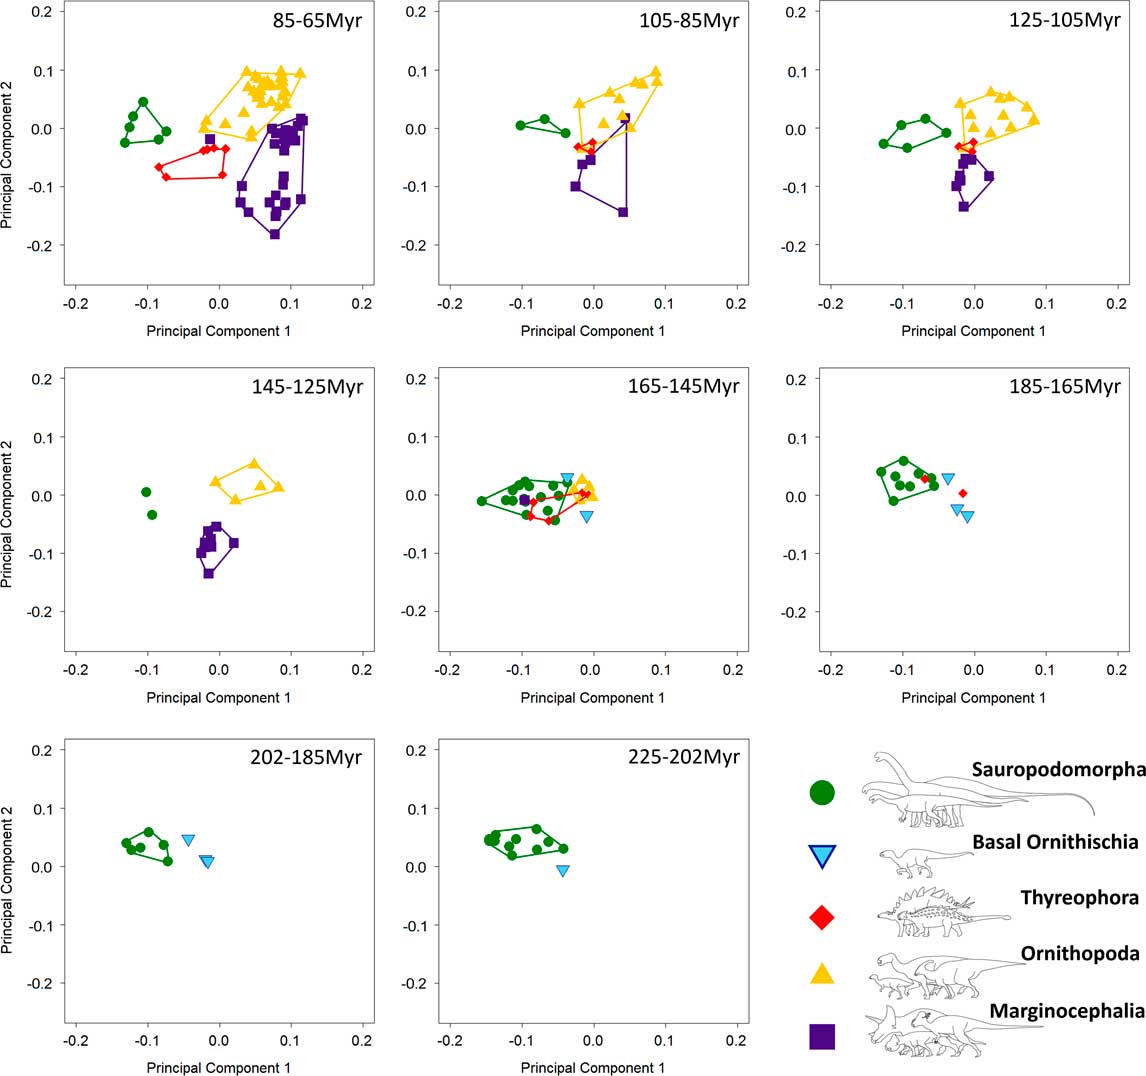
Patterns of morphospace occupation for herbivorous nonavian dinosaurs through the Mesozoic (20 Myr time bins), based on PC1 and PC2 (accounting for 50.4% of variation). Sauropodomorpha occupy isolated regions of morphospace for the majority of the Mesozoic, with overlap between North American sauropods and thyreophorans between 185 and 145 Ma.
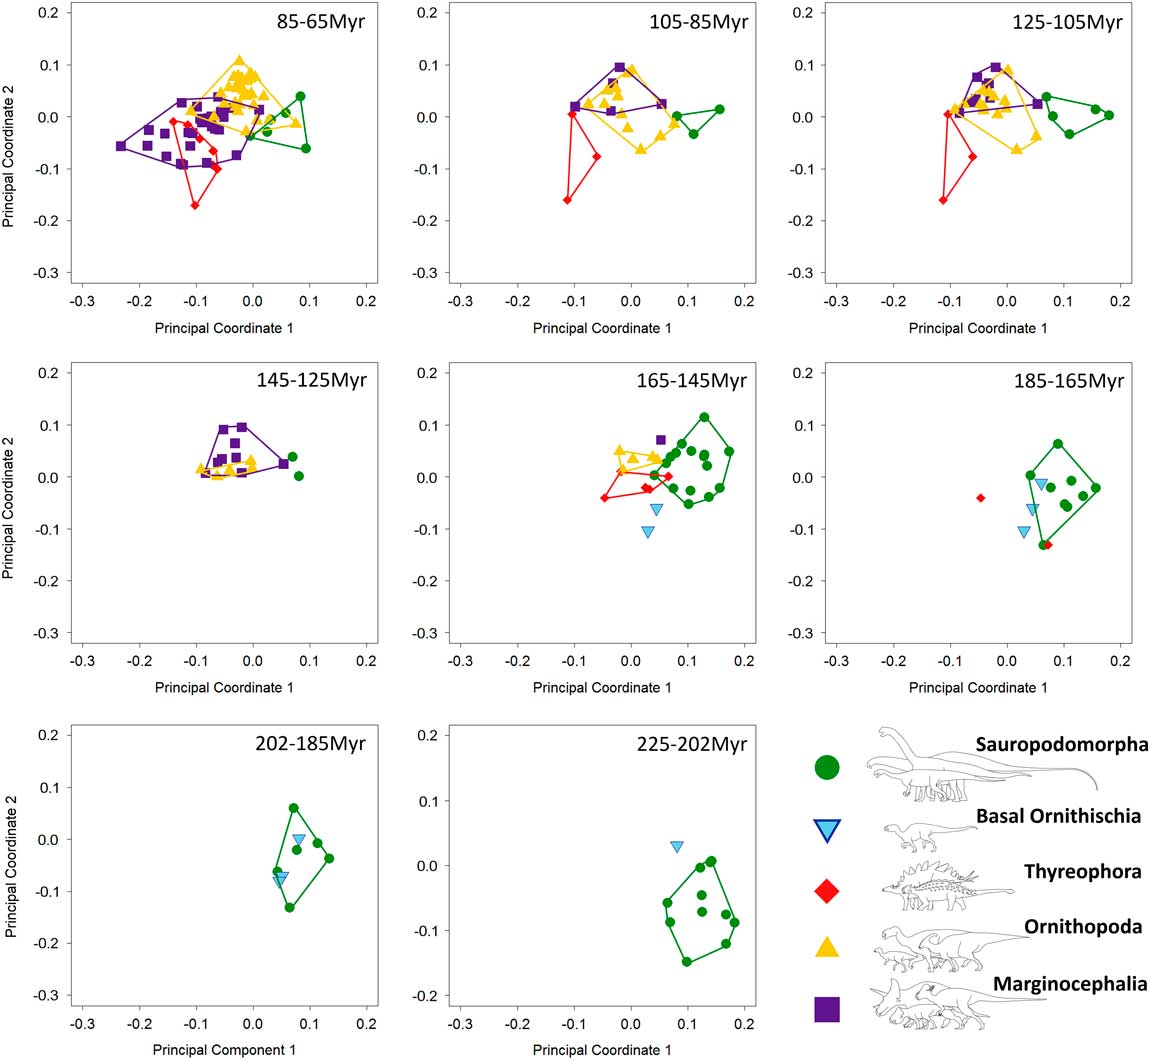
Patterns of biomechanical morphospace occupation for herbivorous nonavian dinosaurs through the Mesozoic (20 Myr time bins), based on PCo1 and PCo2 (accounting for 25.2% of variation). Sauropodomorphs predominantly overlap only with heterodontosaurids (202–145 Ma). Aptian–Maastrichtian marginocephalians and ornithopods occupy similar regions of morphospace (125–65 Ma).
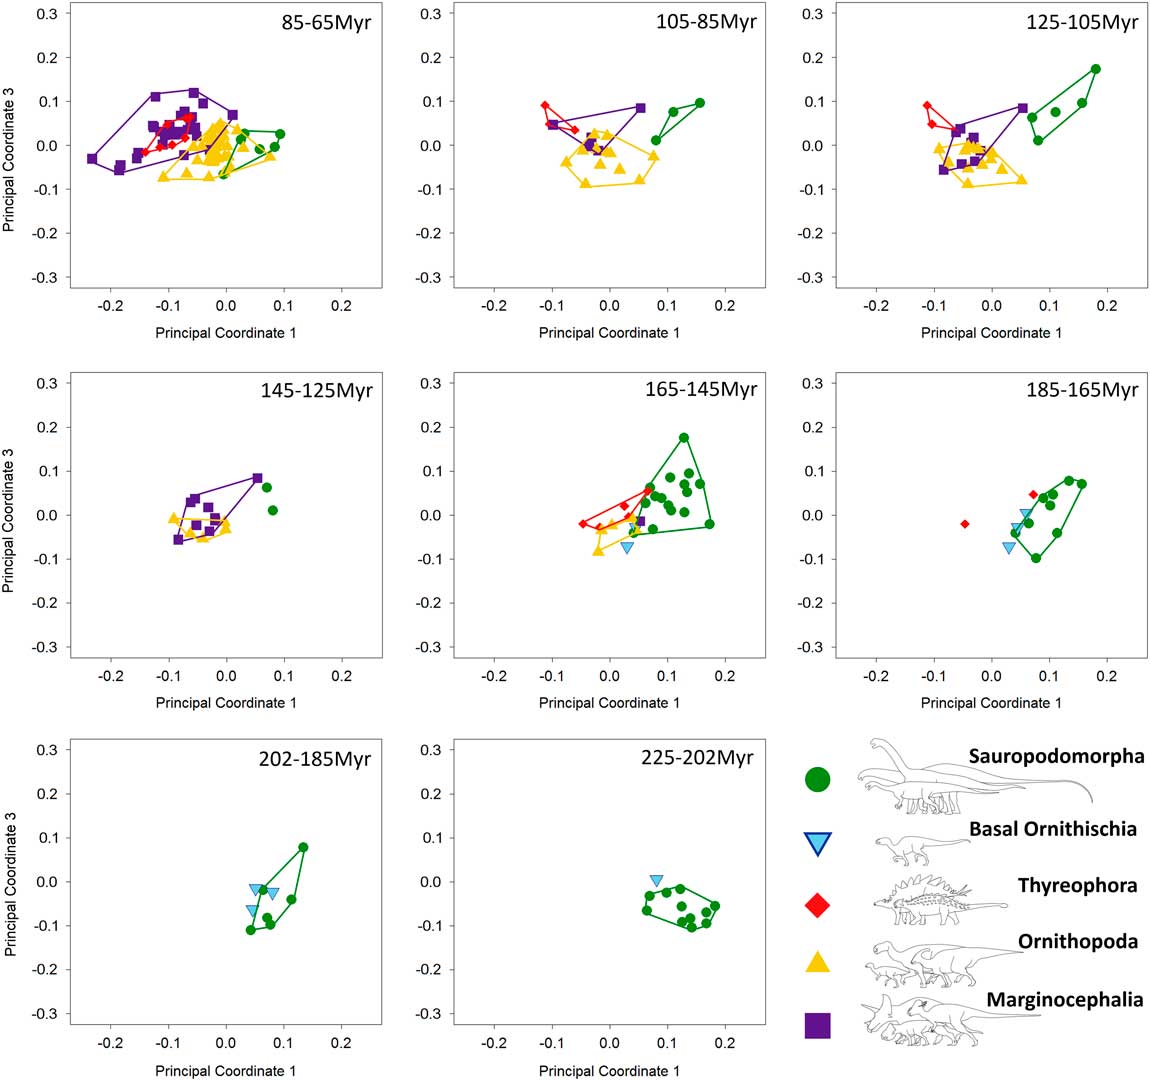
Patterns of biomechanical morphospace occupation for herbivorous nonavian dinosaurs through the Mesozoic (20 Myr time bins), based on PCo1 and PCo3 (accounting for 23.9% of variation). Sauropodomorphs overlap very little with contemporaneous taxa before the latest Cretaceous (85–65 Ma). Albian–Maastrichtian marginocephalians and thyreophorans occupy similar regions of biomechanical morphospace (105–65 Ma).
NPMANOVA significance testing between clade occupations of biomechanical morphospace through time. Bold p-values represent significant differences (at p<0.05). SA, Sauropodomorpha; BO, Basal Ornithischia; TH, Thyreophora; OR, Ornithopoda; MA, Marginocephalia.
In the latest Cretaceous, the four clades present occupy distinct regions of shape morphospace (p<0.01; Table 2), with the exception of one marginocephalian taxon (Stegoceras) that plots between nonhadrosaurid ornithopods and ankylosaurians (Fig. 4, 85–65 Ma). Biomechanically, Stegoceras is nested among ornithopods and is closer to sauropods than many contemporaneous ceratopsians. Corresponding biomechanical morphospace plots show a very different trend. Marginocephalians overlap with both ornithopods and thyreophorans. Thyreophorans and ornithopods do not overlap, and sauropodomorphs overlap minimally with ornithopods (Figs. 5, 6, 85–65 Ma). Whereas variation in marginocephalian jaw shape and biomechanics increases throughout the Cretaceous, ornithopod shape and biomechanical variation remains constant throughout the Late Cretaceous. Leptoceratopsids (e.g., Udanoceratops, Montanoceratops) extend biomechanical morphospace occupation into the region of morphospace characterized by deep mandibles with short adductor muscle attachment and high posterior mechanical advantages (Figs. 5, 6). Full details of the biomechanical character loadings are described in the Supplementary Appendix 5.
Disparity
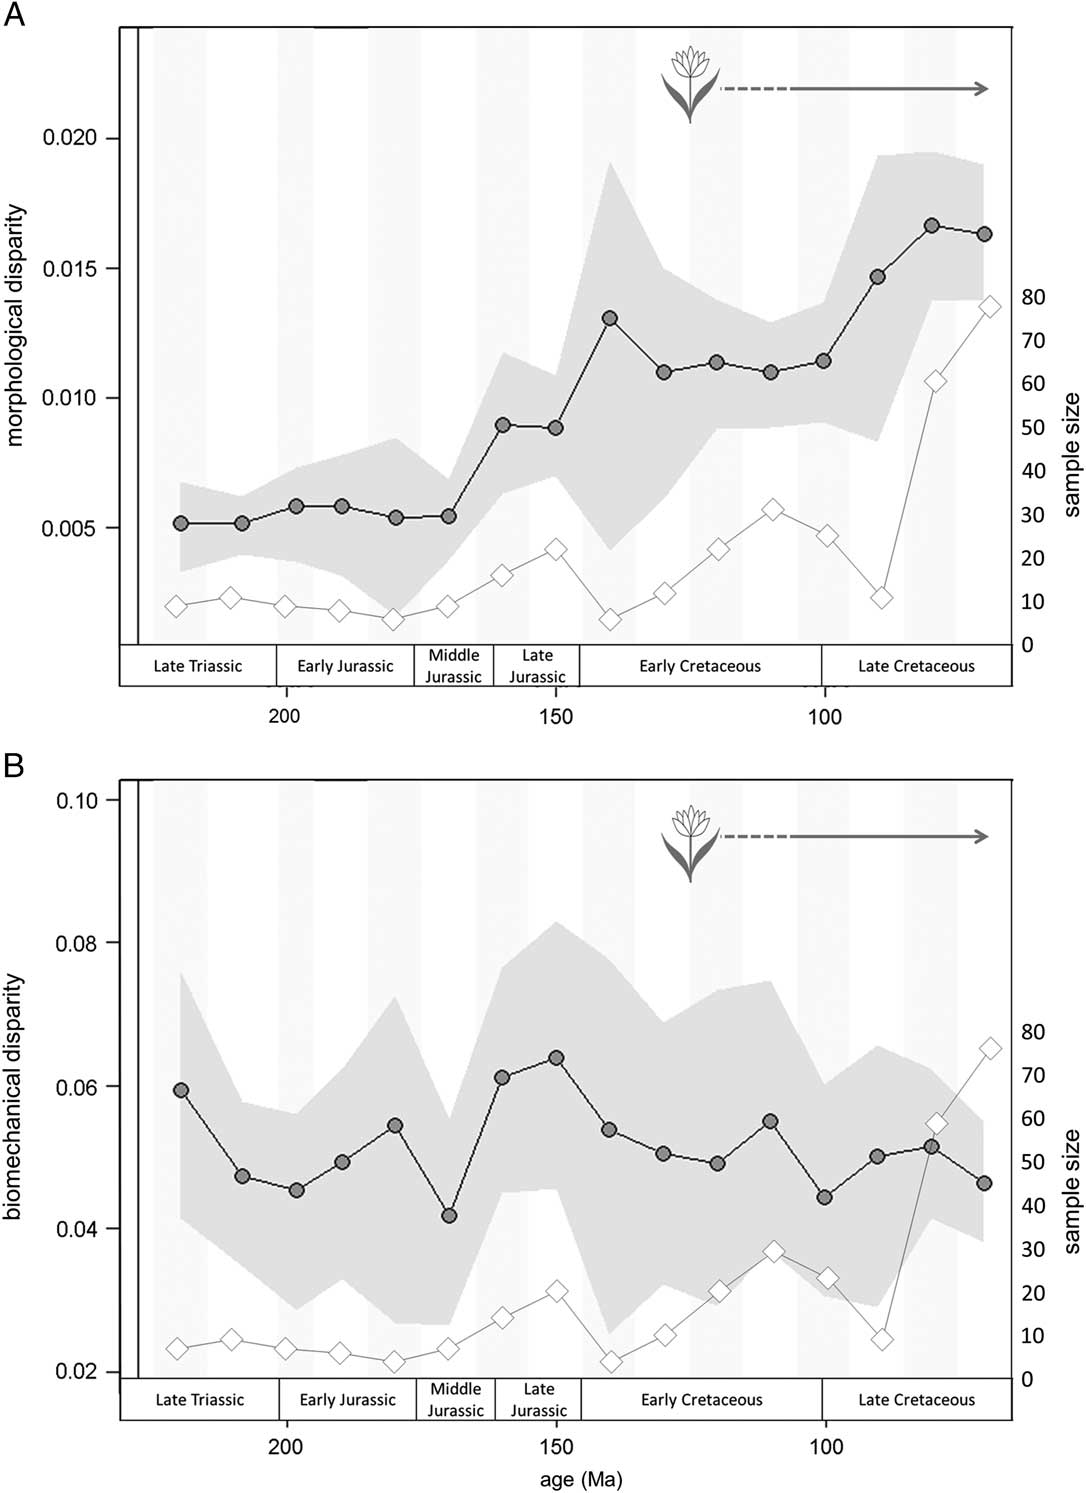
Morphological (shape) and biomechanical disparity measures are decoupled through the Mesozoic (Fig. 7). Morphological disparity primarily tracks sample diversity (Fig. 7A): it does not fluctuate greatly through the first 80 Myr of dinosaur evolution, begins to increase from the Middle Jurassic onward, and reaches a peak in the Late Cretaceous (Fig. 7A). There are no significant differences in disparity between time bins (p>0.05). By contrast, biomechanical disparity undulates through the Mesozoic (Fig. 7B), a decoupling from sample diversity and morphological diversity. Several small peaks and troughs (for example the peak in the Late Jurassic) correspond to increased sample size (Fig. 7B, diamond data points): however, time periods with greatest sample sizes do not correspond to peaks in biomechanical disparity (during the latest Cretaceous, for example). The peak in the latest Jurassic also corresponds with the presence of high-browsing sauropodomorphs (>9 m), which display a higher degree of biomechanical disparity than some lower-browsing forms (p>0.05; see Supplementary Fig. 10). There are no significant differences in disparity between successive time bins for either biomechanical or morphological disparity curves (at p=0.05) and no marginal-likelihood values exceed the threshold value of 8. There are a few instances where disparity diverges markedly from sample size, suggesting that a trend, albeit nonsignificant, might be observed. For example, morphological disparity rises in the Early Cretaceous, immediately after the J/K extinction, and in the early Late Cretaceous, while sample size drops. Likewise, biomechanical disparity drops in the Middle Jurassic while sample size rises slightly. Conversely, in the latest Cretaceous, sample size rises sharply while biomechanical disparity drops very slightly.
Comparison of shape-based and biomechanical disparity curves across 10 Myr time bins based on sum of variance metric. (A) shape-based disparity; (B) biomechanical disparity. Morphological and biomechanical disparity curves are decoupled, with morphological disparity increasing through the Mesozoic and biomechanical disparity peaking in the latest Jurassic. Shaded region spans the 95% confidence intervals based on 1000 bootstrap replicates. Disparity (dots) is plotted alongside jaw specimen sample size curve (diamonds). Flower represents earliest fossil angiosperms (Sun et al. Reference Sun, Ji, Dilcher, Zheng, Nixon and Wang2002; Du and Wang Reference Du and Wang2015).
Discussion
Impact of Extinction on Herbivorous Dinosaur Disparity
Our results from both morphological and biomechanical disparity curves support conclusions from previous studies examining dinosaur disparity around extinction events (Brusatte et al. Reference Brusatte, Benton, Ruta and Lloyd2008a, Reference Brusatte, Butler, Prieto-Márquez and Norell2012). Morphological disparity across the Tr/J boundary increases slightly, likely triggered by the addition of heterodontosaurid jaw profiles to the morphospace (Fig. 7B). Biomechanical disparity decreases from an initial peak in the Carnian (225 Ma) to the Tr/J boundary, across which there is a further nonsignificant decrease (Fig. 7B). The placement of taxa in biomechanical morphospace suggests that both ornithischian and sauropodomorph taxa share similar biomechanical profiles immediately before and after the Tr/J boundary (Figs. 5, 6). By contrast, the transition across the J/K boundary shows a decoupled relationship between biomechanical and morphological disparity (Fig. 7). Morphological disparity after the J/K boundary increases sharply: this pattern can be attributed to the presence of novel jaw morphologies such as those of psittacosaurids and early hadrosauroids in combination with those of new sauropod clades (Fig. 4, 145–125Ma). It should be noted that this disparity increase is nonsignificant, likely due to the low taxon count (n=5). The lack of many dinosaur-bearing formations between the Berriasian and Albian may partially account for the low species richness observed in this interval, although it could also be attributed to the J/K extinction event (Barrett et al. Reference Barrett, McGowan and Page2009; Upchurch et al. Reference Upchurch, Mannion, Benson, Butler and Carrano2011). Nevertheless, shape variation at this time does not track sample diversity. Biomechanical disparity shows a decrease across the J/K boundary (Fig. 7B). The majority of the biomechanical profiles exhibited prior to the J/K boundary do not persist into the earliest Cretaceous (Figs. 5, 6, 145–125Ma), which is consistent with the fundamental faunal turnover that takes place and the proliferation of marginocephalian and ornithopod taxa (e.g., Bakker Reference Bakker1978; Weishampel and Norman Reference Weishampel and Norman1989; Barrett and Willis Reference Barrett and Willis2001). Finally, our results concur with disparity patterns observed in the latest Cretaceous leading to the Cretaceous/Paleogene (K/Pg) mass extinction (Brusatte et al. Reference Brusatte, Butler, Prieto-Márquez and Norell2012): both morphological and biomechanical curves show a decrease in disparity from the Campanian to the Maastrichtian, despite a notable increase in sample size.
Patterns of Morphospace Occupation
Discrete morphospace occupation suggests that, when considered as a single data set, the jaws of sauropodomorphs and ornithischians are different in both shape and in jaw biomechanics (Figs. 1–3). Individual occupation of morphospace by each taxon is graphically represented in Supplementary Figures 2–6. Limited overlap between these clades suggests little competition between ornithischians and sauropodomorphs in feeding function, particularly during the latter part of the Mesozoic (see also Barrett and Upchurch Reference Barrett and Upchurch2005). However, where overlap does occur, it tends to be between the basal members of various ornithischian clades (e.g., heterodontosaurids, basal thyreophorans, and basal ceratopsians) and sauropodomorphs. This suggests that early ornithischians adopted similar morphological and mechanical attributes to their feeding apparatus as macronarian sauropodomorphs (Supplementary Fig. 2, a–c). Later groups of ornithischians radiated into distinct areas of morphospace (Figs. 4–6). Breakdown of morphological and biomechanical morphospace into 20 Myr time bins shows that earlier sauropodomorphs are, in general, replaced in their biomechanical profiles by later sauropodomorphs through the Jurassic and Cretaceous (Figs. 4–6). Sauropodomorph morphospace occupation shows a degree of migration through time, with basal sauropodomorphs occupying different regions of morphospace to Jurassic and Cretaceous neosauropods (Figs. 4–6, filled circles). Some later sauropods show convergence in biomechanical profile with other, earlier forms. For example, the macronarian Camarasaurus occupies very similar regions of morphospace to the earlier diverging eusauropod Datousaurus (Supplementary Fig. 2a–c), despite the former existing around 10Myr earlier: this pattern supports the results of another recent quantitative craniodental study (Button et al. Reference Button, Rayfield and Barrett2014). Similarly, the titanosaurid Antarctosaurus occupies biomechanical morphospace almost identical to the basal macronarian Abrosaurus (Supplementary Fig. 2a–c). Perhaps surprisingly, we find minimal convergent occupation in biomechanical morphospace between titanosaurids (e.g., Antarctosaurus) and diplodocids (e.g., Diplodocus) (Supplementary Fig. 2a–c: see also Button et al. Reference Button, Rayfield and Barrett2014). This pattern is in contrast to shape-based morphospace (this study), in which these groups occupy similar regions of morphospace (Fig. 1 and Supplementary Fig. 2). Both shape-based and biomechanical morphospace patterns show extensive overlap between phylogenetically separate groups of sauropodomorphs. Within the sauropods, brachiosaurids are found to be biomechanically intermediate between basal macronarian sauropods with short snouts and closely packed tooth rows (such as Camarasaurus) and titanosaurids with longer snouts and pencil-like teeth (such as Antarctosaurus), and diplodocids are outliers in this biomechanical morphospace. This pattern supports quantitative work on sauropodomorph cranial morphology related to feeding, with similar placement of the same taxa in cranial (Button et al. Reference Button, Rayfield and Barrett2014) and mandibular morphospace (this study). Late Jurassic sauropods such as Camarasaurus show some morphological overlap in mandibular shape with stegosaurs. By contrast, these same clades show minimal overlap in biomechanical morphospace: only Gigantspinosaurus (Stegosauria) and Manidens (Heterodontosauridae) share occupation of Late Jurassic sauropodomorph biomechanical morphospace (Supplementary Figs. 3,b–c, 4,b–c). This suggests that mandibles with similar gross morphology were biomechanically and functionally differentiated by this time. In general, sauropodomorphs and heterodontosaurids occupy similar regions of both shape-based and biomechanical morphospace and do not extend their occupation of morphospace beyond regions already occupied by the end of the Early Jurassic (Figs. 4–6). From the Middle Jurassic onward, there is slight expansion of morphospace along PC1 by diplodocoid sauropodomorphs and Jurassic ornithopods (e.g., Camptosaurus), which is also reflected in the morphological disparity curve (Fig. 4, 165–145 Ma; Fig. 7A). Morphological disparity shows an increase from the latest Jurassic through the Cretaceous with the evolution of new groups of ornithischian dinosaurs, particularly marginocephalians.
Early Cretaceous marginocephalians (psittacosaurids, Archaeoceratops, and Liaoceratops) occupy novel regions of morphological and biomechanical morphospace: these taxa share regions of biomechanical morphospace with hadrosauroids until the disappearance of basal marginocephalians prior to the last 20 Myr of the Mesozoic (Figs. 4–6, 85–65 Ma). Regions of biomechanical morphospace formerly occupied by psittacosaurids were then occupied exclusively by derived hadrosaurids and ankylosaurs (Figs. 5, 6, 85–65 Ma). However, the morphological profile of psittacosaurids was never replaced. The latest Cretaceous sees an expansion of biomechanical and shape-based morphospace by two distinct groups of marginocephalians: ceratopsids (e.g., Triceratops) and leptoceratopsids (e.g., Udanoceratops). The biomechanical profiles of ceratopsids show no overlap with those of hadrosaurids. This supports the conclusions of Mallon and Anderson (Reference Mallon and Anderson2013) who, in their study of herbivores from the Dinosaur Park Formation (Campanian), found that contemporaneous hadrosaurids, ankylosaurs, and ceratopsids occupied different feeding niches based upon differing cranial and mandibular mechanics and morphologies. This study also supports previous conclusions on niche partitioning between hadrosaurs and ceratopsids (Mallon and Anderson Reference Mallon and Anderson2013). However, this study also found that the majority of derived ceratopsids plot in similar regions of biomechanical morphospace to contemporaneous ankylosaurs, in contrast to the conclusions of Mallon and Anderson (Reference Mallon and Anderson2013). In addition, Asian ankylosaurs show biomechanical morphospace occupation more similar to leptoceratopsids than to ceratopsids or North American ankylosaurs. It should be noted, however, that neither leptoceratopsids nor Asian ankylosaurs were included in Mallon and Anderson (Reference Mallon and Anderson2013), which focused solely on the Dinosaur Park Formation fauna. Leptoceratopsids expand into regions of shape-based and biomechanical morphospace that had no previous occupants: their extreme mandibular morphologies account for the peak in morphological disparity in the latest Cretaceous (Fig. 7A). Contemporaneous taxa include ceratopsids and ankylosaurs that have similar biomechanical profiles to each other (see above). This biomechanical similarity would cause disparity to be low: however, the inclusion of the highly disparate leptoceratopsids (in addition to hadrosaurids and the rhabdodontid Zalmoxes) leads to an increase in biomechanical disparity levels from the early Late Cretaceous. Marginocephalian, ornithopod, and thyreophoran biomechanical morphospace occupation in the latest Cretaceous suggests that these groups, while varying from each other in mandibular shape, also share a variety of functional and biomechanical traits relating to feeding. Late Cretaceous hadrosaurids and ankylosaurids filled the biomechanical roles vacated by Early Cretaceous nonhadrosaurid iguanodontians and nodosaurids, respectively. Individual occupation of morphospace by each taxon can be viewed in Supplementary Figures 2–6.
Dinosaur–Plant Coevolution
Changes in dinosaur communities and feeding regimes during the Late Jurassic–Early Cretaceous interval have been linked to several major floristic changes (decline of cycadophytes, gymnosperms, and pteridophytes; rise of angiosperms to ecological dominance) (e.g., Weishampel and Norman Reference Weishampel and Norman1989; Tiffney Reference Tiffney1992; Mustoe Reference Mustoe2007). Our results provide quantitative evidence that the mandibles of sauropodomorphs and ornithischians evolved different morphologies and biomechanical profiles, potentially enabling them to feed on different plants in different ways. Moreover, their minimal overlap in biomechanical morphospace suggests that there was limited competition between ornithischians and sauropodomorphs when feeding (see also Barrett and Upchurch Reference Barrett and Upchurch2005). Our data demonstrate that there was no significant increase in the biomechanical disparity of the feeding apparatus of either major herbivorous dinosaur clade that was coincident with the proliferation of angiosperms (Fig. 7). Nevertheless, although this novel food source appears to have had no discernible impact on the mandibular biomechanical morphospace occupation of herbivorous dinosaurs, patterns of morphological disparity do show a marked increase coincident with the later Cretaceous proliferation of angiosperms. This coincident increase is not interpreted as indication of direct causality, but reflects the appearance of the highly disparate ankylosaurid and leptoceratopsian jaw morphotypes.
Potential links to cycadophyte decline through the Late Jurassic–Early Cretaceous are less clear. The Early Cretaceous decline in cycadophytes occurred at a time of major faunal change affecting dinosaur clades, but previous analyses of dinosaur and plant distribution have shown that few of the observed changes in dinosaur faunas could be linked directly with cycadophyte decline (Butler et al. Reference Butler, Barrett, Kenrick and Penn2009b). Although reduced biomechanical mandibular disparity across the J/K boundary does coincide with the onset of this event, direct evidence of dinosaur herbivory on cycads is sparse (Hummel et al. Reference Hummel, Gee, Südekum, Sander, Nogge and Clauss2008; Butler et al. Reference Butler, Barrett, Kenrick and Penn2009b; Gee Reference Gee2011), and other causes relating to the poorly understood J/K extinction may also be involved (Butler et al. Reference Butler, Benson, Carrano, Mannion and Upchurch2011; Upchurch et al. Reference Upchurch, Mannion, Benson, Butler and Carrano2011). In addition, morphological disparity after this extinction event shows a notable increase, with different clades of dinosaurs diversifying into new, unexplored regions of mandibular morphospace (e.g., psittacosaurids, early titanosaurs). Results from this study do not support a coevolutionary relationship between herbivorous dinosaur mandibular disparity and angiosperm proliferation and show a similarly negative relationship to the decline of cycadophytes. Rather, patterns of mandibular shape and mechanical diversity seem to be most greatly affected by the extinction and emergence of different dinosaurian clades.
Sampling Issues
When disparity tracks sample diversity closely, as it does in this study for shape-based disparity, sampling bias cannot be ruled out. Morphological disparity in this study partly tracks jaw sample size, suggesting a potential bias in the data set for some features of the disparity curve (e.g., high sample and disparity in latest Cretaceous; Fig. 7A). The use of the sum of variance disparity measure and bootstrapping the data has accounted for sample size as best as is possible for the data set (Foote Reference Foote1992, Reference Foote1994; Ciampaglio et al. Reference Ciampaglio, Kemp and McShea2009) (Fig. 7A). Peaks of high shape disparity in the earliest Cretaceous and early Late Cretaceous do not correlate with peaks in sample size. Biomechanical variation displays a different trend, demonstrating a decoupling of morphological and biomechanical diversity through time. A peak in biomechanical disparity in the Late Jurassic is coincident with an increase in jaw sample size, but also corresponds to the evolution of high-browsing (>9 m) sauropods (e.g., Upchurch and Barrett Reference Upchurch and Barrett2000). In addition, many of the sauropod taxa in this time slice are recovered from the Morrison Formation of the western United States (n=6 out of a total of 14 sauropods). The exclusion of the Morrison taxa removes the Late Jurassic peak in biomechanical disparity (Supplementary Fig. 8i). A similar jackknifing of the taxa from the Dashanpu Formation (including the “Upper and Lower Shaximiao” formations) yielded a trough in disparity in the Middle Jurassic but retained a strong peak in the latest Jurassic (Supplementary Fig. 8ii). These results suggest that the data may be sensitive to the inclusion or exclusion of particularly rich fossil-bearing sites. In addition, the lack of available jaw material from North and South American titanosaurs seriously underrepresents sauropodomorph diversity in the Cretaceous. The addition of titanosaurid taxa to the analysis may increase both the disparity and overall morphospace occupation of sauropodomorphs, although the titanosaur jaws sampled in this study already account for a broad range of morphologies (Supplementary Fig. a–c, taxon 37–44).
Supplementary analyses of biomechanical and shape-based disparity within sauropodomorphs in relation to maximum feeding height show higher levels of disparity in high-browsing sauropods (>9 m; e.g., Brachiosaurus, Mamenchisaurus) when compared with mid-browsing taxa (6–9 m; e.g., Camarasaurus), and almost equal in disparity to very low-browsing sauropodomorphs (0–3 m; e.g., Pantydraco, Riojasaurus) (see Supplementary Fig. 10). This pattern contrasts with sample diversity, with the lowest sample size found in the high-browsing feeding envelope (n=6) (Supplementary Fig. 10). Unfortunately, low sample sizes within each feeding level prevent any significant differences or definitive conclusions to be made. However, this pattern remains intriguing and the addition of more mandibular remains from high- and mid-browsing taxa to our sample (as and when they are discovered) would complement this study. This is an avenue of study that requires more investigation in the future to enable deeper insights into niche partitioning between sauropod groups based on maximum browse height.
Relatively few Early Cretaceous sauropodomorph, thyreophoran, or marginocephalian taxa possess well-preserved mandibular material (see list of taxa in Supplementary Material). The dip in biomechanical disparity after the J/K recovered by our analyses may, therefore, be an artefact due to either geological biases or uneven collection effort, underrepresenting the true diversity of jaw biomechanical profiles at this time. Due to the lack of complete mandibles from rebbachisaurids, dicraeosaurids, and other clades, it is possible that the latest Jurassic and earliest Cretaceous disparity levels reported herein are currently undersampling the total diversity of mandible morphology and potential function. Such exclusions cannot be corrected for by our analyses and represent a limitation of the fossil material currently available.
Conclusions
For the first time, we have quantified the morphological and biomechanical variation of ornithischian and sauropodomorph jaws throughout the Mesozoic and examined how diversity related to external extrinsic drivers such as extinction events and the rise of angiosperms. We find that herbivorous dinosaur clades have jaws that occupy different regions of morphospace throughout the Mesozoic. Furthermore, sauropodomorphs and ornithischians have jaws that also function in broadly different ways, yet there is some potentially convergent overlap in biomechanical function between different ornithischian clades in the Cretaceous. Basal members of each clade tend to be more similar in form and function to each other, while derived taxa are more functionally and morphologically divergent. Herbivorous dinosaur jaws maintained a numerically steady diversity of biomechanical traits, with a peak observed in the Late Jurassic triggered by the diversification of high-browsing sauropods. This is consistent with a rapid evolutionary radiation in biomechanical diversity among herbivorous dinosaurs followed by a plateau. The Tr/J extinction had no overall effect on biomechanical variation among herbivorous dinosaurs, despite fundamental changes in floral and faunal composition across the boundary. This consistency suggests that Early Jurassic dinosaurs filled the functional feeding niches vacated by the extinction of Late Triassic taxa. Similar successive replacement patterns are also seen in Devonian gnathostomes and Devonian to mid-Pennsylvanian tetrapodomorphs (Anderson et al. Reference Anderson, Friedman, Brazeau and Rayfield2011, Reference Anderson, Friedman and Ruta2013). Biomechanical disparity across the J/K boundary suggests that large-scale faunal turnover at this time did affect mandibular disparity, which did not recover to pre-J/K disparity levels through the Cretaceous (Fig. 7). A diverse fauna of high-browsing sauropods did not persist into the Early Cretaceous, and the sauropodomorph contribution to overall disparity wanes through the Cretaceous, despite a later increase in their Late Cretaceous species richness. The highly specialized psittacosaurids were not replaced in their biomechanical profile. However, their role as a biomechanically disparate group in Asia is later filled by Late Cretaceous leptoceratopsids (e.g., Udanoceratops), a group that is also present in North America. Late Cretaceous hadrosaurids and ankylosaurids filled the biomechanical roles vacated by Early Cretaceous nonhadrosaurid iguanodontians and nodosaurids respectively. Our results imply that, after the establishment of peak overall biomechanical variation in the latest Jurassic, only marginocephalians demonstrated widespread variation in biomechanical profiles over time, triggered by the isolated adaptive radiations of psittacosaurids and leptoceratopsians. The remainder of Cretaceous herbivorous dinosaurs underwent progressive niche replacement, with successive replacement by related taxa with comparable biomechanical profiles.
Acknowledgments
The authors would like to thank D. Button and T. Stubbs (both University of Bristol) for taxonomic and methodological discussion and S. Chapman (NHM) for specimen provision. Funding support was received from the Bob Savage Fund of University of Bristol and from a BBSRC grant BB/I011668/1 awarded to E.J.R. Helpful reviews of this contribution were received from J. Whitlock and an anonymous referee. P.S.L.A., E.J.R., and P.M.B. conceived and developed the project idea. J.A.M. collected the data and performed the analyses. J.A.M., along with P.S.L.A., E.J.R., and P.M.B. interpreted the data. All authors contributed to writing the manuscript. J.A.M. designed and prepared the figures.
Supplementary Material
Data available from the Dryad Digital Repository: http://dx.doi.org/10.5061/dryad.c78k5


 Open access