


Physical health is strongly related to the type and number of gut bacteria in hosts. The production of SCFA such as Butyrate by health-promoting bacteria fosters immunomodulatory effects and health(Reference Mohr, Jäger and Carpenter1). These bacteria are also relevant to athletes’ health and exercise performance(Reference Mohr, Jäger and Carpenter1–Reference Barton, Penney and Cronin3) because the gut microbiome is closely linked to organ functions, such as the brain(Reference Mayer, Tillisch and Gupta4–Reference Jenkins, Nguyen and Polglaze6) and muscle(Reference Mach and Fuster-Botella7,Reference Ticinesi, Lauretani and Milani8) . Metabolites from gut bacteria, such as SCFA, modulate signalling(Reference Lee and Hase9); activate metabolic pathways(Reference Nicholson, Holmes and Kinross10–Reference Canfora, Jocken and Blaak12) and insulin sensitivity(Reference Kimura, Ozawa and Inoue13), particularly in skeletal muscle metabolism; and may affect the control of body weight and exercise performance(Reference Hughes2,Reference Canfora, Jocken and Blaak12) . SCFA are produced by gut microbiota, such as Bacteroidetes and Lachnospiraceae (Reference Zhang, Yu and Xiao14). It has been suggested that Bacteroidetes are increased from exercise and gut bacteria, and exercise adaptations may play a role(Reference Shukla, Cook and Meyer15–Reference Motiani, Collado and Eskelinen17). Among SCFA, Butyrate has been shown to be a key modulator of energy metabolism and mitochondrial function by activating PGC-1α gene expression in skeletal muscles and brown adipose tissue(Reference Gao, Yin and Zhang18). The study has also demonstrated that dietary Butyrate supplementation improves insulin sensitivity and increases energy expenditure by enhancing mitochondrial function in animals(Reference Gao, Yin and Zhang18). Moreover, increasing bacterial diversity is important for improving adaptability to external stimuli, such as environment and exercise. Furthermore, the diversity of gut bacteria in athletes is higher than that of the general public, which suggests that gut bacteria are adapted to stimulation by exercise and training(Reference Clarke, Murphy and O’Sullivan19). Taken together, the diversity of gut microbiota and exercise-induced bacteria, such as Butyrate-producing bacteria, would be beneficial for athletes who engage in high-intensity training.
The gut is highly adaptable to external factors, such as lifestyle and environmental stimuli. The composition and diversity of gut bacteria are affected by the genetic elements (age, sex and birth route(Reference Yatsunenko, Rey and Manary20,Reference Mueller, Saunier and Hanisch21) ) and external factors (diet(Reference Wu, Chen and Hoffmann22), exercise(Reference Allen, Mailing and Niemiro23) and antibiotics(Reference Dudek-Wicher, Junka and Bartoszewicz24)). In particular, diet strongly influences the gut microbiome, and this change is caused by long-term dietary patterns(Reference Wu, Chen and Hoffmann22) and short-term interventions of several weeks(Reference Duncan, Belenguer and Holtrop25,Reference Walker, Ince and Duncan26) . For many athletes, carbohydrates are the main energy source to maintain performance and recover glycogen stores(Reference Reguant-Closa, Roesch and Lansche27,Reference Burke, Hawley and Wong28) . Recent studies have shown that increased intake of carbohydrates in the form of dietary fibre is associated with an increase in the diversity of gut bacteria(Reference Mohr, Jäger and Carpenter1,Reference Tap, Furet and Bensaada29) . Fats are also important substrates for energy metabolism. Although previous studies have reported that a high-fat diet reduces the diversity of gut bacteria and increases the Firmicutes ratio(Reference Hildebrandt, Hoffmann and Sherrill-Mix30,Reference Brandt, Kotowska and Kristensen31) , the effects of a small amount of fat remain unclear. Therefore, an effective low-dose fat intake strategy is warranted to support fuelling in athletes, especially during high-intensity training periods.
There is inconsistent evidence about the effect of fat intake on the gut microbiome and functions in human and animals. In terms of types of fats, fish oil and unsaturated fatty acid intake increased probiotics, such as Bifidobacterium and Lactobacillus (Reference Singh, Chang and Yan32,Reference Caesar, Tremaroli and Kovatcheva-Datchary33) . Saturated fat acid does not increase these bacteria(Reference Caesar, Tremaroli and Kovatcheva-Datchary33). In addition, a high saturated fat diet reduces bacterial numbers and increases the excretion of SCFA(Reference Fava, Gitau and Griffin34). A recent review concluded that the n-3 fatty acid favours the Butyrate-producing bacterial genera, whereas a saturated fat-rich diet can attenuate the gut microbiota of these commensal bacteria(Reference Costantini, Molinari and Farinon35). Moreover, the effect of fat intake on gut microbiota depends on the type of fatty acid. n-3 fatty acids provide multiple health benefits, such as lowering blood pressure(Reference Paschos, Magkos and Panagiotakos36) and preventing diseases (Reference Reiner, Stivala and Limacher37–Reference Miles and Calder39), including inflammatory bowel disease(Reference Calder40). It also has several benefits on exercise, including post-exercise muscle recovery (Reference Macartney, Hingley and Brown41–Reference Tinsley, Gann and Huber43), training-induced muscle strength(Reference Rodacki, Rodacki and Pereira44), reduced muscle loss and inflammation (Reference Smith, Julliand and Reeds45,Reference Jouris, McDaniel and Weiss46) , endurance ability(Reference Zebrowska, Mizia-Stec and Mizia47) and brain health(Reference Heileson, Anzalone and Carbuhn48). In addition, n-3 fatty acids play an important role in physiological adaptation to produce metabolites through cell receptors (Reference Oh, Talukdar and Bae49,Reference Ichimura, Hirasawa and Poulain-Godefroy50) .
Perilla oil is rich in α-linolenic acid, a type of n-3 fatty acid, which also contains small amounts of linoleic acid of n-6 fatty acid and oleic acid of n-9 fatty acid. These fatty acids have different properties, but through the intake of perilla oil, a combination of the benefits of these acids can be obtained. Perilla oil contains a large amount of n-3 fatty acids not found in other seed oils such as olive oil and maize oil, which are mainly composed of n-6 and n-9 fatty acid and have extremely low amounts of n-3 fatty acids. Furthermore, perilla oil is a traditional Japanese food that can be consumed daily – a notable strength as a research food in this study.
Since the gut environment is correlated with organ function, daily n-3 intake may enhance the function of other organs through the improvement of the gut environment. Athletes are required to adapt to muscle and other organ functions at a high level. Therefore, strategies for improving the gut environment to efficiently metabolise nutrients are required. Although previous studies have investigated the effects of n-3 fatty acids on the gut environment in animals, healthy humans and patients(Reference Costantini, Molinari and Farinon35), we hypothesised that n-3 fatty acid supplementation could also improve the gut function of athletes. We aim to find an effective use of perilla oil that fuels energy and improves gut function in athletes and evaluate different dose-dependent effects.
Experimental methods
Participants
Thirty-six female athletes belonging to a university volleyball club (age: 20·2 (s e 1·3) years, height: 167·8 (s e 7·8) cm, body weight: 63·4 (s e 6·6) kg) were recruited. All participants trained six times a week, an average of 4·5 h per day. This study was conducted according to the guidelines laid down in the Declaration of Helsinki and all procedures involving participants were approved by the ethics committee of Nippon Sport Science University (No. 018-H193) and the University Hospital Medical Information Network Clinical Trials Registry in Japan (No. UMIN000044882). All participants signed a written consent form after being informed on the purpose of the study, methods, possible health hazards, risks, privacy protection, data management and publication. None of the participants was not using supplements and medicines, and history of chronic disease and smoking. The recruitment, data collection and follow-up were conducted from October 2019 to December 2020. All data were collected pre-, during and post-intervention at the Nippon Sport Science University.
Body composition was measured using bioelectrical impedance analysis (InBody730, InBody Co., Ltd.), and the physical characteristics of participants are shown in Table 1. All participants live in university dormitories and daily meals are provided by a dietitian. Since the participants competed in the same sports club and trained six times a week in same training menus, there was no difference in the training load between participants and phases during the intervention period.
Physical characteristics of participants in pre- and post-intervention
(Mean values with their standard errors)

n 12. HOI: 9 g/d perilla oil intake group, LOI: 3 g/d perilla oil intake group, PLA: placebo-intervention, Pre: pre-intervention, Post: post-intervention.
Experiment design
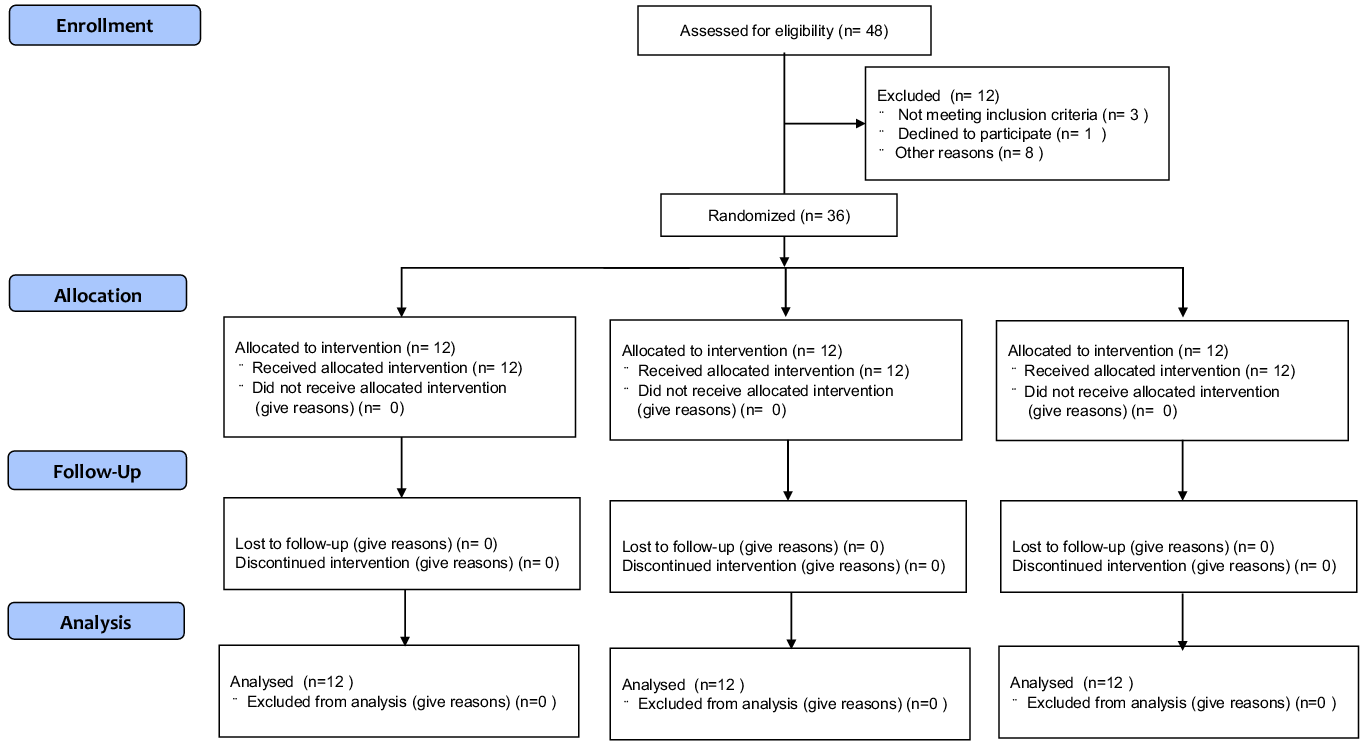
Forty-eight participants were eligible for this randomised trial, of whom twelve were excluded from the trial: three of them did not meet the criteria, one declined to participate and eight were not allowed to undergo intervention owing to physical reasons. Finally, thirty-six participants were involved in the trial and equally divided into three groups by a third party according to their perilla oil intake as follows: high oil intake (HOI) (9 g/d), low oil intake (LOI) (3 g/d) and placebo-supplementation (PLA) groups (Fig. 1). The participants were blinded to their groupings, which were concealed by sequential numbers. The HOI group received 3 g of perilla oil-containing jelly three times per day (9 g/d of perilla oil), while the LOI group received 3 g of perilla oil-containing jelly once per day (3 g/d of perilla oil). The PLA group ingested a jelly with the same shape and taste as perilla oil-containing jelly once per day (0 g/d of perilla oil) during the intervention period. Subsequently, we compared the effects of high doses with those of the generally recommended dose of n-3 fatty acids for athletes (Reference Simopoulos51,Reference Maughan, Burke and Dvorak52) and placebo intake. Participants were instructed to maintain their diet, training or lifestyle during the intervention period. We referred to a previous double-blinded, randomised, controlled study examining the effects of nutrient intake on athletes’ gut microbiota to determine the number of participants(Reference Moreno-Pérez, Bressa and Bailén53).
CONSORT flow diagram for the randomised controlled trials.
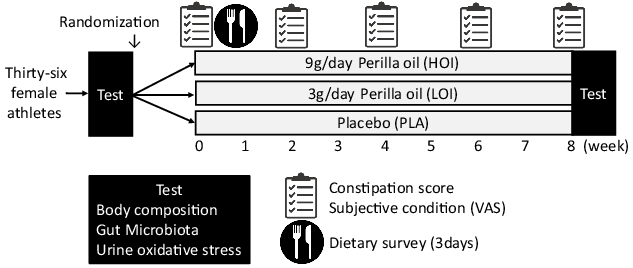
We investigated body weight, body composition, gut microbiota and urinary biochemical index (indoxyl sulphate, 8-hydroxydeoxyguanosine:8-OHdG). In addition, data on constipation score, subjective condition questionnaire about fatigue, sleep quality, appetite, psychological stress and training load using the visual analogue scale method and sleep hours were obtained pre-intervention and every 2 weeks thereafter (Fig. 2).
Experiment design.
Faecal microbiota
Bacterial DNA from faecal samples was collected in a solution containing 4 M guanidine thiocyanate for analysis. Faecal samples were pre-treated with zirconia beads, followed by DNA extraction and purification using an automated DNA extraction and purification system (Maxwell®, Promega Corporation). 16S rRNA bacterial primers containing the V1 and V2 regions – targets for determining the species(Reference Kim, Suda and Kim54,Reference Nishijima, Suda and Oshima55) – were prepared. The following cycling conditions were employed: 10 s at 98°C, 10 s at 55°C and 5 s at 72°C for 20 cycles. Then, the samples were subjected to next-generation sequencing, and approximately 300 bases, including the V1–V2 variable regions, were analysed as described previously(Reference Kim, Suda and Kim54). The number of effective reads per sample was approximately 30 000–100 000. Then, the α-diversity (Shannon index) was determined and bacteria were identified. Diversity analysis was performed using an Excel add-on (Ekuseru-Toukei 2015, Social Survey Research Information Co., Ltd.), and the outcomes were presented using Shannon indexes. All phylum-, family- and genus-level changes were analysed. Detection and analysis of faecal bacteria were outsourced (SheepMedical Co., Ltd.).
Constipation score
A subjective questionnaire by Agachan et al. (Reference Agachan, Chen and Pfeifer56) was used to assess constipation status during the intervention period (pre-intervention and every 2 weeks thereafter). The survey included frequency of bowel movements, difficulty of defecation, abdominal pain, time required for the laboratory, need for assistance, number of failures and history of constipation. The total scores ranged from 0 to 30, with 0 indicating no constipation and 30 indicating severe constipation. The change in score was calculated from the pre-value minus the lowest value during the intervention.
Urinary biochemical index
Indoxyl sulphate is a gut-derived uremic toxin mainly produced from tryptophan-containing foods, such as egg white, meat, milk, cheese and soya product(Reference Ikee, Sasaki and Yasuda57). 8-OHdG is a biomarker of oxidative DNA damage(Reference Kasai58). These indicators were outsourced for analysis (Healthcare Systems Co., Ltd.).
Perilla oil supplementation and nutrient intake
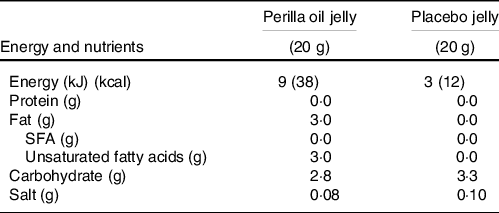
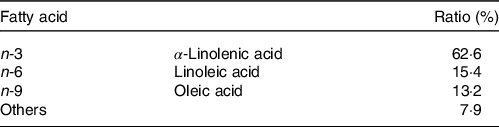
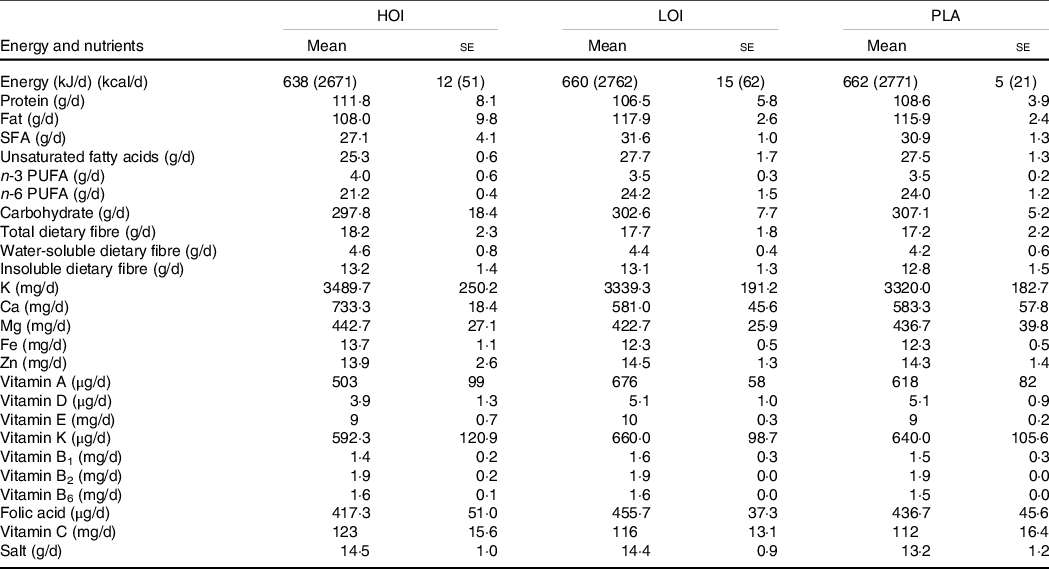
Perilla oil is a traditional Japanese seed oil that contains high levels of n-3 fatty acids. Perilla oil-containing jelly was provided to the HOI and LOI group participants, and placebo jelly was provided to the PLA group participants. Both jellies were lemon-flavoured, obscuring the natural nutty taste of perilla oil. Participants in the HOI group ingested one jelly after breakfast, lunch and dinner, whereas those in the LOI and PLA group ingested one jelly after lunch. Nutritional components per jelly and fatty acid composition in perilla oil are shown in Tables 2 and 3.
Nutritional components of perilla and placebo jelly per one portion
Fatty acid composition in perilla oil
A dietary assessment was conducted using a dietary record maintained for 3 consecutive days to calculate participants’ nutrient intake pre-intervention. All participants could eat freely during the intervention, and their food intakes were recorded using a food diary and camera to click food pictures. Then, a dietitian reviewed their diet and estimated participants’ energy, macronutrient intake, dietary fibre, vitamins and minerals using a software (NEW HEALTHY ver. Tokyo Shoseki Co., Ltd.).
Subjective condition
The degree of subjective conditions on fatigue, sleep quality, appetite, psychological stress and training load was measured using the visual analogue scale method. The participants were asked to indicate the degree of subjective on a 100-mm horizontal line. The left side (0 mm) indicated ‘having bad condition’, whereas the right side (100 mm) showed ‘having good condition’.
Statistical analysis
All data are reported as mean values with their standard error. Differences within groups and between groups were determined using the paired t test and unpaired t test or ANCOVA, respectively. When significant differences were determined using ANCOVA, post hoc analyses were conducted using the Bonferroni test. For parameters with skewed distribution, the Kruskal–Wallis test was performed for comparison of the three groups. Cohen’s d was calculated to measure the effect size. Statistical analysis was performed using SPSS ver.25 (IBM Japan Inc.), and p values < 0·05 were considered statistically significant.
Results
The participants were excellent adherence to the intervention with no dropouts.
Body composition
There were no significant differences in body weight (kg), BMI (kg/m2), body fat (%) and skeletal muscle mass (kg) between pre- and post-intervention in all groups (Table 1). Habitual sleep hours (h:min) at pre- and post-intervention were 6:46 (se 0:12) and 6:30 (se 0:11) in the HOI group, 6:39 (se 0:23) and 6:50 (se 0:23) in the LOI group and 6:58 (se 0:22) and 6:50 (se 0:13) in the PLA group, respectively, with no difference between the groups.
Faecal microbiota
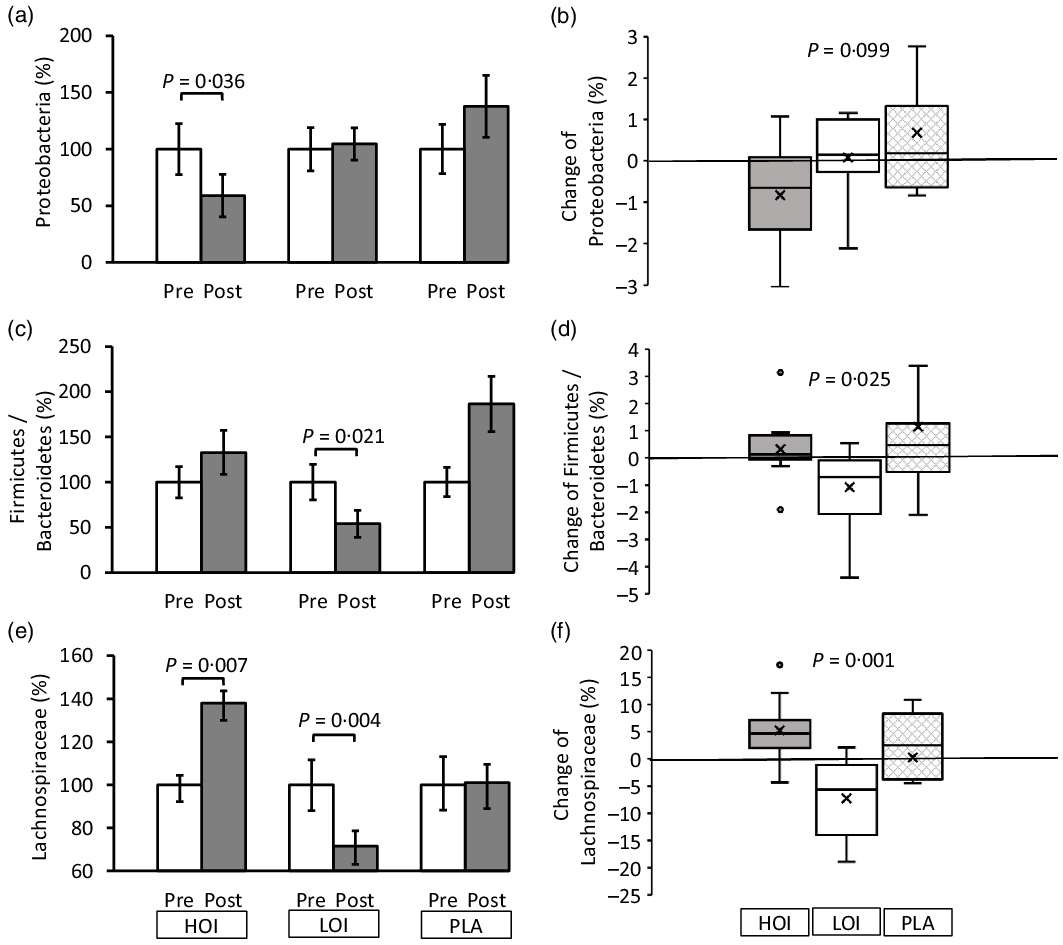
The α-diversity pre- and post-intervention changed from 3·96 (se 0·11) to 4·19 (se 0·14) in the HOI group (P = 0·147), 4·46 (se 0·11) to 4·18 (se 0·14) in the LOI group (P = 0·107) and 4·22 (se 0·12) to 4·39 (se 0·15) in the PLA group (P = 0·955). No differences were observed between the groups. Regarding bacterial changes at the phylum level, the spoilage bacteria, Proteobacteria, significantly decreased post-intervention (1·2 (se 0·2)) compared with those pre-intervention (2·0 (se 0·5)) in the HOI group (P = 0·036, d = 0·53). There was no change between pre- and post-intervention in the LOI and PLA groups. The change tended to be different among the three groups (P = 0·099). Firmicutes were significantly decreased post-intervention (47·2 (se 4·0)) compared with those pre-intervention (56·5 (se 4·5)) in the LOI group (P = 0·002, d = 0·59). In contrast, Bacteroidetes were significantly increased post-intervention (43·2 (se 3·7)) compared with those pre-intervention (31·6 (se 3·8)) in the LOI group (P = 0·004, d = 0·89). The changes in these bacteria were significantly different between the groups (P = 0·016). Additionally, the Firmicutes/Bacteroidetes (F:B) ratio was significantly decreased post-intervention (1·3 (se 0·2)) compared with that pre-intervention (2·3 (se 0·5)) in the LOI group (P = 0·021, d = 0·68). The changes were significantly different between the groups (P = 0·025). For the bacterial changes at the family level, Butyrate-producing bacteria, Lachnospiraceae, were significantly increased post-intervention (19·0 (se 1·6)) compared with those pre-intervention (13·8 (se 1·3)) in the HOI group (P = 0·007, d = 1·2). In contrast, they were significantly decreased post-intervention (18·2(se 2·0)) compared with those pre-intervention (25·5 (se 3·4)) in the LOI group (P = 0·004, d = 0·62) and did not change in the PLA group. The change was significantly different among the three groups (P = 0·001) (Table 4, Fig. 3).
The relative abundance of faecal bacteria pre- and post-intervention at the phylum and family level
(Mean values and standard deviations)

n 12. HOI: 9 g/d perilla oil intake group, LOI: 3 g/d perilla oil intake group, PLA: placebo-intervention, Pre: pre-intervention, Post: post-intervention.
* Differences pre- and post-intervention within the groups.
† Differences in changes between the groups.
Changes in faecal microbiota pre- and post-intervention at the phylum and family level. (a), (c), (e) Comparison of the faecal microbiota within and between the groups. (b), (d), (f) Changes of the faecal microbiota between the groups. Data are presented as the mean values with their standard error, minimum and maximum, n 12. P-value; differences pre- and post-intervention within the group or difference of the changes between groups, HOI: 9 g/d perilla oil intake group, LOI: 3 g/d perilla oil intake group, PLA: placebo-intervention, Pre: pre-intervention, Post: post-intervention.
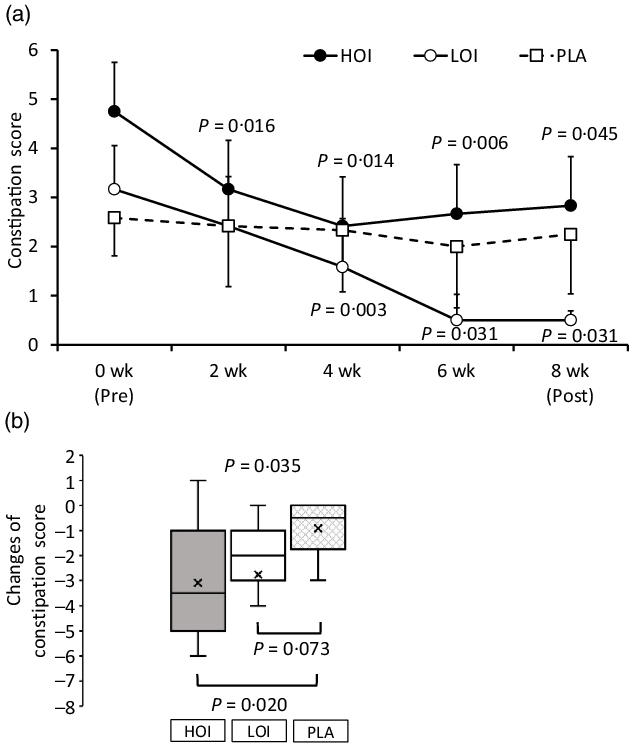
Constipation score
The constipation score was significantly decreased during the intervention period in the HOI and LOI groups; however, there was no change in the PLA group. The change was significantly lower in the HOI group (P = 0·020) and tended to be lower in the LOI group (P = 0·073) than that in the PLA group (Fig. 4). Changes were significantly different between the groups (P = 0·035).
Comparison of the constipation score between the groups. (a) Constipation score during intervention period. (b) Changes of the constipation score between the groups. Data are presented as the mean values with their standard error, minimum and maximum, n 12. P-value; differences pre- and during/post-intervention within the group, differences compared with PLA or differences between groups, HOI: 9 g/d perilla oil intake group, LOI: 3 g/d perilla oil intake group, PLA: placebo-intervention, Pre: pre-intervention, Post: post-intervention.
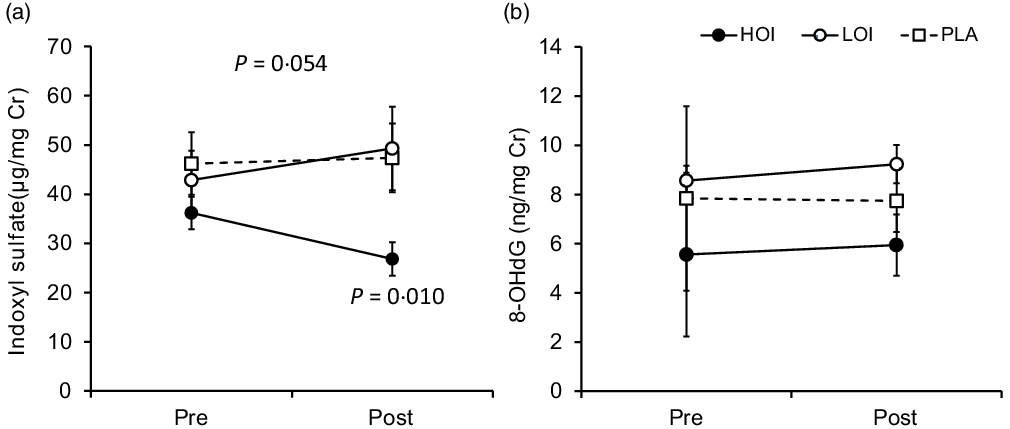
Urinary biochemical index
Indoxyl sulphate (µg/mg Cr), which is an indicator of the deterioration of the intestinal environment, was significantly decreased post-intervention (26·8 (se 3·4)) compared with that pre-intervention (36·2 (se 3·3)) in the HOI group (P = 0·010, d = 0·82). The change tended to be different among the three groups (P = 0·054). 8-OHdG, a biomarker for oxidative damage of DNA, did not change between pre- and post-intervention in all groups (Fig. 5).
Changes in urinary biochemical index pre- and post-intervention. (a) Comparison of indoxyl sulphate within and between the groups. (b) Comparison of 8-OHdG within and between the groups. Data are presented as the mean values with their standard error, n 12. P-value; differences pre- and post-intervention within the group or difference of the changes between groups.
Perilla oil supplementation and nutrient intake
Harms or unintended effects by perilla oil supplementation were not reported.
The daily increase in energy intake through consumption of the jelly was 114, 38 and 12 kcal in the HOI, LOI and PLA groups, respectively. The intake of unsaturated fatty acids, n-3 fatty acid and n-6 fatty acid acids by groups did not differ significantly before the intervention. Similarly, the intake of total energy, fat, carbohydrate, fibre, vitamins and minerals by the groups did not differ significantly before the intervention (Table 5). Notably, none of the participants changed their eating habits during the intervention period.
Daily intake of nutrients pre-intervention
(Mean values with their standard errors)
n 12. HOI: 9 g/d perilla oil intake group, LOI: 3 g/d perilla oil intake group, PLA: Placebo-intervention group, Pre: pre-intervention, Post: post-intervention.
Subjective condition
There was no significant change in the subjective condition every 2 weeks in all groups (Table 6).
Subjective condition during the intervention period
(Mean values with their standard errors)

n 12. HOI: 9 g/d perilla oil intake group, LOI: 3 g/d perilla oil intake group, PLA: placebo-intervention.
Discussion
Our study revealed that 8-week 9 g/d n-3 fatty acid intake increased the abundance of Butyrate-producing bacteria and relieved constipation in trained female athletes. We speculated that the intake of n-3 fatty acids increased gut SCFA by increasing Butyrate-producing bacteria(Reference Zhang, Yu and Xiao14) although SCFA could not be measured in this study. In contrast, 3 g/d of perilla oil decreased Lachnospiraceae. This change was considered the result of the degradation of the occupancy rate of butyric acid-producing bacteria by the significant increase in Bacteroidaceae at the family level and Bacteroidetes at the phylum level. Previous studies have reported that n-3 fatty acids cause different changes in the gut microbiota profile according to dose(Reference Nielsen, Nielsen and Lauritzen59). Our study suggested that 9 g/d perilla oil intake was sufficient to increase Butyrate-producing bacteria on trained female athletes, but 3 g/d perilla oil intake was not. Ingestion of 3 g of perilla oil increased the abundance of Bacteroidetes and decreased the F:B ratio, which may lead to the production of SCFA. In addition, Lachnospiraceae were lower at baseline in the HOI group, and Bacteroidetes in the LOI group were lower than that in other groups at baseline, which may have led to the increase of these bacteria due to perilla oil intake. The changes in these bacteria may be related to the gut microbiota of the host at baseline. Taken together, the ingestion of perilla oil is superior in increasing SCFA-producing bacteria.
Butyrate and SCFA ameliorate inflammatory bowel disease; however, the mechanism of action remains unelucidated(Reference Sun, Wu and Liu60). A previous study has shown that functional constipation is associated with altered concentrations of butyric acid in mice(Reference Wang, Hu and Xu61). Other studies have shown that SCFA stimulate the mucous membrane of the large intestine to promote intestinal peristalsis (Reference Yajima62,Reference Grider and Piland63) . Therefore, growing Butyrate may improve gastrointestinal disorders, such as constipation. Our study revealed that constipation scores relieved 2 weeks after the intervention in the HOI group and 4 weeks after in the LOI group of female athletes. Therefore, increased intake of perilla oil relieved constipation in a short period. The relationship between relieve constipation and gut microbiota remains unelucidated, and our study suggests that Butyrate-producing bacteria may contribute to functional gut improvement. In addition, ingestion of 9 g/d perilla oil suppressed the growth of Proteobacteria, which are related to gut microbiota disturbance. In addition, the uremic toxin indoxyl sulphate was suppressed in the HOI group, which may have led to the improvement of gut function(Reference Mishima, Fukuda and Shima64). Although Proteobacteria and urinary indoxyl sulphate levels were not different between the groups at baseline, they did not change in the LOI group. Therefore, the dose of perilla oil that suppresses indicators related to gut microbiota disturbance should be investigated in the future. Therefore, perilla oil may improve gut microbiota in athletes, and ingestion of 9 g/d perilla oil that is higher than the recommended dose of n-3 fatty acid(Reference Maughan, Burke and Dvorak52) further improves the gut function.
Regarding functional gut disorders, several cross-sectional studies have shown that females are more likely to report constipation than males(Reference Everhart, Go and Johannes65,Reference Harari, Gurwitz and Avorn66) and nearly half of female athletes who are involved in strenuous exercise have gastrointestinal disorders(Reference Moses67). Gut disorders may impair the absorption of nutrients and cause functional disorders, which leads to performance degradation in athletes. Therefore, increasing Butyrate-producing bacteria may benefit female athletes. It has been reported that stimulation and stress caused by excessive exercise may lead to degradation of the diversity of gut bacteria(Reference Yuan, Xu and Huang68). Since the gut environment of athletes is exposed to exercise-induced excessive stress, the gastrointestinal function of athletes tends to deteriorate. Nevertheless, athletes have a higher diversity of gut bacteria than the general population to adapt to external stimuli(Reference Clarke, Murphy and O’Sullivan19). This study suggests that perilla oil intake would support to suppress gut stress and constipation in high-intensity trained athletes. However, there was no change in the diversity of gut bacteria, 8-OHdG and subjective conditions during the 8-week intervention in this study. In the future, long-term intervention may change these indicators by improving the gut environment.
Finally, despite the additional energy of 114 kcal/d in the HOI group and 38 kcal/d in the LOI group, body weight and body fat did not change. Therefore, daily intake of n-3 perilla oil may support athletes’ fuel intake without unexpected weight gain. A simple method to ensure the intake would be to include three teaspoons of perilla oil (approximately 9 g of oil) to daily diet such as salad, or bread and pasta. Gut microbiota differs depending on race and may be different to Japanese and people from other countries(Reference Hehemann, Correc and Barbeyron69). Therefore, perilla oil might be effective in improving gut function and microbiota, at least in Japanese athletes. In addition, perilla oil intake for several weeks or more is desirable to improve constipation. Since the effect on gut microbiota differs depending on the dose of perilla oil, further studies are needed to investigate the appropriate intake. Moreover, it has been shown that ingestion of n-3 fatty acid improved muscle function(Reference Rodacki, Rodacki and Pereira44,Reference Zebrowska, Mizia-Stec and Mizia47) , in addition to producing metabolites(Reference Costantini, Molinari and Farinon35). Therefore, daily intake of perilla oil may help improve athletic performance.
Our study showed that the n-3 fatty acid-rich perilla oil increased butyric acid-producing bacteria and improved gut function. However, this study has several limitations. First, the HOI group received the intervention three times daily to reach the targeted dose, while the other two groups received it once daily. These three groups did not follow the same intervention protocols. However, the study design was unified except for the variation of intake timing. Second, daily surveys throughout the intervention period could not be conducted because it would tremendously inconvenience participants. Although we conducted a dietary survey for 3 d to confirm that there was no difference in nutrient intake between the groups at baseline, a dietary survey was needed throughout the intervention period to completely eliminate any influence of participants’ daily diet. However, a registered dietitian managed the dormitory diet throughout the intervention period; there was no change in the nutrient intake of participants. Since participants resided together in the dormitory, there was no change in diet, lifestyle and training during the intervention period. Third, we could not directly measure the changes in SCFA levels. Although Butyrate-producing bacteria promote the production of SCFA, the effect of perilla oil intake on the change in SCFA should be clarified in future studies.
In conclusion, this study showed that a daily intake of 9 g/d perilla oil enhanced the abundance of Butyrate-producing bacteria Lachnospiraceae and suppressed that of Proteobacteria and urinary indoxyl sulphate levels. This effect was not observed in 3 g/d perilla oil intake group. While, there were improvements in the gut function in both groups. The finer dose of perilla oil that stimulates the production of metabolites from gut bacteria and suppresses gut-disturbance indicators should be investigated in the future. Daily n-3 fatty acid intake through consumption of perilla oil would be beneficial for enhancing gut microbiota growth and function as well as a fuel source for trained female athletes.
Acknowledgements
The authors thank the members of our laboratory for their technical assistance, Dr. Wataru Aoi for advice on writing the manuscript and the study participants of the sports clubs of Nippon Sport Science University for their cooperation in the completion of this study.
This work was supported by Gifu Prefectural Research Institute for Agricultural Technology in Hilly and Mountainous Areas (grant number R019-079). The author, M. S., conducted this study with the scholarship donation and the test food provided by Gifu Prefectural Research Institute for Agricultural Technology in Hilly and Mountainous Areas. The funders had no role in the design of the study; in the collection, analyses or interpretation of data; in the writing of the manuscript or in the decision to publish the results.
Conceptualisation, M. S. and A. K.; methodology, K. M. and A. K.; validation, A. K.; formal analysis, A. K.; investigation, K. M. and A. K.; writing – original draft preparation, A. K.; writing – review and editing, M. S., K. M. and A. K.; supervision, M. S.; project administration, M. S.; funding acquisition, M. S. All authors have read and approved the final version of the manuscript.


 Open access