


INTRODUCTION
Grain-scale processes are important in controlling the deformation of ice in glaciers and ice sheets, through effects on the flow law and formation of lattice-preferred orientations (e.g., Duval and others, Reference Duval, Ashby and Anderman1983; Budd and Jacka, Reference Budd and Jacka1989; Van der Veen and Whillans, Reference Van der Veen and Whillans1994, Goldsby and others, Reference Goldsby and Kohlstedt2001). Accurately observing and characterizing the distribution of deformation at the grain scale remains challenging, however, especially at the low strain rates commonly observed in upper parts of ice sheets. Techniques applied to this challenge have included various in situ and experimental deformation studies of nearly 2-D samples (e.g. Azuma and Higashi, Reference Azuma and Higashi1985; Wilson and others, Reference Wilson, Peternell, Piazolo and Luzin2014), modeling (e.g. Zhang and others, Reference Zhang, Hobbs and Jessell1994a, Reference Zhang, Hobbs and Ord1994b; Montagnat and others, Reference Montagnat2014; Llorens and others, Reference Llorens2016a, Reference Llorens2016b) and interpreting the observed characteristics of ice core samples (e.g., Alley, Reference Alley1992, Kipfstuhl and others, Reference Kipfstuhl2006; Reference Kipfstuhl2009; Weikusat and others, Reference Weikusat, Kipfstuhl, Faria, Azuma and Miyamoto2009). Important questions remain, however, particularly about the flow law, and the distribution of stress on individual grains. Here, we develop a complementary technique to those already applied, assessing the suitability of measured bubble elongations in ice core samples as indicators of local strain.
Deformation of surrounding bulk ice deforms enclosed bubbles. The resulting bubble elongation is opposed by diffusive processes, which tend to restore bubbles toward spherical form (Alley and Fitzpatrick, Reference Alley and Fitzpatrick1999). The shape of a bubble in deforming ice thus integrates the recent history of the balance between deformation and diffusion. Magnitudes and directions of bubble elongation and differences between elongations of bubbles in adjacent grains, provide quantitative information on grain-scale processes.
We find variations in elongation of bubbles fully contained within individual grains suggesting that faster deformation occurs in larger grains and in grains with larger resolved shear stress on their basal planes, but with large grain-to-grain variability. Notable uncertainties remain, as discussed below, but we conclude that this technique can provide useful information, motivating further research.
BACKGROUND
Elongated bubbles are observed in ice cores, especially those sampling rapidly deforming ice (e.g., Hudleston, Reference Hudleston1977; Russell-Head and Budd, Reference Russell-Head and Budd1979; Alley and Bentley, Reference Alley and Bentley1988; Fitzpatrick, Reference Fitzpatrick1994; Alley and Fitzpatrick, Reference Alley and Fitzpatrick1999; Voigt and others, Reference Voigt, Alley, Anandakrishnan and Spencer2003), and this elongation rather clearly records the deformation of the surrounding ice (Gay, Reference Gay1968; Nakawo and Wakahama, Reference Nakawo and Wakahama1981; Alley and Fitzpatrick, Reference Alley and Fitzpatrick1999). As deviatoric stresses are not transmitted through bubbles and thus are enhanced around them, bubbles deform more rapidly than the bulk of the surrounding ice (Gay, Reference Gay1968; Alley and Fitzpatrick, Reference Alley and Fitzpatrick1999). For uniaxial extension (and by analogy, any irrotational stress state), bubbles experience a strain rate of ~5/3 faster than ice but in the same direction (Alley and Fitzpatrick, Reference Alley and Fitzpatrick1999). For simple shear, bubbles first elongate at 45° to the shear plane and then rotate toward the shear plane, again deforming ~5/3 faster than the surrounding ice.
Physical understanding and available data indicate that bubble shapes can be used to diagnose recent strain rates for ice even in the presence of diffusive processes. Mass transfer of molecules through lattice, surface and vapor diffusion driven by curvature and surface tension acts to restore elongated bubbles toward spherical, at a rate that increases monotonically with bubble elongation, but asymptotically approaches a maximum value (Alley and Fitzpatrick, Reference Alley and Fitzpatrick1999; Fegyveresi, Reference Fegyveresi2015). Thus, under constant stress, a bubble either will evolve to a steady form in which deformation balances diffusion, or, if the deformational elongation rate exceeds the maximum diffusional restoration rate, continue to elongate without limit. (In practice, small inhomogeneities in deformation cause exceptionally elongated bubbles to ‘pinch off’ into multiple smaller bubbles). Larger initial bubble sizes, lower temperatures and more rapid ice deformation favor greater bubble elongation (Alley and Fitzpatrick, Reference Alley and Fitzpatrick1999; Gow, Reference Gow1968a; Reference Gow1968b).
We have observed very large bubble elongations (measured as aspect ratios > 2 and in some cases approaching 10) (e.g., Alley and Fitzpatrick, Reference Alley and Fitzpatrick1999; their Fig. 1c), but bubbles in most ice core samples from typical deep-coring sites are only slightly nonspherical, consistent with a trend toward steady-state bubble shapes. In all such cases, if the cumulative diffusion and bubble deformation are sufficiently large to reset any bubble orientation inherited from firn processes or from complex histories (including bubbles switching between grains as grain boundaries migrate), the orientation of the bubble is expected to depend on the strain-rate field causing deformation (Gay, Reference Gay1968; Alley and Fitzpatrick, Reference Alley and Fitzpatrick1999). Elongation of a bubble fully contained within a grain thus reveals the rate and direction of deformation of that grain. Differences in deformation rate between grains then can be used to test hypotheses for grain–scale interactions in ice deformation (e.g., Van der Veen and Whillans, Reference Van der Veen and Whillans1994), as discussed below.
For ice deforming primarily by dislocation glide, strain rate under specified stress may be as much as two orders of magnitude or more faster on basal planes (perpendicular to the c-axis) than in other directions (Azuma and Higashi, Reference Azuma and Higashi1985; Weertman, Reference Weertman1983; Duval and others, Reference Duval, Ashby and Anderman1983). For a single crystal, this deformation rate depends on the resolved shear stress on the basal plane (Alley, Reference Alley1988; Cuffey and Paterson, Reference Cuffey and Paterson2010). In uniaxial compression, the resolved shear stress is proportional to the Schmid factor, S = cosϕsinϕ, with ϕ the angle between the c-axis and the vertical stress axis; S has a maximum at 45° and tends to zero for basal planes parallel to (0°) or perpendicular to (90°) the applied stress (Bouchez and Duval, Reference Bouchez and Duval1982; Jacka and Maccagnan, Reference Jacka and Maccagnan1984; Azuma and Higashi, Reference Azuma and Higashi1985; Alley, Reference Alley1988; Trickett and others, Reference Trickett, Baker and Pradhan2000).
In deforming polycrystals, differences in basal-plane orientations between adjacent grains or in localization of slip on active glide planes (e.g., Readings and Bartlett, Reference Readings and Bartlett1971) lead to incompatibilities favoring formation of overlaps or gaps, which must be removed by diffusion, rotation, or other processes (e.g., Azuma and Higashi, Reference Azuma and Higashi1985). Grain rotations are especially important in generating lattice preferred orientations (c-axis fabrics), with c-axes moving towards compressional and away from tensional axes, and with the rigid-body rotation of simple shear bringing c-axes toward the normal to the shear plane (e.g., Azuma and Higashi, Reference Azuma and Higashi1985; Alley, Reference Alley1988; Reference Alley1992; Llorens and others, Reference Llorens2016a; Reference Llorens2016b; Qi and others, Reference Qi, Goldsby and Prior2017). In turn, these grain–scale interactions cause the local stress state to differ from the mean for the entire sample, generating differences between far-field and local stress, with the corresponding variability in deformation rate that should be recorded in bubble elongation.
Various models have been proposed for approximating some aspects of this variability (e.g. Van der Veen and Whillans, Reference Van der Veen and Whillans1994; Montagnat and others, Reference Montagnat2014). These include the Taylor (or Voigt) model, in which each grain supports the same stress, yielding different deformation rates in adjacent grains with different orientations (Voigt, Reference Voigt1928) and the Reuss or static model, in which each grain experiences the same strain rate and thus supports different stress (Reuss, Reference Reuss1929). Actual behavior averaged across many grains is expected to fall between these in most cases (Montagnat and others, Reference Montagnat2014), but with the exact behavior not known.
Grain size also may affect deformation within individual grains, and be recorded in bubble elongation. Cuffey and others (Reference Cuffey, Thorsteinsson and Waddington2000) provided strong evidence that ice with smaller grains deforms more rapidly, but this may result from processes linked to grain-boundary sliding (Goldsby and Kohlstedt, Reference Goldsby and Kohlstedt2001). From dislocation mechanics and observations in ice and other materials (e.g., Baker and others, Reference Baker, Liu, Jia, Hu and Dudley1996), grain boundaries impede dislocation glide and thus deformation in most cases. Hirth (Reference Hirth1972) summarized the general situation: ‘The dislocation near an interface has a strain field extending into both media A and B. The strain energy in the harder medium is larger per unit displacement because the elastic constants are larger. Hence a dislocation in the softer medium is repelled from the interface to reduce the energy of the system, while a dislocation in the harder medium is attracted to the interface for the same reason.’ In glaciers, both ‘A’ and ‘B’ are ice, and a gliding dislocation is generally moving on a favored plane for easy glide with high likelihood that the adjacent grain is not optimally oriented for that dislocation, so the adjacent grain is ‘harder’, causing dislocations to be repelled from the interface. Observations show dislocation pileups adjacent to grain boundaries arising from this repulsion (Baker and others, Reference Baker, Liu, Jia, Hu and Dudley1996; Reference Baker2000). We note that Baker and others (Reference Baker, Liu, Jia, Hu and Dudley1996; Reference Baker2000) are among those who have shown that grain boundaries also serve as sources of dislocations at sufficiently high stresses, but that the clear evidence of pileups near grain boundaries suggests a grain-size dependence of deformation.
Here, using a newly developed technique to analyze a ‘hybrid’ thick-/thin-section, we present the results of a detailed study of bubbles and grains in a sample prepared from a depth of ~580 m in the West Antarctic Ice Sheet (WAIS) Divide deep core: WDC06A. The WDC06A coring site is located at 79°28.058′S, 112°05.189′W, ~24 km on the Ross Sea side of the ice flow divide with the Amundsen Sea drainage (Conway and Rasmussen, Reference Conway and Rasmussen2009; Fitzpatrick and others, Reference Fitzpatrick2014). Mean annual surface temperature is ~−30 °C, and annual accumulation is ~22 cm ice a−1. The ice thickness is ~3455 m, but coring was stopped at 3405 m to avoid the release of borehole fluid to the thawed bed (Fitzpatrick and others, Reference Fitzpatrick2014; Cuffey and others, Reference Cuffey2016). Deformation includes vertical compression and along-flow extension with slight lateral convergence over the flowline leading to the site.
We find that the bubbles display an elongation, preferentially oriented in the basal plane of the enclosing grain, with slightly greater elongation observed in larger bubbles, and for bubbles within larger grains and those with a larger Schmid factor.
METHODS AND PREPARATION
Thick-section preparation for bubble analysis
We modified our techniques (Fegyveresi and others, Reference Fegyveresi2011; Reference Fegyveresi2016) for preparing bubble ‘thick sections’ and grain ‘thin sections’ to allow coordinated interpretation of both. Here, we applied this technique to a single sample of ice from the WDC06A core. Typical ice thick-sections prepared for bubble analyses are ~1.5 mm in thickness and are digitally photographed while illuminated on a side-lit, mounted stage. Typical ice thin-sections prepared for grain analyses are ~0.3–0.5 mm in thickness (see also Fitzpatrick and others, Reference Fitzpatrick2014), and are observed in transmitted plane-polarized and cross-polarized light.
At the National Science Foundation Ice Core Facility (NSF-ICF; formerly the National Ice Core Laboratory), we used a band saw to cut a vertically-oriented bubble thick-section ~10 cm long × ~6 cm wide × ~5 mm thick, from a depth of ~580 m in the WDC06A core (measured depth range 579.02–579.12 m). We label this section here as ‘Vertical Hybrid Section 580’, or simply VHS-580). One face of this sample was smoothed with a sledge-type microtome and then affixed to a glass slide using a rapid-curing cyanoacrylate adhesive. Following the procedures described by Fegyveresi and others (Reference Fegyveresi2011; Reference Fegyveresi2016), the sample was first microtomed to ~1.5 mm overall thickness and imaged to produce a standard high-resolution bubble thick-section (see also Supplemental Fig. S1). Following imaging, the same section was then thinned to ~0.5 mm for thin-section analysis.
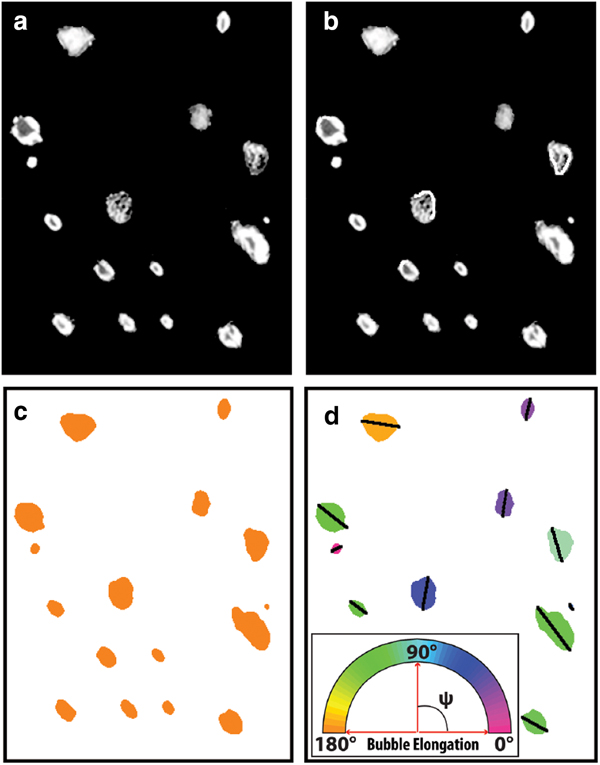
Post-processing of the bubble imagery (optimizing and error-checking) to obtain data on bubble elongation followed Fegyveresi and others (Reference Fegyveresi2011; Reference Fegyveresi2016). Principal measurements were made of all bubble sizes and shapes using the Fovea Pro™ imaging software plug-in for Photoshop™ (Russ, Reference Russ2010). Analyses especially focused on obtaining quantitatively accurate measures of the extent and direction of bubble elongation, by measuring the moment angle and maximum chord of each bubble as described below. We achieved this through a new four-step process to visually clean, binarize, and color-label each bubble in the section (Fig. 1). Bubbles are treated as 2-D features in the plane of the section.
Four-step process used to clean, colorize and label the VHS-580 bubble thick-section sample, shown here for a sub-section of the larger sample. In this example, the raw bubble image (a) was first manually cleaned (b), then binarized (c) and finally colored based on each bubble's moment angle (ψ) (d). Additional 3 pixel-wide chord lines are drawn over each bubble for ease of angle identification.
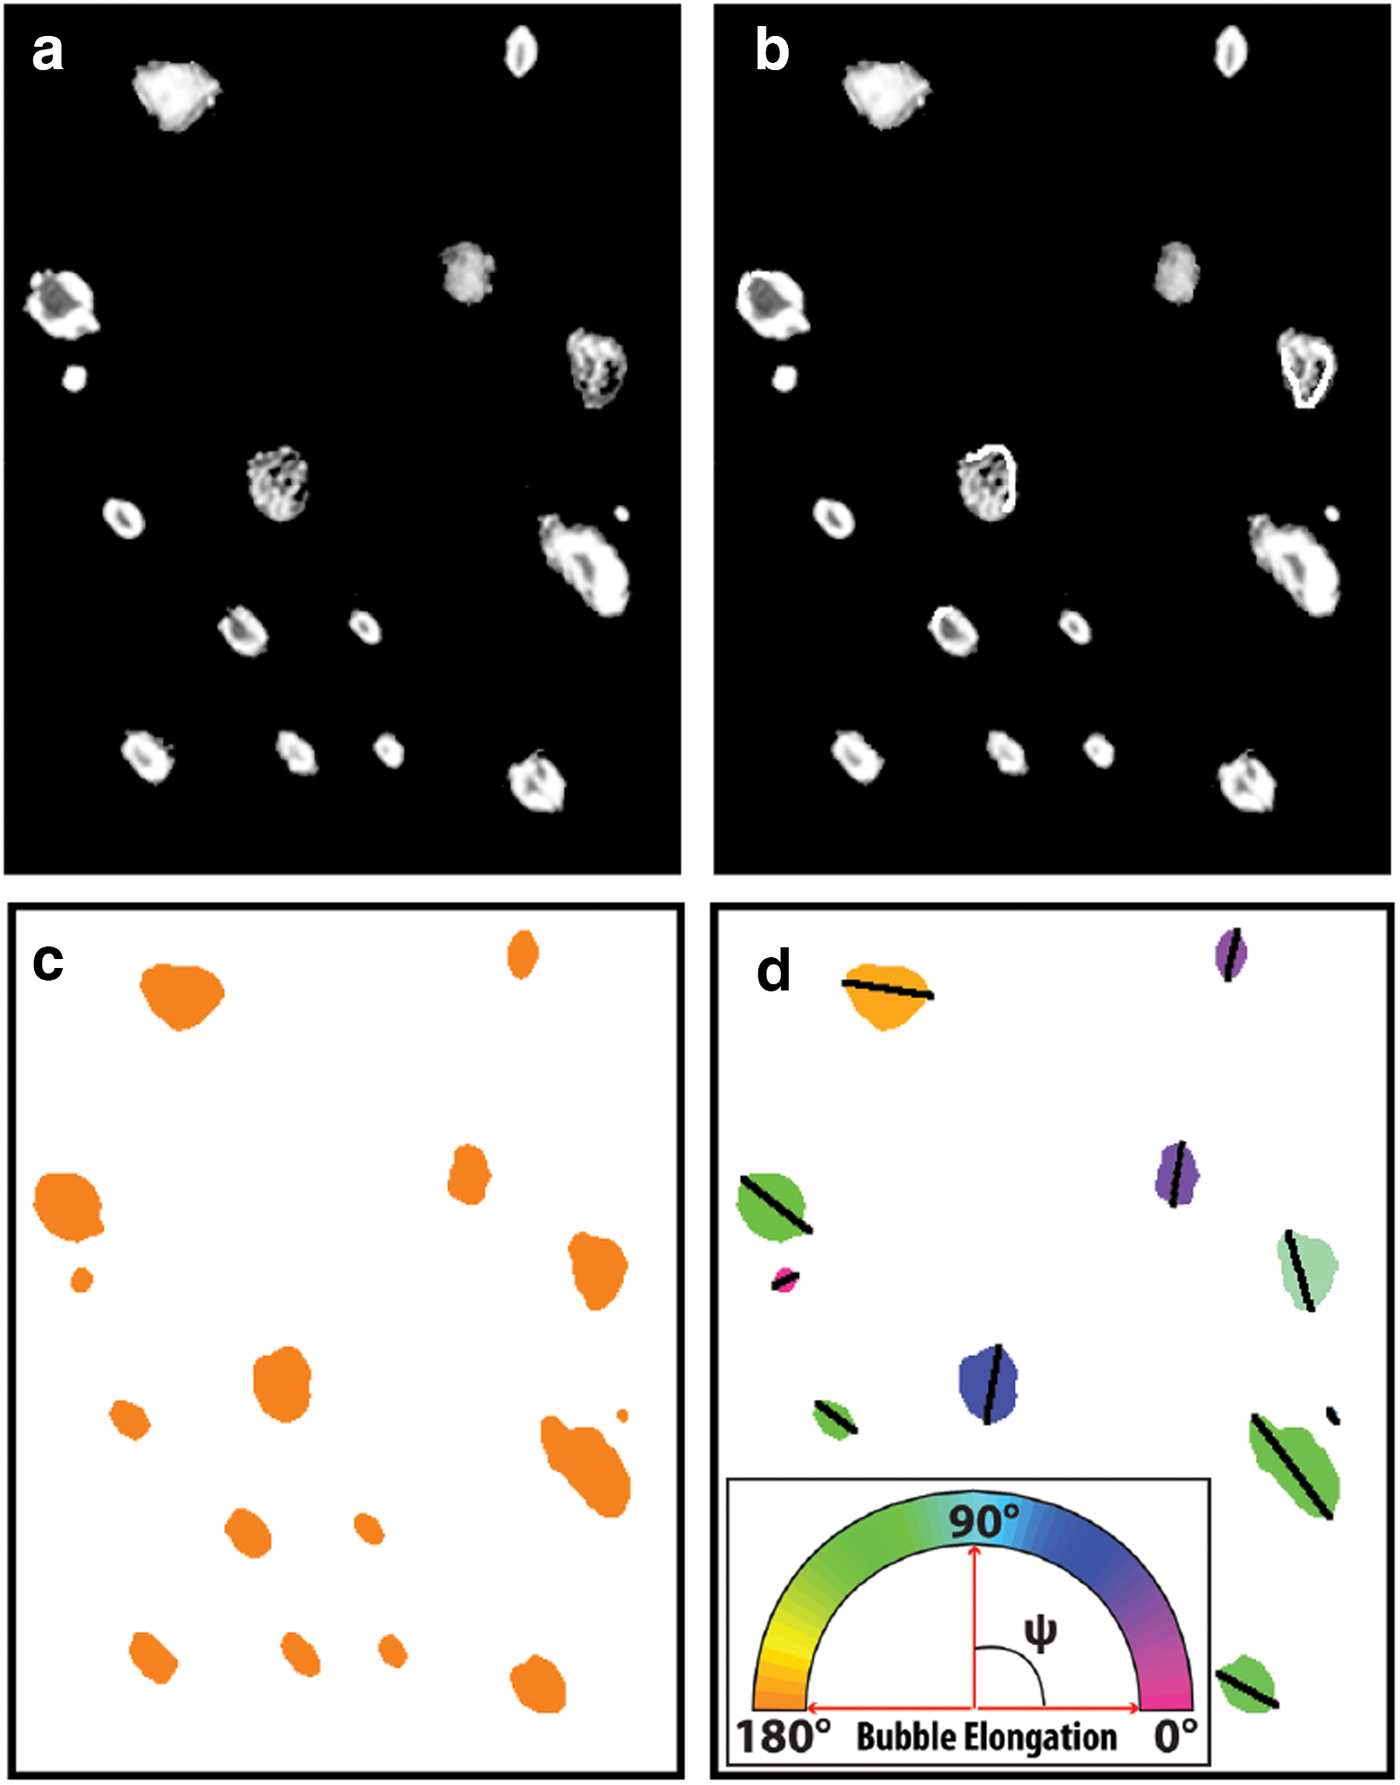
Moment-angle (ψ) as used here is the angle of the axis (measured counterclockwise from the horizontal) about which the pixels in the feature (bubble) have the smallest moment. For an ellipse, this is the angle of the long axis relative to horizontal, ranging from 0° to 180°. As implemented in the Fovea Pro™ software, this measurement has a built-in systematic error of ~±3% due to the effects of pixelization (Russ, Reference Russ2010). The maximum chord as defined here is the longest single-pixel, straight-line path across each bubble; for an ellipse, this is the length of the major axis. We note that only the numerical moment angle values were used in our calculations; maximum chords are drawn on each bubble simply to aid in visualization. For visualization in figures (e.g., Fig. 1), bubbles were color-coded based on their moment angle.
We tested the moment-angle measurements by generating artificial ‘test bubbles’, placing them at various known angles in a synthetic image and then analyzing (Fegyveresi, Reference Fegyveresi2015). We also duplicated the images of four different bubbles of varying elongations and irregularity from the VHS-580 image (see e.g., Supplemental Fig. S2-c), rotated each about its geometric center at 5° increments from 0° to 90° and analyzed the resulting images. The overall error of 0.75° ± 0.35° is too small to plot legibly in subsequent figures. Experiments with ellipses plotted at exactly known angles confirm the ability of our analyses to measure orientations with very small errors. Once the technique was successfully validated using test bubbles, the entire prepared bubble image from the VHS-580 sample was cleaned, binarized, colored and labeled based on the bubble orientations, using the four-step process as previously noted. In total, 5245 bubbles were identified in the sample.
We focus here on ‘intra-grain’ bubbles to study deformation within grains and exclude those ‘inter-grain’ bubbles touching grain boundaries. We identified and eliminated intergrain bubbles using the grain-boundary tracing (or mesh), which is normally created during thin-section analysis and is discussed in the following sections. Future analyses of the intergrain bubbles may be of considerable interest in answering questions related to grain-boundary sliding, but because of the likely complicating effects of processes including grain-boundary migration, we defer such analyses.
Thin-section preparation for grain analysis
Following the digital imaging and processing of the bubble thick-section, the sample was microtomed to a thickness of ~0.5 mm and digitally imaged under the cross-polarized transmitted light, following the procedures described in Fitzpatrick and others (Reference Fitzpatrick2014) (Supplemental Fig. S3). Because thin-section microtoming removes most of the thickness and many of the bubbles, we confirmed the high quality of the bubble images before proceeding.
Mean grain size is much larger than the thickness lost in this microtoming, and visual inspection shows, as expected, that the bubble section and thin section sample essentially the same ice. Similar to the bubble thick-section, imaging of overlapping sub-areas was followed by compositing smaller sub-sections. Additional analyses produced a grain-boundary mesh with over 700 individual grains (Fitzpatrick and others, Reference Fitzpatrick2014).
Grain-mesh overlay and bubble reduction
The final grain-boundary mesh was captured and saved as an independent layer within the Photoshop™ imaging software. This layered mesh was then combined with the high-resolution bubble image from the previously processed bubble thick-section. With these two parent layers merged, bubbles were separated into intergrain and intragrain sublayers based on their location. Bubbles were identified as intergrain if any part of the bubble was on or touching the identified grain-boundary mesh. Because the grain mesh was set to a width of 5 pixels, and binarized bubbles were also represented by pixels, some intragrain bubbles may have been categorized as touching grain boundaries. We obtained sufficient intragrain bubbles through this approach for robust analyses, so we did not attempt to identify any misclassified bubbles. Subsequent studies addressing differences in deformation within a grain might do so, however.
Using this classification, we obtained 3943 intragrain and 1302 intergrain bubbles. The 5245 bubbles produced two finalized hybrid grain-bubble mesh maps (see also Supplemental Figs. S4, S5), with 3943 total intragrain bubbles, and 1302 intergrain bubbles, respectively. As a final step for display purposes, using only the identified hybrid grain-bubble mesh map, all intragrain bubbles were color-coded based on their moment angle (ψ) using Fovea Pro™ (see Fig. 2). Maximum chords were also drawn for ease of identification, and to help us in visually double-checking the fidelity of the analyses.
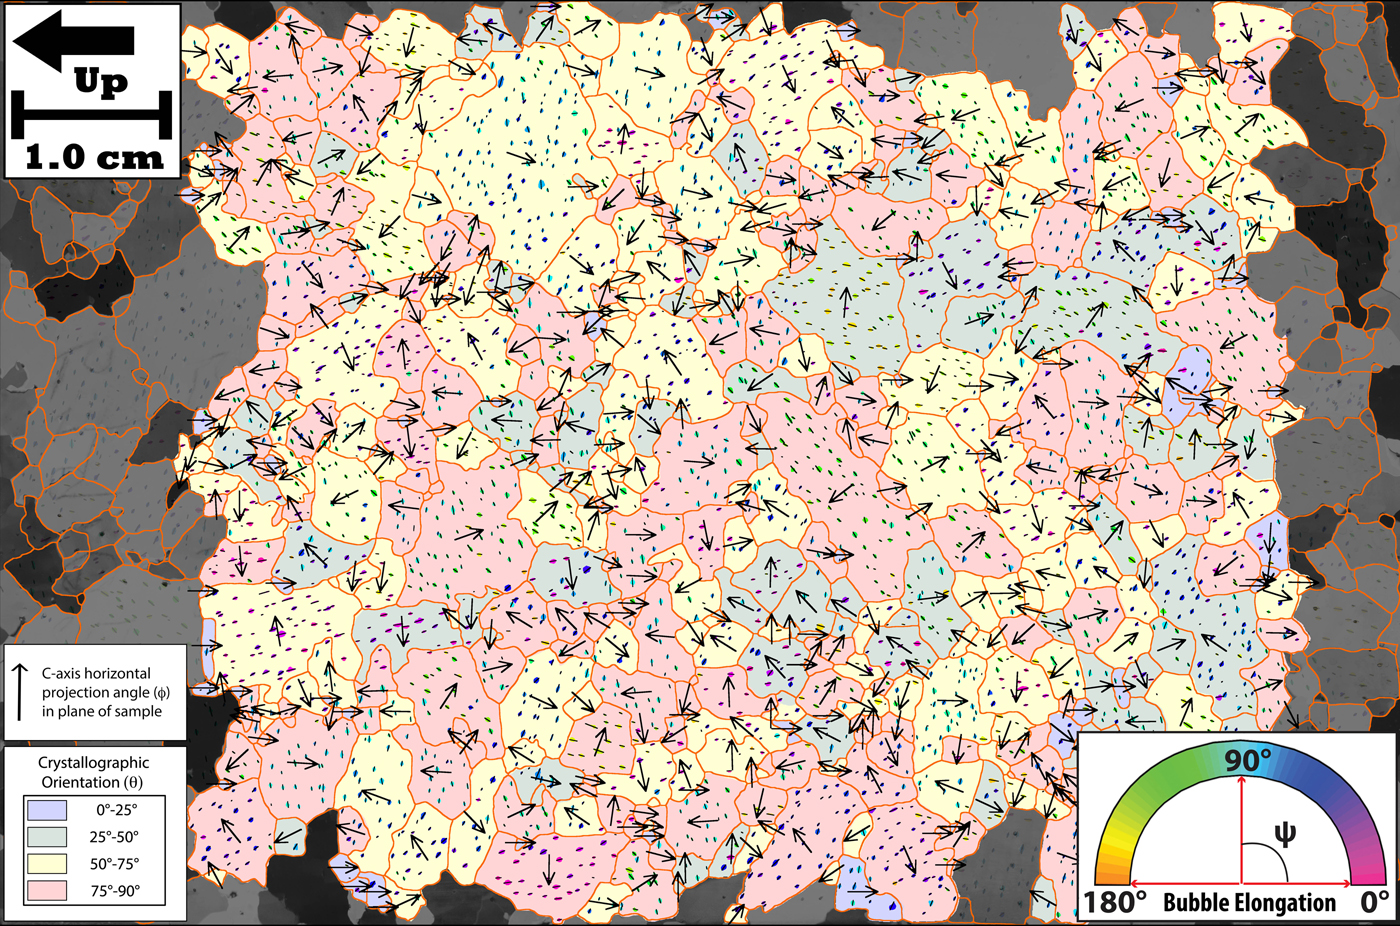
Hybrid grain-bubble mesh map and c-axis overlay showing 474 measured grains and all measured intra-grain bubbles from the VHS-580 sample, colored based on the orientation of the bubble moment angle (ψ). Black arrows indicate horizontal projection angle (ϕ) in plane of sample for each grain, and grain colors indicate theta (θ) angle of each grain. A value of θ = 90° indicates a c-axis lying in, or parallel to the plane of the sample. The ice flow direction at WAIS Divide for this sample is estimated to be approximately out of the plane of the section (±5°). Stratigraphic up-core is to the left as indicated.
C-axis overlay and conventions
Following digital imagery, c-axis orientations were measured using the automatic c-axis analyzer now housed at Penn State and formerly housed at the National Science Foundation Ice Core Facility (NSF-ICF) operated by the US Geological Survey in Denver, Colorado, with scientific management by the University of New Hampshire (Fitzpatrick and others, Reference Fitzpatrick2014; Wilen, Reference Wilen2000; Hansen and Wilen, Reference Hansen and Wilen2002). The c-axis analyzer returns theta (θ), the polar angle and phi (ϕ), the azimuthal angle, for specific grains using a suite of images taken with a variety of sample and polarizer orientations. These images have a lower resolution than, and a different spatial registration with, those used to determine the grain boundary mesh as discussed above. To ensure that the c-axis orientations were in correct correspondence with the grains identified and numbered in the grain-boundary mesh, we developed a linear coordinate transformation (scaling, rotation and translation) that mapped the center-of-mass coordinates for each grain in the mesh (as determined with Fovea Pro™) to the center of the same grain in the c-axis analyzer image coordinates. A 3 × 3-pixel region centered on these coordinates was then used to analyze the c-axis orientation for that grain using the corresponding numbering from the high-resolution imagery. The theta angle (θ) varies from 0° for a c-axis perpendicular to the plane of section, to 90° for a c-axis in the plane of section. The phi angle (ϕ) is measured counter-clockwise in the plane of section, with 0° indicating a c-axis pointing stratigraphically down-core, and 180° pointing stratigraphically up-core (see Supplemental Figs. S6, S7).
The automatic c-axis analyzer has a practical sample-size limit of ~6 cm × 6 cm (Wilen, Reference Wilen2000; Hansen and Wilen, Reference Hansen and Wilen2002; Fitzpatrick and others, Reference Fitzpatrick2014), slightly smaller than the original VHS-580 thin section; hence, a small number of grains along the edges of the image were not analyzed. Additionally, owing to a slightly coarser resolution and other limitations of the technique, the analyzer may occasionally fail to return a c-axis orientation from a grain identified in the high-resolution imagery. For example, this may occur for a grain boundary nearly parallel to the section surface, or for very small grains (<12 total pixels). Statistically, the loss of very small grains in the analysis is not significant due to their inherent lack of bubbles. Of the 700 grains originally mapped in the sample, 474 were successfully measured. A c-axis overlay was created using the grain-boundary mesh. In addition to color-coded bubble elongation data as noted above, Figure 2 also shows this final c-axis overlay with all of the measured grains colored, and others not analyzed in greyscale. Black arrows representing c-axis phi (ϕ) angles and color-coding for c-axis theta (θ) angles are also shown for each measured grain.
Individual grain-bubble processing
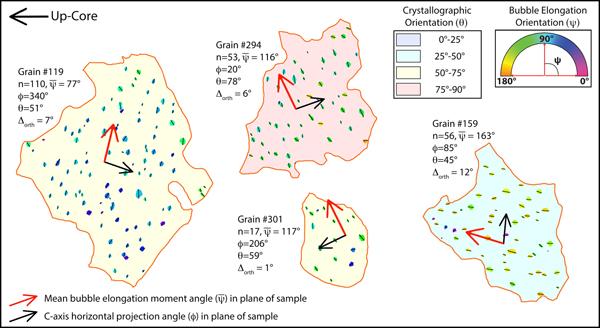
To compare bubble orientations to the c-axis orientation for a single grain, the boundary of that single grain was first selected using edge-detection tools in the Photoshop™ software. The grain and bubble layers for this grain were then selected together, copied, merged and duplicated into a new layer. All of the intragrain bubbles in this new layer were then counted (n = bubble count) and processed independently using the built-in Fovea Pro™ measurement utilities, producing a table containing all shape and moment angle data (see also Fegyveresi and others, Reference Fegyveresi2011, Reference Fegyveresi2016). This process was repeated for each of the 474 grains with full data (examples are shown in Fig. 3). Bubble elongation was quantified using the ‘Aspect Ratio’ metric as returned by the software, which is a direct comparison of long-Feret axis divided by short-Feret-axis (or simply length (L) divided by breadth (B)). Fovea Pro™ defines the Feret-axes as caliper dimensions that represent the longest straight-line distance between two points along the shortest- and longest-axes, respectively (Russ, Reference Russ2010). Effects of pixelation are small, and similar across bubbles because of the narrow size distribution. With these processed bubble characterization data, we were then able to compare the moment angle (ψ) for each of the 2377 bubbles to the crystallographic orientation of its parent grain by calculating the acute angle between the bubble long-axis and the c-axis horizontal rotation angle (ϕ).
Four individually measured grains from Figure 2. Black arrows indicate c-axis horizontal rotation angle (ϕ), and red arrows the calculated mean elongation-orientation moment angle  $\lpar\bar \psi\rpar $ for all bubbles within a grain. Total bubble counts for each bubble are given as (n). Visual inspection shows the approximate orthogonal relationship between (ϕ) and ( $\bar \psi $) within each grain, indicating that average bubble elongation is along the basal plane of the grains. Here, (Δorth) represents the angle difference between the plane normal to (ϕ) and the elongation-orientation moment angle ( $\bar \psi $); or precisely how many degrees from orthogonal (90°) the relationship is. Stratigraphic up-core is to the left as indicated.

RESULTS
We first report on several tests to determine whether the bubble elongations primarily record strain rates. We consider orientations of bubble elongation relative to basal planes, the magnitude of elongation relative to expected values based on physical understanding and dependence of elongation on bubble size. All of these yield results consistent with control of bubble elongation by deformation of the surrounding ice, so the bubbles can be used as strain indicators. We then show that elongation, and thus deformation, depends on c-axis orientation and grain size.
Tests that bubble elongations record ice deformation
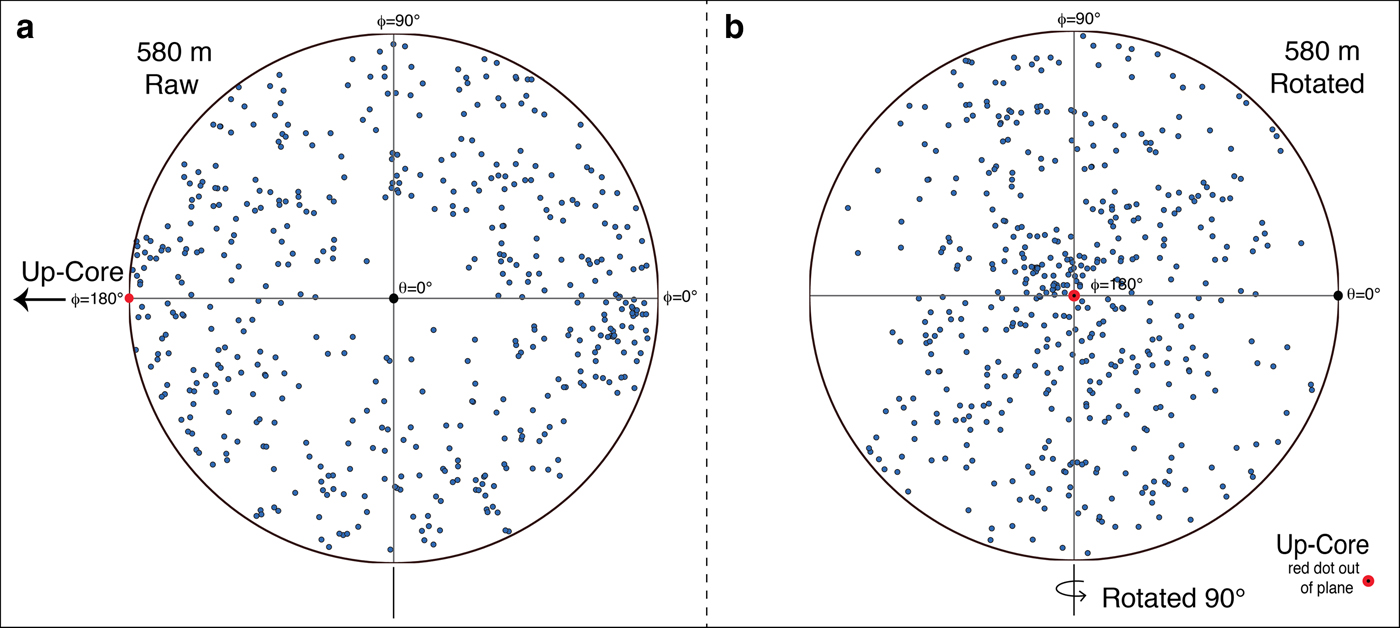
The sample analyzed here is from ~580 m depth, in the upper 20% of the ice sheet, where basal shear is minor and vertical compression dominant (e.g., Conway and others, Reference Conway2005; Cuffey and Paterson, Reference Cuffey and Paterson2010). Measured modern surface velocities of ~3 m a–1, decreasing up-glacier, indicate along-flow extension and weak transverse compression (i.e., flow-lines converge as flow accelerates along-flow and layers thin by ~7 × 10⁻⁵ a−1) (Conway and Rasmussen, Reference Conway and Rasmussen2009; Buizert and others, Reference Buizert2015). C-axis fabrics near the base of the firn (~75 m) are nearly random with slight vertical clustering; with increasing depth, the c-axes rotate towards a vertical plane transverse to flow, with the strongest clustering near the vertical axis (Fitzpatrick and others, Reference Fitzpatrick2014). The Schmidt plot of the c-axes of the 474 grains analyzed from the VHS-580 sample (Fig. 4) falls along the trend identified by Fitzpatrick and others (Reference Fitzpatrick2014), with relatively weak but clear vertical clustering. The orientation of the ice core was not independently measured when collected, but an understanding of the relation between c-axis fabrics and ice flow, together with the measured c-axis fabric of this section, indicate that the plane of section is approximately orthogonal to ice flow (Fitzpatrick and others, Reference Fitzpatrick2014).
Schmidt plot of c-axis data from 474 measured grains in VHS-580 sample. Plot (a) shows the raw data following the fabric convention from Supplemental Fig. S6 with stratigraphic up-core to the left indicated with black arrow and red dot. Plot (b) shows the data rotated to represent a view down-core. Here, stratigraphic up-core is coming out of the page (red dot). In this view, the effects of grain rotation are apparent in the weak clustering toward the center, as described in Fitzpatrick and others (Reference Fitzpatrick2014).
Bubble elongations (measured as aspect ratios, L/B) in the VHS-580 sample were generally small (<2.0), as expected (Alley and Fitzpatrick, Reference Alley and Fitzpatrick1999). A histogram of the aspect ratios of all 3943 intragrain bubbles shows a right-skewed distribution with a mode of 1.3 and a positive skew of 2.8 (Fig. 5). The long tail of the distribution may indicate the formation of stress-release cracks as described in Fegyveresi and others (Reference Fegyveresi2016). To account for this, and to ensure no subsequent measurement complications, grains containing bubbles with easily identifiable stress-release cracks were excluded from further analyses. In addition, to improve statistics and minimize the influence of outliers, only grains with five or more included bubbles (n ≥ 5) were used. Of the total 474 measured grains, 148 met the threshold criteria of n ≥ 5, and a lack of identifiable stress-release cracks. These 148 grains contain 2377 of the original 3943 intragrain bubbles. The Schmidt plot for the smaller 148-grain sample sub-set is shown in Supplemental Fig. S8, where (H S) denotes ‘hybrid sample sub-set’. The c-axis fabric for this sub-set (H S) matches the fabric for the full dataset closely (i.e., Fig. 4).
Histogram of measured elongation (aspect ratio, L/B) for all 3943 intra-grain bubbles (n); bin width = 0.1. Distribution is a classic positive, right-skewed result, heavily clustered towards lower values. The mode is ~1.3. The legend shows visual representations of aspect ratios assuming all bubbles appeared as ellipses in the bubble section.

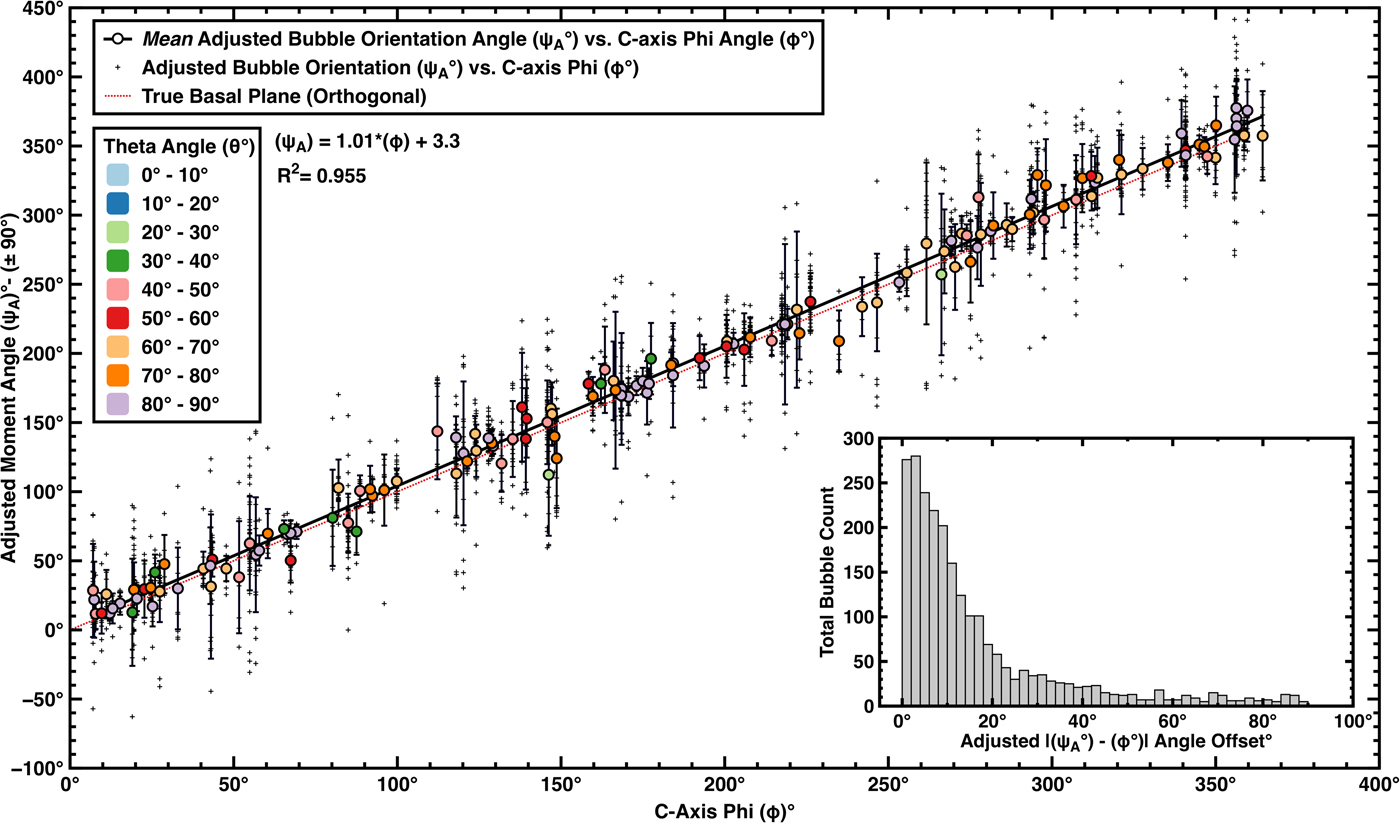
The comparison between the moment angles (ψ) for each of the 2377 bubbles and the crystallographic orientation of their parent grains is shown in Figure 6 and Supplemental Fig. S9. Additionally, the mean of the moment-angles of all bubbles in each grain was similarly compared with the grain orientation. The results show that bubbles in a grain are strongly aligned with or near the basal plane of that grain. A linear regression (R 2 = 0.96) shows a slight offset (~5°–7°), consistent with the expectation noted by Gay (Reference Gay1968), that bubbles initially elongate at an angle to the basal shear plane and then the bubble long axis rotates toward the shear plane without fully reaching it. An analysis of all 2377 individual bubbles revealed that ~75% (1771 bubbles) were elongated within 20° of the basal plane. The right-skewed (skewness of 1.9) distribution of angle differences between all bubble elongation-orientations and their respective parent grain basal planes (shown in Fig. 6 histogram inset) further yields a mode of ~3°, a median of ~9.7°, a 1σ Std dev. of ~18.7°, and an average of ~16.6°.
Plot of adjusted bubble-orientation angle (ψ A) vs c-axis horizontal rotation angle (ϕ) for 148 measured sample sub-set (H S) of VHS-580. Small data points indicate all 2377 individual bubbles measured; larger, colored data points indicate average values per measured grain. Fill colors reflect associated theta (θ) values for each parent grain. The error bars are measured Std dev. (1σ) for all bubbles within each grain. Linear regression (black solid line) yields an R 2 of ~0.955, and falls slightly above the line indicating a true basal plane correlation (red dotted line). Histogram inset (bin width = 2°) shows the right-skewed distribution of the (ψ A- ϕ) offset angles for each bubble (shown as absolute values). Effects of pixelization and cut-bubbles were ignored. (see Supplemental Fig. S9 for the raw-data equivalent plot).
As noted previously, the bubble ‘elongations’ measured here are the elongations of normal projections of bubbles onto the plane of section, and represent the true elongation only for bubbles elongated in the plane of section. Our observational technique did not allow us to rotate bubbles to measure their full elongation. To partially overcome this difficulty, we note that grain deformation causing bubble elongation is expected to increase with the Schmid factor (S), and that under the near-vertical compression of the WAIS Divide site, this would cause bubbles in grains with c-axes close to the plane of section to exhibit their true elongation. We selected a subset of 86 such grains (H S_PLANAR) with c-axes within 25° of the plane of section (θ ≥ ~65°); this value was chosen to give a large enough sample while not deviating too much from the plane of section. As expected, the bubble elongations in this subset of grains trend slightly larger (median = 1.45, mean = 1.55) than for the full set of bubbles (see also Supplemental Fig. S10).
DISCUSSION
We next place these results in context and explore possible implications. Following a short summary of key background assumptions, we show that if these background assumptions apply, the measured elongations are consistent with the particular assumptions underlying the use of bubble elongation as a strain indicator, with deformation balanced by diffusive restoration and with larger bubbles elongating more rapidly. Following the generally positive results from these methodological tests, we use the measured bubble elongations to conduct tentative hypothesis-testing for grain-scale deformation by examining the dependence of elongation on c-axis orientation and size of the enclosing grain.
Magnitude of bubble elongation
In analyzing bubble elongation, we assume that the current configuration integrates the cumulative deformation for the entire history of the ice, the same assumption used in successful model simulations of the observed c-axis fabrics in ice cores (e.g., Alley, Reference Alley1988; Duval and Montagnat, Reference Duval and Montagnat2002).
We note that nucleation of new grains together with formation of subgrain boundaries has been observed in samples from other cores, peaking in deep firn (e.g., Kipfstuhl and others, Reference Kipfstuhl2006; Reference Kipfstuhl2009; Weikusat and others, Reference Weikusat, Kipfstuhl, Faria, Azuma and Miyamoto2009; Faria and others, Reference Faria, Weikusat and Azuma2014) and likely related to the very high firn-densification stresses (e.g., Alley, Reference Alley1987). These stresses typically peak near 5–6 bars before pressurization of bubbles. However, as stated by Faria and others (Reference Faria, Weikusat and Azuma2014, section 5.2, p. 38) for the relevant depths: ‘Nucleation is not predominant in polar ice…’. Strengthening of subgrain boundaries until they are classified as grain boundaries does divide grains with little effect on c-axis fabrics (e.g., Alley and others, Reference Alley, Gow and Meese1995). In our case with the WDC06A core, while this subgrain-strengthening behavior is clearly evident in ice from greater depths than our sample, it is not prominent near or above our sample (Fitzpatrick and others, Reference Fitzpatrick2014). Instead, our sample occurs within a trend of increasing grain size and smoothly tightening c-axis fabric with increasing age and depth.
The following simple calculation shows that the magnitude of our measured elongations is consistent with this assumption of long-lived grains, and with the expectation that bubbles are elongated by cumulative deformation but returned toward spherical by diffusion because somewhat more strain has occurred in most grains than is recorded in the bubble shapes. The sample from ~580 m has an approximate age of 2360 years bf 1950 (Sigl and others, Reference Sigl2016); removing time in firn (175 years), and adding time from 1950 to core recovery (67 years), gives a total age of ~2252 years. The vertical strain rate at WAIS Divide is ~7 × 10⁻⁵ a−1 (modern accumulation rate of ~0.22 mice a−1, divided by total ice thickness of ~3450 m) (WAIS Divide Project Members, 2013; Fudge and others, Reference Fudge2016), so thinning of ~16% has occurred in the ice. Because bubbles are estimated to elongate ~5/3 as fast as the surrounding ice, 16% layer thinning assuming pure shear would convert an initially spherical bubble of unit diameter to a length of 1.27, and width of 1/1.27 and thus an elongation of 1.27/(1/1.27) = 1.6. The modal elongation is ~1.3 in the maximum-strain subset of grains, suggesting that diffusion is active in restoring bubbles toward spherical (see Alley and Fitzpatrick, Reference Alley and Fitzpatrick1999, Gay, Reference Gay1968).
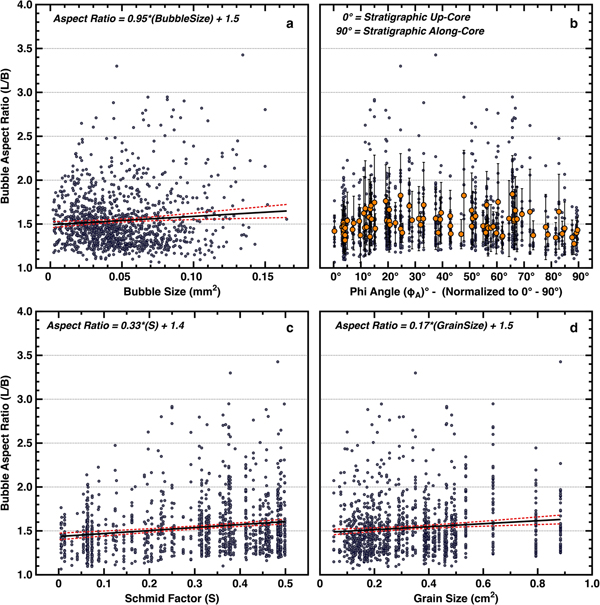
As an additional check, we note that Alley and Fitzpatrick (Reference Alley and Fitzpatrick1999) found from physical modeling and confirmed by observations that larger bubbles should elongate more rapidly. Thus, if bubbles are behaving as expected in recording strain, larger bubbles measured within our VHS-580 sample should reveal greater elongation. We plot bubble elongation (aspect ratio) against bubble size for all bubbles within the (H S_PLANAR) subset, and find that larger bubbles do exhibit slightly greater elongation (Fig. 7a). A t test on the significance of the slope is positive (with P < 0.05); however, there is much variance that is not described in this significant relation, which we discuss further below (see also Supplemental for additional statistics).
Data plotted from 86 grains identified as being within 25° of the visual plane (H S_PLANAR) of the sample (θ ≥ 65°). Plot (a) shows bubble elongation (aspect ratio) distributions plotted against their respective size (pixel area – mm2), with a positive increasing linear trend (slope of 0.95 ± 0.32). Plot (b) shows bubble elongation distributions plotted against their respective adjusted phi (ϕ A) angles (normalized to adjusted values between 0° and 90°, with 0° equating to stratigraphic up-core as indicated). Minor data points (blue) indicate individually measured bubbles, while major data points (orange) indicate mean values. The error bars are measured Std dev. (1σ) for all bubbles within each grain. Plot (c) shows bubble elongation distributions plotted against their respective Schmid factor (S), with a positive increasing linear trend (slope of 0.33 ± 0.06). Plot (d) shows bubble elongation distributions plotted against their respective parent grain size (pixel area – cm2) with a positive increasing linear trend (slope of 0.17 ± 0.04). Dashed red lines indicate 95% confidence bands. See Supplemental for additional statistics.

Grain-scale deformation from bubble elongation
To test the hypothesis that grain-scale deformation increases with the resolved shear stress on the basal plane, we plot (Fig. 7b) the bubble elongations for the subset of grains expected to show maximum elongation (H S_PLANAR), against their c-axis orientation phi (ϕ) angles (ϕ = 0° up-core to 90° along-core). If deformation of the grains, and therefore the bubbles, is proportional to the Schmid factor (S) as hypothesized in some models, the resulting plot should yield minimum elongation at 0° and 90°, with a maximum near 45°. The data show fewer highly elongated bubbles near 0° and 90° but with little trend for intermediate angles. In Figure 7c, these data are replotted against Schmid factor (S) calculated assuming vertical compression and show that elongation does increase with S, although with considerable variability. A minimum is apparent at 0 (equating to phi angles near 0° and 90°), and a more distinct maximum/distribution is also now present at Schmid factors near 0.50 (equating to phi angles near 45°). The trend is statistically significant; the slope of the regression line of bubble elongation against S is 0.33 ± 0.06, positive with >95% confidence, based on a t test (P < 0.05). The formal t test likely overestimates the confidence in the result, in part from the skewed nature of the distribution of elongations (that in turn arises in part from the definition of elongation as being ≥1), but we have looked at the data in various ways and with various statistical treatments, and find it likely that there is some dependence of elongation on Schmid factor (S). We note that the regression line, or any other relation we have tested, explains only a small fraction of the variance and thus does not provide a full model of the grain-scale deformation.
Next, to test the hypothesis that larger grains exhibit greater deformation, the bubble elongations for all grains and for the (H S_PLANAR) subset are plotted against grain size in Figure 7d. As before, the data exhibit much variability, but with a positive trend indicating faster deformation for larger grains; the slope of the regression line of bubble elongation against grain size is 0.17 ± 0.04, positive with >95% confidence, based on a t test (P < 0.05). This result again leaves much variance unexplained. The unexplained variance in the linear relations here may in part arise from a tendency toward Reuss (Reference Reuss1929) behavior, with softer grains supporting less stress and deforming similarly to their neighbors, but other explanations may apply.
Challenges exist both in observing and interpreting the elongations, as discussed more below, but the preliminary work here shows that there are patterns in bubble elongation reflecting grain deformation. In particular, the increase in elongation with Schmid factor (S) suggests that the strain rate in a grain increases with the resolved shear stress on its basal plane, but a large amount of variance that is not explained by this model (i.e. low R 2 values) suggests that a complete model of ice deformation will involve additional considerations.
Limitations
We are acutely aware of limitations in this study. We have examined only one section, without truly 3-D data on bubble elongations. Application of other techniques, or of this technique to mutually perpendicular sections from the same depth, as well as to corresponding sections from additional ice core sites (e.g. the new SPICEcore from the South Pole), would improve characterization and help demonstrate that we are not observing some unknown peculiarity of our site, or some unknown artifact from the particular recovery and processing history of this core (Casey and others, Reference Casey2014; Fegyveresi, Reference Fegyveresi2015). We chose our sample depth to be great enough for notable deformation to have occurred but not so deep as to fall within the upper part of the ‘brittle ice’ zone (Souney and others, Reference Souney2014), and to be above the depth of major grain subdivision or dominant nucleation of new grains (see above). We inspected the bubbles carefully in an attempt to avoid any possible effects of stress-relief cracks affecting bubble shape (see e.g. Kipfstuhl and others, Reference Kipfstuhl, Pauer, Kuhs and Shoji2001; Pauer and others, Reference Pauer, Kipfstuhl, Kuhs and Shoji2000), but we cannot guarantee that every crack was identified and eliminated. Preparation and imaging of samples in the field immediately following the recovery of ice cores would simplify interpretations, because stress-release cracks are initially very thin and readily removable from bubble shapes, but subsequent diffusion might widen the cracks and affect bubble shapes.
As discussed by Alley and Fitzpatrick (Reference Alley and Fitzpatrick1999), quantitative interpretation is complicated by the fact that available solutions relating bubble elongation to the surrounding flow are for linear-viscous deformation, but ice is expected to creep proportional to a power of the stress greater than one. This is complicated further because the few available data are broadly consistent with linear behavior (Nakawo and Wakahama, Reference Nakawo and Wakahama1981). A completely proper treatment of bubble deformation is likely to prove difficult, so we also assume here the simple approach for the elongation of linear-viscous inclusions (bubbles) in a linear-viscous matrix (see also Gay, Reference Gay1968).
Many bubbles will switch grains owing to grain growth (e.g., Alley and others, Reference Alley, Perepezko and Bentley1986a; Reference Alley, Perepezko and Bentley1986b), changing the direction and rate of elongation, even as those grains are rotating, thereby affecting their Schmid factor and their tendency to deform. Numerical modeling of bubble evolution coupled to grain growth and deformation will be required to quantify the effects of these processes, matched to a depth-progression of observations beginning near the base of the firn (e.g. Steinbach and others, Reference Steinbach2016). Note, however, that the most-recent deformation is most important in controlling bubble elongation, and notable elongation would be generated over times shorter than the age of the ice (Alley and Fitzpatrick, Reference Alley and Fitzpatrick1999).
CONCLUSIONS
In light of the considerations above, we do not draw strong conclusions here. We hope to conduct future research to reduce uncertainties, but we find the preliminary results to be sufficiently interesting that we are publishing them in hope of stimulating other researchers to extend this work. Our tests suggest that the magnitude and direction of bubble elongation are controlled by the balance between deformation in the ice and diffusion restoring bubbles toward spherical, such that bubbles are elongated close to (but not exactly on) basal planes, the magnitude of elongation is consistent with physical expectations, and larger bubbles show greater elongation (Alley and Fitzpatrick, Reference Alley and Fitzpatrick1999). In turn, this suggests that the bubbles are serving as strain indicators. If so, then bubble shapes may offer the best opportunity to characterize grain-scale deformation under in situ ice-sheet conditions.
Interpreting the bubbles as strain indicators, we find that there are significant patterns in bubble elongation reflecting grain deformation such that deformation increases with the resolved shear stress on the basal planes arising from the far-field stress state. These relations leave much variance unexplained, however, with elongated bubbles observed in almost all grains. One possible, although nonunique, interpretation is that the grain–scale interactions create a strongly heterogeneous stress state, and when combined with the extreme anisotropy of ice, all grains ultimately deform along their basal planes, with significantly slower deformation only for those grains in which the resolved shear stress on the basal plane is very small.
We also find that larger grains contain more-elongated bubbles. Because such grains have generally become larger by outward grain-boundary migration, incorporating bubbles with the associated switch in deformation pattern, one might expect larger grains to contain less-elongated bubbles. The inference is that larger grains deform more rapidly. In turn, this suggests that the inferred lower viscosity of finer-grained ice arises from grain-boundary processes rather than intragranular slip (Cuffey and others, Reference Cuffey, Thorsteinsson and Waddington2000; Goldsby and Kohlstedt, Reference Goldsby and Kohlstedt2001), a hypothesis that we believe merits additional testing including targeted modeling of coupled grain growth and deformation.
More broadly, we feel that this study, while limited in scope, has larger potential implications for the future development of more complete models of ice deformation.
ACKNOWLEDGEMENTS
We acknowledge the following funding sources for support of this work: US National Science Foundation Division of Polar Programs grants 0539578, 1043528 and 1542778. We also acknowledge Eric D. Cravens, and the staff of the National Science Foundation Ice Core Facility (NSF-ICF) in Denver, Colorado, as well as the WAIS Divide Science Coordination Office at the University of New Hampshire and the Ice Drilling Design and Operations group at the University of Wisconsin. We thank numerous colleagues involved with the WAIS Divide project, especially Kendrick Taylor, Mark Twickler and Joseph Souney. We thank Bess Koffman, Gifford Wong, Richard Nunn and Anais Orsi for assistance with WAIS Divide sample recovery. We also thank Madeline Nyblade for assistance with the processing and interpretation of the bubble characterization data. Any use of trade, firm, or product names is for descriptive purposes only and does not imply endorsement. Lastly, we thank our reviewers and editor, whose thoughtful suggestions and questions served to significantly clarify and improve this manuscript.
DATA POLICY
All data presented here are available through the request of the corresponding author, or via download from USAP-DC (https://doi.org/10.15784/601087; Fegyveresi, Reference Fegyveresi2018).
AUTHOR CONTRIBUTIONS
JJF assisted with thin-section preparation, imagery and analyses. DEV operated the c-axis analyzer and collected the related c-axis fabric data. LAW assisted with the overlay and alignment of c-axis and digital imagery meshes. JMF prepared and imaged the bubble ‘thick-section’ and completed the majority of the image processing, analyses and statistics. JMF prepared the manuscript and figures with primary contributions and assistance from RBA.
Supplementary material
The supplementary material for this article can be found at https://doi.org/10.1017/aog.2018.23.


 Open access