


1. Introduction
The peculiar nature of cavitation inception in structured turbulence has attracted interest since the middle of the last century (Kermeen & Parkin Reference Kermeen and Parkin1957). In numerous previous studies, various bluff geometries, such as spheres, cylinders, wedges, backward-facing steps (BFS), and sharp-edged or blunt-trailing-edge plates, etc., have been utilised to investigate the flow structure within turbulent wakes/shear layers (see, for example, Bearman Reference Bearman1984; Katz & O’Hern Reference Katz and O’Hern1986; Kostas, Soria & Chong Reference Kostas, Soria and Chong2002). Typically, the flow field in the wake of a bluff body consists of primary spanwise vortices and weaker braids of secondary streamwise vorticity distributed in the gaps between the primary rolls (Belahadji, Franc & Michel Reference Belahadji, Franc and Michel1995; Williamson Reference Williamson1996a ; Fujino, Motoori & Goto Reference Fujino, Motoori and Goto2023). Complex interactions between these vortical systems lead to instantaneous stretching of the secondary vortices. This results in momentary pressure reductions within their cores to values well below those observed in the cores of the nominally stronger primary vortices, thus rendering secondary vortices the preferential sites of cavitation inception (Katz & O’Hern Reference Katz and O’Hern1986; Belahadji et al. Reference Belahadji, Franc and Michel1995; Knister, Ganesh & Ceccio Reference Knister, Ganesh and Ceccio2024). More recent observations of cavitation inception in secondary structures of the tip-leakage flows (TLF) associated with rotating machinery (Oweis et al. Reference Oweis, Fry, Chesnakas, Jessup and Ceccio2006; Chang et al. Reference Chang, Choi, Yakushiji and Ceccio2012) have sparked a renewed interest in further study into the underlying physics of inception in structured turbulence for canonical geometries.
While the processes related to inception in secondary structures were understood on a phenomenological level for some time, only recently further insights into the underlying physics have been attained. Agarwal et al. (Reference Agarwal, Ram, Lu and Katz2023) used high-speed imaging and pressure reconstruction from velocity field data to correlate the spatial statistics of the incipient structures with the pressure fluctuations in the shear layers forming in the wake of a BFS. Their findings confirmed the topology of the incipient structures to correspond to that of the intermittent low-pressure regions associated with stretching of quasi-streamwise vortical structures, with the likelihood of extended pressure minima events increasing with an increase in Reynolds number. Brandao & Mahesh (Reference Brandao and Mahesh2022) replicated the experimental conditions from Agarwal et al. (Reference Agarwal, Ram, Lu and Katz2023) in their large-eddy simulations, achieving good agreement.
In addition to understanding the influence of the underlying turbulent flow field on cavitation inception, the effect of nuclei must be studied with equal attention. Pure water has been shown to withstand significant tension (Trevena Reference Trevena1987) and for cavitation inception to occur, sites of weakness or nuclei are required (Iyengar & Richardson Reference Iyengar and Richardson1958). Combined with a pressure field of stochastic character, the distribution of nuclei, both in size and space, makes cavitation inception in structured turbulence an unlikely spatiotemporal confluence of multiple variables (Allan et al. Reference Allan, Barbaca, Venning, Russell, Pearce and Brandner2023).
Nucleation has long been known to have a significant influence on inception but has only been able to be indirectly controlled by the level of dissolved gas (Arndt & Keller Reference Arndt and Keller1992). With the development of modern hydrodynamics facilities with systems for the strict control of dissolved gas and nuclei population (Brandner et al. Reference Brandner, Lecoffre and Walker2006, Reference Brandner, Lecoffre and Walker2007), it has become possible to investigate the effects of nucleation rigorously. With this capability, for a larger scaled BFS geometry of that investigated by Agarwal et al. (Reference Agarwal, Ram, Lu and Katz2023) discussed earlier, Allan et al. (Reference Allan, Barbaca, Venning, Russell, Pearce and Brandner2023) investigated the effects of nucleation on inception by seeding the flow with a population of nominally $\varnothing 60\ \unicode {x03BC}$
m monodisperse nuclei. They found the capture and activation of nuclei to be an extremely unlikely event, with approximately only 0.1 % of nuclei being activated at the incipient conditions. Furthermore, they characterised both spatial nuclei distribution and location of incipient events, which were combined to reveal the spatial distribution of cavitation susceptibility in the wake of a BFS. For this experiment, free-stream nuclei and particularly incipient products were captured in the large recirculating zone downstream of the BFS. This prevented practical acquisition of spatiotemporal inception statistics.
$\varnothing 60\ \unicode {x03BC}$
m monodisperse nuclei. They found the capture and activation of nuclei to be an extremely unlikely event, with approximately only 0.1 % of nuclei being activated at the incipient conditions. Furthermore, they characterised both spatial nuclei distribution and location of incipient events, which were combined to reveal the spatial distribution of cavitation susceptibility in the wake of a BFS. For this experiment, free-stream nuclei and particularly incipient products were captured in the large recirculating zone downstream of the BFS. This prevented practical acquisition of spatiotemporal inception statistics.
To address this, Allan et al. (Reference Allan, Barbaca, Venning, Russell, Pearce and Brandner2024) undertook a preliminary investigation into the effects of nucleation on cavitation inception within the secondary vortices of a von Kármán wake from a blunt-trailing-edged flat plate. Using monodisperse seeding, they characterised the spatial distribution of the incipient structures in the streamwise direction, together with their angular orientation in the vertical plane. The scope of the current study is to provide a comprehensive extension of this preliminary work, with the experiment now performed for an optimised geometry. Spatial distribution and angular orientations of the incipient structures will be provided in three dimensions, while also exploring the effects of the nuclei seeding rate, and cavitation and Reynolds numbers on the inception rates.
2. Experimental set-up
The experiments were performed in the Australian Maritime College (AMC) variable pressure water tunnel. The tunnel test section is 0.6 $\,\times \,$
0.6 m square at the entrance, with the floor sloping 20 mm over its 2.6 m length in order to maintain a nominally constant speed and zero streamwise pressure gradient. The operating pressure and velocity are controlled independently, with ranges of 4–400 kPa absolute and 2 m to 12 m s
$\,\times \,$
0.6 m square at the entrance, with the floor sloping 20 mm over its 2.6 m length in order to maintain a nominally constant speed and zero streamwise pressure gradient. The operating pressure and velocity are controlled independently, with ranges of 4–400 kPa absolute and 2 m to 12 m s $^{\mathrm {-1}}$
, respectively. The tunnel volume is 365 m
$^{\mathrm {-1}}$
, respectively. The tunnel volume is 365 m $^{\text {3}}$
and is filled with demineralised water. Optical access is attained through acrylic windows on each side of the test section. Further details on the facility can be found in Brandner, Pearce & de Graaf (Reference Brandner, Pearce and de Graaf2015); Khoo et al. (Reference Khoo, Venning, Pearce, Takahashi, Mori and Brandner2020) & Smith et al. (Reference Smith, Brandner, Pearce, Venning, Moreau and Clarke2021).
$^{\text {3}}$
and is filled with demineralised water. Optical access is attained through acrylic windows on each side of the test section. Further details on the facility can be found in Brandner, Pearce & de Graaf (Reference Brandner, Pearce and de Graaf2015); Khoo et al. (Reference Khoo, Venning, Pearce, Takahashi, Mori and Brandner2020) & Smith et al. (Reference Smith, Brandner, Pearce, Venning, Moreau and Clarke2021).
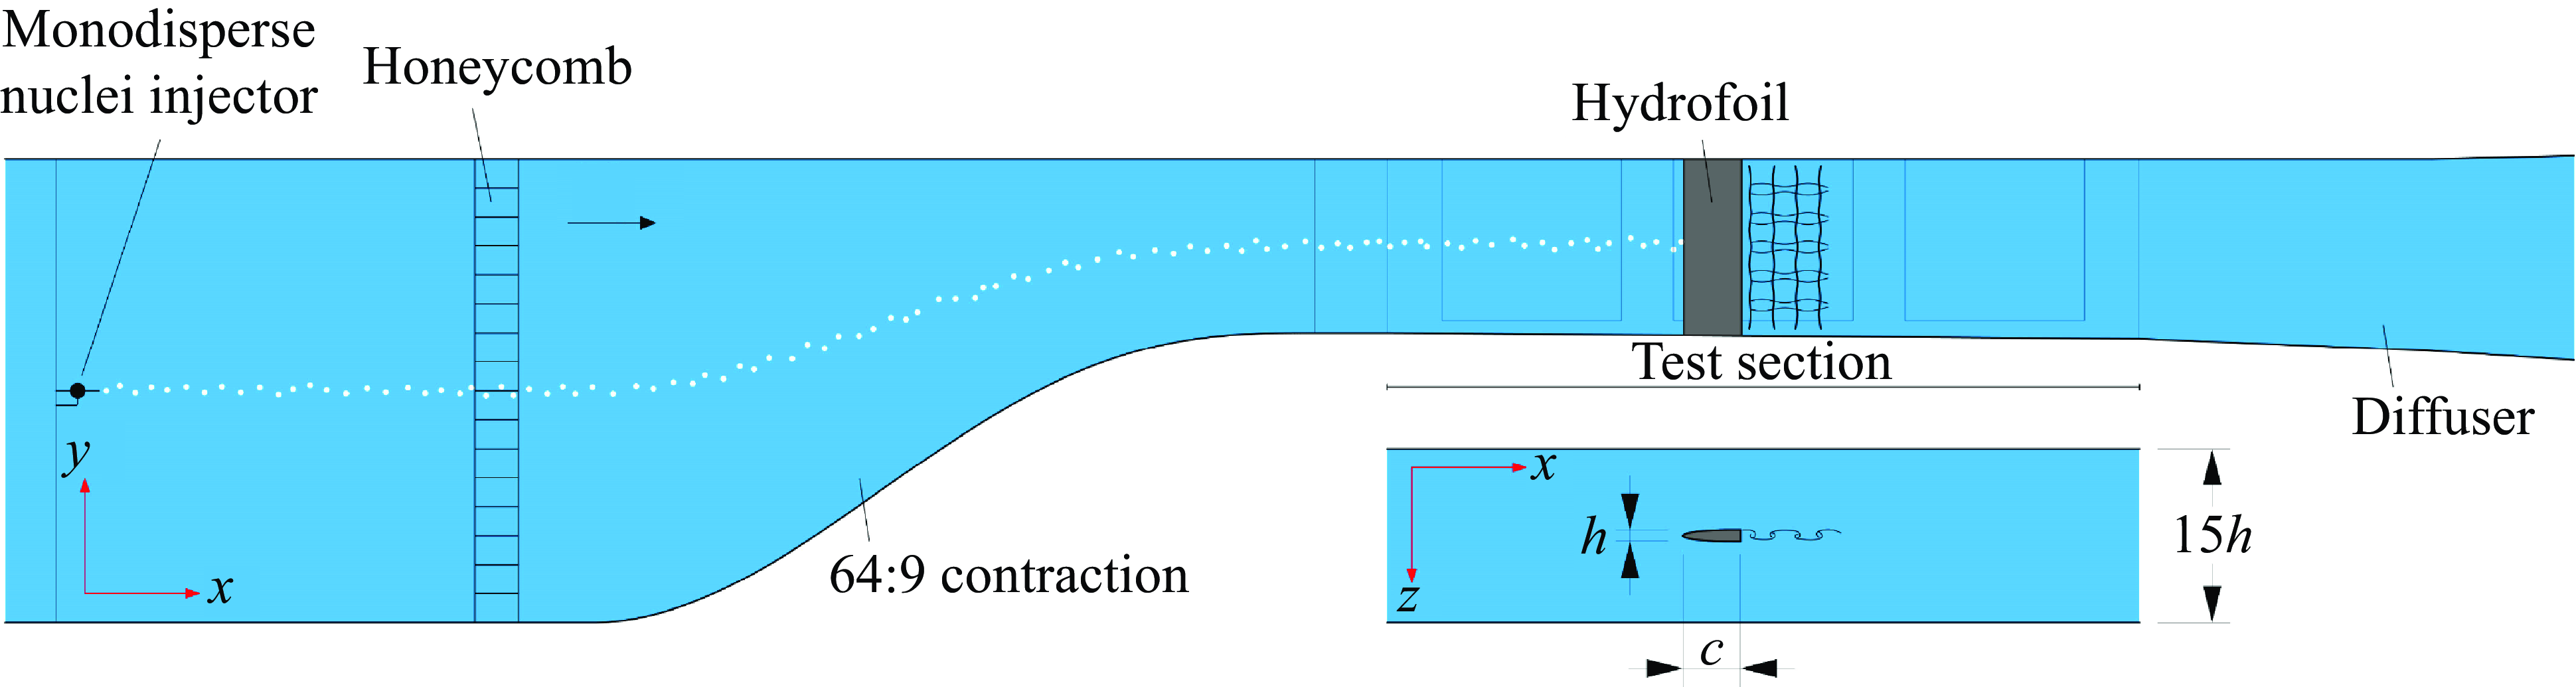
A side-view and top-view schematic of the two-dimensional bluff hydrofoil used to study cavitation inception in structured turbulence. The origin of the coordinate system is located at the intersection of the hydrofoil trailing edge with the test-section centreline. A monodisperse nuclei generator used to seed the flow is shown mounted in the plenum upstream of the tunnel test section. The nuclei disperse into a Gaussian plume about 80 mm in diameter at the streamwise location of the hydrofoil.
The experimental set-up has been developed to study cavitation inception in the structured turbulence in the wake of a nominally two-dimensional bluff hydrofoil, as schematically represented in figure 1. The hydrofoil model is machined out of a stainless steel plate, with a chord length, $c = 200$
mm, and span,
$c = 200$
mm, and span, $s = 600$
mm (equal to the test-section height). A NACA 4-digit-modified-series section (Pearce & Brandner Reference Pearce and Brandner2015), with
$s = 600$
mm (equal to the test-section height). A NACA 4-digit-modified-series section (Pearce & Brandner Reference Pearce and Brandner2015), with $0.01 c$
leading edge radius and
$0.01 c$
leading edge radius and $0^{\circ }$
angle at the trailing edge, was chosen to maintain a favourable pressure gradient and laminar boundary layer along the hydrofoil chord. The hydrofoil maximum thickness,
$0^{\circ }$
angle at the trailing edge, was chosen to maintain a favourable pressure gradient and laminar boundary layer along the hydrofoil chord. The hydrofoil maximum thickness, $h$
, is 40 mm, resulting in an aspect ratio,
$h$
, is 40 mm, resulting in an aspect ratio, $AR = s/h = 15$
, and a blockage ratio of 6.7 %. The hydrofoil is mounted vertically at the test-section centreline, with the leading edge located 1225 mm downstream of the test-section entrance.
$AR = s/h = 15$
, and a blockage ratio of 6.7 %. The hydrofoil is mounted vertically at the test-section centreline, with the leading edge located 1225 mm downstream of the test-section entrance.
High-speed imaging of cavitation inception events was acquired using two simultaneously triggered Phantom v2640 cameras mounted to the side and bottom of the test section. The cameras were equipped with Sigma 180 mm 1:2.8 APO Macro DG-HSM lenses and the images were acquired at the camera full resolution, $2048 \times 1952$
pixels, at a sampling rate of 6600 frames per second for 7.6 s. The image calibration for both views was performed by traversing a plate with a printed dot-pattern across the respective regions where inception was observed. For the camera mounted to the side of the test section, the magnification factor was 10.95 px mm
$2048 \times 1952$
pixels, at a sampling rate of 6600 frames per second for 7.6 s. The image calibration for both views was performed by traversing a plate with a printed dot-pattern across the respective regions where inception was observed. For the camera mounted to the side of the test section, the magnification factor was 10.95 px mm $^{\mathrm {-1}}$
at the test-section vertical centre plane, with a negligible variation across the region of interest. For the camera mounted to the bottom of the test section, the magnification factor was 13.96 px mm
$^{\mathrm {-1}}$
at the test-section vertical centre plane, with a negligible variation across the region of interest. For the camera mounted to the bottom of the test section, the magnification factor was 13.96 px mm $^{\mathrm {-1}}$
at the test-section horizontal centre plane, with variation of approximately
$^{\mathrm {-1}}$
at the test-section horizontal centre plane, with variation of approximately $\pm 6\, \%$
across the region of interest (i.e.
$\pm 6\, \%$
across the region of interest (i.e. $\pm 100$
mm from the centre plane). Back-lighting was provided by an Effilux EFFI-BL
$\pm 100$
mm from the centre plane). Back-lighting was provided by an Effilux EFFI-BL $650 \times 650 ~\mathrm {mm^{2}}$
LED panel for the side camera, and by an Effilux EFFI-BL
$650 \times 650 ~\mathrm {mm^{2}}$
LED panel for the side camera, and by an Effilux EFFI-BL $300 \times 300 ~\mathrm {mm^{2}}$
LED panel for the bottom camera. The image acquisition was controlled via Phantom PCC 3.9 software with the external triggering signal provided from a BNC Model 575 delay/pulse generator with a 250 ps accuracy.
$300 \times 300 ~\mathrm {mm^{2}}$
LED panel for the bottom camera. The image acquisition was controlled via Phantom PCC 3.9 software with the external triggering signal provided from a BNC Model 575 delay/pulse generator with a 250 ps accuracy.
Acoustic measurements were obtained simultaneously with high-speed imaging using a Bruel & Kjær 8103 hydrophone. The hydrophone was mounted in a flooded cavity (pressure equalised to the tunnel test section) beneath a 10 mm polyurethane diaphragm, with a 149 mm sensing diameter (Doolan et al. Reference Doolan, Brandner, Butler, Pearce, Moreau and Brooks2013). The hydrophone was mounted in the side window at the test-section mid-height, approximately $22h$
downstream of the hydrofoil trailing edge. The signal was conditioned with a Bruel & Kjær Nexus conditioning amplifier, which was also used to apply a 0.1 Hz–100 kHz bandpass filter. The filtered signal was acquired in 60 s periods using a National Instruments PXIe-4497 card at a sampling rate 204.8 kHz. Event detection within the acoustic data was adapted from the method described by Khoo et al. (Reference Khoo, Venning, Pearce, Takahashi, Mori and Brandner2020). This type of processing is best suited to capture the small-scale features, such as incipient clicks, pops and chirps (Chang & Ceccio Reference Chang and Ceccio2011), but has also been used to capture large-event structures through the high-frequency content associated with cavity fragmentation, or the vapour cavity collapse that follows inception in TLF (Russell et al. Reference Russell, Barbaca, Venning, Pearce and Brandner2023).
$22h$
downstream of the hydrofoil trailing edge. The signal was conditioned with a Bruel & Kjær Nexus conditioning amplifier, which was also used to apply a 0.1 Hz–100 kHz bandpass filter. The filtered signal was acquired in 60 s periods using a National Instruments PXIe-4497 card at a sampling rate 204.8 kHz. Event detection within the acoustic data was adapted from the method described by Khoo et al. (Reference Khoo, Venning, Pearce, Takahashi, Mori and Brandner2020). This type of processing is best suited to capture the small-scale features, such as incipient clicks, pops and chirps (Chang & Ceccio Reference Chang and Ceccio2011), but has also been used to capture large-event structures through the high-frequency content associated with cavity fragmentation, or the vapour cavity collapse that follows inception in TLF (Russell et al. Reference Russell, Barbaca, Venning, Pearce and Brandner2023).
The experiments were performed for a range of hydrofoil-chord-based Reynolds numbers, $0.5 \times 10^{6} \leqslant Re_{c} = U c / \nu \leqslant 2 \times 10^{6}$
, where
$0.5 \times 10^{6} \leqslant Re_{c} = U c / \nu \leqslant 2 \times 10^{6}$
, where $U$
is the free-stream velocity and
$U$
is the free-stream velocity and $\nu$
is the kinematic viscosity of the water. The cavitation number is defined as
$\nu$
is the kinematic viscosity of the water. The cavitation number is defined as $\sigma = (p - p_{v})/0.5 \rho U^{2}$
, where
$\sigma = (p - p_{v})/0.5 \rho U^{2}$
, where $p$
is the static pressure at the tunnel centreline,
$p$
is the static pressure at the tunnel centreline, $p_{v}$
is the vapour pressure and
$p_{v}$
is the vapour pressure and $\rho$
is the water density. Testing was carried out for cavitation numbers in the range
$\rho$
is the water density. Testing was carried out for cavitation numbers in the range $4 \leqslant \sigma \leqslant 11$
.
$4 \leqslant \sigma \leqslant 11$
.
Nuclei seeding along the test-section centre line was achieved via microbubble generation from a single microfluidic T-junction device mounted within the plenum upstream of the tunnel contraction. This method of nuclei generation produced a monodisperse nuclei population, with a nominal nuclei diameter of the order of $100 \, \unicode {x03BC}$
m (Ailwood et al. Reference Ailwood, Venning, Barbaca, Russell, Pearce and Brandner2022). The resulting plume in the test section has a Gaussian concentration distribution of approximately 80 mm diameter (Brandner, Venning & Pearce Reference Brandner, Venning and Pearce2022). The microbubble production rate was controlled through a balance of water and air pressures within the junction, with a nominal operating range
$100 \, \unicode {x03BC}$
m (Ailwood et al. Reference Ailwood, Venning, Barbaca, Russell, Pearce and Brandner2022). The resulting plume in the test section has a Gaussian concentration distribution of approximately 80 mm diameter (Brandner, Venning & Pearce Reference Brandner, Venning and Pearce2022). The microbubble production rate was controlled through a balance of water and air pressures within the junction, with a nominal operating range $100 \, \mathrm {s^{-1}} \lt I \lt 1000 \, \mathrm {s^{-1}}$
. Microbubble production was quantified via high-speed imaging from a Phantom TMX 7510 camera equipped with a Questar QM1 long-range microscope (magnification factor 143 px mm
$100 \, \mathrm {s^{-1}} \lt I \lt 1000 \, \mathrm {s^{-1}}$
. Microbubble production was quantified via high-speed imaging from a Phantom TMX 7510 camera equipped with a Questar QM1 long-range microscope (magnification factor 143 px mm $^\mathrm {-1}$
). Collimated back illumination was provided by an Effilux EFFI-TELE- 45–000 LED lamp. The images were acquired during the measurement of the acoustic data at a resolution
$^\mathrm {-1}$
). Collimated back illumination was provided by an Effilux EFFI-TELE- 45–000 LED lamp. The images were acquired during the measurement of the acoustic data at a resolution $1024 \times 800$
pixels and a sampling rate of 10 000 frames per second for a 7.6 s period. High-speed imaging of the injected nuclei and the incipient events were recorded simultaneously during one of five acoustic recording windows.
$1024 \times 800$
pixels and a sampling rate of 10 000 frames per second for a 7.6 s period. High-speed imaging of the injected nuclei and the incipient events were recorded simultaneously during one of five acoustic recording windows.
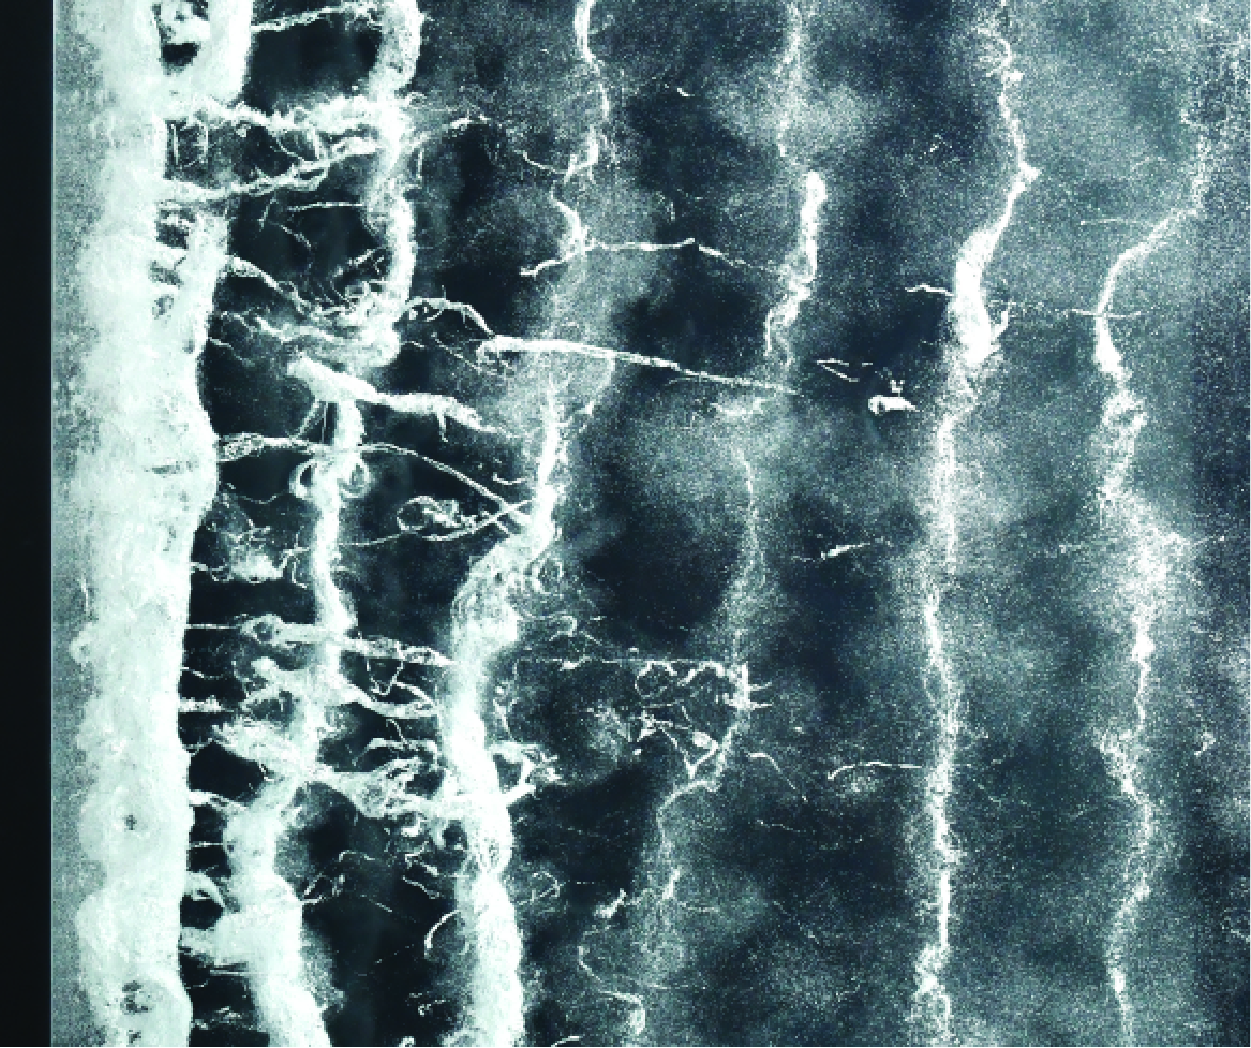
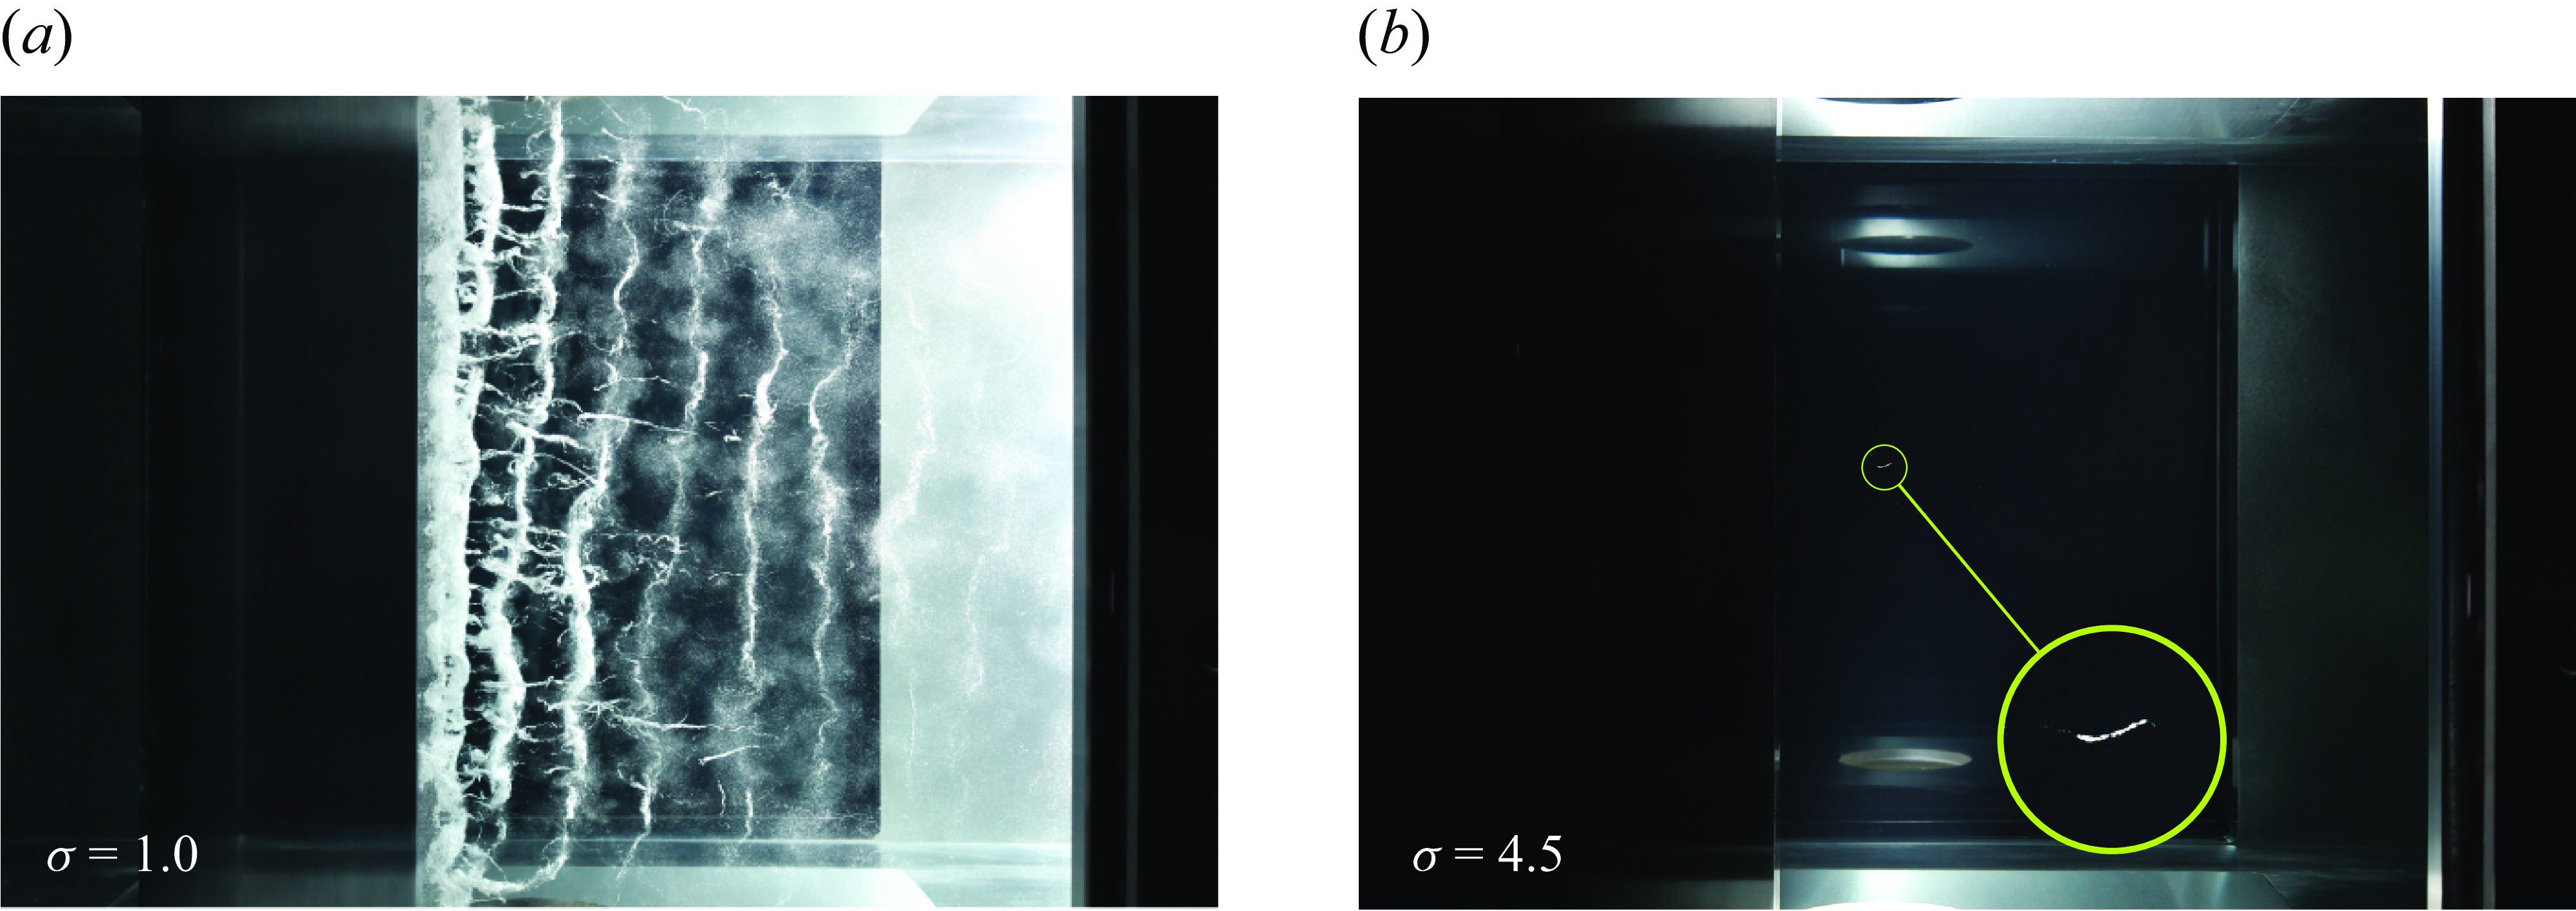
(a) Side view of the vortical structures in the wake of the studied hydrofoil visualised by developed cavitation at $\sigma = 1$
and
$\sigma = 1$
and $Re = 1.5\times 10^6$
. The vortex system consists of a typical von Kármán vortex street, with intermittent braids of secondary vorticity present between the primary rolls. (b) Side-view of a single inception event in secondary vortices at
$Re = 1.5\times 10^6$
. The vortex system consists of a typical von Kármán vortex street, with intermittent braids of secondary vorticity present between the primary rolls. (b) Side-view of a single inception event in secondary vortices at $\sigma = 4.5$
, with magnified inset.
$\sigma = 4.5$
, with magnified inset.
3. Results
Developed cavitation can be used in order to visualise key elements also present in the single-phase flow topology, as displayed in figure 2(a) for $\sigma = 1$
and
$\sigma = 1$
and $Re = 1.5\times 10^6$
. From the image analysis, the wavelength of the primary vortices,
$Re = 1.5\times 10^6$
. From the image analysis, the wavelength of the primary vortices, $\lambda _x$
, is found to be approximately
$\lambda _x$
, is found to be approximately $2.6h$
, and from the analysis of the acoustic record the Strouhal number,
$2.6h$
, and from the analysis of the acoustic record the Strouhal number, $St = fh/U$
, is approximately
$St = fh/U$
, is approximately $0.26$
, where
$0.26$
, where $f$
is the shedding frequency of the primary vortices. Fine filamentous braids of secondary vortices can be seen wrapped around the primary spanwise vortices reminiscent of classical high-Reynolds-number von Kármán shedding in the wake of a bluff body, e.g. Williamson (Reference Williamson1996b
). A typical example of an incipient event in a secondary vortex is given in figure 2(b) for
$f$
is the shedding frequency of the primary vortices. Fine filamentous braids of secondary vortices can be seen wrapped around the primary spanwise vortices reminiscent of classical high-Reynolds-number von Kármán shedding in the wake of a bluff body, e.g. Williamson (Reference Williamson1996b
). A typical example of an incipient event in a secondary vortex is given in figure 2(b) for $\sigma = 4.5$
, with a magnified view provided in the inset.
$\sigma = 4.5$
, with a magnified view provided in the inset.
A sequence of images from the high-speed videos depicting the process of nuclei capture and cavitation inception, as a side-view (a) and bottom view (b). The inset panes are contrast adjusted and track a nucleus and the cavity through (1) advection prior to inception, (2) inception, (3) maximum cavity extension and (4) cavity collapse.
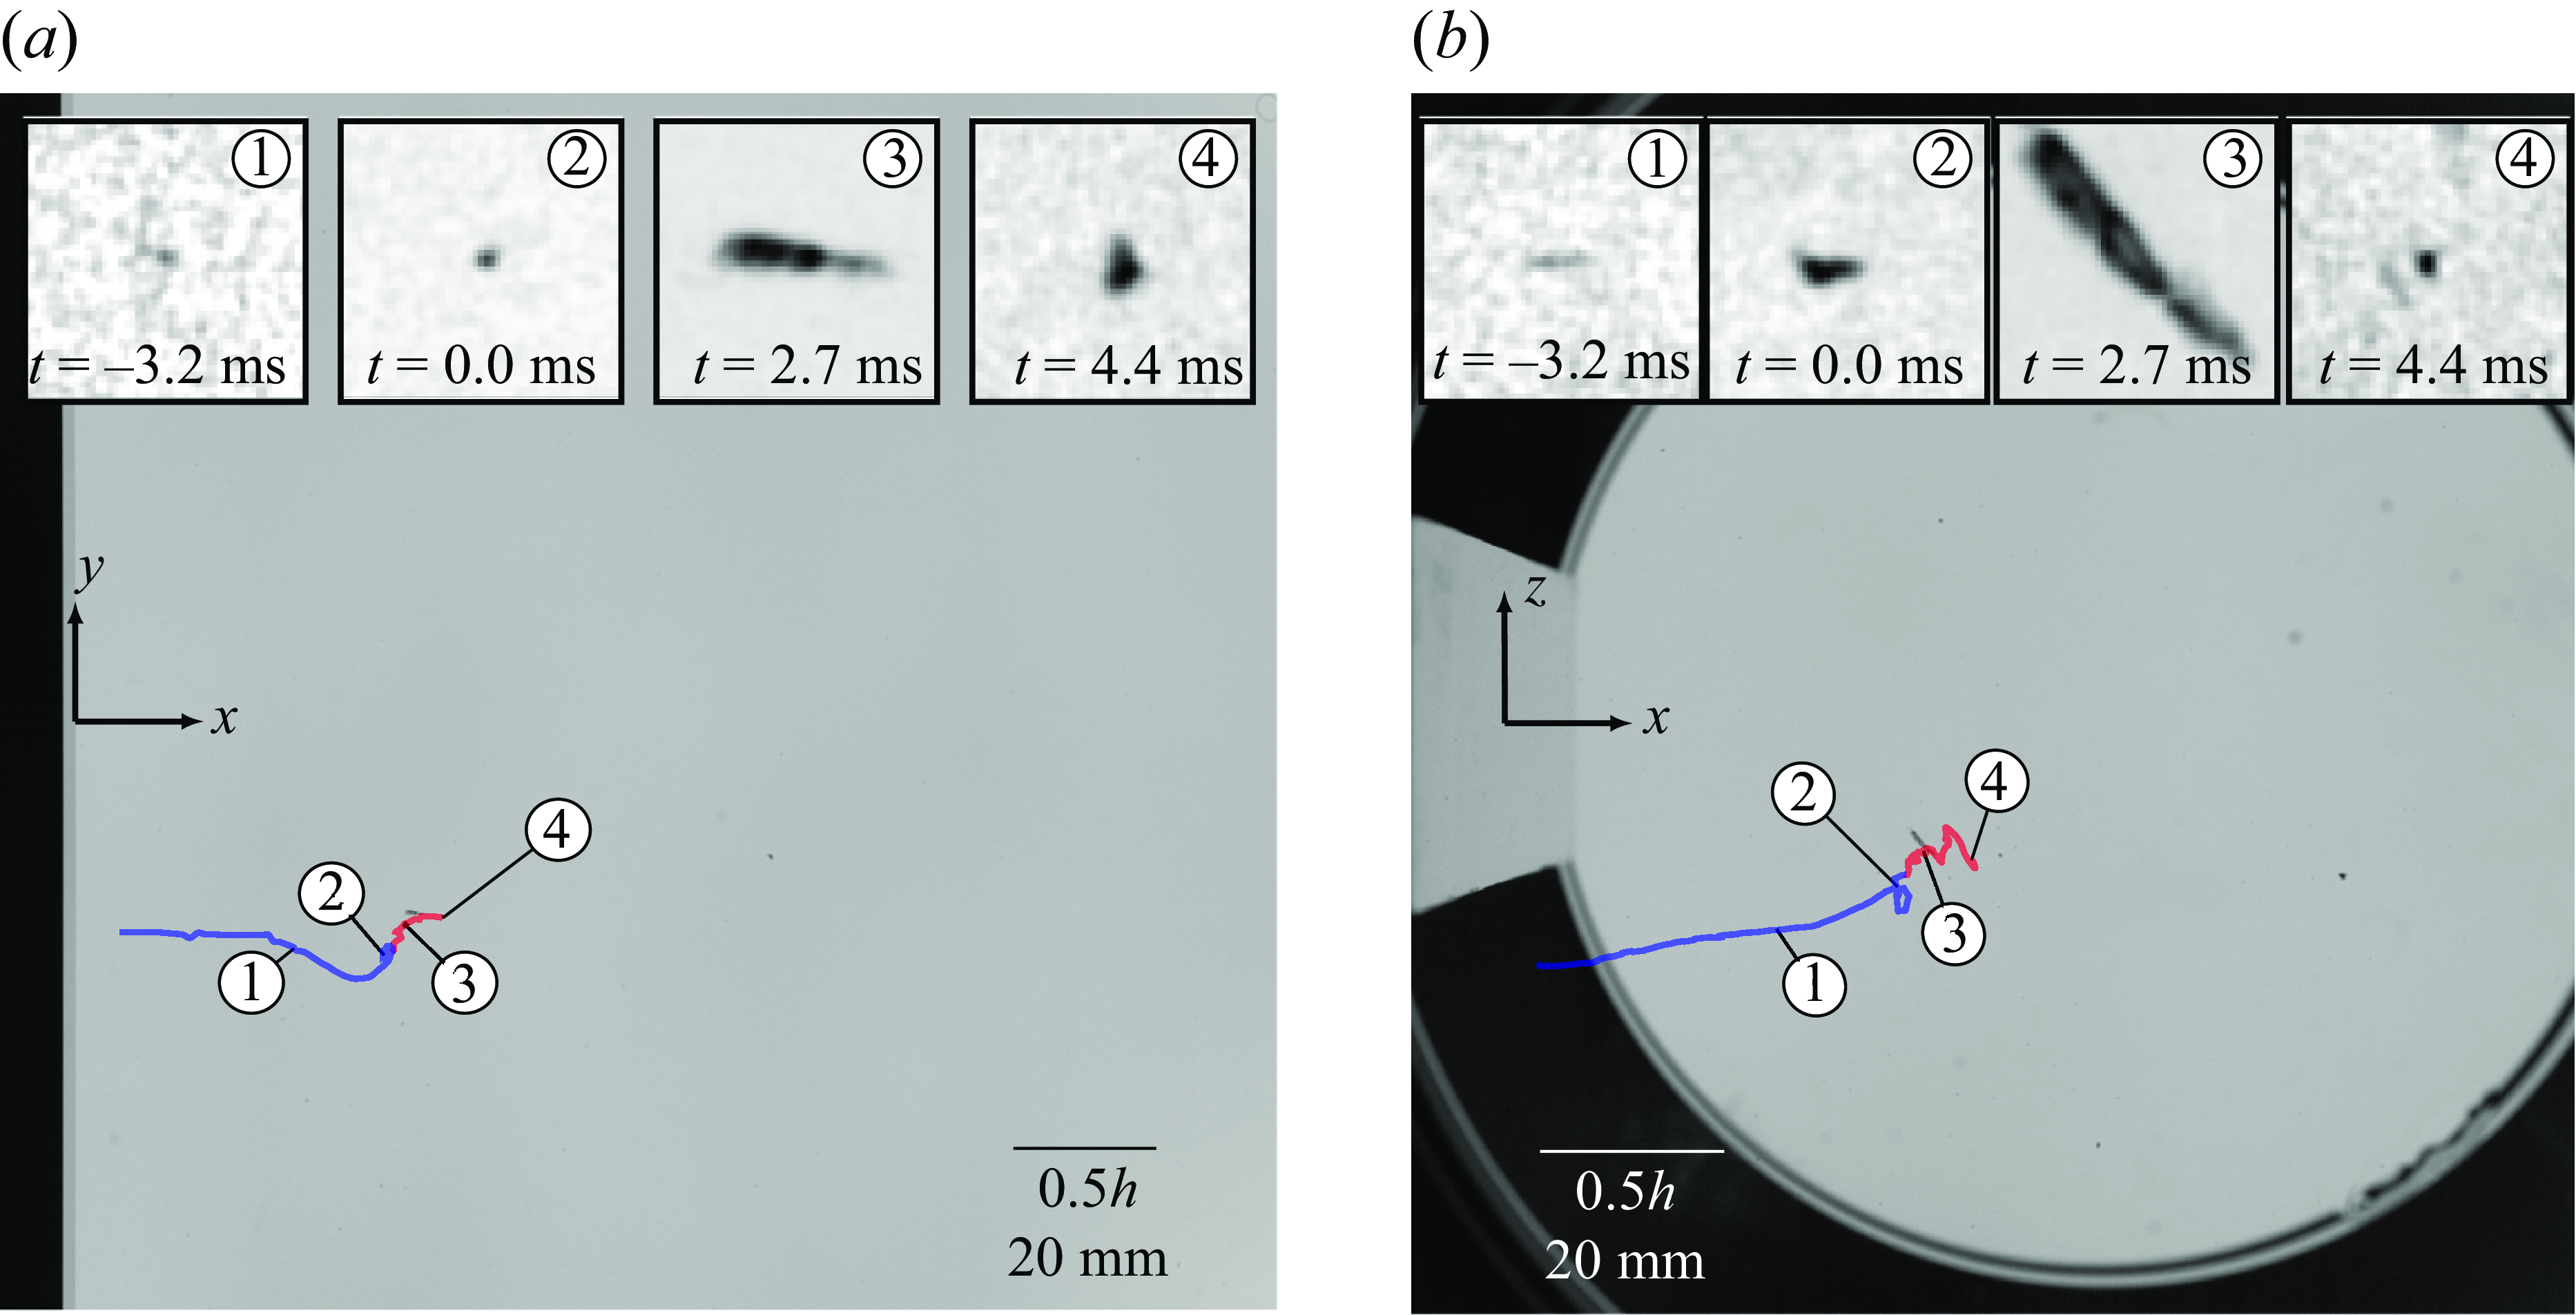
A sample sequence depicting the path of a nucleus prior to inception, along with the spatiotemporal evolution of the associated incipient structure is presented in figure 3, as seen from the side (a) and from below the test section (b). Contrast-adjusted inset panes are provided for clarity. The microbubble is initially advected by the underlying flow following a linear trajectory, before spiralling into the secondary vortex core (1). Inception occurs in inset (2) ( $t=0$
) as seen by the increase in size. The cavity continues to grow, reaching its maximum length 2.7 ms after inception (3). Post-inception (red line), the downstream motion of the cavity slows considerably in comparison with the prior movement of the nuclei (blue line). The cavity then begins to shrink, while still slowly advecting downstream, and collapses 4.4 ms after inception.
$t=0$
) as seen by the increase in size. The cavity continues to grow, reaching its maximum length 2.7 ms after inception (3). Post-inception (red line), the downstream motion of the cavity slows considerably in comparison with the prior movement of the nuclei (blue line). The cavity then begins to shrink, while still slowly advecting downstream, and collapses 4.4 ms after inception.
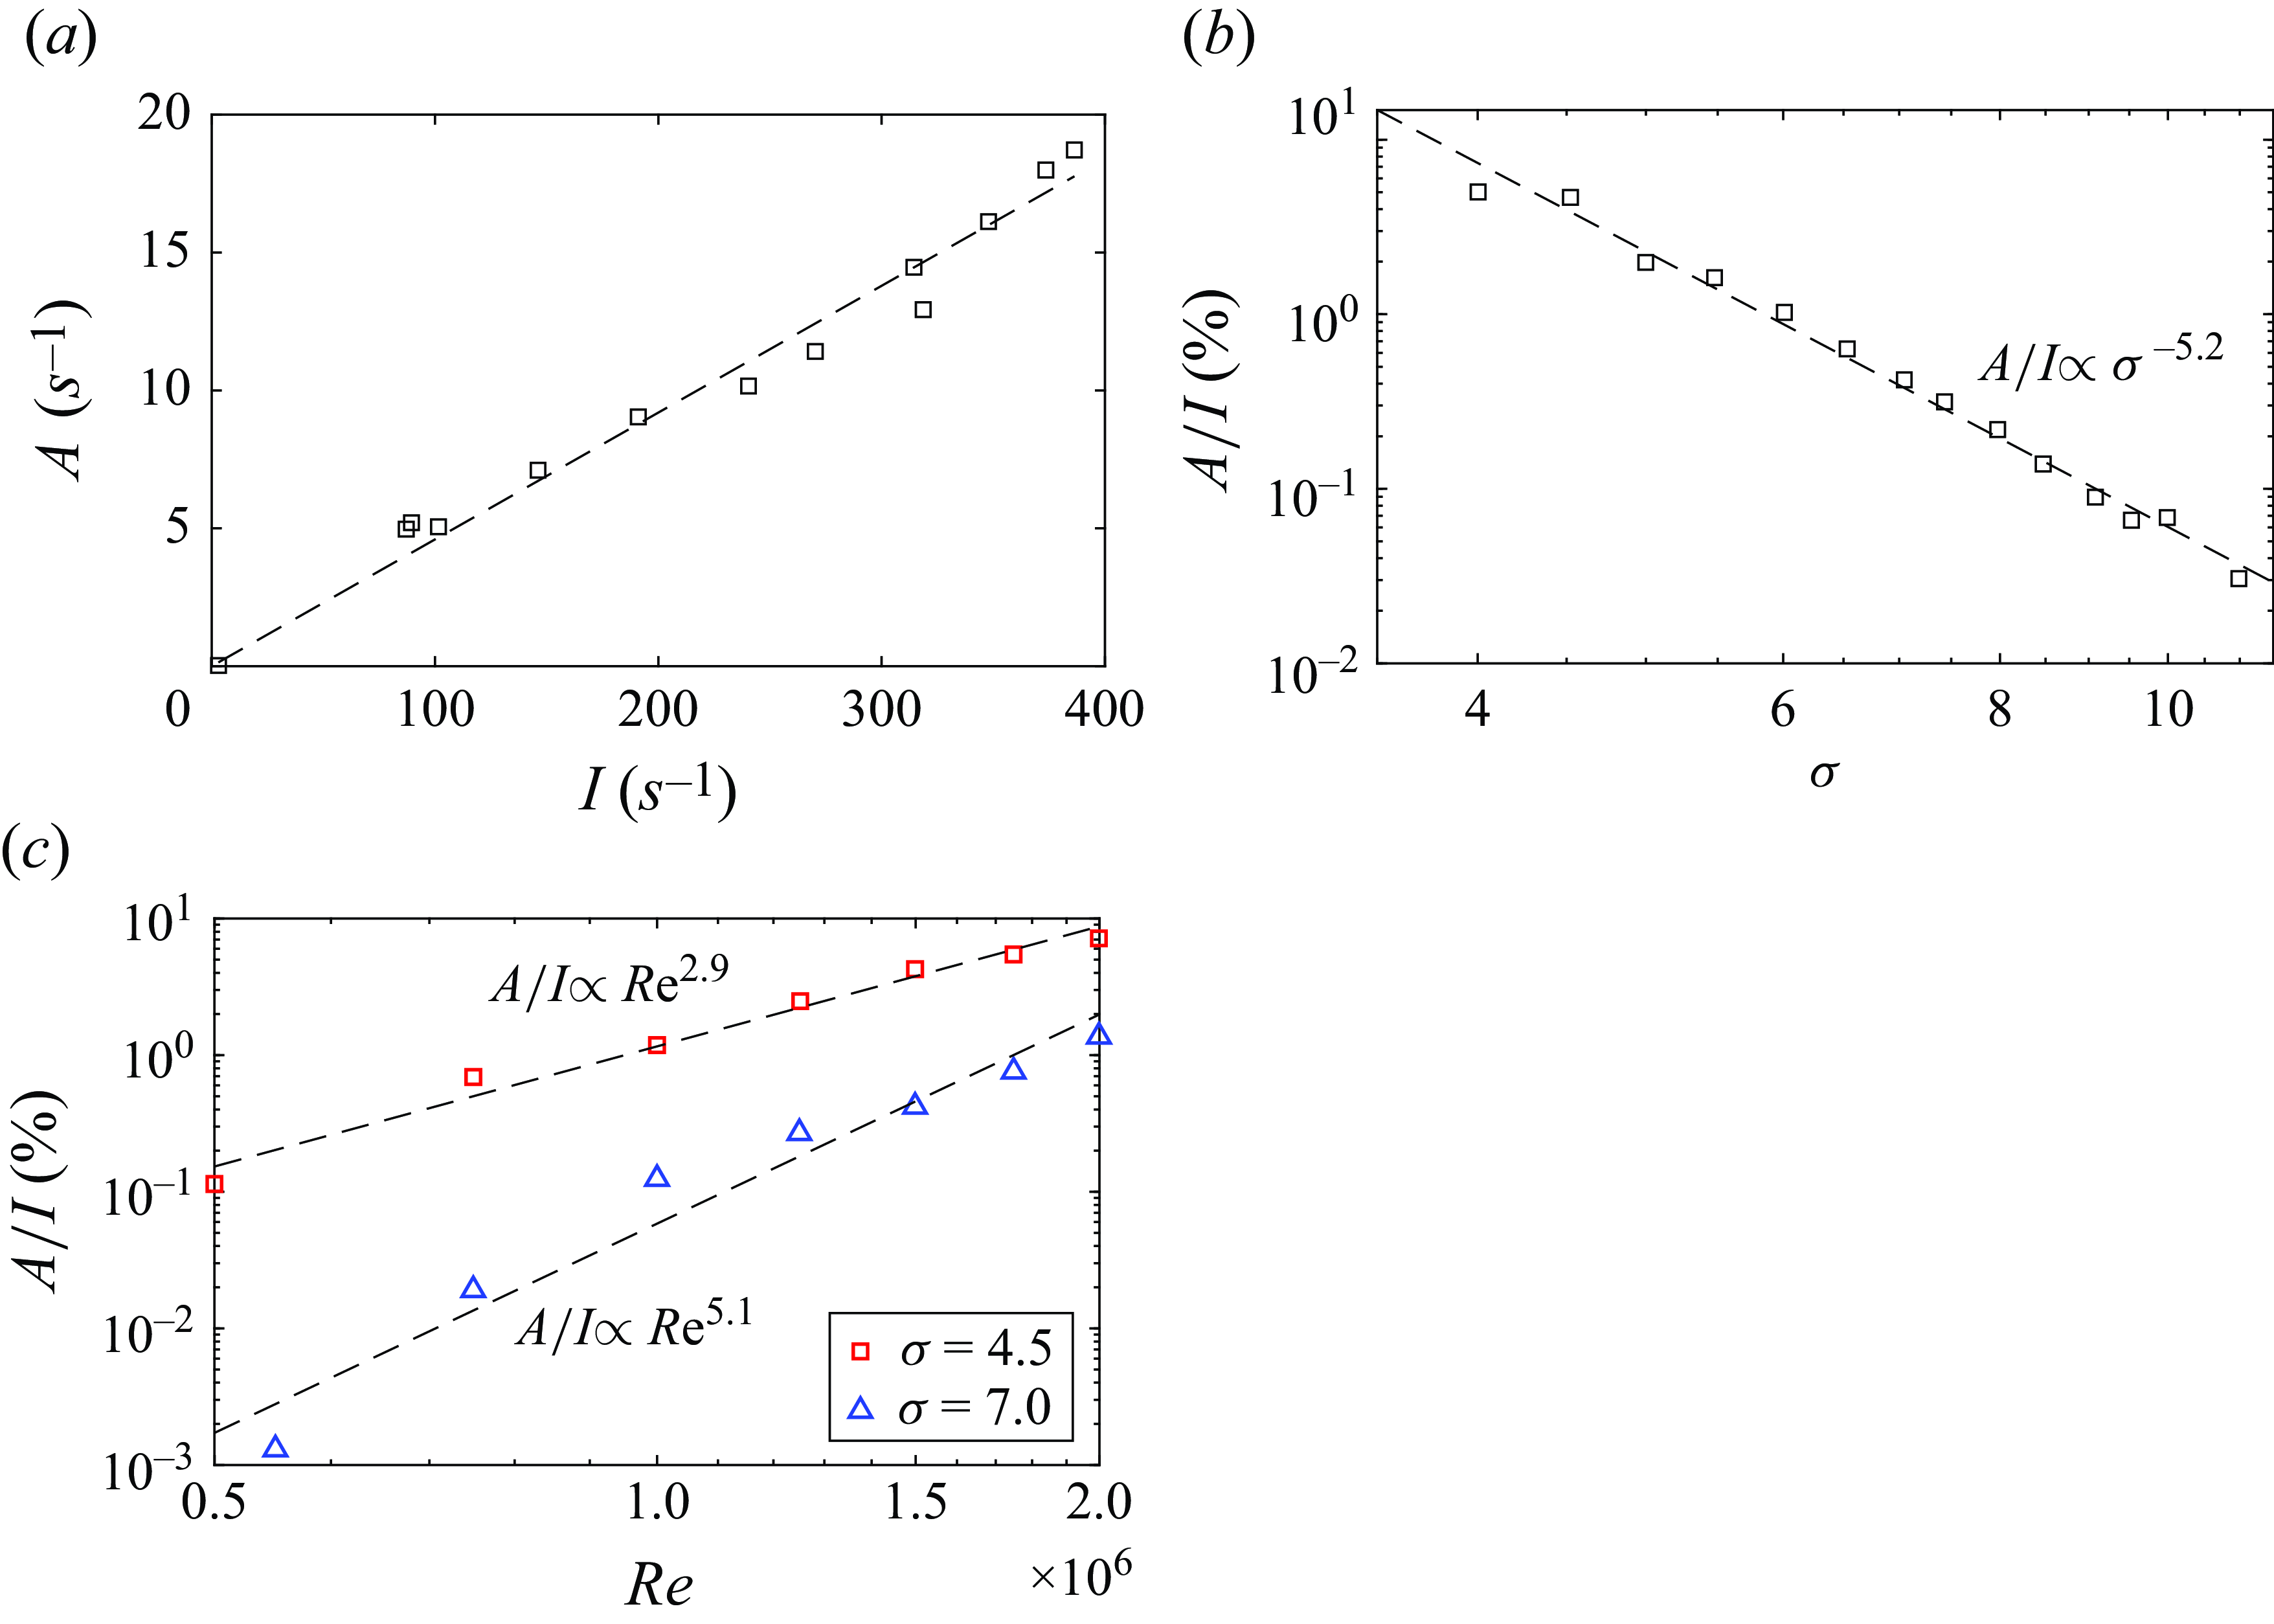
The nuclei activation rate was extracted from multiple recordings of the acoustic data at each nuclei injection rate in order to obtain a long period acquisition sample. The results are plotted in figure 4(a) for $Re= 1.5\times 10^6$
and
$Re= 1.5\times 10^6$
and $\sigma = 4.5$
, indicating the nuclei activation rate to be proportional to the injection rate. Based on this, all data can be normalised using the injection rate to reveal the proportion of activations within the total nuclei population (or susceptibility). Nuclei activation rate was observed to decrease in association with increasing cavitation number following a power law, as is shown in figure 4(b). For the range of
$\sigma = 4.5$
, indicating the nuclei activation rate to be proportional to the injection rate. Based on this, all data can be normalised using the injection rate to reveal the proportion of activations within the total nuclei population (or susceptibility). Nuclei activation rate was observed to decrease in association with increasing cavitation number following a power law, as is shown in figure 4(b). For the range of $\sigma$
values tested, the percentage of activations varies over three orders of magnitude, from order of 0.01
$\sigma$
values tested, the percentage of activations varies over three orders of magnitude, from order of 0.01 $\,\%$
to 10
$\,\%$
to 10 $\,\%$
of the available population. These relatively small values reflect that inception requires the confluence of two unlikely events, a subvapour pressure vortex core simultaneous with sufficiently weak nuclei capture. The activation rate dependence with order 5th power of
$\,\%$
of the available population. These relatively small values reflect that inception requires the confluence of two unlikely events, a subvapour pressure vortex core simultaneous with sufficiently weak nuclei capture. The activation rate dependence with order 5th power of $\sigma$
, coupled with a short typical event duration, demonstrates the challenge of measuring incipient event rates, and the requirement for instrumentation that operates over several temporal orders of magnitude. Nuclei activation rates also follow a power-law behaviour with increasing
$\sigma$
, coupled with a short typical event duration, demonstrates the challenge of measuring incipient event rates, and the requirement for instrumentation that operates over several temporal orders of magnitude. Nuclei activation rates also follow a power-law behaviour with increasing $Re$
, as shown in figure 4(c), with the power-law index further modulated by the cavitation number. Increase in activation rate with increasing
$Re$
, as shown in figure 4(c), with the power-law index further modulated by the cavitation number. Increase in activation rate with increasing $Re$
may be attributable to an increase in the number of vortices in the wake and a broader spectrum of vortex scales (Fujino et al. Reference Fujino, Motoori and Goto2023). These results, again, demonstrate significant variation of event rates over the measurement range. To circumvent these challenges, injection rates can be reduced – correspondingly reducing incipient rates to within those measurable based on instrumentation constraints and making the collection of data more manageable.
$Re$
may be attributable to an increase in the number of vortices in the wake and a broader spectrum of vortex scales (Fujino et al. Reference Fujino, Motoori and Goto2023). These results, again, demonstrate significant variation of event rates over the measurement range. To circumvent these challenges, injection rates can be reduced – correspondingly reducing incipient rates to within those measurable based on instrumentation constraints and making the collection of data more manageable.
(a) Measured activation rate ( $A$
) with increasing microbubble nuclei injection (
$A$
) with increasing microbubble nuclei injection ( $I$
), for
$I$
), for $Re = 1.5\times 10^6$
and cavitation of
$Re = 1.5\times 10^6$
and cavitation of $\sigma = 4.5$
. (b) Normalised activation rate (
$\sigma = 4.5$
. (b) Normalised activation rate ( $A/I$
) as a function of the cavitation number, for
$A/I$
) as a function of the cavitation number, for $Re = 1.5\times 10^6$
. (c) Variation in normalised event rate across a range of
$Re = 1.5\times 10^6$
. (c) Variation in normalised event rate across a range of $Re$
for two cavitation numbers,
$Re$
for two cavitation numbers, $\sigma = 4.5$
and
$\sigma = 4.5$
and $\sigma = 7$
.
$\sigma = 7$
.
(a) Schematic of the von Kármán wake of the bluff hydrofoil showing preferential inception locations. (b) Image from a high-speed video of concurrent inception in primary and secondary vortices.
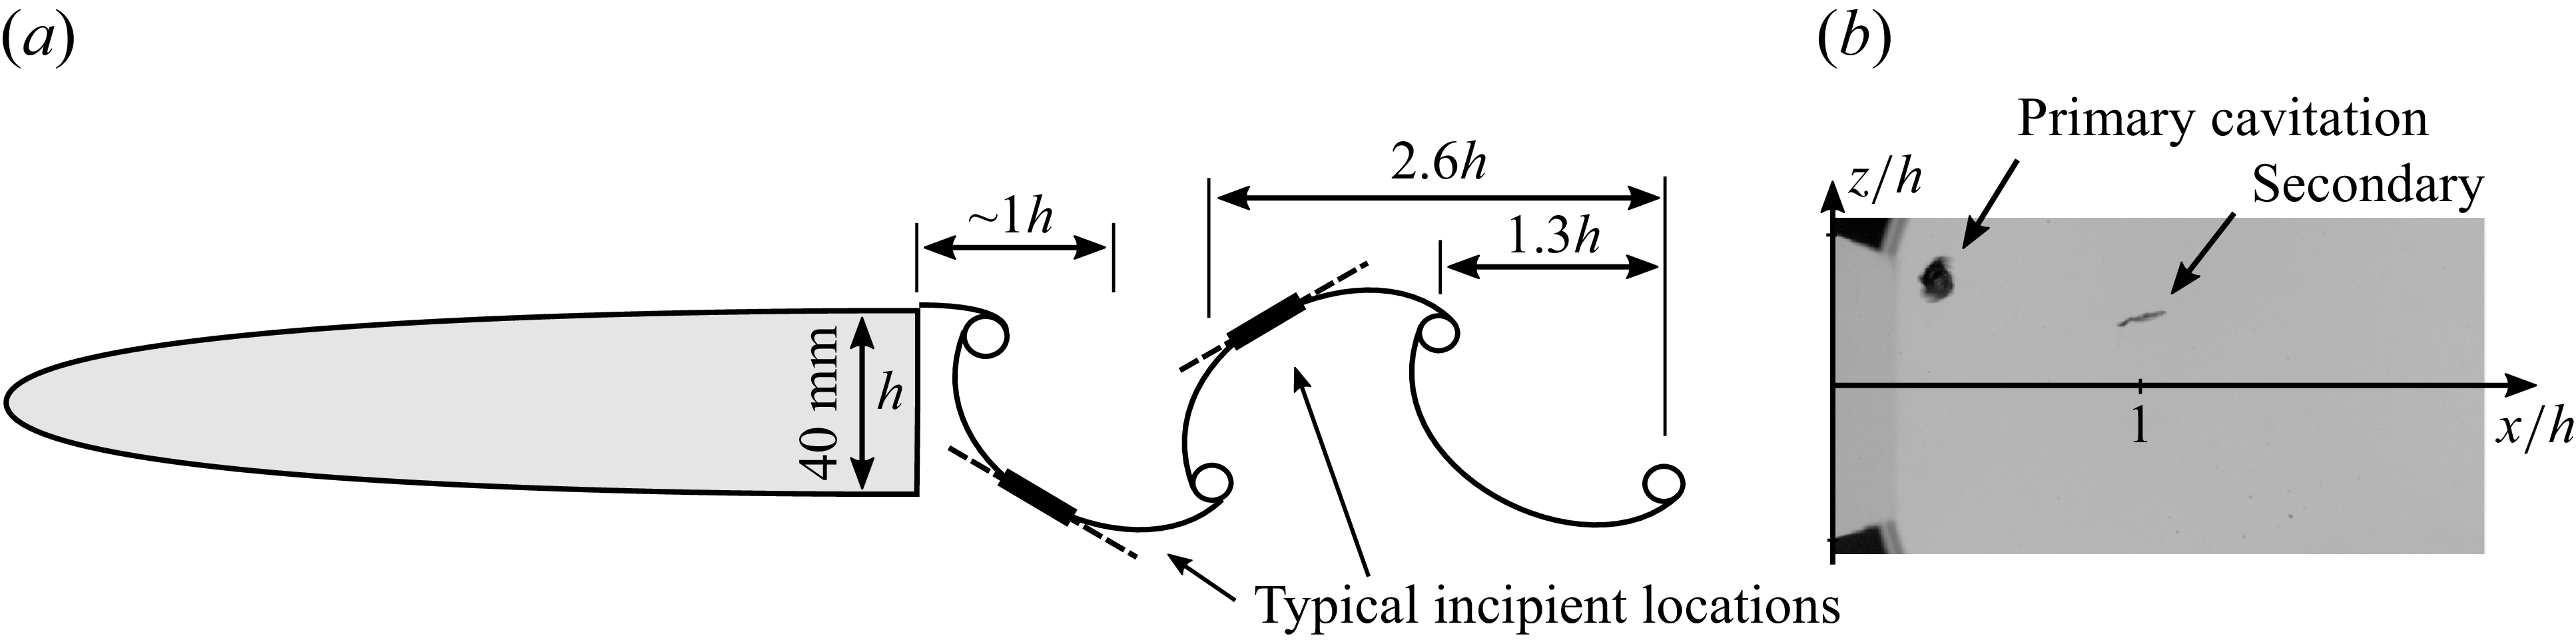
A total of 300 incipient events recorded with high-speed imaging and detected acoustically were manually analysed to determine their location, whether they were primary, secondary or indeterminate, and their orientation at maximum length. Primary vortex inception was defined as an aspect ratio of $\leqslant 2 : 1$
. It should be noted that inception in primary and secondary vortices are distinct. The former is a relatively large low aspect volume, in contrast with the relatively fine filamentous forms of the latter, as may be seen in figure 5. The overall results are shown in figure 6, from which it can be seen that most events occur in secondary vortices. Many events were too small to classify as primary or secondary; such events have been classed as ‘indeterminate’. These indeterminate events were also short in duration, visible for only 1–2 frames. Of the total events 78 % are secondary or 94 % if the indeterminate are assumed secondary, which is most likely the case based on their size. The observed distribution of nuclei activation locations compare closely to those in the wake of a blunt plate reported in Allan et al. (Reference Allan, Barbaca, Venning, Russell, Pearce and Brandner2024). The vertical histogram reflects the nominally 80 mm Gaussian concentration distribution of the seeded nuclei plume being just over
$\leqslant 2 : 1$
. It should be noted that inception in primary and secondary vortices are distinct. The former is a relatively large low aspect volume, in contrast with the relatively fine filamentous forms of the latter, as may be seen in figure 5. The overall results are shown in figure 6, from which it can be seen that most events occur in secondary vortices. Many events were too small to classify as primary or secondary; such events have been classed as ‘indeterminate’. These indeterminate events were also short in duration, visible for only 1–2 frames. Of the total events 78 % are secondary or 94 % if the indeterminate are assumed secondary, which is most likely the case based on their size. The observed distribution of nuclei activation locations compare closely to those in the wake of a blunt plate reported in Allan et al. (Reference Allan, Barbaca, Venning, Russell, Pearce and Brandner2024). The vertical histogram reflects the nominally 80 mm Gaussian concentration distribution of the seeded nuclei plume being just over $2h$
high. The few primary events occur within
$2h$
high. The few primary events occur within $1h$
of the trailing edge, where presumably the primary vortices are strongest with their initial formation. These can also be seen to occur in two bands either side of the vertical centre plane where they develop and are released. Most events occur within a broad streamwise peak approximately
$1h$
of the trailing edge, where presumably the primary vortices are strongest with their initial formation. These can also be seen to occur in two bands either side of the vertical centre plane where they develop and are released. Most events occur within a broad streamwise peak approximately $1h$
in length centred approximately
$1h$
in length centred approximately $1h$
downstream of the hydrofoil trailing edge. This would imply that most events occur in the secondary vortices between an attached developing primary and the first released primary vortex, given the half-wavelength is approximately
$1h$
downstream of the hydrofoil trailing edge. This would imply that most events occur in the secondary vortices between an attached developing primary and the first released primary vortex, given the half-wavelength is approximately $1.3h$
, as shown diagrammatically in figure 5. These results would also imply that the secondary vortices undergo greatest stretching between approximately
$1.3h$
, as shown diagrammatically in figure 5. These results would also imply that the secondary vortices undergo greatest stretching between approximately $0.5h\lt x \lt 1.5h$
. Nevertheless, events occur up to
$0.5h\lt x \lt 1.5h$
. Nevertheless, events occur up to $3h$
and these can be seen to occur preferentially in lobes between 0.5 and
$3h$
and these can be seen to occur preferentially in lobes between 0.5 and $1h$
either side of the hydrofoil centreline, reflected in the bimodal cross-stream histogram. These downstream events would then occur in secondary vortices between two advected primary vortices.
$1h$
either side of the hydrofoil centreline, reflected in the bimodal cross-stream histogram. These downstream events would then occur in secondary vortices between two advected primary vortices.
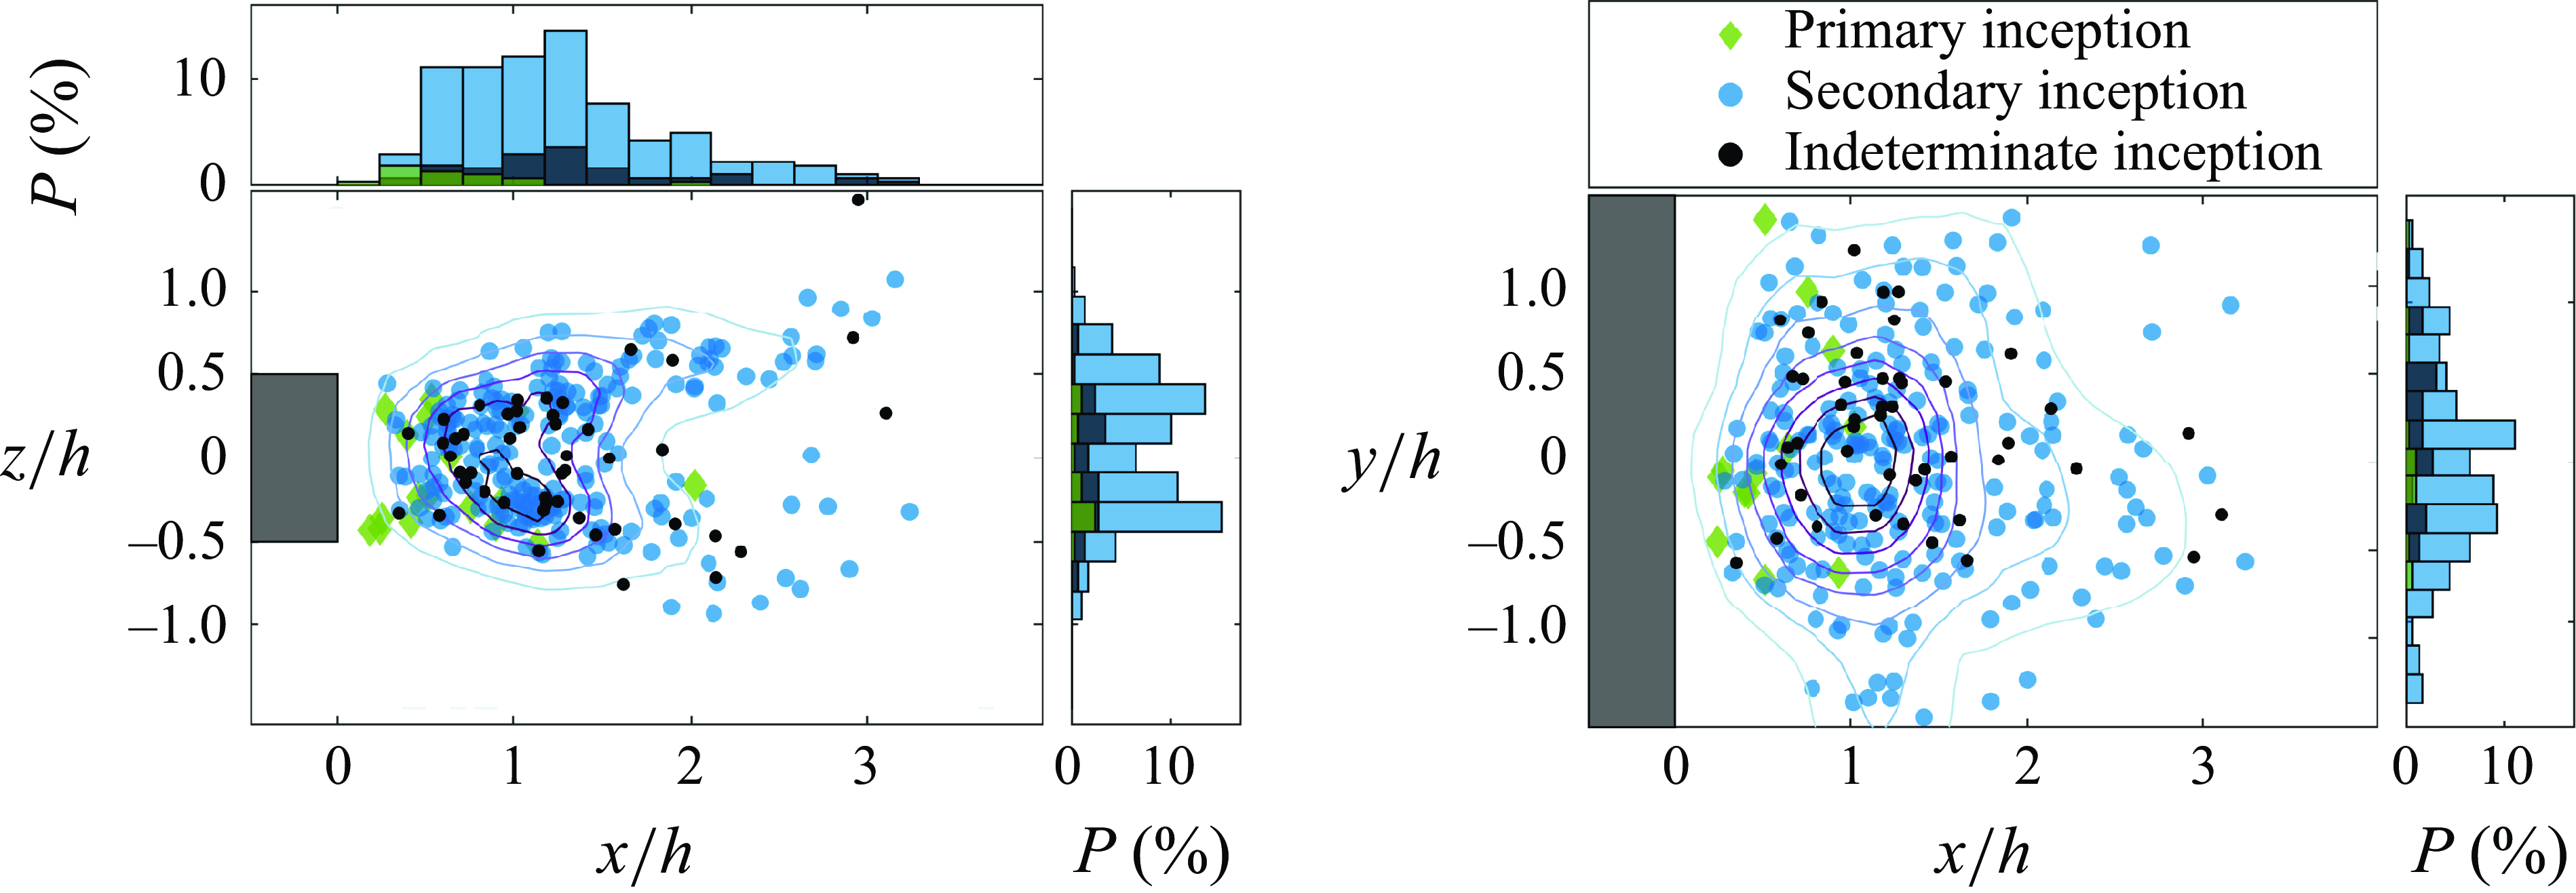
Spatial distribution of incipient events at a cavitation of $\sigma = 4.5$
, and
$\sigma = 4.5$
, and $Re = 1.5\times 10^6$
, with associated probability histograms as (
$Re = 1.5\times 10^6$
, with associated probability histograms as ( $P$
) marginal insets.
$P$
) marginal insets.
A superimposition of the maximum extent of all secondary incipient events (left). The spatial orientation of the nose-tail line of the cavitating vortices (shown in red) are also plotted as the horizontal angle ( $\theta$
) against the vertical angle (
$\theta$
) against the vertical angle ( $\phi$
) (right). Probability distributions for each variable are given in the marginal insets.
$\phi$
) (right). Probability distributions for each variable are given in the marginal insets.
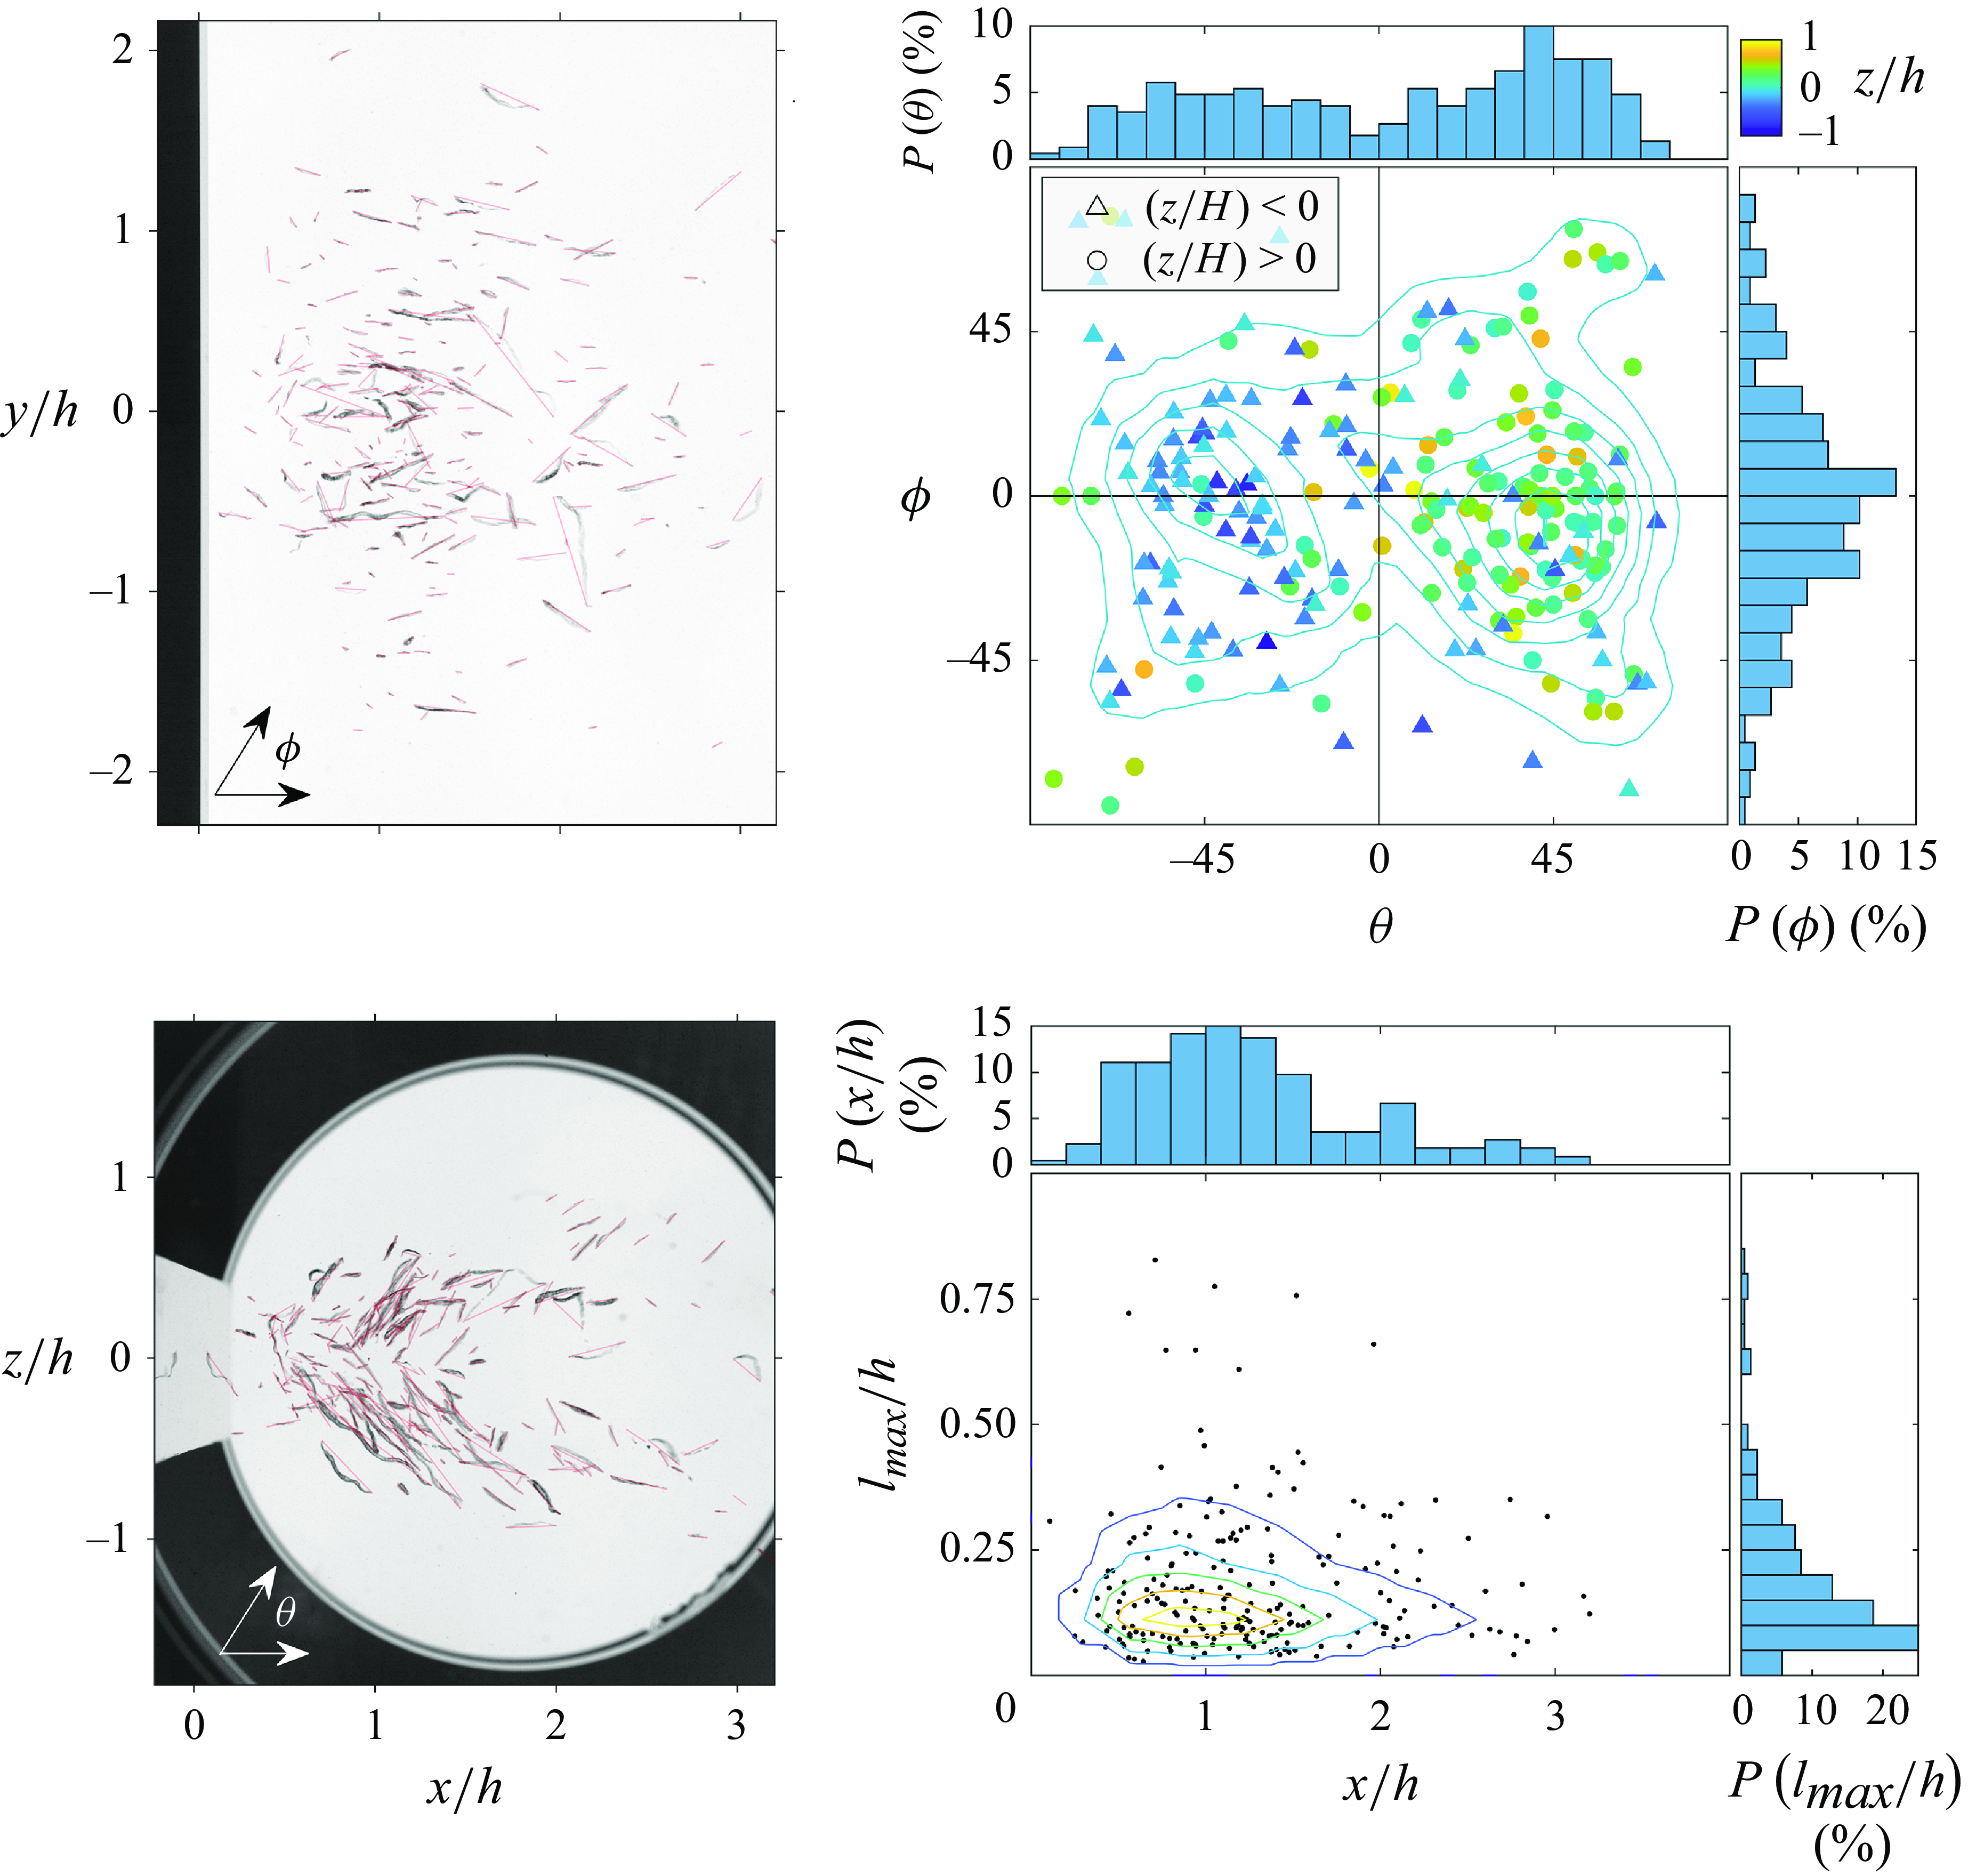
The properties of the incepted vortices at their largest extent are displayed in figure 7. Red lines between end points are overlaid to visually illustrate maximum cavity length and vertical and horizontal angles. Incipient cavities viewed in the vertical plane (figure 7
a) show predominant free-stream orientation with rare occurrences of $\phi$
up to 90
$\phi$
up to 90 $^\circ$
. In the horizontal plane (figure 7b), orientation
$^\circ$
. In the horizontal plane (figure 7b), orientation $\theta$
is far more coherent with most probable angles of
$\theta$
is far more coherent with most probable angles of $\theta = +45^\circ |_{+z}$
and
$\theta = +45^\circ |_{+z}$
and $\theta = -45^\circ |_{-z}$
. This can be seen qualitatively in figure 7(b) and quantitatively in figure 7(d). Indeed, most events occur at
$\theta = -45^\circ |_{-z}$
. This can be seen qualitatively in figure 7(b) and quantitatively in figure 7(d). Indeed, most events occur at $\theta = \pm 45^\circ$
and these are most likely at
$\theta = \pm 45^\circ$
and these are most likely at $\phi = 0^\circ$
suggesting they occur between primary vortices (shown schematically in figure 5) and where there is greatest stretching. Large orientations could be associated with events that occur where the secondary vortices wrap or spiral around the primary vortices where such large angles can develop, notwithstanding tertiary structures. The correlation of large
$\phi = 0^\circ$
suggesting they occur between primary vortices (shown schematically in figure 5) and where there is greatest stretching. Large orientations could be associated with events that occur where the secondary vortices wrap or spiral around the primary vortices where such large angles can develop, notwithstanding tertiary structures. The correlation of large $\theta$
with large
$\theta$
with large $\phi$
shown in figure 7(d) would support this hypothesis. From figure 7(g,h) it can be seen that short cavity lengths of approximately
$\phi$
shown in figure 7(d) would support this hypothesis. From figure 7(g,h) it can be seen that short cavity lengths of approximately $0.1h$
are most probable and at the most probable location. Unlikely long cavities also occur at the most probable location. The disposition and orientation of the incipient secondary vortices described earlier is consistent with discussions on flow topology in classical von Kármán shedding behind circular cylinders in, for example, Williamson (Reference Williamson1996b
) and in more recent direct numerical simulation (DNS) studies by Fujino et al. (Reference Fujino, Motoori and Goto2023).
$0.1h$
are most probable and at the most probable location. Unlikely long cavities also occur at the most probable location. The disposition and orientation of the incipient secondary vortices described earlier is consistent with discussions on flow topology in classical von Kármán shedding behind circular cylinders in, for example, Williamson (Reference Williamson1996b
) and in more recent direct numerical simulation (DNS) studies by Fujino et al. (Reference Fujino, Motoori and Goto2023).
4. Conclusions
Cavitation inception in a high-Reynolds-number von Kármán wake from a bluff two-dimensional hydrofoil, seeded with a known nuclei population, has been investigated. Simultaneous measurement of nuclei injection rates and incipient activation rates demonstrated a linear relationship for the range of values tested. This result enables incipient rates to be normalised by the injection rate to give the proportion of activated nuclei of the total available population (or susceptibility). This percentage increases with order 5th power with reducing cavitation number. A power-law relationship also holds for increasing Reynolds numbers with similar powers depending on the cavitation number. Activation percentages are small varying between order 0.001 % and 10 %. These relatively small values reflect that inception requires the confluence of two unlikely events, occurrence of a subvapour pressure vortex core simultaneous with capture of a sufficiently weak nucleus. Incipient events occur predominantly in secondary vortices about one hydrofoil thickness downstream of the trailing edge. Given the primary wavelength, this implies they are most likely to occur between an attached growing primary and a released primary and less likely between released pairs. Most events are approximately 10 % of the hydrofoil thickness in length. A symmetric distribution was observed for the horizontal angle, with a dominant orientation $45^{\circ }$
from the free-stream direction. These
$45^{\circ }$
from the free-stream direction. These $\pm 45^{\circ }$
also occur most probably at zero vertical angle further implying they occur between primary vortices. Unlikely events with large horizontal and vertical angles could occur where the secondary vortices wrap or spiral around the primary vortices. Overall the data indicate that maximum stretching of secondary vortices occurs between primary pairs as opposed to where the secondary wraps around the primary vortices. This study provides new insights into the physics of cavitation nucleation and inception and provides a comprehensive dataset for development of computational models. Given the similarity of the wake flow with other bluff-body wakes obvious future work would be repetition of the present experiments with a circular cylinder for direct comparison with available DNS and experimental databases.
$\pm 45^{\circ }$
also occur most probably at zero vertical angle further implying they occur between primary vortices. Unlikely events with large horizontal and vertical angles could occur where the secondary vortices wrap or spiral around the primary vortices. Overall the data indicate that maximum stretching of secondary vortices occurs between primary pairs as opposed to where the secondary wraps around the primary vortices. This study provides new insights into the physics of cavitation nucleation and inception and provides a comprehensive dataset for development of computational models. Given the similarity of the wake flow with other bluff-body wakes obvious future work would be repetition of the present experiments with a circular cylinder for direct comparison with available DNS and experimental databases.
Acknowledgements
The authors are grateful for the assistance of S. Kent and R. Wrigley in conducting experiments and acknowledge the support of the Australian Defence Science and Technology Group within the framework of the Office of Naval Research 2017 US Multidisciplinary University Research Initiative (MURI) entitled ‘Predicting turbulent multiphase flows with high-fidelity: a physics-based approach’ (program managers Dr K.-H. Kim and Dr Y.L. Young).
Declaration of interests
The authors report no conflict of interest.


 Open access