Introduction
The frozen archive of snow and ice accessed by coring in the polar regions is an invaluable source of information about climate and environmental history. However, the question arises how representative the information from ice cores is at a regional scale. Post-depositional processes such as redistribution of snow by the wind may influence both the snow-layer thickness and the chemical signal in the snow. In the area around two medium-deep ice-core drill sites the snow-layer thickness and snow chemistry have been analyzed in detail in order to study the spatial variability. One drill site, Camp Victoria, is located at Amundsenisen at 76°00’01"S, 8°03’03" W, approximately 550 km from the coast, at 2400 m a.s.l. (Fig. 1). The other drill site, Camp Maudheimvidda, is located at 73°06’19" S, 13°09’54" W, approximately 10 km from the Swedish station Wasa and some 140 km from the coast, at 360ma.s.l. (Fig. 1). The drilling, carried out using logistics provided by the Swedish Antarctic Research Programme (SWEDARP 1997/98), was a collaborative Scandinavian/ Dutch effort as a pre-site survey for the European Project for Ice Coring in Antarctica (EPICA).
Location map. The traverse route and the two drilling sites are marked.
This study focused on an attempt to detect irregularities in snow layering, and attention was therefore paid to pit analyses and detailed snow-radar soundings. Similar snow-pit studies have been performed over several decades in eastern Dronning Maud Land in the area around the two Japanese stations Syowa and Mizuho (NIPR, 1997). The aim of this paper is to highlight the relatively high rates of variability in snow layering at both coastal and inland Antarctic sites which impact on detailed analyses of firn and ice cores.
Methods and Analyses
One medium-deep ice core (133 m) was drilled at Camp Victoria, and two medium-deep ice cores (104 and 103 m) at Camp Maudheimvidda. At each site, shallow firn cores (10-20 m) were drilled and snow pits (0.5-2.5 m) were dug. The area around Camp Maudheimvidda and the route up to Camp Victoria were also investigated with detailed snow-radar soundings. Technical information about the drilling and snow-radar soundings is provided in the report from the SWEDARP 1997/98 expedition (Reference Holmlund, Stenberg, Karlöf, Nyman, Gjerde, Thomassen and Grön-lundHolmlund and others, 1999).
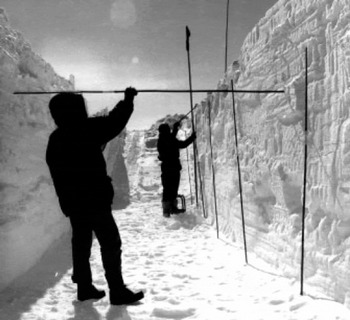
At Camp Victoria a large snow pit was dug about 50 m from the drill site. The pit, excavated by a vehicle, was 2.5 m deep and 16 m long in one direction, with a 6 m long perpendicular trench through the centre. Structures were mapped using optical surveying equipment and photographically documented (Fig. 2). Samples for chemical analyses (nine ions and oxygen isotopes) were collected at depth intervals of 4 cm along one profile (Y6). The sampling was done under clean-room conditions (Reference StenbergStenberg and others, 1998) with tools made of polyethylene. Double samples and blanks were collected in order to check any possible contamination. The snow samples were transported in a freezer at -20°C and melted immediately before the simultaneous analysis of Na+, NH4 +, K+, Mg2+, Ca2+, CI -, NO3, SO,2- and CH3SO3- on a Dionex ion-chromatography system at the Department of Meteorology Stockholm University. The samples were refrozen and transported to the Department of Geophysics, Copenhagen University Denmark, for oxygen-isotope (δO) analyses.
Mapping of snow layers in a snow pit at Camp Victoria, Amundsenisen.
Density and electrical conductivity measurements (ECMs; Reference HammerHammer, 1980) were made along three different profiles (Y6, X6 and X12) on the pit walls. The ECMs were made in situ directly on the snow-pit wall: a test since this is an unusual way of using the ECM equipment. The electrodes were dragged manually at a constant speed along the wall. The uncertainty in the depth scale is estimated to be ±10 cm since no depth-counter was connected to the ECM instrument. The ECM profde was always reproduced in a second run at each profile which gave confidence in this method of using the ECM as a mapping tool.
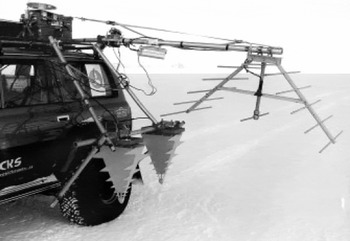
Snow layering was also investigated with a high-resolution radar system based on a Hewlett-Packard Network Analyzer (8753B and D). This is a continuous-wave step frequency radar, transmitting 201 evenly distributed frequencies. In these studies three different bandwidths were used: 1.5 GHz centred around 1.5 GHz penetrating 15 m of firn; 250 MHz centred around 900 MHz penetrating about 100 m; and 6 MHz centred around 160 MHz penetrating about 3000 m. Microwave measurements were performed using an output power of 1-4 W, while very high-frequency measurements were carried out using an output power of about 100 W. The radar was placed in aToyota Landcruiser with antennas and amplifiers mounted on metal frames outside the vehicle (Fig. 3) and operated by using a notebook computer from the front seat of the vehicle. Kinematic global positioning system (GPS) measurements were made along the radar profiles.
Antennae configuration on the Toyota Landcruiser for geophysical surveys. The antennas to the right were used for depth soundings (150-160 MHZ) and the two close to the vehicle were used for snow radar studies (500-2500 MHZ).

The snow-layer variability was analyzed in two different ways: by optical surveying of snow layers in the snow pit at a micro-scale, and by snow-radar soundings at a regional scale. Two of the most complete snow layers that were easy to follow on the snow-pit walls were chosen for calculations of the standard deviation of layer thickness: one layer close to the snow surface (about 50 cm depth), and the other close to the bottom of the snow pit (about 220 cm depth) (Fig. 4). Readings of the distance between the snow surface and the snow layer were made at 10 cm intervals along the 6 and the 16 m long walls. In the vicinity of the Camp Victoria drill site, a 12 km long snow-radar profile was selected. A well-defined snow layer at a relative depth of about 17 m was digitised and the snow-layer thickness was measured. The same procedure was used for a snow-radar profile from Maudheimvidda that started at Fossilryggen and extended 42 km towards the coast. From this profile a well-defined snow layer at a relative depth of about 15 m was selected.
Ice layers and crusts in the snow pit at Camp Victoria. The two layers marked with thicker lines were selected for the calculation of the standard deviation of snow-layer variability. Sampling and measuring positions are marked as ¥6, X6 and X12. ECMs and density measurements were made at each of these profiles, and snow for chemical analyses (ions and δ18O) was sampled at Y6.

Results and Discussion
In the large snow pit at camp Victoria it was possible to visualise snow-layer variability on a micro-scale. Thin (1-3 mm) ice lenses or crust layers, indicated by lines in Figure 4, marked boundaries between snow layers. The standard deviation of snow-layer thickness at a measurement spacing of 10 cm was 4.4 cm for the uppermost snow layer (about 50 cm depth) on the 16 m long wall and 3.9 cm for the lower snow layer (about 220 cm depth) at the same wall. For the 6 m long wall the standard deviation of snow-layer thickness was 3.3 cm for the uppermost snow layer and 3.9 cm for the lower snow layer. This gives an average variability in snow-layer thickness of 9% at a micro-scale.
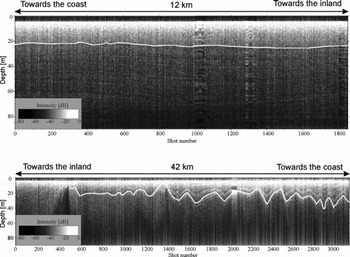
The standard deviation was also calculated from snow-radar profiles from two sites using a linear interpolation interval of 50 m (Reference Richardson and HolmlundRichardson and Holmlund, 1999). For the 12 km long snow layer on the polar plateau at a relative depth of about 17 m the standard deviation was 1.3 m, and for the 42 km long coastal snow layer at a relative depth of about 15 m it was 6.8 m (Fig. 5). This gives a variability in snow-layer thickness at a regional scale of 8% on the polar plateau and 45% in the coastal area.
Two snow-radar recordings selected for calculation of the standard deviation. The uppermost profile is from Amundsenisen where a snow layer at a relative depth of 17 m (the snow surface starts at 5 m) was followed over 12 km. The other layer, at an average relative depth of 15 m, is from Maudheimvidda and was followed over 42 km.
In radar recordings snow layers can easily be traced and followed along profiles. Convex areas of the surface are associated with wind abrasion and thus sastrugi. Such areas can easily be detected on radar recordings, as the layering record vanishes when approaching such an area and then reappears on the opposite side of the bulge. Such features can be traced at depth in two dimensions if there is a significant horizontal movement in the ice (Reference Holmlund, Richardson and OerterHolmlund and Richardson, 1994; Reference Richardson, Aarholt, Hamran, Holmlund and IsakssonRichardson and others, 1997).
In association with the 1997-98 pre-site survey for the coming EPICA deep drillings, careful mapping was executed, especially at the Maudheimvidda drill site (Reference Holmlund, Stenberg, Karlöf, Nyman, Gjerde, Thomassen and Grön-lundHolmlund and others, 1999). Subglacial bedrock obstacles are mirrored at the ice surface, and due to wind drift of snow they are also mirrored in the accumulation pattern. On the polar plateau, however, the influence of the bedrock on the ice surface is much less prominent, and variations in the pathways of katabatic winds are believed to be the general cause for irregularities in snow layering (Reference Richardson and HolmlundRichardson and Holmlund, 1999).
The depth profiles of nine ions and δ18O from the Y6 profile in the large snow pit are shown in Figure 6. A clear seasonal variability is found in ion concentrations and δ18O which suggests a preserved deposition record relatively undisturbed by wind redistribution. The seasonal signal is most distinct in the sulphate record. Assuming that each prominent sulphate peak indicates a summer, a preliminary dating was performed as indicated in Figure 6. This dating is supported by the nitrate record as well. An independent preliminary dating was performed based on the variations in the δ18O record, also indicated in Figure 6, which is in agreement with the dating based on the sulphate record. By counting the suggested years, the snow in the bottom of the 2.5 m deep snow pit is found to have been deposited in summer 1987-88. The dating by seasonal variability in the chemistry at this site and for this period of time gives an approximate accumulation rate of 7.5 cm w.e. a−1.
Records of oxygen isotopes (per mil) and all ions (μeq L-1) from the profile sampled on the snow-pit wall at r6. The records of oxygen isotopes and sulphate were used for dating

At about 120-140 cm depth there are two prominent peaks in the sulphate record corresponding to the summers of 1991-92 and 1992-93. The first peak corresponds to a peak in CH3SO3- (methanesulphonate (MSA)), which indicates a substantial marine biogenic contribution. During summer 1992-93 there are slightly increased levels of MSA, but also higher levels of sea salt (Na+, Cl, Mg2+, Ca2+). Two volcanoes erupted during summer 1991, Mount Pinatubo, Philippines, in June and Cerro Hudson, Chile, in August. Large amounts of volcanic gases were injected into the stratosphere and reached Antarctica in 1992. They are likely to have contributed to the enlarged concentrations in the sulphate record during this period of time.
ECMs were made along three profiles at different sites on the walls of the Camp Victoria snow pit, together with density measurements (Fig. 7). Double measurements showed that the signal was reproducible, but there was a lag in the depth scale due to difficulties in measuring manually at a constant speed. No prominent features corresponding to the peaks in the sulphate record were found in the EGM profiles. In situ EGM is not a well-established method and therefore not a reliable means of judging whether the sulphate peaks are of volcanic origin. There is a connection between the EGM and the density for each single profile, but no clear correlation between the different profiles was found, either in EGM or in density.
The results from ECMs made in situ on the snow-pit walls along profiles Y6, X6 and X12, plotted together with the density. Double ECMs were made at each profile.

Concluding Remarks
The sites studied in this project show significant variability in snow layering over short distances. Pseudo-variations in accumulation rates will inevitably be incorporated in ice-core interpretations. Adding the results from this study to data sampled on larger geographical areas (Reference Richardson and HolmlundRichardson and Holmlund, 1999) highlights this important problem. For the sites used in this study the variability in snow layering was significantly larger in the coastal zone than in the polar plateau. The variability of snow-layer thickness at the regional scale was only 8% on the polar plateau and 45 % in the coastal area. The variability of snow-layer thickness at the micro-scale in the 16 m X 6 m snow pit at camp Victoria on the polar plateau was on average 9%, which is comparable to the variability at the regional scale on this site. Detailed chemical measurements along one profile in the 16m X 6m snow pit showed clear seasonal signals in ion concentrations and oxygen isotopes, indicating that the deposition record is preserved and not heavily disturbed by redistribution of the snow by the wind. However, the EGM and density records from three different profiles in the same snow pit showed no clear correlation, indicating the problem of using a common depth scale for nearby measurements. This also applies at a micro-scale.
The radar soundings show irregularities in snow layering, and the rate of scattering may describe the environment in which the snow was once deposited. These observations show that there are significant error bars on high-resolution accumulation data received from firn and ice cores, especially from the coastal area, but averaging over tens of years reduces the error in accumulation estimates.
Acknowledgements
This work is a contribution to the "European Project for Ice Coring in Antarctica" (EPICA), a joint European Science Foundation/European Commission (EC) scientific programme, funded by the EC under Environment and Climate Programme (1994-98) contract ENV4-CT95-0074 and by national contributions from Belgium, Denmark, France, Germany, Italy, The Netherlands, Norway, Sweden, Switzerland and the U. K. We thank the Swedish Polar Research Secretariat for logistic support. We thank the other participants in the field for their help with drilling, sampling and field measurements, and the construction of snow pits and the ice laboratory. K. Gjerde provided the GPS measurements. N. Gundestrup at the Department of Geophysics, University of Copenhagen, kindly performed the analyses of stable-oxygen isotopes. C. Richardson and R. Pettersson at Stockholm University provided the snow-radar data, and R. Pettersson also supported processing of the digital figures. M. Nyman did the drawings of snow layers in the large snow pit. Financial support came from the Swedish Natural Science Research Council, Stockholm University, and grants from Lillemor och Hans Wson Ahlmanns fond for geografisk forskning. Technical equipment was kindly lent to us from Hewlett-Packard AB and Geotronics AB.