


Introduction
The COVID-19 pandemic, with its medical, social, economic, and cultural consequences, probably represents the most critical and complex global event of the recent history and this highly stressful situation has been stretching for more than 1 year to date [Reference Fiorillo and Gorwood1]. This worldwide emergency, in fact, may imply exposure to a wide sort of stressful or traumatic events, such as social isolation, being quarantined or infected, loss of a loved-one, economic difficulties, or, more often, to a combination thereof [Reference Holmes, O’Connor, Perry, Tracey, Wessely and Arseneault2,Reference Giallonardo, Sampogna, Del Vecchio, Luciano, Albert and Carmassi3]. Literature suggests the key role of individual vulnerability for the development of mental health consequences to the event “pandemic,” and the role of previous mental illness has been especially stressed [Reference Pfefferbaum and North4–Reference Stewart and Appelbaum7]. However, despite a growing interest in this topic [Reference Holmes, O’Connor, Perry, Tracey, Wessely and Arseneault2,Reference McCracken, Badinlou, Buhrman and Brocki8–Reference Gorwood and Fiorillo12], the impact on the clinical course of psychiatric disorders, is still largely unexplored with scarce longitudinal clinical data. Furthermore, just a few studies were conducted on clinical samples [Reference Yocum, Zhai, McInnis and Han13–Reference Carta, Ouali, Perra, Ben Cheikh Ahmed, Boe and Aissa17], while other data come by subgroup analysis in the framework of online surveys with a cross-sectional design [Reference García-Álvarez, de la Fuente-Tomás, García-Portilla, Sáiz, Lacasa and Dal Santo18,Reference Van Rheenen, Meyer, Neill, Phillipou, Tan and Toh19], which are burdened by several methodological limitations [Reference Holman, Thompson, Garfin and Silver20].
However, these studies suggest that individuals with psychiatric disorders may be more vulnerable to develop depressive, anxiety as well as post-traumatic stress symptoms [Reference Hao, Tan, Jiang, Zhang, Zhao and Zou14–Reference Van Rheenen, Meyer, Neill, Phillipou, Tan and Toh19,Reference Kuzman, Curkovic and Wasserman21,Reference Thome, Coogan, Simon, Fischer, Tucha and Faltraco22], and there are well-grounded concerns that subjects suffering from bipolar disorder (BD) may be among the most vulnerable ones [Reference Lex, Bäzner and Meyer23–Reference De Hert, Mazereel, Detraux and Van Assche25]. In the pandemic frame, subjects with BD may be at the crossroads of a range of individual risk factors, adverse environmental conditions and drastic changes in psychiatric assistance that may jeopardize treatment’s continuity and adherence to pharmacological therapy [Reference Stefana, Youngstrom, Chen, Hinshaw, Maxwell and Michalak26,Reference Vieta, Pérez and Arango27].
Moreover, negative life events can trigger or exacerbate mood episodes [Reference Maguire, McCusker, Meenagh, Mulholland and Shannon28], and the Sars-CoV2 infection itself could lead to the development of a mood disorder and suicide behaviors [Reference Lu, Wei, Jiang, Wu, Sheng and Zhou29–Reference Gillett and Jordan31]. In this frame, the confinement-related mood lowering, that is rather common also in general population [Reference McCracken, Badinlou, Buhrman and Brocki8,Reference Fiorillo, Sampogna, Giallonardo, Del Vecchio, Luciano and Albert9,Reference Rajkumar32], could trigger depressive symptoms relapse, while some features of expansive mood phases, such as impulsivity and impaired judgment, may lead to risk-taking behaviors increasing the risk of COVID-19 infection [Reference Xue, Husain, Ortiz, Husain, Daskalakis and Mulsant33]. Moreover, the course of BD is deeply influenced by circadian rhythm regulation [Reference Gonzalez34,Reference Palagini, Carmassi, Conversano, Gesi, Bazzichi, Giacomelli and Dell’Osso35], which can be threatened by social isolation or home working [Reference Carta, Ouali, Perra, Ben Cheikh Ahmed, Boe and Aissa17,Reference Rajkumar32]. Finally, depression and anxiety symptoms can frequently develop along with post-traumatic stress disorder (PTSD) ones, further increasing the psychopathological burden [Reference Shalev, Freedman, Peri, Brandes, Sahar and Orr36–Reference Barbano, van der Mei, deRoon-Cassini, Grauer, Lowe and Matsuoka38]. As to this issue, the high comorbidity rate between BD and PTSD, as well as the detrimental prognostic significance of this co-occurrence, are widely acknowledged [Reference Otto, Perlman, Wernicke, Reese, Bauer and Pollack39,Reference Cerimele, Bauer, Fortney and Bauer40].
The interplay among enhanced trauma sensitivity, the persisting trauma exposure, and the intrinsic heterogeneity of longitudinal psychopathological trajectories after a traumatic event [Reference Santiago, Ursano, Gray, Pynoos, Spiegel and Lewis-Fernandez41,Reference Bryant, Nickerson, Creamer, O’Donnell, Forbes and Galatzer-Levy42], makes the scenario highly complex. Indeed, previous studies have been demonstrating how post-traumatic stress symptoms evolve dynamically over time, depicting trajectories of delayed onset, recovery or resilience, or hesitating in a chronic course [Reference Bryant, Nickerson, Creamer, O’Donnell, Forbes and Galatzer-Levy42–Reference Dickstein, Suvak, Litz and Adler45]. Accordingly, the assessment of the COVID-19 pandemic impact on subjects with BD may be particularly challenging due to the prolonged duration and variability of the traumatic exposure, to the underlying episodic course of BD and to the interplay between post-traumatic stress, anxious and depressive symptoms that may overlap or influence each other [Reference Ginzburg, Ein-Dor and Solomon37,Reference Barbano, van der Mei, deRoon-Cassini, Grauer, Lowe and Matsuoka38,Reference Hernandez, Cordova, Ruzek, Reiser, Gwizdowski and Suppes46–Reference Pfefferbaum and North4Reference Fiorillo, Sampogna, Giallonardo, Del Vecchio, Luciano and Albert9]. These factors clearly indicate the importance of performing longitudinal studies in which PTSD, depression or anxiety symptoms are jointly analyzed to identify predictive factors of aversive mental health consequences of traumatic events.
In light of these premises, aim of the present study was to examine prospectively the development and trajectories of post-traumatic stress, depressive and anxiety symptoms in a sample of subjects with BD that were followed in an outpatient psychiatric clinic, over a 6-month follow-up starting from the first national lockdown in Italy [Reference Carmassi, Bertelloni, Dell’Oste, Barberi, Maglio and Buccianelli50]. Particular attention was devoted to the possible clustering of these symptoms in defining clinical subtypes at differential risk for worse outcomes. A further aim of the present study was to examine the sociodemographic and clinical factors associated with the different trajectories.
Materials and Methods
Study sample
The study included a sample of 100 subjects with a DSM-5 diagnosis of BD consecutively enrolled at the psychiatric outpatient service of the Azienda Ospedaliera Universitaria Pisana (AOUP, Pisa, Italy) when they were admitted to a telepsychiatry service, set-up during the acute phase of the COVID-19 pandemic. This specific service was introduced from March 1, 2020 to carry on the healthcare services for subjects suffering from BD, during the first COVID-related national lockdown phase, in which all outpatient facilities had been suspended according to the national norms adopted for the pandemic emergency. Researchers excluded from the telepsychiatric service the subjects with a current clinical diagnosis of Alcohol or Substance Use Disorder or Neurocognitive Disorder according to DSM-5 criteria. From an initial sample of 122 subjects assessed for eligibility in the telepsychiatry services, 6 subjects were excluded because affected by Alcohol or Substance Use Disorder, and 2 because affected by Neurocognitive Disorder. Finally, 14 subjects enrolled in the telepsychiatry service refused to participate to the study. The study assessments were conducted at three time points, namely T0, T1, and T2. The enrollment period and the first assessment (T0), occurred from April 1 to 30, 2020, during the first wave of the COVID-19 pandemic and the national lockdown in Italy; it was conducted in the framework of the telepsychiatry visit as showed elsewhere [Reference Carmassi, Bertelloni, Dell’Oste, Barberi, Maglio and Buccianelli50]. The second time point (T1) was from June 1 to 30, 2020 (after 2 months from T0), during the following “reopening” phase of the COVID-19 emergency in Italy. The third time point (T2) was from October 1 to 31, 2020 (after 6 months from T0), at the beginning of the “second wave” of the pandemic in Italy. Hence, the study period was from April 1 to October 31, 2020. The T1 and T2 assessments were performed in the framework of a psychiatric visit. The percentage of dropout in participants between the three time points was 11%. Therefore, the final sample for the present study includes 89 subjects. During the study period, the sample presented a good adherence to a naturalistic treatment program.
A written informed consent was subjected to all eligible participants after receiving a detailed description of the study, with the opportunity to ask questions. The study was conducted in accordance with the Declaration of Helsinki and approved by the Ethics Committee of Area Vasta Nord-Ovest Toscana (Italy).
Instruments and assessments
Psychiatrists with clinical expertise in mood disorders performed clinical interviews and rating. Sociodemographic and clinical data were registered with a specific datasheet reporting information on the COVID-19 pandemic. The structured Clinical Interview for the Disorders of the DSM-5 (SCID-5) [Reference First, Williams, Karg and Spitzer51] was utilized to determine the diagnosis of BD and to assess psychiatric comorbidity. At T0 participants were also investigated by means of: Impact of Event Scale-Revised (IES-R) [Reference Weiss, Marmar, Wilson and Keane52] to investigate PTSD symptoms; Generalize Anxiety Disorder 7-Item (GAD-7) [Reference Spitzer, Kroenke, Williams and Löwe53] to evaluate anxiety symptoms; Patient Health Questionnaire-9 (PHQ-9) [Reference Spitzer, Kroenke and Williams54] to examine depressive symptoms; and Young Mania rating Scale (YMRS) [Reference Young, Biggs, Ziegler and Meyer55] to examine manic symptoms. At T1 and T2, the IES-R, GAD-7, and PHQ-9 were administered again.
The IES-R is a 22-item scale measuring three core phenomena of PTSD: reexperiencing of traumatic events, avoidance, and hyperarousal. It refers to the last week. The IES-R total score is calculated adding the score of each item. According with the aim of the study, the items referred to the traumatic events that the subjects had experienced in the framework of the COVID-19 pandemic.
The GAD-7 is a self-assessment questionnaire used as a tool for screening and measuring the severity of anxious symptoms [Reference Vieta, Pérez and Arango27]. Particularly, it investigates the frequency of anxious symptoms in the last 2 weeks using seven items with a score ranging from 0 (never) to 3 (almost every day).
The PHQ-9 represents one of the most used self-assessment tools for the screening of depressive symptoms [Reference Maguire, McCusker, Meenagh, Mulholland and Shannon28]. It consists of nine items that investigate the presence of depressive symptoms in the last 2 weeks, each evaluated on a scale from 0 (never) to 3 (almost every day).
The YMRS is the most widely clinician administered scale used for the assessment of the severity of manic symptoms. The scale is composed by 11-items: four items are graded on a 0–8 scale, while seven items are graded on a 0–4 scale. The score for each item is summed to obtain the YMRS total score.
Statistical analyses
Continuous variables were reported as mean ± standard deviation (SD), whereas categorical variables were reported as percentages. All tests were two-tailed and a p value < 0.05 was considered statistically significant. Kolmogorov–Smirnov and Shapiro–Wilk tests were computed to determine the normally distribution of the IES-R, GAD-7, and PHQ-9 scores.
We used a K-means cluster analysis based on the standardized IES-R, GAD-7, and PHQ-9 scores reported at T0, T1, and T2, to identify the peculiar trajectories of post-traumatic stress, anxiety, and depressive symptoms during the three time points. We used squared Euclidean Distance for the divergence measure between cases. To classify cases, the method of iterative updating of clustered centroids was chosen, with the new clusters centers to be calculated after all cases are assigned to a given cluster. To ensure maximum efficiency the final cluster centers estimated from a random sample were utilized as initial centers to classify the entire file. To assess the stability of a given solution, we compared results on data sorted in different ways. After comparing the results obtained for different K values, we identified as the most satisfactory solution the one that involves three clusters (K = 3). This solution ensured the minimum number of iterations before convergence criterion 0 was satisfied. Furthermore, it determined a small within-cluster variability compared to the difference between clusters, and the cluster sizes greater than 10% of the total sample size. We also calculated the power related to the dispersion analysis included in the cluster analysis.
Chi-square was computed to evaluate differences in categorical variables among the three groups. One-way ANOVA was utilized to compare continues normally distributed variables among the three groups, while Kruskal–Wallis test was utilized for the nonparametric ones. Finally, Friedman test was computed to compare IES-R, GAD-7, and PHQ-9 scores among the T0, T1, and T2 in the total sample and in each group.
All statistical analyses were performed using the Statistical Package for Social Science, version 26.0 (SPSS Inc.). Power analyses were calculated by means of PASS 2008, 08.0.8 version.
Results
The sample included 34 (38.2%) males and 55 females (61.8%) at baseline. The mean age was 47.15 ± 16.12 (min 19, max 80) years. A total of 61 presented a BD-II (70.1%), and 36 (40.4%) individuals reported a comorbid disorder: 19 (21.3%) an anxiety disorder, 17 (19.1%) an obsessive–compulsive disorder, and 4 (4.5%) a feeding and eating disorder. Concerning the COVID-19 pandemic at the baseline evaluation, 28 subjects (31.5%) reported to be at risk for medical complications in the case of COVID-19 infection because of a chronic medical condition (e.g., diabetes mellitus or cardiovascular and respiratory diseases), only 1 (1.8%) was positive to COVID-19, and 28 (31.5%) referred occupational and economic difficulties (job loss, significantly lower earning, or financial losses) due to the lockdown. Furthermore, 29 individuals (32.6%) had a close one at risk for medical complications in the case of COVID-19 infection, 6 (6.7%) a relative infected by COVID-19 and 3 (3.4%) a loss of a relative or a close one by the COVID-19.
Cluster analysis
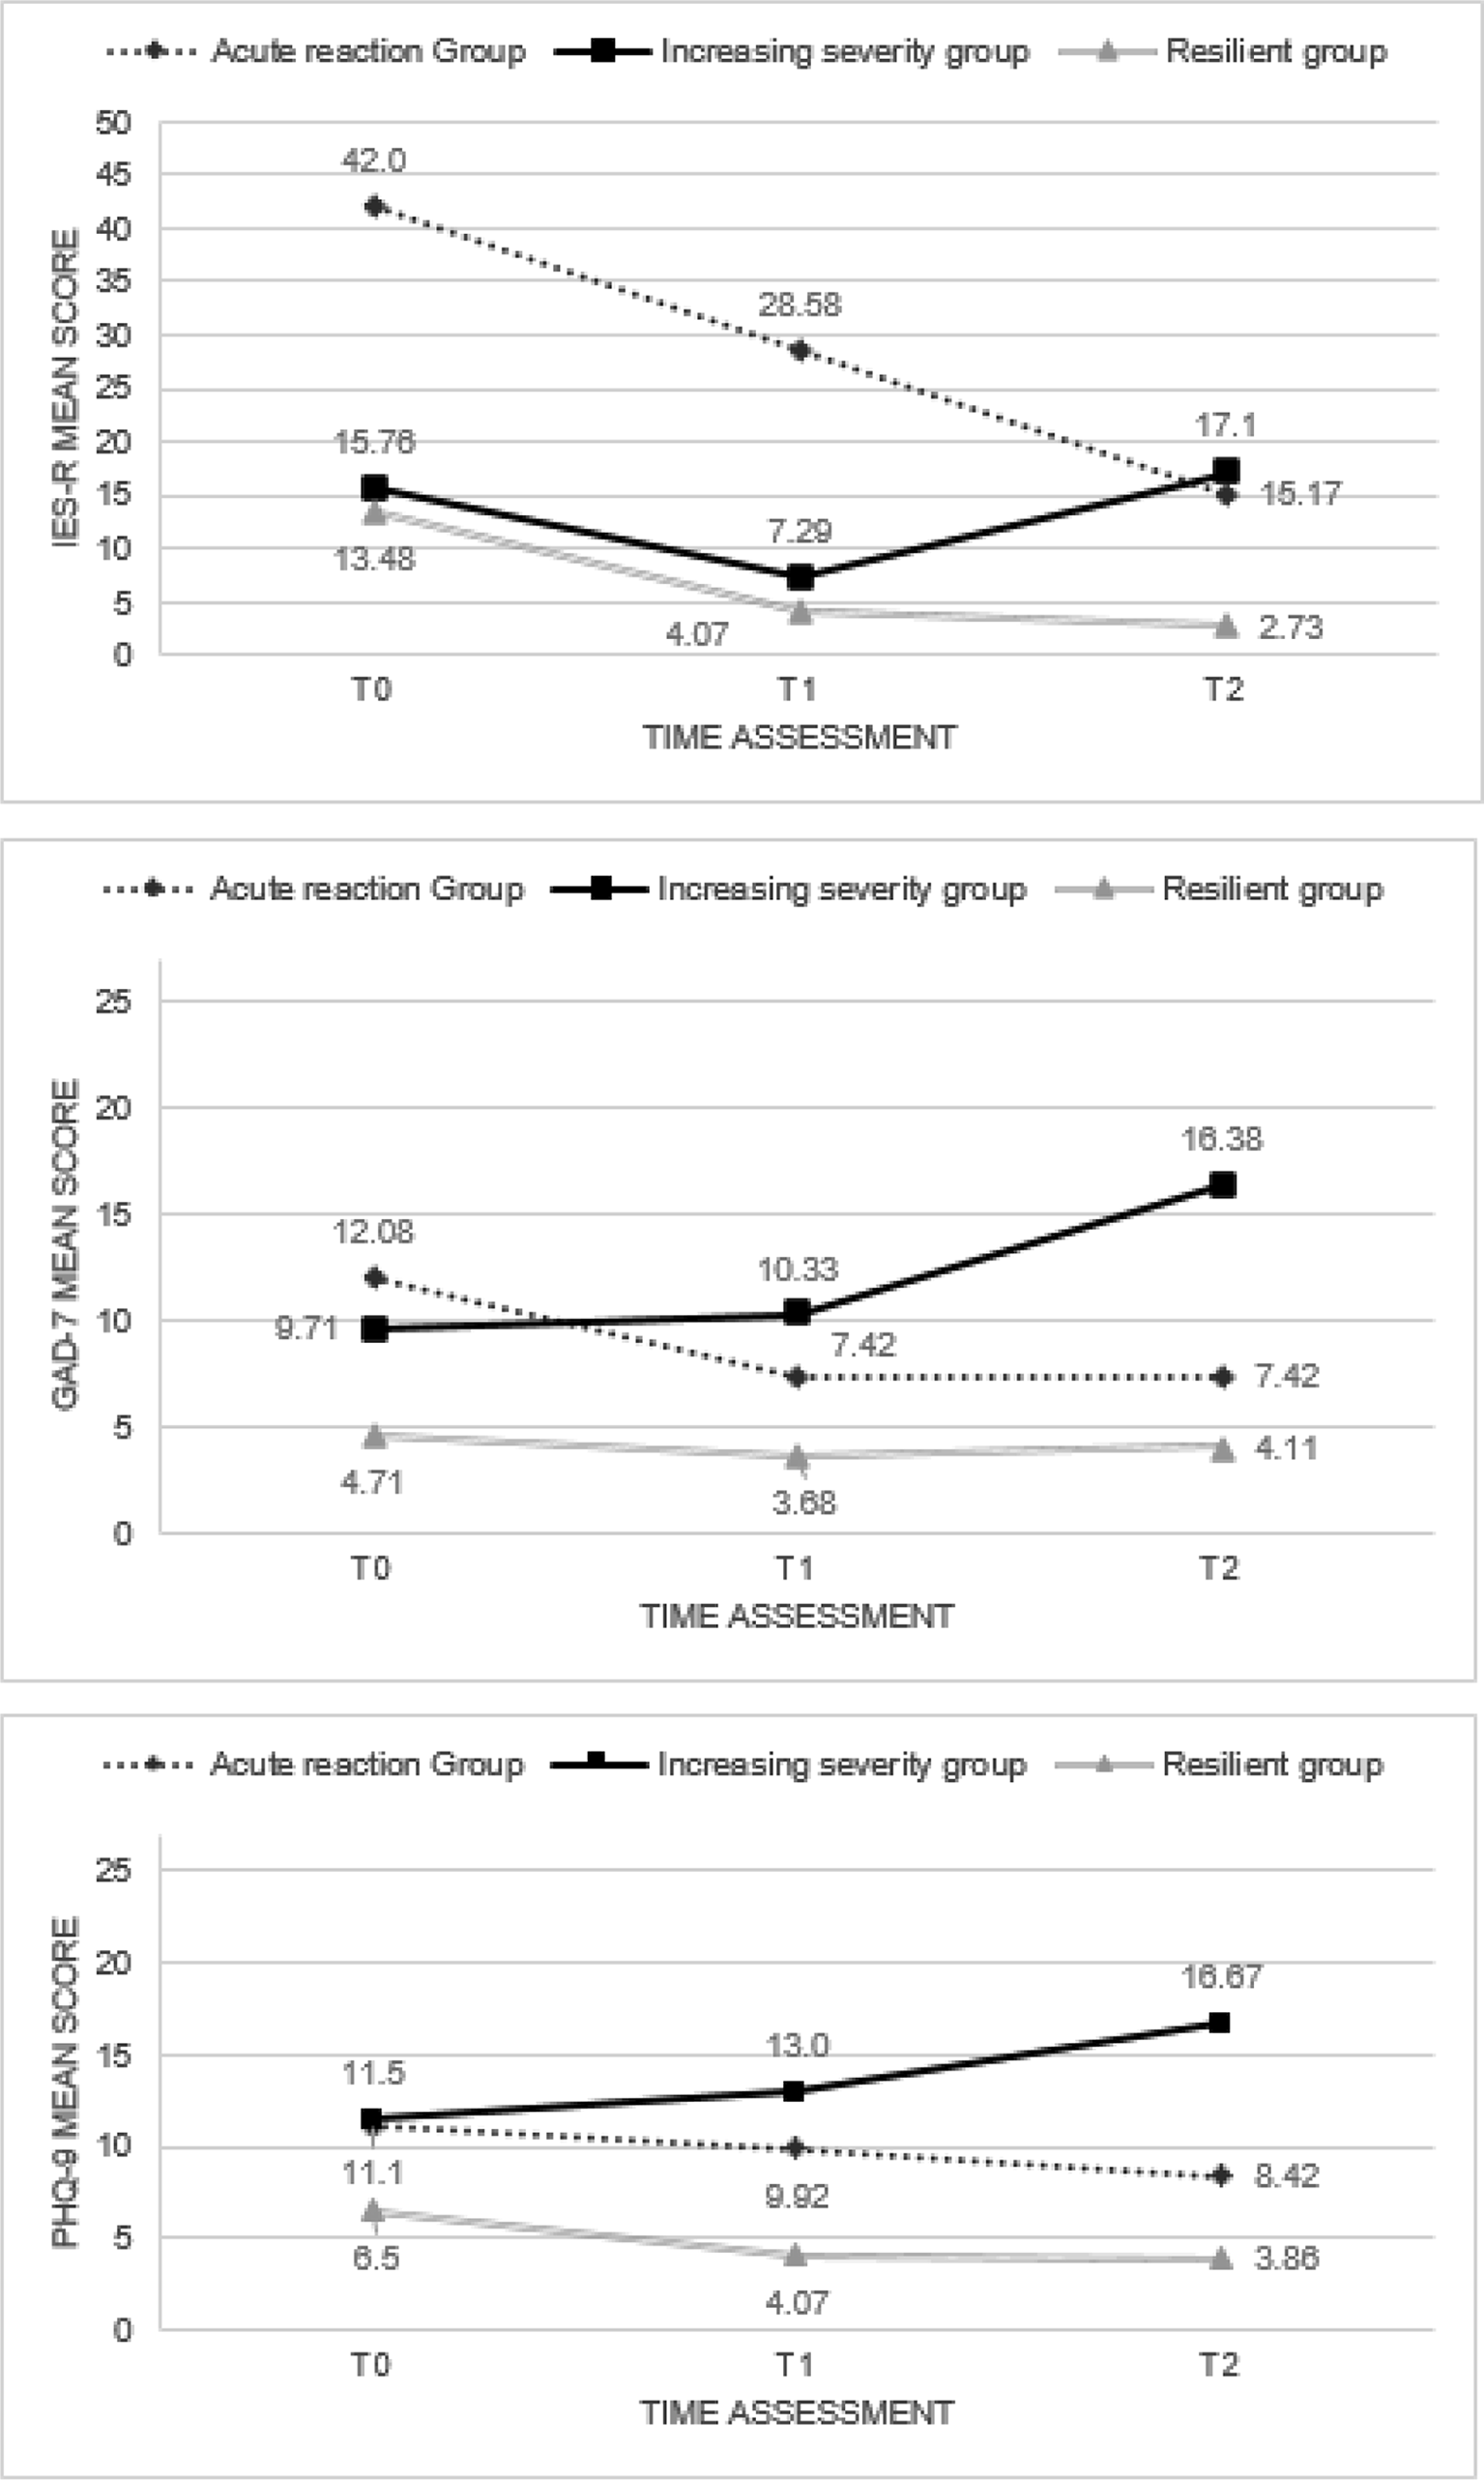
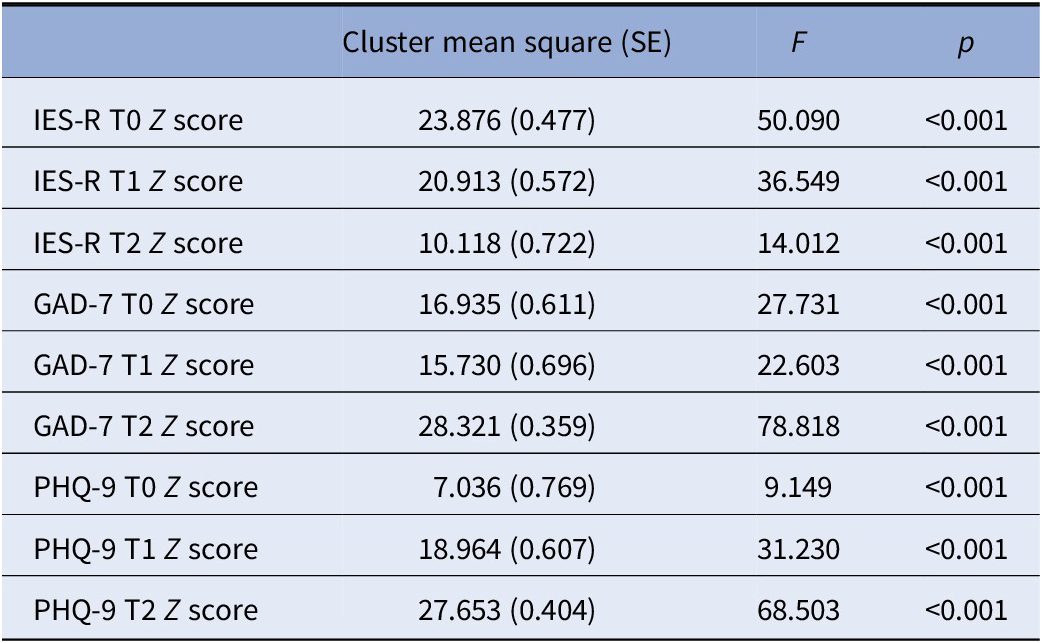
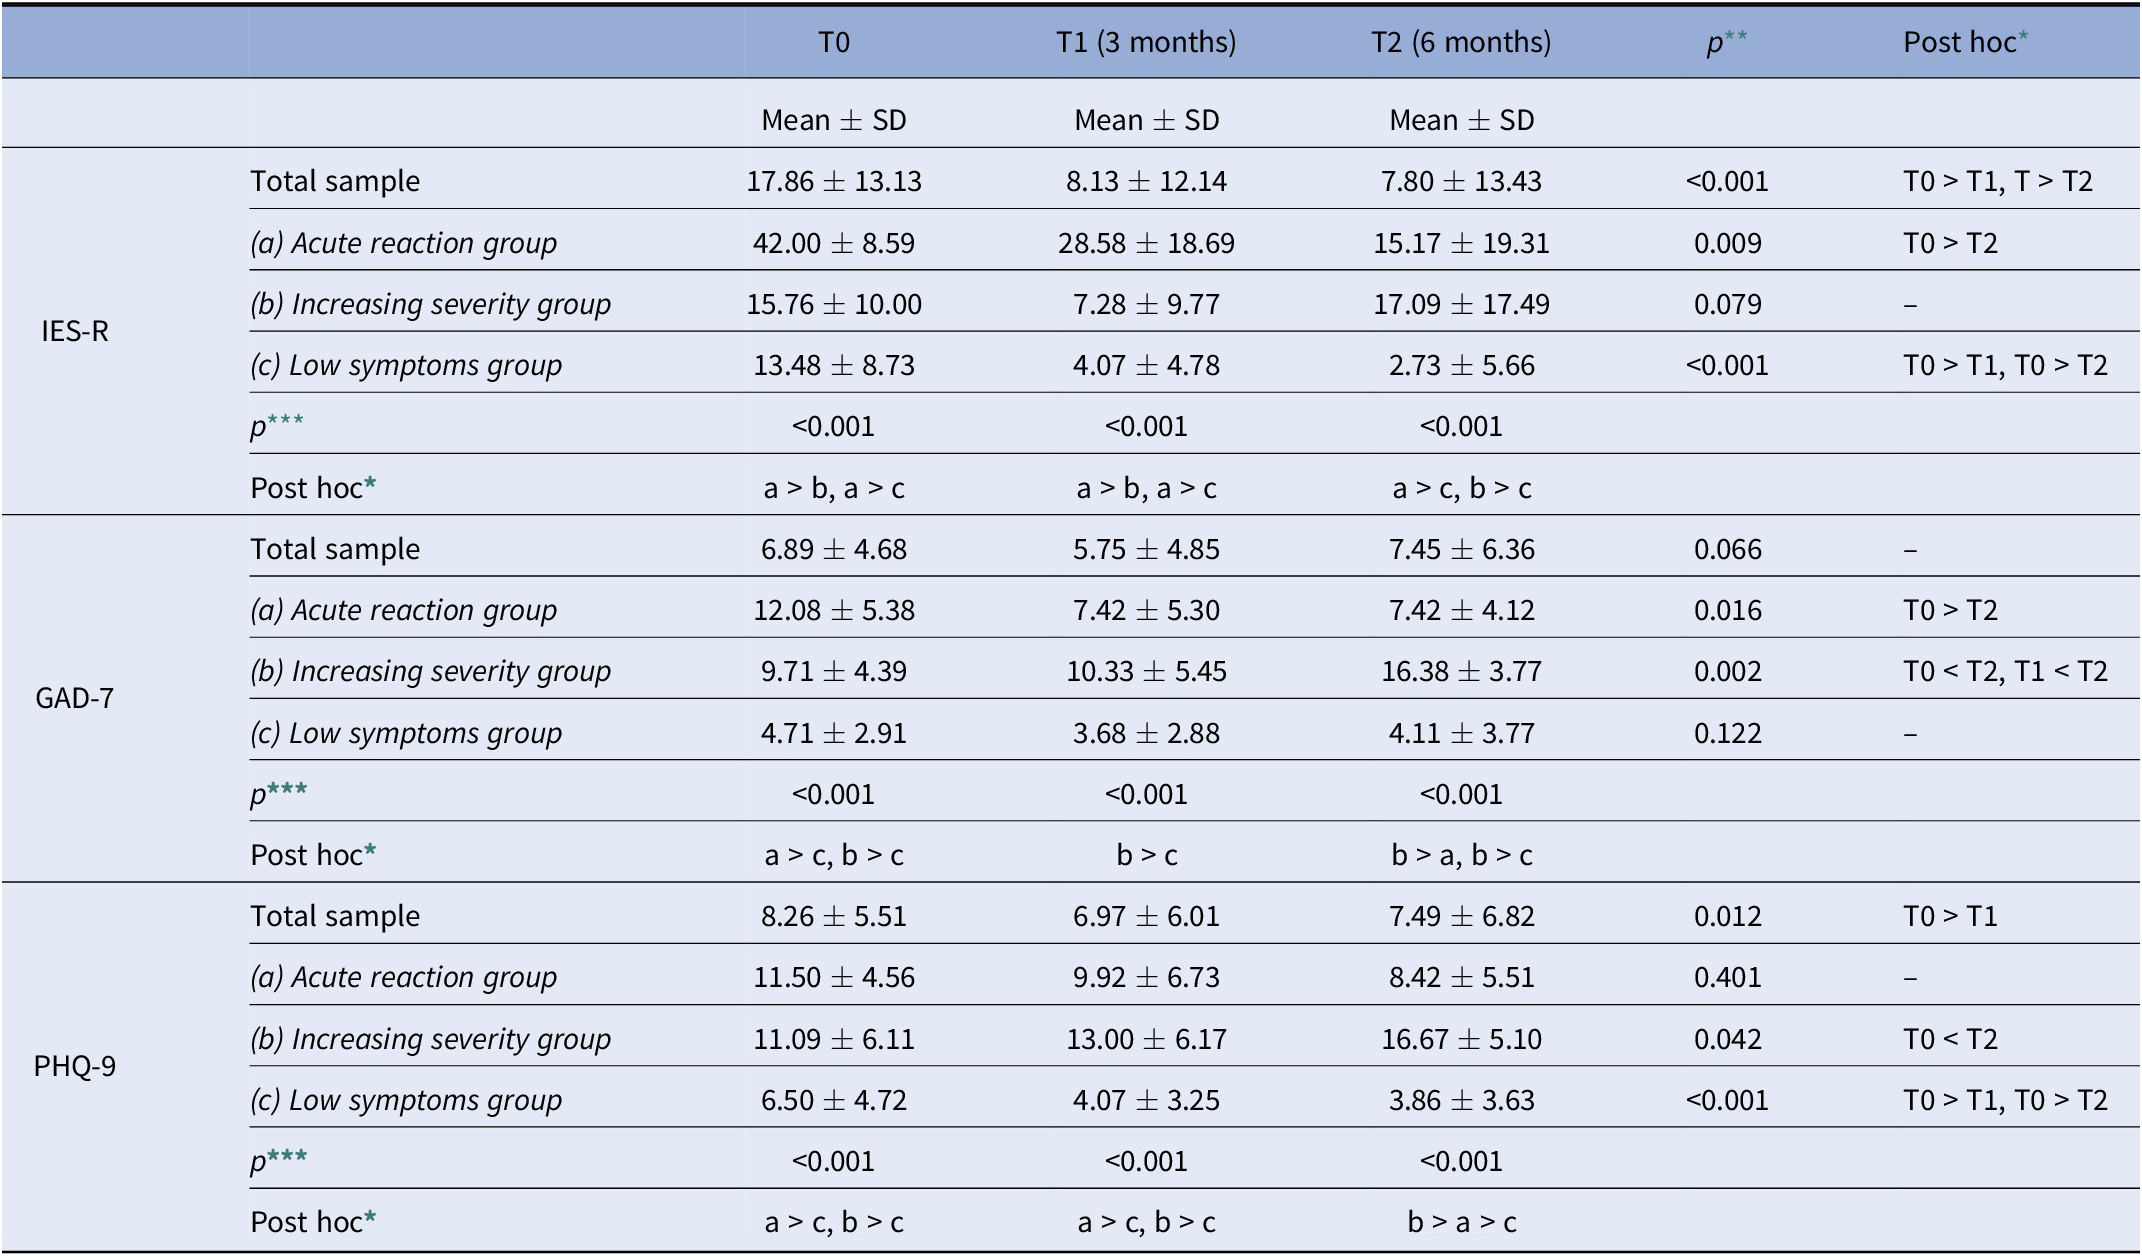
As initial clusters, we used the final centers estimated by a preliminary application of a K-means cluster analysis on a random sample of 50 subjects, to reduce the distance calculations and to select a good set of initial clusters. The second K-means cluster analysis applied to the entire data file met criterion 0 of convergence at the fifth iteration. We defined the three groups of subjects determined by the second K-means cluster analysis the Acute reaction group (N = 12, 13.5%), the Increasing severity group (N = 21, 23.6%) and the Low symptoms group (N = 56, 62.9%), respectively. Table 1 shows the initial cluster centers, the iteration history, the final cluster centers and the distances between the final cluster centers in the three groups, while in Figure 1 were reported the mean scores of IES-R, GAD-7, and PHQ-9 of the three groups at the three time points. The average distance of cases from their classification cluster center was 2.08 ± 0.82. Finally, in the dispersion analysis the GAD-7 and the PHQ-9 scores at T2 presented the greatest influence in forming the clusters, while the PHQ-9 score at T0 had the least influence (see Table 2). The power associated to ANOVAs in Table 2 appeared excellent (94.21–100%).
K-means cluster analysis features.
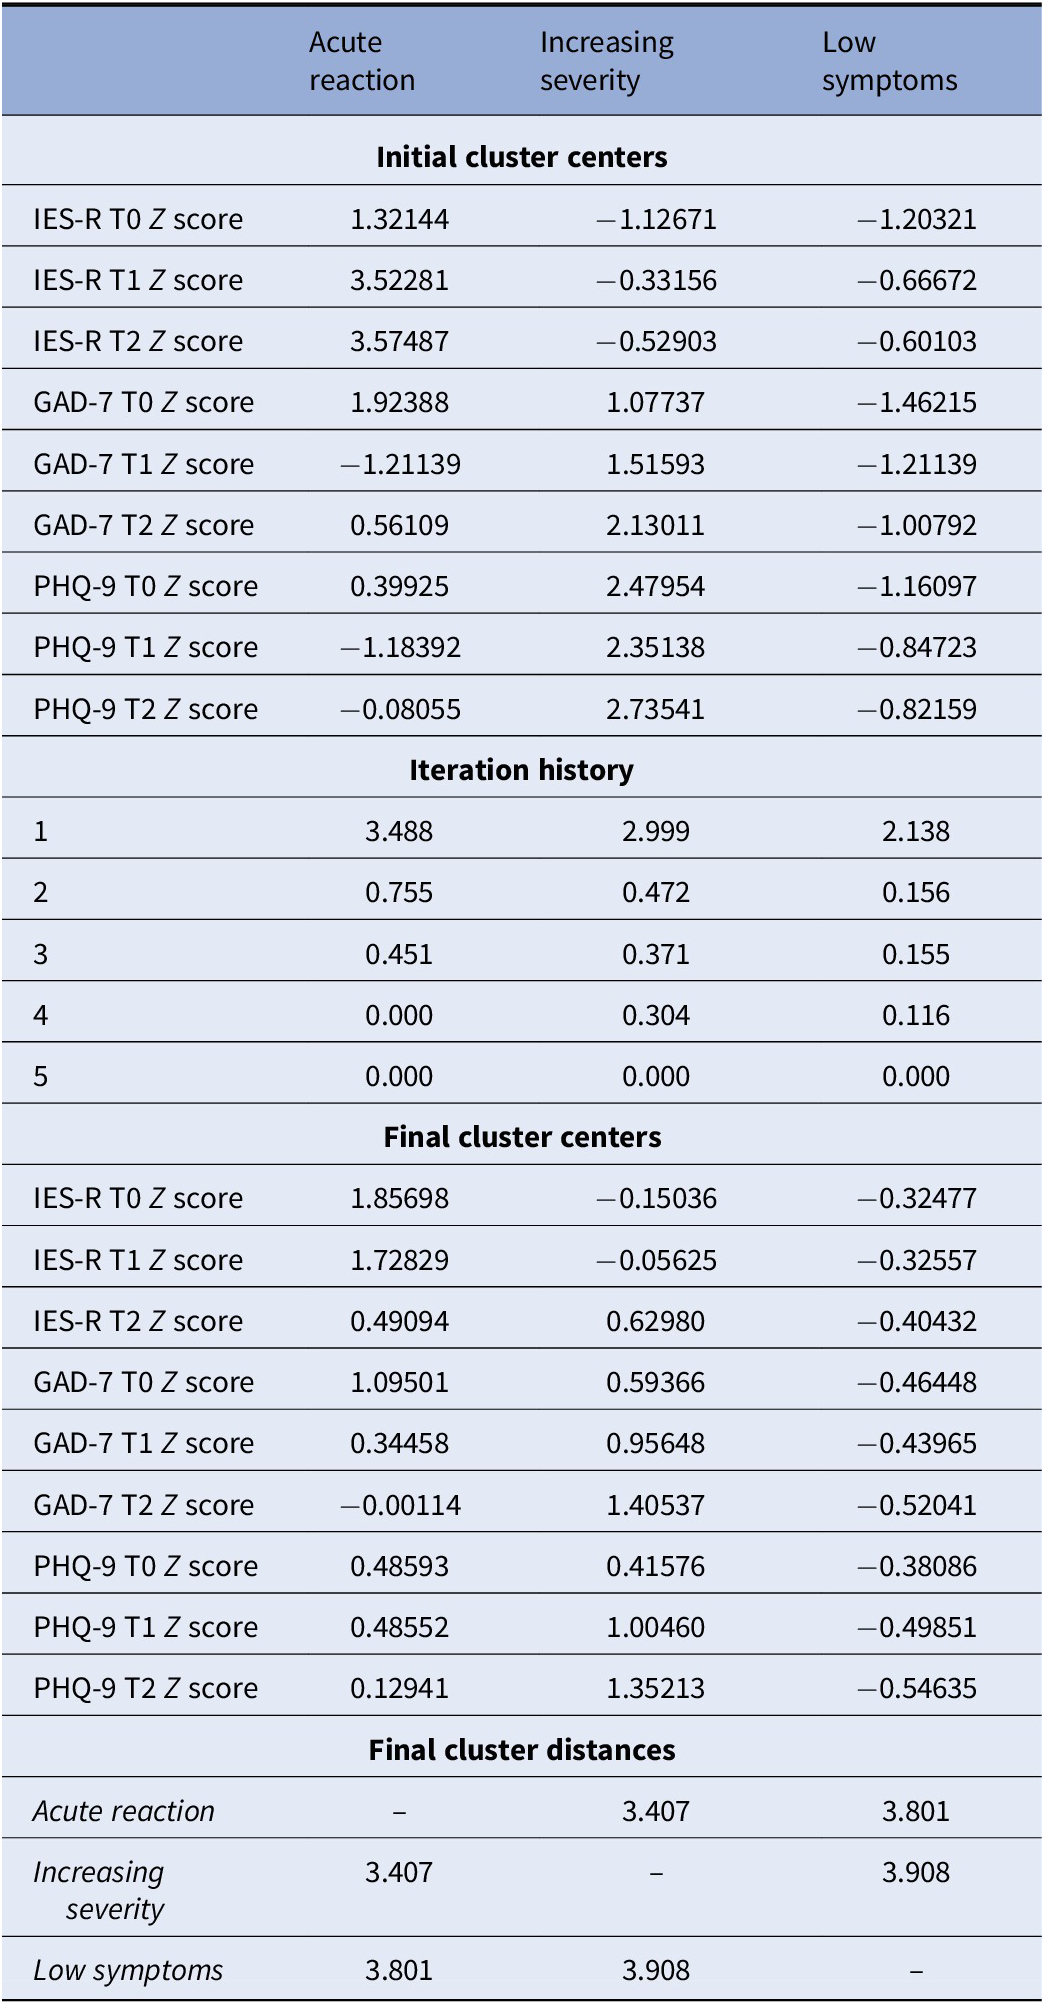
Note: Initial cluster centers, iteration history, final cluster centers, and distances between the final cluster centers in the Acute reaction (N = 12), Increasing severity (N = 21), and Low symptoms (N = 56) groups.
IES-R, GAD-7, and PHQ-9 mean scores among T0, T1, and T2 in the Acute reaction (N = 12), Increasing severity (N = 21), and Low symptoms (N = 56) groups.
K-means cluster analysis features.
Note: Dispersion analysis.
Sociodemographic and clinical characteristics comparison between the three groups
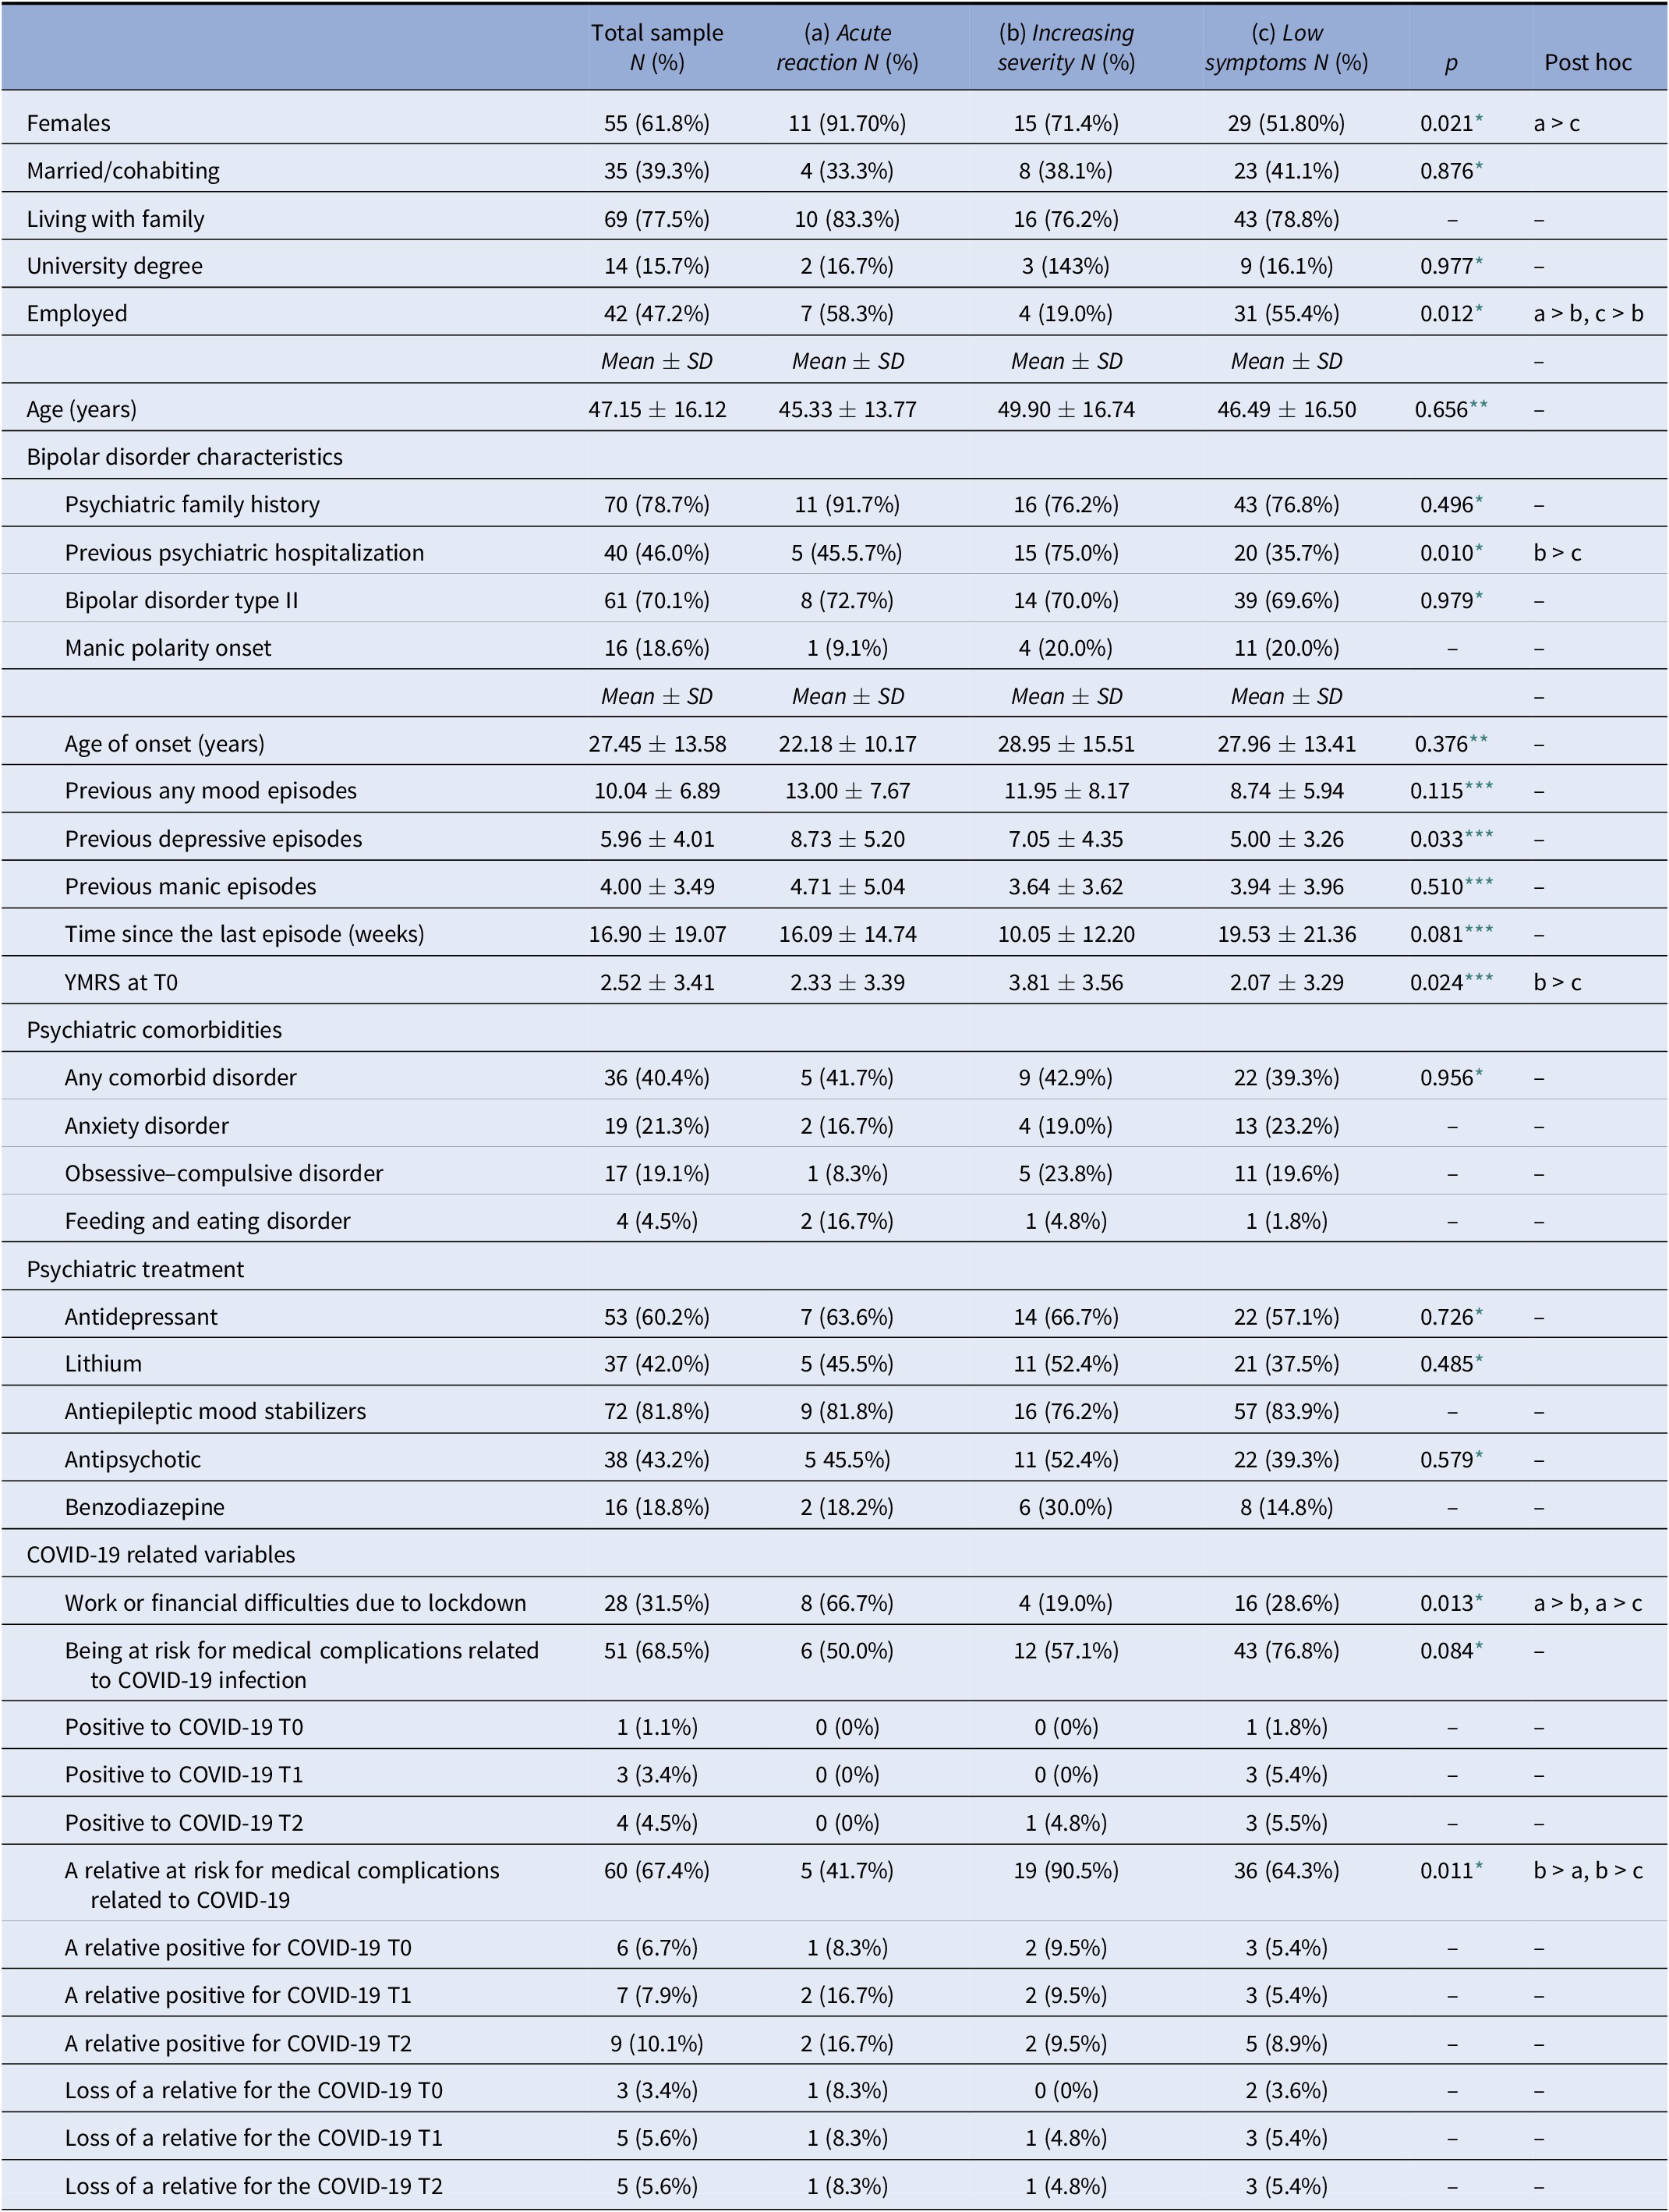
Significant differences emerged in the following characteristics between the three groups. The Acute reaction group presented more females than the Low symptoms one. The Increasing severity group reported less employed subjects and more subjects with a relative at risk for COVID-19 medical complications than the other two groups, besides more subjects with a history of hospitalization than the Low symptoms group. Finally, the YMRS score was higher in the Increasing severity group with respect to the Low symptoms one (Table 3).
Sociodemographic, clinical, and COVID-19 characteristics in the total sample (N = 89) and in the Acute reaction (N = 12), Increasing severity (N = 21), and Low symptoms (N = 56) groups.
* Referred to a chi-square test.
** Referred to a ANOVA test.
*** Referred to a Kruskal–Wallis test.
IES-R, GAD-7, and PHQ-9 comparison between the three groups
At T0, the Acute reaction group presented higher IES-R score than the other two groups, and the Acute reaction and the increasing severity groups presented higher scores in the GAD-7 and PHQ-9 than the Low symptoms group. At the T1 assessment the Acute reaction group presented higher IES-R score than the other two groups; the Acute reaction and the Increasing severity groups presented higher scores in the PHQ-9; the Increasing severity group presented higher score in the GAD-7 than the Low symptoms one. Finally, at the T2 assessment, the Acute reaction and the Increasing severity groups presented higher scores in the IES-R than the Low symptoms group; the Increasing severity group presented higher GAD-7 and PHQ-9 scores than the Acute reaction and Low symptoms ones; the Acute reaction group presented higher PHQ-9 score than the Low symptoms one (Table 4).
Comparison of IES-R, GAD-7, and PHQ-9, scores among T0, T1, and T2 in the total sample (N = 89) and in the Acute reaction (N = 12), Increasing severity (N = 21), and Low symptoms (N = 56) groups.
* p < 0.05 in post hoc pair-wise comparison adjusted for Bonferroni inequalities.
** Related to a Friedman test.
*** Related to a Kruskal–Wallis test.
IES-R, GAD-7, and PHQ-9 comparison between the three time assessments
In the Acute reaction group, the IES-R and the GAD-7 scores were higher at the T0 than at the T2. In the Increasing severity group, the GAD-7 score at the T2 was higher than the T0 and T1 assessments, while the PHQ-9 score was higher at the T2 with respect to the T0. Finally, the Low symptoms group presented higher IES-R and PHQ-9 scores at the T0 than the T1 and the T2 (Table 4).
Discussion
To the best of our knowledge, this is the first study that prospectively examined the development and trajectories of post-traumatic stress, depressive, and anxiety symptoms among subjects with BD that were followed in an outpatient psychiatric unit at the time of pandemic onset. The results allowed us to detect different clusters based on depressive, anxiety, and post-traumatic stress symptoms trajectories, over a 6-month follow-up period, starting from the first national lockdown. Three clusters emerged: the Low symptoms group, including about two third of the sample, who showed limited psychopathological reactions to the event “pandemic”; the Increasing severity group, including about 23% of subjects who reported considerable symptoms that worsen over time; and the Acute reaction group, including about 10% of subjects, that showed a relevant acute reaction followed by a rapid improvement. As to specific features of the different clusters, female gender, work, and financial difficulties and a greater number of previous depressive episodes were mostly found in the Acute reaction group, while the presence of relatives or close ones at risk for COVID-19 related medical complications, resulted most strongly associated to the Increasing severity trajectory, along with low employment rate, previous psychiatric hospitalization, and manic symptoms at baseline.
Our results show considerable, although widely ranging, rates of depressive, anxiety, and post-traumatic stress symptoms in subjects BD during the first 6 months of the COVID-19 pandemic. Available data on this issue are far from being univocal. Indeed, while some studies suggest a good resilience level in clinical samples of subjects suffering from BD [Reference Tundo, Betro’ and Necci16], other ones report a greater psychological burden with respect to healthy controls [Reference Yocum, Zhai, McInnis and Han13,Reference Van Rheenen, Meyer, Neill, Phillipou, Tan and Toh19]. Previous studies show that life events, as well as traumatic exposure, may play a major role in BD course [Reference Lex, Bäzner and Meyer23,Reference Aldinger and Schulze56,Reference Dell’Osso, Carmassi, Carlini, Rucci, Torri and Cesari57]. Remarkably, subjects with BD are at risk of developing psychopatological reactions even after indirect exposure to traumatic event [Reference Hernandez, Cordova, Ruzek, Reiser, Gwizdowski and Suppes46,Reference Pollack, Simon, Fagiolini, Pitman, McNally and Nierenberg58]. Accordingly, Pollack et al. [Reference Pollack, Simon, Fagiolini, Pitman, McNally and Nierenberg58] previously reported a marked increase in distress among subjects with BD exposed to September 11 events through media. In this regard, despite subjects we enrolled belongs to a relatively low-incidence infection area, they have been extensively exposed to indirect consequences of the pandemic, such as fear of contagion, social isolation, financial constraints, and abrupt routine changes. Consistently, a previous study on BD subjects during the Italian national lockdown showed clinically significant PTSD symptoms in 17% of the sample [Reference Carmassi, Bertelloni, Dell’Oste, Barberi, Maglio and Buccianelli50].
As mentioned above, the cluster analysis outlines three different clusters, namely Low symptoms, Increasing severity, and Acute reaction groups. Previous longitudinal studies on PTSD symptoms showed similar patterns [Reference van der Wal, Vermetten and Elbert44,Reference Bonanno and Mancini59–Reference Porter, Bonanno, Frasco, Dursa and Boyko61]. Data from long-term longitudinal studies on large samples of war veterans outline a wide majority of resilient subjects to traumatic exposure; a pattern characterized by high severity in the aftermath of trauma with a subsequent recovery; and subgroups that endure aversive effects of the trauma in the long term [Reference van der Wal, Vermetten and Elbert44]. As already mentioned, assessing the impact of the COVID-19 pandemic on subjects with BD can be particularly challenging because of the interplay among the onset of trauma-related symptomatology, the co-occurring anxiety and mood symptoms, the potential impact on the course of BD itself [Reference Hernandez, Cordova, Ruzek, Reiser, Gwizdowski and Suppes46,Reference Carmassi, Bertelloni, Gesi, Conversano, Stratta and Massimetti47,Reference Dell’osso, Carmassi, Rucci, Ciapparelli, Paggini and Ramacciotti62]. Indeed, the combined analysis of the three symptomatological dimensions highlights a consensual trend in anxiety, depressive and post-traumatic symptoms among the three groups. This is in line with a great amount of literature highlighting high comorbidity rates between PTSD, depression, and anxiety in trauma-exposed populations [Reference Albert, Carmassi, Cosci, De Cori, Di Nicola and Ferrari63,Reference Carmassi, Gesi, Corsi, Cremone, Bertelloni and Massimetti64].
Some aspects emerging from our analysis of sociodemographic information are worthy of a more focused discussion. First, the sharply higher burden of symptoms reported at baseline evaluation by the Acute reaction group, which is characterized by a marked female prevalence, financial hardships, and more previous depressive episodes. Female gender represents a risk factor for acute psychopathological reaction to traumatic events [Reference Carmassi, Gesi, Corsi, Cremone, Bertelloni and Massimetti64], as confirmed by recent studies conducted in the frame of COVID-19 pandemic [Reference Liu, Zhang, Wong, Hyun and Hahm65][Reference Gesi, Carmassi, Cerveri, Carpita, Cremone and Dell’Osso66]. Furthermore, recent studies corroborated the prominent role of ongoing economical difficulties in determining psychological distress in subjects suffering from BD during the current pandemic [Reference Yocum, Zhai, McInnis and Han13,Reference Van Rheenen, Meyer, Neill, Phillipou, Tan and Toh19,Reference Carmassi, Bertelloni, Dell’Oste, Barberi, Maglio and Buccianelli50]. Finally, the higher number of previous bipolar illness episodes may suggest an increased mood instability that can predispose to the onset of not only depressive symptoms but also anxiety and post-traumatic stress ones. On the other hand, subjects from the Increasing severity group presented more frequently unfavorable sociodemographic features, such as a lower occupational rate or a relative at risk for medical complications related to COVID-19. The association between low socioeconomic status and poor mental health had been repeatedly reported [Reference MacIntyre, Ferris, Gonçalves and Quinn67]. Consequently, it could be supposed that people in this group were both exposed to a relatively higher stress-dose and be more vulnerable. They, in fact, had higher rates of previous hospitalizations, suggesting a more severe course of the underlying disorder, and reported higher manic symptoms at baseline. This is in line with literature, since previous studies reported that PTSD rates were significantly associated with manic, hypomanic, or mixed mood states at the time of trauma. We also corroborated the findings that manic symptoms in the framework of the traumatic event are related to the development of depressive and anxiety symptoms too [Reference Ginzburg, Ein-Dor and Solomon37,Reference Barbano, van der Mei, deRoon-Cassini, Grauer, Lowe and Matsuoka38,Reference Hernandez, Cordova, Ruzek, Reiser, Gwizdowski and Suppes46,Reference Dell’Osso, Carmassi, Musetti, Socci, Shear and Conversano49,Reference Pollack, Simon, Fagiolini, Pitman, McNally and Nierenberg58].
Some limitations should be taken into account. First, the small sample size. However, in this regards it is important to acknowledge that the present study represents one of the few longitudinal research conducted on a clinical sample of subject with BD assessed by clinicians, during the COVID-19 pandemic. Second, the use of self-report instruments could be considered less accurate that a clinician assessment. Moreover, the telepsychiatry setting at baseline may have influenced in some way the results of the assessments. Third, cautiousness should be adopted when comparing our results with previous studies on trajectories after a traumatic event because of major methodological differences, such as different sample characteristics or timing of assessment. Fourth, in the present study, the three time points corresponded to three different environmental conditions related to COVID-19, and it might influence the psychopathological status of the sample. Finally, possible protective factors, such as social support or coping styles, besides different treatments, which may have influenced the emergence of symptoms, were not evaluated in the study.
In conclusion, we observed three distinct symptom trajectories during the COVID-19 emergency in subjects suffering from BD. While most individuals regularly followed in a psychiatric setting reported a mild reaction, others presented acute or even enduring psychopathological response. In BD female gender, low socioeconomic status, numerous previous episodes, and manic/hypomanic symptoms during the Lockdown appear possible predictive factors of unfavorable outcome after a traumatic event: in this sense, the present findings will be useful for the development of further studies focusing on specific therapeutic strategies for BD in the framework of a traumatic event.
Data Availability Statement
The data that support the findings of this study are available from the corresponding author upon reasonable request.
Author Contributions
Conceptualization: C.C.; Data curation: A.Co., C.A.B., A.Ca.; Formal analysis: C.C., C.A.B., G.M., V.D.; Investigation: C.C., A.Co., A.Ca., V.P.; Methodology: C.C., A.Co., C.A.B., V.P., V.D.; Project administration: C.C.; Supervision: C.C., C.A.B., L.D.; Writing—original draft: C.C., A.Co., C.A.B.; Writing—review and editing: C.C., A.Co., C.A.B., A.Ca., V.P., G.S., V.D.
Financial Support
This research received no specific grant from any funding agency, commercial, or not-for-profit sectors.
Conflict of Interest
The authors declare that the research was conducted in the absence of any commercial or financial relationships that could be construed as a potential conflict of interest.


 Open access
Comments
No Comments have been published for this article.