


Implications
Cell-based meat, also called ‘clean’, lab, synthetic or in vitro meat, has attracted much interest from the media recently. The drivers for cell-based meat production include food security, environment and sustainability, consumer and public health/safety and animal welfare problems associated with meat production, but not all of these challenges will be met by a move to industrial scale cell-based meat. This review discusses the process of cell-based meat production and summarises the significant challenges for the appearance on retail shelves.
Introduction
The provision of safe, affordable protein is critical to human nutrition and food security (Waughray, Reference Waughray2018). Protein, particularly from animal-sources, has been shown to play a key role in brain development and function in all humans, particularly in the elderly and in children (Mann, Reference Mann2018). Although many vegetarian protein sources are available as alternatives, meat continues to be very attractive to most consumers (Van Der Weele and Tramper Reference Van Der Weele and Tramper2014; Piazza et al., Reference Piazza, Ruby, Loughnan, Luong, Kulik, Watkins and Seigerman2015).
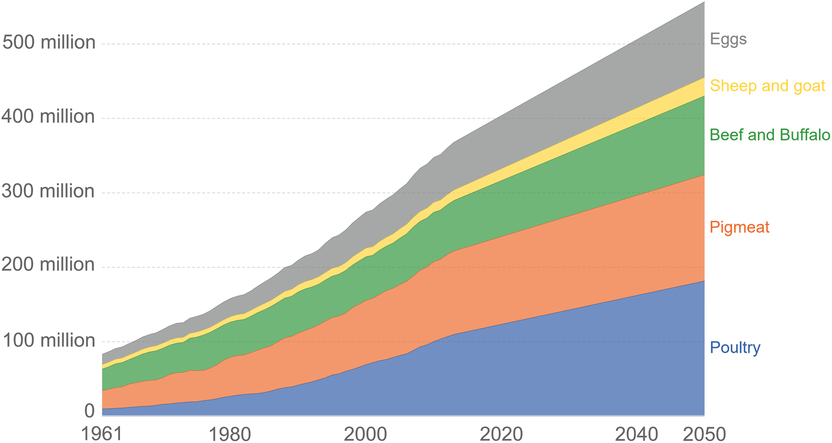
As a global community, the drivers for the agriculture and processing industry are focused on food security. Figure 1 shows the projected increase in meat production required for the major meat-producing species by 2050 (FAO, 2012). For these reasons, there has been serious consideration of, and advances in, the production of some nutrients from cellular agriculture. At a consumer level, the proponents of cellular meat have focused their communication strategy around the societies’ present concerns around meat consumption, including environmental issues, animal welfare, safety and health (Hocquette, Reference Hocquette2016). The increase in urbanisation of human beings and associated loss of connection to the farm, and how meat is produced, has also led to some consumers’ lack of understanding and acceptance of meat production on farms.
Global meat production (tonnes), based on future population projections and expected impacts of regional and national economic growth trends on meat consumption. Data from 1961 to 2013 are based on published FAO estimates and from 2013 to 2050 are based on FAO projections. Graph from https://www.3fbio.com/hello-world/, with permission, who used data from FAO (2012).
This review focuses on the production of meat protein from muscle cells. Reducing the environmental impacts of meat production, and particularly greenhouse gas (GHG) emissions, is potentially a significant potential advantage of cultured meat, but reducing the need for animals in meat production is also an important facet of cell-based meat production, particularly for some urban consumers who are concerned about animal welfare (Tuomisto and Teixeira de Mattos, Reference Tuomisto and Teixeira de Mattos2011; Post, Reference Post2012).
This review describes the process of cellular meat production, including the challenges and constraints. The drivers for cellular meat production are also presented and analysed, and the future is discussed.
Definition and process of cellular meat production
The definition of cellular meat production is meat made from stem cells, which tries to mimic traditional meat (Hocquette, Reference Hocquette2015). It is essentially a ‘substitute for meat made from animals’. The common terms used for this type of meat production include lab meat, cultured meat, in vitro meat, artificial meat, synthetic meat and for those keen to promote the industry, ‘clean meat’. Nomenclature for cell-based meat is widely debated, and for an excellent discussion on the various terms and their history and socio-political connotations, see Stephens et al. (Reference Stephens, Sexton and Driessen2019). Producers, investors and advocates of cell-based meat production prefer to use the term ‘clean meat’ in order to promote consumer acceptance as it has positive connotations (Bryant and Barnett, Reference Bryant and Barnett2019). Conversely, those arguing against the term ‘clean’ meat point out that the term implies that conventional meat production is ‘dirty’. The term cell-based meat has been selected for use throughout this article due to the linkage with cellular agriculture, although it is recognised that company marketing and brands will choose different nomenclature, which may be dictated by regulators.
The development of cellular meat production from cells involves a number of biological principles regarding how muscle cells are made in vivo. Replicating these processes at an industrial scale presents a number of technical challenges (Hocquette, Reference Hocquette2016). Hence the development of novel meat and protein products is utilising ground-breaking technologies designed to meet the issues facing the conventional meat industry (Bonny et al., Reference Bonny, Gardner, Pethick and Hocquette2017).
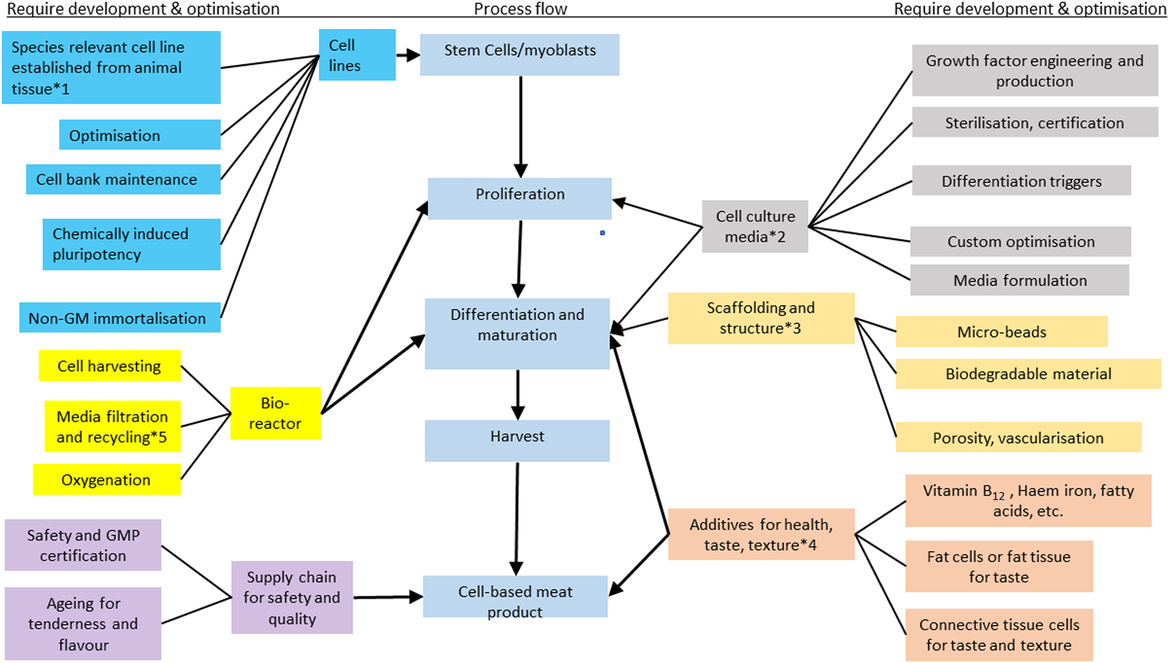
Muscle comprises muscle cells (myocytes), fat cells (adipocytes), connective tissue cells (fibroblasts) and vascular tissue (endothelial cells). Extensive research has been conducted on conditions for allowing muscle, fat and connective tissue cell culture in vitro, but the aims of these studies have been very diverse. Due to the complexity of conditions involved for culture of each individual cell type, successful and continued co-culture of these cells has not yet been achieved. Different cell types, particularly stem cells, can be used as a source of material to generate cellular meat, and the following section focuses on muscle cell production. The general stages of development of a mature muscle fibre, from a stem cell, including the growth factors required are shown in Figure 2. The stages of production of meat cells, including the critical decision points, are shown in Figure 3.
Factors affecting muscle cell proliferation, differentiation and maturation. Substrate stiffness is involved in both the proliferation of myosatellite cells and the maturation of myotubes, whereas mechanical stimulation is important for alignment of myoblasts and maturation of myotubes. Extracellular matrix proteins and growth factors are involved in both differentiation and maturation. Note the myogenic regulatory growth factors indicated at each stage being MyoD (myoblast determination protein 1), Myf5 (myogenic factor 5), myogenin (MyoG, myogenic factor 4), MRF4 (mygenic factor 6 or herculin) and MLP (muscle LIM protein). Source: From Langelaan et al. (Reference Langelaan, Boonen, Polak, Baaijens, Post and van der Schaft2010).
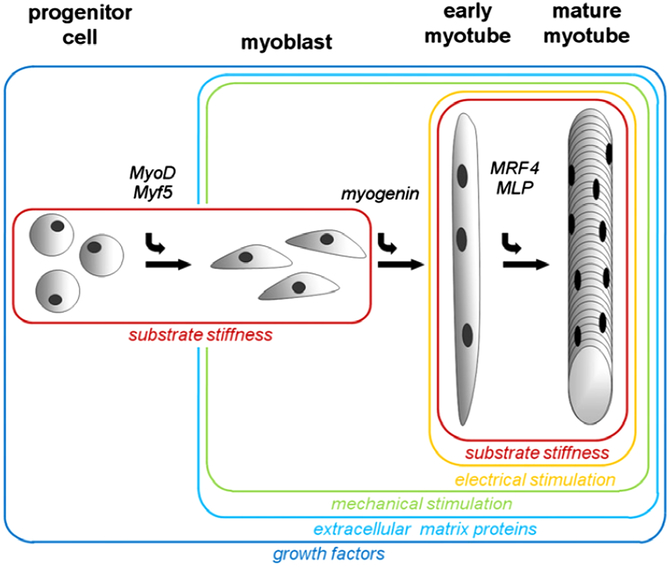
Diagram showing the stages of cellular meat production including the process flow (blue boxes in the centre), the components requiring research, development and optimisation on the extreme left and right and the critical decision points marked by an asterisk (*). Choices which are important decision points for both small scale and industrial production include: (1) source of tissue to derive cells from, (2) growth media to stimulate differentiation, proliferation, formation of myotubes and maturation of adipocytes and muscle cells, (3) scaffold or matrix on which cells can grow, (4) when to add nutrients or fat tissue/cells in order to simulate sensory and nutrient attributes of whole muscle, (5) whether to recycle water and nutrients for growth medium. Source: Adapted from Specht et al. (Reference Specht, Welch, Rees Clayton and Lagally2018) and Bhat et al. (Reference Bhat, Morton, Mason, Bekhit and Bhat2019).
Source of cells
In order to manufacture cellular meat, cells with a large capacity for multiplication must be identified and sourced. Ideally these cells have a self-renewing capacity and can infinitely continue to divide, wherein lies the first challenge (see decision point 1 in Figure 3). Myogenesis starts after the formation of the embryo, continues through the life of the foetus and is mostly completed at birth (Orzechowski, Reference Orzechowski2015). At birth, all muscle cells (fibres) in the muscle tissue are fully formed and mature, with the main changes during growth and maturation of the animal being changes in muscle cell width (hypertrophy) and some changes in muscle fibre type. Muscle fibres are multinucleate, being a result of fusion of myoblasts which are uninucleate. In animal skeletal muscle tissue, myosatellite stem cells lie just outside the muscle cell, between the sarcolemma and the basement membrane and are usually in a quiescent state (non-dividing) (Datar and Betti, Reference Datar and Betti2010). When stimulated, for example, when muscle cell damage occurs, these satellite cells can divide and provide new nuclei. These new nuclei, once formed, then are transferred from extracellular, to intracellular within the muscle cell. The majority of myogenesis occurs during the development of the embryo and foetus, but myogenesis can also occur through recruitment of myosatellite cells for muscle regeneration after injury or as an adaptation to workload (Orzechowski, Reference Orzechowski2015). As an organism ages, the regenerative potential of the myosatellite population rapidly decreases, hence the preference for harvesting myosatellite cells from neonate animals (Datar and Betti, Reference Datar and Betti2010).
A stem cell has a unique ability to develop into many different cell types in the body, and all stem cells can self-renew (make copies of themselves through division) and differentiate (develop into more specialised cells). Stem cells vary widely in what they can and cannot do, and in the circumstances in which they can, and cannot, do certain things. Different types of stem cells, depending on their derivation, have differing longevity and persistency in terms of number of replications in vivo (Kadim et al., Reference Kadim, Mahgoub, Baqir, Faye and Purchas2015). The longevity and derivation are of key importance in muscle cell culture, as a short-lived source of stem cells needs to be constantly replenished with new tissue from a living animal. The four types of stem cells relevant to this article are embryonic, tissue-specific, induced pluripotent and myosatellite. Embryonic stem cells are obtained from the inner call mass of the blastocyst that forms 3 to 5 days after an egg is fertilised by sperm. Embryonic stem cells are pluripotent (can give rise to every cell type in a fully formed body), have long-term persistency, and their number of divisions may be limitless (Kadim et al., Reference Kadim, Mahgoub, Baqir, Faye and Purchas2015). Tissue-specific stem cells, also called adult stem cells, can generate cell types specific to the tissue from which they are derived, and divisions are usually limited to 50 to 60 (see Kadim et al. (Reference Kadim, Mahgoub, Baqir, Faye and Purchas2015) for more detailed description). Induced pluripotent stem cells are cells that have been engineered in the laboratory (in vitro) to behave ‘like’ embryonic stem cells. These have variable, and often unknown, persistence and number of replications. Muscle tissue removed by biopsy from a living mammal can be used to derive ‘myosatelite stem cells’, which can only differentiate into a muscle cell. For myosatelite stem cells derived from adult animals, the number of divisions can be as low as 20 in vitro (Mouly et al., Reference Mouly, Aamiri, Bigot, Cooper, Di Donna, Furling, Gidaro, Jacquemin, Mamchaoui, Negroni, Périé, Renault, Silva-Barbosa and Butler-Browne2005).
The most promising cell type for cellular meat production is the myosatellite cell, as these are the primary adult stem cell for muscle, although the isolation, culturing and maintenance of a high-quality population of myosatellite cells in vivo is challenging (Post, Reference Post2012). Embryonic stem cells would be an ideal starting source for cellular meat production due to the pluripotent nature, but the proliferation and differentiation can be difficult (Kadim et al., Reference Kadim, Mahgoub, Baqir, Faye and Purchas2015). Mosa Meat in the Netherlands (https://www.mosameat.com/) harvests muscle tissue from a living cow with a biopsy, deriving adult myosatellite stem cells whereas in Israel, BioFood Systems (https://www.biofood-systems.com/) wants to produce beef products using bovine embryonic stem cells.
Growth media for proliferation, merging and maturation
Growth of the cells in culture requires nutrients, similar to cells in living tissue. In the absence of a blood supply providing nutrients (and removing waste), cells are bathed in a culture media which provides the important nutrients and growth factors. The growth factors required for proliferation, differentiation and maturation are usually provided by adding 10% to 20% growth media (Stephens et al., Reference Stephens, Di Silvio, Dunsford, Ellis, Glencross and Sexton2018). The nutrients required, such as carbohydrates, lipids, amino acids and vitamins, are relatively straightforward to predict and calculate, but different growth factors (and hormones) are required at different stages, as shown in Figure 2. This is the second series of challenges and decision points in cellular meat production, being how to supply the right growth media for each stage (decision point 2 in Figure 3).
The culture media needs to be formulated to ensure high rates of cell growth with not only the appropriate level of nutrients, but also the appropriate myogenic regulatory growth factors (myoblast determination protein 1 (MyoD), myogenic factor 5 (Myf5), myogenin factor 4 (MYOG), myogenic factor 6 (MRF4) and muscle LIM protein (MLP); see Figure 2) and hormones (insulin, thyroid hormone, growth hormone). A description of the requirements for growth factors and hormones at different stages for muscle cells from different species is given in Burton et al. (Reference Burton, Vierck, Krabbenhoft, Bryne and Dodson2000). All of these are necessary to culture the cells and to allow them to proliferate and differentiate (Bonny et al., Reference Bonny, Gardner, Pethick and Hocquette2017). It should be noted that proliferation (increase in number of cells) is possible only at the satellite cell stage and the mononucleate myoblasts stage. Myotubes (multinucleate fused myoblasts) and myofibres (multinucleate mature muscle cells) do not proliferate and hence the importance of extensive and rapid proliferation at the stem cell and myoblast stages (Datar and Betti, Reference Datar and Betti2010). Traditionally stem cells are cultivated in a medium containing nutrients and foetal, or calf, bovine serum, and the precise composition of this serum is not defined (Burton et al., Reference Burton, Vierck, Krabbenhoft, Bryne and Dodson2000). Attempts have been made to synthesise serum-free growth media from mushrooms, algae and plants, but there has been limited success with these synthetic growth media (Datar and Betti, Reference Datar and Betti2010; Stephens et al., Reference Stephens, Di Silvio, Dunsford, Ellis, Glencross and Sexton2018). In vitro cell culture is usually conducted in an aseptic environment, due to risk of contamination which can result in bacterial contamination and cell death (Sanders, Reference Sanders2012; Phelan and May, Reference Phelan and May2015). Cellular meat production requires a preservative, such as sodium benzoate, added to the growth media, to protect the growing cells from yeast and fungus. Sodium benzoate is a common preservative added to processed meat products (Hoang and Vu, Reference Hoang and Vu2016). Furthermore, antibiotics are often added to the growth media of cells in long-term culture to prevent any infection from bacteria (Burton et al., Reference Burton, Vierck, Krabbenhoft, Bryne and Dodson2000, Renzini et al., Reference Renzini, Benedetti, Bouché, Silvestroni, Adamo and Moresi2018, Stephens et al., Reference Stephens, Di Silvio, Dunsford, Ellis, Glencross and Sexton2018). Patents for industrial production of cell-based meat state that the process will be achieved without antibiotics (or hormones) (Van Eelen, Reference Van Eelen2007). It remains to be seen whether antibiotics, or anti-bacterials, will be routinely or occasionally required during muscle cell culture.
Biomaterial/scaffold, electrostimulation and mechanical stimulation
Similar to the need for biochemical stimulation by growth factors and hormones described earlier, biomechanical, biophysical and electrical stimulation are also necessary for proliferation, differentiation, maturation and fully functioning skeletal muscle cells.
Application of a biomechanical stimulus to satellite cells can induce the formation of muscle precursor cells (myoblasts, see Figure 2) (Langelaan et al., Reference Langelaan, Boonen, Polak, Baaijens, Post and van der Schaft2010). Biophysical stimuli are also crucial in the maturation process towards functional muscle cells with a high level of functional sarcomeres (Kosnik et al., Reference Kosnik, Dennis, Vandenburgh, Guilak, Butler and Goldstein2003). In addition, neuronal activity is required for the development of mature muscle fibres (cells), and this can be simulated through the application of electrical stimulation (Figure 2) (Langelaan et al., Reference Langelaan, Boonen, Polak, Baaijens, Post and van der Schaft2010).
Mechanical stretch is another biophysical stimulus which can be applied and appears to be crucial in myogenesis, proliferation and differentiation. Mechanical stretch applies to various stages of the muscle cell process and facilitates; alignment of myotubes, fusion of myotubes to form muscle fibres, hypertrophy of both myotubes and muscle fibres, proliferation of myoblasts and activation of satellite cells (Vandenburgh and Karlisch, Reference Vandenburgh and Karlisch1989, Tatsumi et al., Reference Tatsumi, Sheehan, Iwasaki, Hattori and Allen2001).
At the stage of differentiating from stem cells into myotubes, the cells need to be attached either to a mesh scaffold, such as a collagen meshwork, or to a carrier such as microcarrier beads, which can also be made from collagen (Bhat et al., Reference Bhat, Kumar and Fayaz2015). The myotubes can then fuse into myofibres, given the appropriate cues in the growth media and environment. In vivo, the cells attach to the insoluble network of extracellular matrix proteins through integrin receptors located in the sarcolemma, which allows transmission of applied force to the cytoskeleton (Langelaan et al., Reference Langelaan, Boonen, Polak, Baaijens, Post and van der Schaft2010). Hence in vitro, this needs to be replicated in order to allow biomechanical and biophysical stimulation. The selection of material for the scaffold is important in cellular meat production and is indicated by decision point 3 in Figure 3. The scaffold-based method is limited to producing a layer of cells only 100 to 200 µm thick, in static culture, due the lack of blood supply and the diffusion limits for the nutrients and growth factors in the growth medium(Datar and Betti, Reference Datar and Betti2010).
Scaling up and industrial production
A major challenge in cell-based meat production is to produce the nutrients, hormones and growth factors in large quantities and compatible with human food (Hocquette, Reference Hocquette2016). All these compounds will need to be produced by the chemical industry, and the waste and pollution generated will need to be included in the environmental analysis of the effects of cellular meat production.
Identification of a self-replicating line of satellite cells is important to the process, in order to remove the reliance on animals. As myosatellite stem cells derived from a biopsy are presently the most effective source for cellular meat production, this remains a challenge for the scaling-up process.
Availability of cost-effective growth medium for cell proliferation and growth is a critical component of the scale-up process. Bovine foetal calf serum is the preferred growth media, due to its effectiveness, but is prohibitively expensive (Stephens et al., Reference Stephens, Di Silvio, Dunsford, Ellis, Glencross and Sexton2018), and it is derived from animals.
For differentiation, and in particular for growth, a continuous supply of nutrients and growth factors as well as a supply of oxygen and removal of waste products is required in the culture medium. This is proposed to be achieved at large scale by bioreactors having continuous agitation and flow, allowing perfusion of required gas and chemicals into and out of the cells. Certainly it is the lack of a vascular system in the current muscle cell culture systems, for both supply of nutrients and removal of waste, that presently limits the width of the muscle cell tissue to 1 to 2 cells thick, or 100 to 200 um.
Although cellular meat production is generally considered to be most feasible at an industrial scale, some companies (e.g. FM Technologies) are proposing two possible model systems where cellular meat production could occur at a small business or even individual consumer scale. FM Technologies calls this a ‘distributive approach to sustainable manufacturing’ (https://www.future-meat.com/). It proposes that localised production could be achieved through several models. The first model could be where farmers maintain a population of livestock for periodically deriving a source of myosatellite cells through biopsy. In this model, for example, animals could be kept in backyards, or on animal-friendly urban farms, and serve as living donors (Van Der Weele and Tramper Reference Van Der Weele and Tramper2014). Alternatively, the model proposed by FM Technologies has centralised stores of stem cells, which are periodically shipped to local communities. The local community would have small-scale bioreactors to feed small villages or regions, and the technological know-how would be provided from a central point. The proposed distributive approach is partly in response to the criticism that cellular meat production is likely to be controlled by multinational corporations. Also, if production occurs centrally, or even only in select countries, environmental costs associated with transport may negate any environmental benefits (Mattick et al., Reference Mattick, Landis and Allenby2015a). These models at this stage are purely theoretical and remain to be tested or proven, and the proposed approach may struggle to be cost-effective, sustainable or efficient without involvement of large corporations and multinationals.
Recycling of growth media has the capacity to ensure industrial scale cellular meat production has a much lower water and nutrient footprint than without recycling, and this is indicated in Figure 3 by decision point 5. The management of metabolic waste by disposal, recycling or upgrading needs to be considered for design and implementation of a hazard and critical control points (HACCP) procedure (see the ‘Regulation, labelling and hazard and critical control points’ section) (Stephens et al., Reference Stephens, Di Silvio, Dunsford, Ellis, Glencross and Sexton2018). Cell-based meat factories will need to consider constructing on-site treatment or recycling systems to limit emitted pollution, which may be required by state and federal regulations (Mattick et al., Reference Mattick, Landis and Allenby2015a). If recycling is implemented, the emissions from excess nutrients in the waste water could be similar to, or lower than, a poultry operation (Mattick et al., Reference Mattick, Landis and Allenby2015a). Recycling of culture medium can be enabled through the replenishment of utilised nutrients such as glucose, glutamine and other amino acids and carbohydrates and also through removal of waste products such as lactate and ammonia (Moritz et al., Reference Moritz, Verbruggen and Post2015). It is also possible that growth factors and cytokines produced by muscle cells can be reused in subsequent culture to stimulate cell growth. It is proposed that recycling would involve cells staying in the reactor and in-line recycling of media, with removal of waste products through chromatographic purification (Moritz et al., Reference Moritz, Verbruggen and Post2015). In addition, it is likely that micro-carrier beads can be recycled. The inclusion of waste water recycling in the lifecycle analysis to determine the impact on environment, emissions and water use is an important consideration.
Harvesting and manufacture of cellular meat products
Obviously the products of muscle cell culture, using collagen scaffold or micro-beads for structure, do not have the same structure as skeletal muscle tissue from animals, and can only be used for processed meat products (Datar and Betti, Reference Datar and Betti2010). In addition, if the scaffold or carriers are edible, they can be included in the cellular meat mix and harvested from the bioreactor without separating cells from scaffold/carrier (Stephens et al., Reference Stephens, Di Silvio, Dunsford, Ellis, Glencross and Sexton2018). But this is not always desirable, as the matrix may need to be reused, the matrix may contribute an unacceptable texture, flavour or functionality to the final product or the matrix may be non-edible. In this case, removal of the cells from the matrix can be achieved through chemical means or through environmental manipulation of pH, temperature and so on (van der Weele et al., Reference van der Weele, Feindt, Jan van der Goot, van Mierlo and van Boekel2019). Any chemicals used obviously need to pass food safety tests and achieve regulatory approval (see the ‘Regulation, labelling and hazard and critical control points’ section).
The flavour of meat is derived from more than 750 compounds. Flavour is composed of the volatiles developed during cooking that contribute to the aroma or odour and are detected in the retro-nasal cavity and the taste, which is detected on the tongue by taste receptors (Watkins et al., Reference Watkins, Frank, Singh, Young and Warner2013; Frank et al., Reference Frank, Ball, Hughes, Krishnamurthy, Piyasiri, Stark, Watkins and Warner2016). Meat derived from whole muscle has a mixture of fat cells, fatty acids in both membranes and fat cells, fibroblasts and the protein collagen, muscle and endothelial cells and compounds such as haem-iron, creatine, carnitine glutamate and other compounds which uniquely and together contribute to the overall experience of the flavour of meat. The flavour of meat develops during cooking and some fatty acids and amino acids prevalent in meat (e.g. linoleic acid and inosine monophosphate) contribute to the unique flavour fingerprint. Whether cell-based meat products will be able to replicate the >750 compounds associated with the flavour of whole muscle is a question that remains to be answered, as well as a challenge.
The texture of meat, mouthfeel and breakdown during oral processing contribute to the overall sensory experience. The texture, particularly hardness, of meat changes during cooking, in response to temperature, as proteins denature at different temperatures, causing shrinkage in the muscle at a macro- and micro- level and changes in the gel matrix binding proteins together (Purslow et al., Reference Purslow, Oiseth, Hughes and Warner2016). Adipocytes are the main fat deposits in muscle tissue and are a rich source of aroma, taste and juiciness in the consumer’s mouth (Orzechowski, Reference Orzechowski2015). Stroma, or connective tissue, comprises cells called fibroblasts, which extrude collagen fibrils to form the extracellular matrix of muscle. Both stroma and muscle cell protein integrity have important contributions not only to texture and tenderness, but also to particle breakdown and size in the mouth, and thus are pivotal in the consumer’s sensory experience. Furthermore, upon prolonged heating in appropriate conditions, collagen breaks down to gelatine, which has a unique and desirable flavour, as well as contains important amino acids for human muscle function and health (e.g. glutamate) (Arihara, Reference Arihara2006; Toldra et al., Reference Toldra, Aristoy, Mora and Reig2012).
The tenderness and flavour of whole muscle develops during the ageing, or maturation, process postmortem. During ageing, proteases such as calpains degrade the proteins in the micro-structure, particularly the myofibrils (Koohmaraie et al., Reference Koohmaraie, Whipple, Kretchmar, Crouse and Mersmann1991). Ageing of meat is conducted in an anaerobic environment for a period of days to weeks, usually by packaging the meat in a sealed bag, after removing all air through applying a vacuum, and subsequently storing at temperatures of −1 to 1°C. As cell-based meat products presently rely on formulation of a burger, or pattie, using only cells, the product does not need to be aged to improve tenderness. For example, beef patties are often made from cow beef, which is inherently tough, but once grinding/mincing occurs, this toughness of the whole muscle is no longer relevant. Assuming that there will be success in the future in producing whole muscle products from cells, then attention to ageing for optimal tenderness and flavour will be required.
Hence the manufacture of a product from purely muscle cells, such as cell-based meat, will have a different texture and mouthfeel to a product made from whole muscle derived from the post-mortem carcass of a living animal. This is a challenge for manufacture of cell-based meat products and requires addition of binders, such as carrageenan, collagen powder, xanthan gum or mannitol (Post, Reference Post2012) to simulate the texture derived from whole muscle.
The production of cell-based meat will be classed as a ‘manufactured’ meat, as it will involve the addition of ingredients for health, functionality, texture and flavour. This will likely push meat from animals into the premium end of the market, and cell-based meat products could supply the bulk, cheap end of the market if conventional meat products become more expensive and the palatability and versatility of manufactured meats improve (Bonny et al., Reference Bonny, Gardner, Pethick and Hocquette2017).
Aleph Farms (https://www.aleph-farms.com/), an Israeli start-up launched in 2017, announced in December 2018 that it succeeded in producing a lab-grown ‘minute steak’ made from bovine cells. According to its website, the tiny steaks are 3 mm wide – roughly the size of a very thin strip of roast beef. In the future, Aleph Farms’ aim is to grow a whole steak.
The generation of a whole muscle, complete with blood supply, connective tissue, fat cells, muscle cells and associated structure, has neither been achieved in human biology and medicine nor in cellular meat production. Hence, as pointed out by Hocquette (Reference Hocquette2016), the process of producing meat products from muscle cells should be called cellular muscle production, as it contains only muscle cells. The cell-based production of a whole steak is technologically far more complex and requires technological break-throughs in providing a vascular supply through a thick layer of muscle tissue as well as determining the right growth media for co-culture of muscle, fat, connective tissue and endothelial cells.
Analysis of drivers for cellular meat production
The main drivers for cellular meat production are food security, environment, animal welfare, health and food safety. In this section, available data are presented and discussed on the likelihood that cellular meat production will satisfy the consumer concerns as well as be produced economically and in sufficient quantity.
Food security and sustainable diets
Food security is defined by the Food and Agriculture Organization (FAO) as existing when ‘all people at all times have physical and economic access to sufficient, safe and nutritious food to meet their dietary needs and food preferences for an active and healthy lifestyle’ (FAO, 1996, 2010; cited in Nelson et al. Reference Nelson, Hamm, Hu, Abrams and Griffin2016). Global meat production has increased dramatically since the 1960s to meet the increase in population and also because of the increase in affluence of consumers in some countries (Ritchie and Roser, Reference Ritchie and Roser2017; Ranganathan, 2016). The global population is estimated to reach 9 billion by the year 2050, and according to this projection, the meat industry would need to increase production by approximately 50% to 100% to maintain per capita demand of the growing populations (Cornish et al., Reference Cornish, Raubenheimer and McGreevy2016; Bonny et al., Reference Bonny, Gardner, Pethick and Hocquette2017). Global meat production in 2018 was 263 million tones and is expected to reach 445 million tonnes in 2050 (Waughray, Reference Waughray2018). Figure 1 shows the predicted increase in the major animal-derived protein foods required by 2050, to meet the increase in demand for animal protein. Food production in general will have to increase by at least 70% to meet both the calorie and nutritional needs of the human population (Hocquette et al., Reference Hocquette2015; Cornish et al., Reference Cornish, Raubenheimer and McGreevy2016). The capacity of meat production, using conventional production practices, is thought to already be at its maximum, and any increase in production would come at too high a cost to the environment (Moritz et al., Reference Moritz, Verbruggen and Post2015). Cellular meat production is considered as a hopeful addition to the suite of alternative protein production systems (Van Der Weele and Tramper Reference Van Der Weele and Tramper2014).
Food systems have the potential to nurture human health and support environmental sustainability; however, according to some, they are currently threatening both (Willett et al., Reference Willett, Rockström, Loken, Springmann, Lang, Vermeulen, Garnett, Tilman, DeClerck, Wood, Jonell, Clark, Gordon, Fanzo, Hawkes, Zurayk, Rivera, De Vries, Majele Sibanda, Afshin, Chaudhary, Herrero, Agustina, Branca, Lartey, Fan, Crona, Fox, Bignet, Troell, Lindahl, Singh, Cornell, Srinath Reddy, Narain, Nishtar and Murray2019). A global dietary transition, associated with ‘perceived’ negative effects on health and environment and characterised by an increase of animal-based diets to the detriment of plant-based diets, has occurred in the past few decades (Cliceri et al., Reference Cliceri, Spinelli, Dinnella, Prescott and Monteleone2018). Sustainability has become an integral component in analysis of dietary patterns and guidelines around the world (Jones et al., Reference Jones, Hoey, Blesh, Miller, Green and Shapiro2016). A sustainable diet can be defined as one which maintains long-term health while avoiding excessive degradation and consumption of natural resources (Gussow and Clancy, Reference Gussow and Clancy1986). The most common measure of sustainability is GHG emissions (GHGEs) along with life cycle assessment (LCA, see next section). Less data are available, but recognised as of equal importance are energy, water consumption and nutrient use as well as, more recently, nutritional quality of diets (Jones et al., Reference Jones, Hoey, Blesh, Miller, Green and Shapiro2016).
It is most likely, if cellular meat production proceeds, that it will supplement the availability of meat protein from animal sources. Due to the high demand for meat protein and the potential increased consumption in many poor countries, some predictions even include a scenario where meat-animal production from agriculture is maintained alongside the development of a cellular meat industry (Stephens et al., Reference Stephens, Di Silvio, Dunsford, Ellis, Glencross and Sexton2018). Depending on the costs of production, cellular meat products may always be a niche product for consumers who have the income to make purchasing decisions based on their ethics. It is self-evident that for cellular meat production to be part of the solution for feeding the world, it will need to be cheap and ideally be produced locally.
Environment and resource use
Environmental sustainability is the rates of renewable resource harvest, pollution creation and non-renewable resource depletion that can be continued indefinitely (Daly, Reference Daly1990). If they cannot be continued indefinitely, then they are not sustainable.
Improved GHGE efficiency of production has been proposed as one of the biggest potential advantages of cultured meat over conventional livestock production systems (Lynch and Pierrehumbert, Reference Lynch and Pierrehumbert2019). In fact, meat production, particularly beef production, is considered to be the greatest single contributor to GHGE of any industry (Lynch and Pierrehumbert, Reference Lynch and Pierrehumbert2019). Thus the supporters of cellular meat production propose it is more sustainable as it will produce much lower GHGEs (Tuomisto and Teixeira de Mattos, Reference Tuomisto and Teixeira de Mattos2011).
There are still substantial uncertainties in most components of the GHG balance of livestock production systems, method of ranking and LCA methodologies, and these depend on assumptions, approach and criteria selected, for example, GHGEs per unit land area, per kilogram livestock or per unit product. The reader is directed to reviews on the methodological challenges in both LCA (Cederberg et al., Reference Cederberg, Henriksson and Berglund2013; Sala et al., Reference Sala, Anton, McLaren, Notarnicola, Saouter and Sonesson2017) and in calculation of GHGEs (Crosson et al., Reference Crosson, Shalloo, O’Brien, Lanigan, Foley, Boland and Kenny2011) for further detail. In order to compare GHGE across species, the work of one author has been selected to ensure a consistency of assumptions and methods. The GHGEs per kilogram LW (kg CO2-e/kg LW, excluding land use and direct land use change emissions) from meat production systems in Australia vary from the lowest for pork (2.1 to 4.5) (Wiedemann et al., Reference Wiedemann, McGahan and Murphy2018), grass-finished lamb is intermediate (6.1 to 7.3) (Wiedemann et al., Reference Wiedemann, Yan and Murphy2016b) and grass finished beef is the highest (10.6 to 12.4) (Wiedemann et al., Reference Wiedemann, McGahan, Murphy and Yan2016a). The calculation for grass-fed beef and lamb does not take into account carbon sequestration and storage by permanent pastures, and if this is included, the carbon impact will reduce by 30% to 50% (Soussana et al., Reference Soussana, Tallec and Blanfort2010). For pork, the GHGEs per kilogram wholesale meat were also estimated and were 6.36 kg CO2-e/kg of wholesale pork (Wiedemann et al., Reference Wiedemann, McGahan and Murphy2018) and 2.5 to 3.1 for boneless chicken (Wiedemann et al., Reference Wiedemann, McGahan and Murphy2017b).
The resources used and GHGEs from production of 1 kg of ready-to-eat product have been modelled for comparison across dairy-protein, chicken meat, cell-based meat and other forms of protein, including traditional (soya, wheat) and novel forms (insect-protein, myco-protein) (Smetana et al., Reference Smetana, Mathys, Knoch and Heinz2015). Cell-based meat production was predicted to require 2 to 10 times the amount of energy, vastly more tap water and have moderate-to-low requirements for transport (Table 1). The GHGEs from cell-based meat production were predicted to be much higher than for the other protein types by Smetana et al. (Reference Smetana, Mathys, Knoch and Heinz2015), but others predicted much lower GHGEs from cell-based meat, which were comparable to the levels for other protein production systems. Cell-based meat production also had much higher predicted non-renewable energy usage than the other protein production systems in the modelling of Smetana et al. (Reference Smetana, Mathys, Knoch and Heinz2015), and in this case, the comparisons across protein types by other authors were extremely variable.
(a) Resources used per functional unit (FU, 1 kg of ready-to-eat product) from cradle to grave in the production of different protein-based meals (b) comparison of the greenhouse gas emissions (GHGEs) and non-renewable energy use per 1 kg of ready-to-eat product (FU)

Source: Derived from Smetana et al. (Reference Smetana, Mathys, Knoch and Heinz2015).
1 FU=functional unit and is 1 kg chicken, 6 kg skimmed milk.
2 For comparison to pork in this table, global GHG emissions for pork are relatively similar to chicken meat (6.1 v. 5.4 kg CO2-eq/kg CW respectively; MacLeod et al., Reference MacLeod, Gerber, Mottet, Tempio, Falcucci, Opio, Vellinga, Henderson and Steinfeld2013) and are much lower than beef and sheep meat (see text and Wiedemann references).
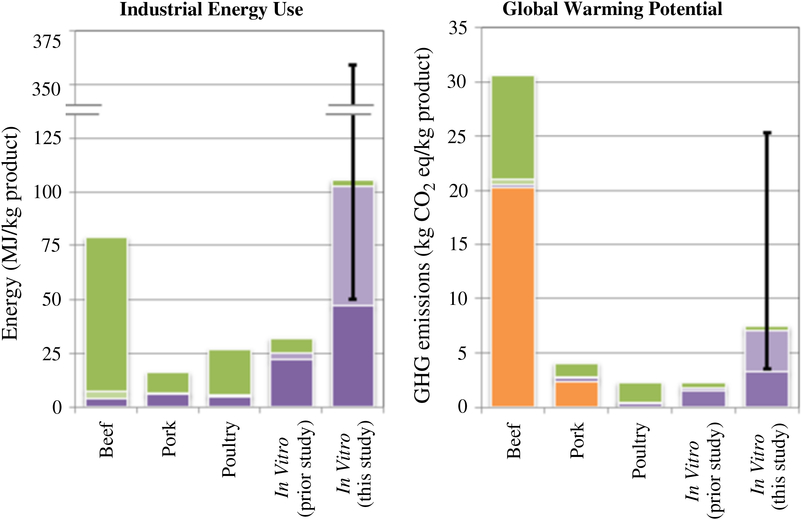
Mattick et al. (Reference Mattick, Landis and Allenby2015a) compared beef, pork, poultry and cellular meat production (see Figure 4), and their modelling showed that the predicted global warming potential of cellular meat production was approximately equivalent to (previous study), or higher than (current study), that of pork and poultry production, but much lower than that attributed to beef production. The predicted energy usage of cellular meat production was four times higher than that of pork and poultry and beef production, which is consistent with the more recent study of Lynch and Pierrehumbert (Reference Lynch and Pierrehumbert2019).
A comparison between beef, pork, poultry and cellular (in vitro) meat production for the energy usage and GHGE (greenhouse gas emission) attributed to agricultural production including feedstock processing and transport (green and light purple), on-farm energy use for livestock and biomass cultivation, bioreactor cleaning and facility (dark purple) and animal/carnery waste products for livestock/cellular meat (orange). Source: From Mattick et al. (Reference Mattick, Landis, Allenby and Genovese2015c).
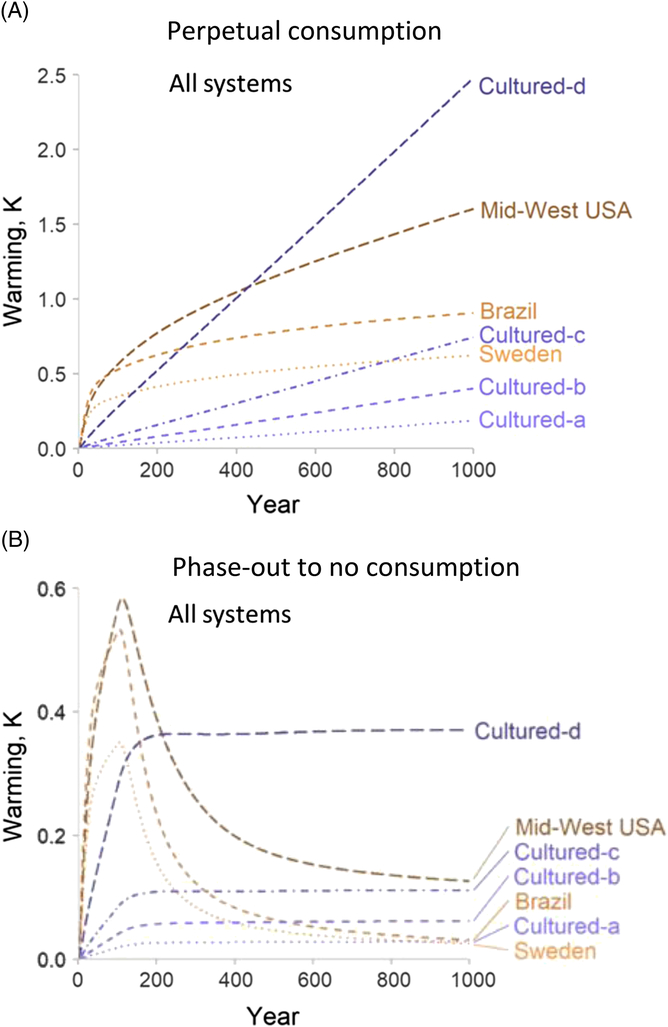
Lynch and Pierrehumbert (Reference Lynch and Pierrehumbert2019) recently modelled the potential climate change impacts of four cell-based meat production systems and three beef cattle production systems, over 1000 years (Figure 5). In both scenarios of perpetual consumption of animal protein, and phase-out to no consumption, the warming potential of one cellular meat scenario (cultured-d, high emissions system in Figure 5a and b) would exceed the warming potential of beef production in Brazil, Sweden or USA. The predicted warming potential of cellular meat production ‘b’ and ‘c’ (medium emissions system) was similar to that for mid-West USA cattle production. They concluded that cultured meat is not ‘prima facie’ climatically superior to cattle. The conclusion of Lynch and Pierrehumbert (Reference Lynch and Pierrehumbert2019) is that ‘replacing cattle systems with cultured meat production before energy generation is sufficiently decarbonised could risk a long-term, negative climate impact’.
Predicted environmental warming impacts for the production of beef cattle, under three different cattle production systems (Brazil, Sweden, mid-West USA) or cellular meat production (cultured; a- low emissions system, b- and c- moderate emissions systems, d- high emissions system) under these production systems (a, b, c, d) for 1000 years. (A)– assumes perpetual consumption at very high rates (250 Mt per year), (B) – assumes initial consumption at very high rates followed by a decline to zero consumption. Source: Derived from Lynch & Pierrehumbert (Reference Lynch and Pierrehumbert2019).
In summary, the existing data are consistent in showing that cell-based meat production has similar levels of GHGEs to pork and poultry production but much lower than beef production. The studies also consistently demonstrated that cell-based meat production will have much higher non-renewable energy usage, and likely higher water usage. Hence the environmental impact of cell-based meat may be comparable, or even worse, than traditional forms of animal-based production systems, especially if compared to pork and poultry. It should be noted that there was considerable variability in the methods used, and the assumptions made, in each study. As cell-based meat production is not yet occurring, a number of assumptions have been made, and will need to be made, regarding an industry scale system. Mattick et al. (Reference Mattick, Landis and Allenby2015a, Reference Mattick, Wetmore and Allenby2015b, and Reference Mattick, Landis, Allenby and Genovese2015c) who have studied the environmental consequences of cell-based meat production, as well as cellular agriculture, state that ‘because the cellular agriculture technology largely replaces biological systems with chemical and mechanical ones, it has the potential to increase industrial energy consumption and, consequently, greenhouse gas emissions’. Mattick et al. (Reference Mattick, Landis and Allenby2015a) have also explained that in the absence of a commercial-scale process on which to base a lifecycle inventory (i.e., the detailed methodology), any analysis of the environmental implications cannot be interpreted as conclusive or definitive. Taking into account Mattick’s comments, the need for further research and development on the industrial process (Figure 2) and the unpredictability of the future of a complex system (Figure 6) such as cell-based meat production, the effects on the environment are, in fact, unpredictable. But as the environment is a major driver for the development of cell-based meat production, the modelling should continue and hopefully improve as the process is better defined and commercial production is initiated.
Path dependency and unpredictability inherent in the evolution of complex systems over time. Source: From Mattick et al. (Reference Mattick, Landis and Allenby2015a).

Public and consumer health
Our pre-human ancestors ate meat, and the consumption of meat is thought to support the historical early development of a larger and more elaborate brain which required the diversion of energy from the gastrointestinal tract, resulting in a reduction in the size of the tract relative to other species (Mann, Reference Mann2018; Willett et al., Reference Willett, Rockström, Loken, Springmann, Lang, Vermeulen, Garnett, Tilman, DeClerck, Wood, Jonell, Clark, Gordon, Fanzo, Hawkes, Zurayk, Rivera, De Vries, Majele Sibanda, Afshin, Chaudhary, Herrero, Agustina, Branca, Lartey, Fan, Crona, Fox, Bignet, Troell, Lindahl, Singh, Cornell, Srinath Reddy, Narain, Nishtar and Murray2019). Humans cannot digest plants and grass, and eating meat from herbivores is an efficient way for human beings to valorise grass (Post, Reference Post2012).
The effect of cell-based meat production is a topic where there is, in some instances, a big gap between consumer/public perception and reality. Some of the reported consequences of red meat consumption include nutrition-related diseases, foodborne illnesses and antibiotic-resistant pathogens strains, due to overuse of antibiotics. In addition, some of the perceived problems with consumption of animal-derived meat include the use of growth hormones and ‘chemicals’ in animal production. Hopkins (Reference Hopkins2015) shows evidence of the overemphasis and overrepresentation of the views of vegetarians in the media, particularly in regard to the reception of cell-based meat among vegetarians.
Nutrient attributes of animal-derived meat. Meat is well known to be a good source of high-quality protein, including essential amino acids, Vitamin B12, iron, zinc and selenium. For example, from 100 g of pork, the consumer derives ~37% of their daily protein requirements, 67% of their daily Vitamin B12 requirements and 15% to 16% of their selenium and zinc requirements (McAuliffe et al., Reference McAuliffe, Takahashi and Lee2018). Thus in order to compare foods, it is important to compare them not only on a nutrient basis but also on a nutrient bioavailability and gut health basis. The most well-known example is the much lower bioavailablity of non-haem iron from plants, as a source of iron, relative to haem iron from meat sources. Animal-source foods are also the only natural source of Vitamin B12, so deficiency is prevalent when intake of these foods is low due to their high cost, lack of availability or cultural or religious beliefs (WHO, 2008). Meat is known to be the biggest source of protein for human consumption.
Nutrients predicted to be in cell-based meat. In order for cell-based meat products to supplement meat from animals, they will need to either replicate or increase bio-availability and levels of the nutrients referred to earlier. Skeletal muscle cells can make many bio-available proteins, fatty acids, growth factors and cytokines. But Vitamin B12 is not produced by muscle cells in culture, but is taken up from the culture media in vitro or from the blood in vivo (Post and Hocquette, Reference Post, Hocquette and Purslow2017). Cellular meat does not have high levels of iron, unless the culture is grown under a low oxygen environment (Post and Hocquette, Reference Post, Hocquette and Purslow2017). Furthermore, many of the healthy n-3 fatty acids and poly unsaturated fatty acids are generated from the animals diet (McAuliffe et al., Reference McAuliffe, Takahashi and Lee2018). As the levels of the healthy n-3 fatty acids in the membranes of muscle cells in culture may be low, these fatty acids could be added to cell-based meat products as a ‘health bonus’ (Post, Reference Post2012). Vitamin B12 needs to be added to the culture medium in order for the cell-based meat to contain this vitamin. In general, the nutritional composition of the cellular meat will be dependent on the nutrients added to the growth medium during production, unless these can be added as fortifications to the product (see decision point 4 in Figure 3).
Diet-related diseases. Consumption of meat, particularly red meat, has been related to obesity, atherosclerosis, cardiovascular disease and colon cancer, although some of the constituents related to these diseases may be produced during cooking (e.g. heterocyclic amino acids) (Post, Reference Post2012; Orzechowski, Reference Orzechowski2015), hence it is possible that cell-based meat culture could be tailored to remove specific compounds. In addition, there is evidence that the incidence of these diet-related diseases is due to overconsumption of food, and of meat. Hence the evident solution is for affluent Western countries to reduce intake.
Pathogens and animal transmission of diseases. Foodborne pathogens, such as Salmonella, Campylobacter, Listeria and Escherichia coli, are responsible for many cases of illness, and sometimes death, around the world. Over the period 2009 to 2016 in the US, the single source foods that sickened people the most were fish (17%) and dairy (11%) followed by chicken (9%) and beef, pork, vegetables and molluscs being lower (6% to 8%) (www.cdc.gov). Epidemiological studies demonstrate that these pathogens and emerging diseases such as avian and swine influenza increase in incidence under intensive production and housing. Also, cell-based meat production will reduce the human-animal interactions and thus is expected to reduce incidences of epidemic zoonoses and other emerging diseases (Datar and Betti, Reference Datar and Betti2010). Interestingly, strains of pigs and poultry which are resistant to Salmonella are being developed (Bonny et al., Reference Bonny, Gardner, Pethick and Hocquette2015), and there is potential for technological advances in this area. The high degree of environmental control required for cell-based meat production will likely reduce the risk of foodborne pathogens and may allow improvements in health and safety (Bonny et al., Reference Bonny, Gardner, Pethick and Hocquette2015).
Anti-microbials and chemicals. The use of sterile environments and antimicrobials during cell-based meat production will likely be used to eliminate pathogens such as Salmonella and E. Coli from the production process. Historically, the extensive and long-term use of antimicrobials is known to generate public and consumer health and safety issues. In addition, generating the required sterile environment during production is very expensive and is very difficult at an industrial scale (Bonny et al., Reference Bonny, Gardner, Pethick and Hocquette2017). This is exemplified by the consideration that sterile environments for cell culture can be difficult to maintain long term at lab scale (see ‘Growth media for proliferation, merging and maturation’ section), let alone at an industrial scale, and hence the likelihood that strong chemicals and anti-microbials will be required in the production process. Conversely, there will be reduced exposure to dangerous chemicals in animal production such as pesticides and fungicides (Post, Reference Post2012) which can be injurious not only for humans if ingested but also for wildlife.
Growth hormones. As discussed in the ‘Growth media for proliferation, merging and maturation’ section, large-scale production of cell-based meat will likely require the addition of natural, or artificially manufactured, growth hormone (Post, Reference Post2012). This is not problematic for public or consumer health, as the growth hormone would not remain in the harvested tissue. But one of the big concerns consumers have about animals-based meat production is the use of growth hormones (and steroids) (Gatti, Reference Gatti2019). Hormonal growth promotants (HGPs) are naturally occurring hormones such as oestrogen, or synthetic alternatives, and are used on about 40% of Australian cattle to accelerate weight gain (Food-Standards-Code-Australia, 2011). According to research by the European Federation of Animal Health, a single consumer would need to eat more than 77 kg of beef from an HGP-treated beast in one sitting to get the same level of oestrogen hormone found in one egg (Food-Standards-Code-Australia, 2011). Hence on this aspect, the consumer ‘perception’ of cell-based meat may be far removed from reality.
Cell-based meat can be engineered to be healthier and more functional by either manipulating the culture media to change levels of nutrients, vitamins, fatty acids or fat content (Bhat et al., Reference Bhat, Kumar and Fayaz2015). Levels of these nutrients can also be controlled through addition post-harvest, but of course this can occur in any manufactured meat product and is not unique to cell-based meat.
Animal welfare
Ethical issues are increasingly important in our food choices, and the consequence has been the development of societal concerns. According to Cornish et al. (Reference Cornish, Raubenheimer and McGreevy2016) ‘the production of food from animals poses many ethical challenges’. These societal concerns are varied and encompass the right to kill animals and to prevent any suffering of animals (Hocquette, Reference Hocquette2016). Implicit in the prevention of suffering, often espoused by vegans and vegetarians, is the erroneous perception that all animals raised on farms undergo ‘suffering’. In a similar manner, some consumers use anthropomorphic considerations and assume animals in pens, or in intensive livestock system or in feedlots, undergo suffering. It is mostly consumers in industrialised, wealthy, Western cultures who hold these views, whereas consumers in less industrialised, lower wealth economies generally do not hold these views (Cornish et al., Reference Cornish, Raubenheimer and McGreevy2016). If cell-based meat production requires a regular, or irregular, biopsy sample from an animal, it is not clear whether this will allay the ethical concerns some consumers hold around animal production.
A major limitation in cell-based meat production is the need for a supply of bovine serum for the culture medium. About 50 l of bovine serum is required to make one burger (Mark Post cited on https://www.wired.com.uk), and this volume of serum requires blood from 91 to 333 foetuses (3-month-old foetus has 150 ml of blood, near full-term foetus has 550 ml of blood) (Jochems et al., Reference Jochems, van der Valk, Stafleu and Baumans2002). Hence until animal-free serum is available for muscle cell culture at industrial scale, the production of cell-based meat products will not meet consumers’ demands for animal welfare. Consideration of animal welfare in traditional animal production, and in cell-based meat production, is likely the most polarising and contentious of the consumer concerns.
Food safety
Safety is a very important issue for animal products (Hocquette, Reference Hocquette2016). Many consumers hold misperceptions that antibiotics, growth hormones and steroids/anabolics are used in all forms of animal production for meat. Certainly, and for good reason, the proliferative use of antibiotics for prophylactic reasons, and also as growth promotants (mainly in the poultry industry), needs to undergo dramatic reduction. Hence some argue that cell-based meat will be safer to eat. In addition, promoters of cellular meat argue that it will be free of microorganisms and parasites, as it will be produced without animals. However according to some, the high rate of proliferation required of stem cells will likely produce genetic instability which may result in sporadic cancerous cells (Hocquette, Reference Hocquette2016), which will require monitoring in HACCP plans (see later). At this stage it is unclear whether the growth hormones, nutrients and other chemicals (antibiotics, preservatives such as sodium benzoate) added to the growth media are safe in the context of human food, and this will need to be investigated and documented.
A key concern of regulators (see the ‘Regulation, labelling and hazard and critical control points’ section) will be food safety which requires implementation of auditable procedures in each step of the production chain as part of a HACCP plan for each individual company (see the ‘Regulation, labelling and hazard and critical control points’ section).
Consumer acceptance
Perhaps the most significant challenge for cell-based meat to overcome is that of consumer acceptance (Bryant and Barnett, Reference Bryant and Barnett2019). There is a diversity of opinions in the media regarding consumer acceptance and consumer concerns. Unfortunately, much of this is driven by the media, and the media tends to report itself, as well as over-representing the vegan and vegetarian point of view (Hopkins, Reference Hopkins2015). The diversity of opinion is well represented by comments on a news release titled ‘Lab grown meat could be in restaurants by 2021, cutting down land and water required to produce red meat by more than 90%’ (Gatti, Reference Gatti2019). The comments included quite a few stating that ‘lab meat will have less chemicals, less pesticides, no antibiotics and no hormones’ as well as ‘meat grown in a lab is disgusting and we already have too much Frankenfood in the USA’ and ‘does not sound natural or appetising’ with the majority of other comments being around ‘how great to cease producing and slaughtering animals’. Although some people also commented ‘how sad it will be to no longer see animals and sheep as part of the rural landscape’, some of these comments are very ill-informed, as it is likely that cell-based meat will be produced using more chemicals than animal-based meat production. Certainly these comments reflect the urban consumers’ ‘perceptions’ of animal-based meat production. Surveys conducted show that between 16% and 66% of consumers would be prepared to eat cell-based meat products although the concerns around cell-based meat include the perceived unnaturalness, perceived risks to human health and uncertainty regarding price and taste (Bryant and Barnett, Reference Bryant and Barnett2019). Consumer acceptance can only be theoretical as no product is presently available to display to consumers or to allow taste tests, and the perceived consumer acceptance is highly dependent on how the product is named (and framed). Using the name ‘clean’ meat or ‘animal-free’ meat invokes positive attitudes from consumers compared to using the names ‘cultured’ meat or ‘lab-grown’ meat (Bryant and Barnett, Reference Bryant and Barnett2019).
Many consumers do not think that cellular meat production will be the solution to reducing meat production; rather they prefer to reduce their meat consumption (Hocquette et al., Reference Hocquette, Lambert, Sinquin, Peterolff, Wagner, Bonny, Lebert and Hocquette2015). In fact, in a survey of 817 educated people, participants were not convinced that cellular meat production will be tasty, safe or healthy (Hocquette et al., Reference Hocquette2015). Concerns about cellular meat production as an unnatural and risky product also appear to be a significant barrier to public acceptance of the product (Bhat et al., Reference Bhat, Kumar and Bhat2017). Generally speaking, people might be ready to taste cell-based meat products but may not want to regularly consume cell-based meat either in restaurants or at home (Verbeke et al., Reference Verbeke, Sans and Van Loo2015).
Regulation, labelling and hazard and critical control points
Before it can reach the shelves, cell-grown meat will be required to go through regulatory hurdles and paperwork. There are presently 44 companies listed on the Australian clean meats website (https://www.cleanmeats.com.au), and of these, 19 are in the US. For the cellular meat industry in the US and other countries to succeed, companies need assurance that their product will be responsibly regulated, in the case of the US, by the United States Department of Agriculture (USDA) and the Food and Drug Administration (FDA). Although literature has existed on the considerations for regulation of cultured meat since 2013 to 2014 in both the US and the European Union (EU), this literature identified the regulations in place at the time were inadequate to deal with cell-based meat production without significant development (Stephens et al., Reference Stephens, Di Silvio, Dunsford, Ellis, Glencross and Sexton2018). The considerations in the US were that if the production is defined as explant (expanding existing muscle tissue), it would require FDA New Animals and Drugs application whereas if scaffold-based, this should follow FDA food additive regulation. Whereas in EU, cell-based meat production would be subject to novel food regulation via the European Food Safety Authority (EFSA) risk assessment. The exception here is that the EFSA novel food regulation excludes genetically modified food, which may not be the case for cell-based meat (Stephens et al., Reference Stephens, Di Silvio, Dunsford, Ellis, Glencross and Sexton2018).
In November 2018, the USDA and FDA announced an agreement for a joint regulatory framework for the production of cell-cultured food products derived from livestock and poultry. The agreement outlines the point of transfer as follows. ‘FDA oversees cell collection, cell banks, and cell growth and differentiation. A transition from FDA to USDA oversight will occur during the cell harvest stage. The United States Department of Agriculture will then oversee the production and labelling of food products derived from the cells of livestock and poultry’ (Piper, Reference Piper2019; Rollins and Rumley, Reference Rollins and Rumley2019). This agreement was formalised on 7 March 2019 in a memorandum signed by principals from USDA and FDA laying out the delegation of responsibility (Piper, Reference Piper2019; Rollins and Rumley, Reference Rollins and Rumley2019); however the details concerning inspection and the labelling process are still to be worked out by the respective agencies.
In some states in the US (e.g. Missouri), legislation has been introduced and sometimes passed, prohibiting cell-based meat companies from using the label ‘meat’. The United States Department of Agriculture’s labelling authority overrides that of the states; hence the USDA’s future ruling on what cell-based meat can be called will, in theory, be final. Cultured meat has already faced resistance from the US meat industry and will probably face a labelling battle once it comes on the market. Hence law suits and fights will likely proceed in court, whatever labelling the product has finally approved by the USDA (Piper, Reference Piper2019).
In Europe, a Brussels agriculture committee has approved a ban on producers of vegetarian food using nomenclature usually deployed to describe meat (Boffey, Reference Boffey2019). Instead proposed that terms such as ‘veggie discs’ rather than ‘veggie hamburger’ be used. The proposed terms will now be voted on by the full parliament after May’s European elections, before being put to member states and the European Commission. After the vote in the European Parliament on revisions to a food-labelling regulation, it is likely that any introduction of cellular meat products will face similar restrictions in labelling, particularly as Europe tends to be far stronger in banning any foods associated with increased chemical use during production, which is likely to be the case with cell-based meat. The possibility of cell-based meat being better for animal welfare may sway European regulators to be more lenient, as Europe in general is strongly pro-animal welfare.
In order to develop regulatory guidelines, the procedures for production must be clearly outlined. At this early stage, procedures are not developed; thus regulations will need to follow the development of documented procedures, and there are likely to be several or many pathways for production. Regulations presently being developed in USA and EU will be watched closely for providing guiding principles to regulators in other countries, where a cell-based meat production industry is developing.
Regulatory guidelines, HACCP plans and auditing will need to consider a number of steps and aspects, including governance at local, state and federal levels. The initial collection of samples will be governed by animal welfare acts. A HACCP plan is designed as a preventative food safety system in which every step in the manufacture, storage and distribution of a food product is scientifically analysed for microbiological, physical and chemical hazards. Thus for the production and processing of cell-based meat, a HACCP plan will be required to specify auditing for identification of all possible pathogens, possible physical contamination and the safety of chemicals added, including methods to prevent contamination at each HACCP step that are usually subject to either state or federal government agencies, depending on whether the product will be consumed locally or exported. Auditing procedures for cell-based meat production will also likely need to include monitoring and quality assurance function at each stage, testing of genetic stability and management of metabolic waste by disposal or recycling (Stephens et al., Reference Stephens, Di Silvio, Dunsford, Ellis, Glencross and Sexton2018).
Other possibilities to address consumer concerns and food security
There are other possibilities to address consumer concerns and food security. Some of these are already in progress and have variable implementation in countries around the world; others have been researched and are yet to be implemented, and some possibilities require extensive research. These are discussed here.
Meat substitutes
There has been a rapid increase in plant-based protein products on the supermarket shelves, many of which are presented in a simulated meat form, such as veggie burger and veggie sausages. The mainstream meat substitutes include soy-based products, wheat-based products, pea protein and mycoproteins with a high and increasing value in the world markets (Hocquette, Reference Hocquette2015). Protein for meat substitutes can also be derived from algae and insects (see Table 1). Consumers are increasingly aware of the potential health benefits of the meat substitutes; hence the demand is centred around good health and wellness. The global meat substitute market size was estimated at US$3.71 billion in 2016 with projections of expansion by 7.5% every year to 2022 (Grand-View-Research, 2018). Growing preference towards a vegan diet owing to several health benefits and environmental concerns is the major factor driving the market. There are many companies with products in the substitute meat market, and three important companies with high publicity include Impossible Foods (US) that produces a burger that ‘bleeds’, Beyond Meat whose products are made from pea protein and Quorn Foods Ltd (UK) that have been around for a while. Many consider meat substitutes manufactured from plant proteins and mycoproteins will have a greater potential than cell-based meat in the near future (Bonny et al., Reference Bonny, Gardner, Pethick and Hocquette2015).
Reduce food waste or increase utilisation of waste streams from manufacturing
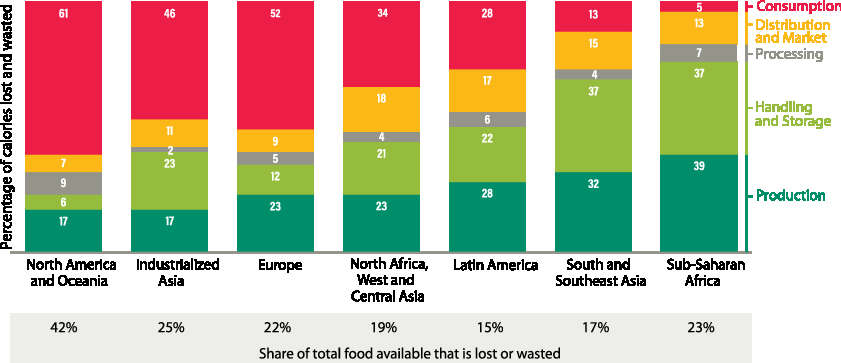
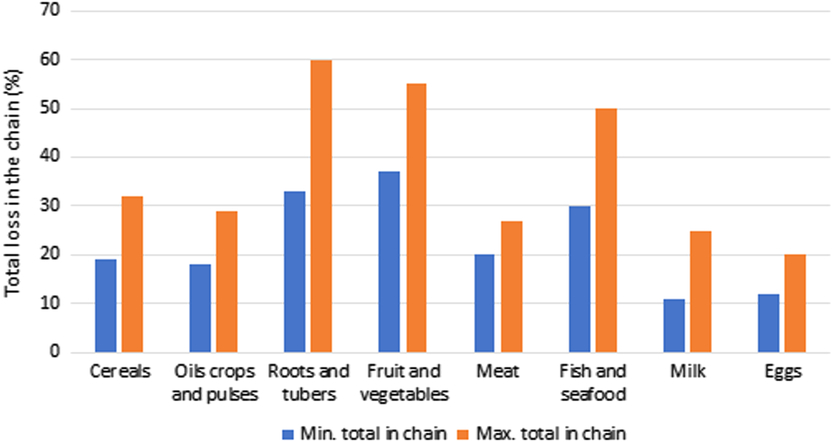
In 2013, it was estimated that approximately one-third of all food produced was wasted (Hocquette, Reference Hocquette2016). This varies with region as North America and Oceania show the highest food waste of 42% compared to the lowest of 15% for Latin America (Lipinski et al., Reference Lipinski, Hanson, Lomax, kitinoja, Waite and Searchinger2013) (Figure 7). Hence reductions in food waste will have a direct benefit for increasing food security, while addressing environmental concerns by increasing efficiency. This waste occurs on the farm, during transport, manufacturing, storage, at retail and also in the consumer’s home. For North America and Oceania, most of the waste (61%) occurs during consumption, whereas for sub-Saharan Africa, most of the waste (39%) occurs during production (Lipinski et al., Reference Lipinski, Hanson, Lomax, kitinoja, Waite and Searchinger2013) (Figure 7). The waste also varies significantly with commodity; the total loss in the chain for meat is in the range of 20% to 27% compared to roots and tubers where the total loss is 33% to 60% (Figure 8) (FAO, 2011).
Food lost or wasted by region and stage in the value chain in 2009 (percentage of kilo calories lost and wasted). Source: From Lipinksi et al. (Reference Lipinski, Hanson, Lomax, kitinoja, Waite and Searchinger2013).
Total losses (%) in the chain for different categories of food. Source: Derived from data in FAO (2011).
Extraction of protein and macronutrients from all parts of the animal and also from waste streams of animal processing and conversion from non-edible to edible is also important. The yield of the carcass (fat, muscle and bone) expressed as a % of the live weight of an animal is about 50% to 55% for sheep and cattle and 70% to 75% for pigs and poultry. The proportion of carcass meat from the animal is only ~33% for cattle and sheep with ~13%, ~10.5% and 3.5% of the animal comprising organs, skin/hides and blood, respectively (http://meattechnologyblog.blogspot.com/2014/01/carcass-yield.html). Trimmed fat and muscle are retained and utilised for manufacturing, but for example, often blood and also bone end up as blood and bone meal for animal feed. There are many opportunities to extract more edible nutrients from the animal, including from blood, organs, hides and hoofs/trotters (Toldra et al., Reference Toldra, Aristoy, Mora and Reig2012 and 2016). Westernised countries often ‘waste’ or underutilise parts of the animal that other cultures prize for the recognised nutritional value. Some religions focus on respect for the life of an animal being slaughtered, including offering a prayer of thanks for every animal slaughtered (Farouk, Reference Farouk2013; Farouk et al., Reference Farouk, Pufpaff and Amir2016). A component of respecting the life of animals, and their use for human food, should include efficient use of the whole animal, rather than focusing on just the skeletal muscle for human food.
Dietary changes, re-distribution of nutrients
In 2013, the US and Australia were the highest annual consumers of meat (excluding fish and seafood) in the world, being in the range of 115 to 116 kg/person per year compared to the majority of the African continent which has an average annual consumption of 5 to 40 kg/person per year (Ritchie and Roser, Reference Ritchie and Roser2017). It is well recognised that the high levels of obesity, CVD and other diseases could be reduced in affluent societies, including Australia and US by reducing food consumption, including meat. Malnutrition is an underlying cause of death of 2.6 million children each year, while anaemia, from a lack of iron in the diet, affects 35% of the world’s population (https://www.gainhealth.org/about/). Thus it is clear that while affluent societies need to decrease their food, and meat consumption, the poor countries suffering drastically need to increase their food, and also meat consumption.
Many consumers consider animal products to be the most desirable way to access nutrient-rich and tasty protein. Meat is commonly perceived as the core of protein delivery as it has more protein, micronutrients and amino acids per kilogram of all the dietary protein sources (Waughray, Reference Waughray2018). In addition, consuming meat is considered a sign of affluence for the world’s emerging middle classes. Alternatives to meat exist, and young people seem to be shifting towards ‘non-meat’-based food. It will be interesting to observe how far this shift to plant-based meals occurs as there is a predicted increase in the consumption of all meats (beef, pork, poultry, sheepmeat) across all of the continents and all of the 31 diverse countries included in the FAO (2018).
Considering a strict vegan diet (no milk, eggs, meat, dairy) is associated with a higher risk of nutrient deficiencies, especially in the vulnerable young and elderly (Hocquette, Reference Hocquette2016), and this does not seem to be a solution to the concerns around animal production across all consumers in all countries.
Improvements in animal welfare
Alternative ways to consider the animal welfare aspects of animal production are to evaluate the critical points where animal welfare may be compromised and introduce technological innovation and industry transformation in how meat is produced.
Research has been conducted on the stressors encountered between farm and slaughter (Grandin, 1997 and Reference Grandin and Grandin1998; Ferguson and Warner, Reference Ferguson and Warner2008; Warner et al., Reference Warner, Greenwood, Pethick and Ferguson2010) and the effects on meat quality (Voisinet et al., Reference Voisinet, Grandin, O’Connor, Tatum and Deesing1997; Warner et al., Reference Warner, Ferguson, Cottrell and Knee2007; Edwards et al., Reference Edwards, Grandin, Engle, Ritter, Sosnicki, Carlson and Anderson2010), and some of the results have been implemented, resulting in improvements in animal welfare. Recently, infra-red video cameras have been used to measure physiological stress responses on the farm and at the slaughter plant (Jorquera-Chavez et al., Reference Jorquera-Chavez, Fuentes, Dunshea, Jongman and Warner2019). These technologies offer promise for continuous monitoring of stress as well as disease throughout the life of the animal, potentially enabling continued improvements in animal welfare. The Danes have developed low-stress handling systems for handling of pigs pre-slaughter which have demonstrated improvements in welfare as well as in meat quality (Aaslyng and Barton-Gade, Reference Aaslyng and Barton-Gade2001), hence less wastage.
The European Union–funded Welfare Quality® project was a very large project with significant outcomes for defining and standardising welfare and developing animal-based measures across the EU and also in other countries (Blokhuis et al., Reference Blokhuis, Veissier, Miele and Jones2010). Interestingly, retailers and the food industry, in some countries such as those in Europe, and also Australia, have been very successful in identifying a consumer demographic who responds to issues of animal welfare and food quality (Buller et al., Reference Buller, Blokhuis, Jensen and Keeling2018). This demand for higher welfare supply chains has been met by retailers as there is now a commodity value on welfare, in some countries. As a result of both consumer demand and retail recognition of the commodity value of animal welfare, livestock production practices in many countries have recently shown significant improvements through incorporating new concepts to improve animal welfare and reduce animals suffering (Hocquette and Chatellier, Reference Hocquette and Chatellier2011).
Mobile slaughter units are being developed around the world, where the slaughtering occurs either on the farm or in a small village or town (Carlsson et al., Reference Carlsson, Frykblom and Lagerkvist2007; Eriksen et al., Reference Eriksen, Rødbotten, Grøndahl, Friestad, Andersen and Mejdell2013), and these are predicted to reduce the stressors as well as environmental costs attributed due to transport of animals. These approaches listed earlier will never satisfy the consumers committed to cessation of all forms of animal production; although this segment is vocal and media-grabbing, they are not the majority of the population.
Changes in livestock production
In the future, the quality of animal products will be defined by the sustainability of the production system (Scollan et al., Reference Scollan, Greenwood, Newbold, Ruiz, Shingfield, Wallace and Hocquette2010). There has been continued progress in identifying the components of the beef cattle production system which can be changed, in order to reduce methane emissions in particular. Intensive cattle finishing in feedlots has been shown to reduce GHGEs, compared to pasture-based systems (4.6 to 9.5 v. 10.2 to 12.4 kg CO2-e/kg LW, respectively) (Wiedemann et al., Reference Wiedemann, McGahan, Murphy and Yan2016a and Reference Wiedemann, Davis, McGahan, Murphy and Redding2017a), and the application of lignite to feedlots reduces ammonia emissions by a further 30% (Sun et al., Reference Sun, Bai, Shen, Griffith, Denmead, Hill, Lam, Mosier and Chen2016). There are also options being researched for pasture-based systems, including carbon capture by use of permanent pastures (Soussana et al., Reference Soussana, Tallec and Blanfort2010) and through planting of trees (Doran-Browne et al., Reference Doran-Browne, Wootton, Taylor and Eckard2018). Furthermore, the emissions per unit product can be decreased either by increasing livestock production efficiency or by targeting the source of the emissions, for example, by feeding or using novel technologies to reduce methane (Scollan et al., Reference Scollan, Greenwood, Newbold, Ruiz, Shingfield, Wallace and Hocquette2010). For example, in vitro ruminal testing of seaweed as a food source for cattle has been shown to reduce methane production by up to 50%, depending on the amount administered (Kinley et al., Reference Kinley, de Nys, Vucko, Machado and Tomkins2016). Feeding seaweed to cattle to reduce methane emissions shows a lot of promise and obviously requires further investigation. Other feedstuffs are being investigated, and progress will be made in the future. Studies have also shown that methane emission is heritable and thus genetic selection can be used to reduce methane emissions from cattle production (Pickering et al., Reference Pickering, Oddy, Basarab, Cammack, Hayes, Hegarty, Lassen, McEwan, Miller, Pinares-Patiño and de Haas2015).
Summary and conclusions
Consumer demand for cellular meat production derives from concerns over environment, animal welfare, consumer and public health aspects of animal production, use of antibiotics in the animal industries and food security.
As a concept, it has been suggested that cultured meat overcomes some of the ethical problems of livestock production but has also been criticised as a problematically techno-centric, profit-motivated approach which will be dominated by large corporations (Lynch and Pierrehumbert, Reference Lynch and Pierrehumbert2019).
The present limitations to cellular meat production include the identification of pluripotent cell lines in mammals, availability of cost-effective bovine-serum-free growth medium for cell proliferation and maturation, scaffold materials for cell growth, scaling-up to an industrial level and at what stage mixing of myo-, adipo- and fibrocytes can occur. In addition, consumer perceptions that cell-based meat production will result in improvements to animal welfare and the environment have been challenged, with the outcome needing to wait until cell-based meat is close to a commercial reality. Challenges for cell-based meat products include the simulation of nutritional attributes, texture, flavour and mouthfeel in animal-derived meat products. There is some question over whether consumers will accept the technology, but likely there will be acceptance of cell-based meat products in particular market segments. Currently, the cost of growth media, industry scale-up of specific components of the cell culture process, intellectual property sharing issues and regulatory hurdles mean that it will likely require take an extended period for cellular meat to be consistently available in high-end restaurants and even longer to be available for the mass market (Waughray, Reference Waughray2018).
Cellular meat production will likely be more efficient in utilising agricultural feedstocks than traditional forms of meat production as it may substitute industrial processes for the internal biological work done by animal physiology (Mattick et al., Reference Mattick, Landis and Allenby2015a). Alternatively, maybe the upscaling and costs of production and technology development will not be sufficient for the price to drop substantially, and this high-tech food will remain at best an exclusive gastronomic, molecular cuisine (Banis, Reference Banis2018).
The plant-based meat analogues are very well developed, with products such as the ImpossibleTM Burger and other products already available. These developments may make the development of cellular meat products obsolete (Banis, Reference Banis2018). But the challenges remain of mimicking not only the flavour, shape and structure of real meat, but also the required changes in regulation and labelling.
Acknowledgements
The author acknowledges advice and assistance with the manuscript content from Dr. Jeremy Cottrell and Dr. Natalie Doran-Browne at Melbourne University, Prof. Peter Purslow at Universidad Nacional del Cetro de la Provincia de Buenos Aires in Argentina and Prof. Paul Mozdziak at North Carolina State University.
R.D. Warner 0000-0001-5313-8773
Declaration of interest
The author declares no competing interests.
Ethics statement
Not applicable.
Software and data repository sources
None of the data were deposited in an official repository.


