

The prevalence of obesity is increasing globally and in India( Reference Misra, Pandey and Devi 1 , Reference Bhardwaj and Misra 2 ). Asian Indians have a high percentage of body fat (%BF), abdominal obesity and excess liver fat (consequently, multiple metabolic perturbations comprising the metabolic syndrome), insulin resistance, high pro-coagulant tendency and subclinical inflammation( Reference Misra, Chowbey and Makkar 3 ). Increasing obesity and a dysmetabolic state predisposes Asian Indians to obesity-related non-communicable diseases (OR-NCD) such as type 2 diabetes mellitus and CVD at a young age( Reference Gupta, Misra and Vikram 4 , Reference Misra and Shrivastava 5 ). Rapidly changing lifestyles (imbalanced diets, physical inactivity) as a result of urbanisation and mechanisation are key factors leading to OR-NCD( Reference Misra 6 ). Several studies have shown that cardiovascular risk is closely related to abdominal obesity in South Asians( Reference Joshi, Islam and Pais 7 ). Clearly, research is needed to evaluate effective methods for weight loss and for reducing abdominal obesity.
Dietary manipulation is important for weight and cardiovascular risk factor management( Reference Dombrowski, Knittle and Avenell 8 ). High-protein diets have been used for reducing weight. Diets high in protein are potentially effective in promoting satiety, inducing weight loss and maintaining lean body tissue( Reference Dombrowski, Knittle and Avenell 8 , Reference Kanjilal, Prasad and Kaimal 9 ). Some studies on energy-controlled diet plans with protein meal replacements have been shown to be safe and effective as a weight-management strategy by multiple mechanisms including adherence to compliance in both obese and diabetic subjects( Reference Dombrowski, Knittle and Avenell 8 , Reference Noakes, Foster and Keogh 10 ). On the basis of these studies, a feasible strategy for weight loss could be replacing whole meals with a protein-rich diet.
Diets consumed by Asian Indians are high in refined carbohydrates, SFA and trans-fats, salt and sugar, and low in fibre, n-3 PUFA and protein( Reference Gulati and Misra 11 ). Specifically, data show a relatively lower intake of protein in Asian Indians (10·8 % in rural and 10·9 % in urban populations) v. North Americans in the USA (nearly 16 % )( 12 , 13 ). The protein digestibility adjusted score is also of inadequate quality( Reference Swaminathan, Vaz and Kurpad 14 ). This could be attributed to the prevalence of a vegetarian dietary pattern among Asian Indians. Whether a high-protein diet provides benefits in terms of weight loss, improvement in skeletal muscle anatomy and physiology, and cardiovascular risk factors in Asian Indians has not been studied. Simple strategies such as dietary protein manipulation, which may result in weight loss and also benefit the metabolic profile, are needed for Asian Indians to prevent OR-NCD.
The present study was designed to determine whether a high-protein meal replacement (HPMR) diet produces greater weight loss and improvement in the cardiometabolic profile compared with a control diet in overweight/obese Asian Indian subjects.
Methods
This study was conducted according to the guidelines laid down in the Declaration of Helsinki and Indian Council of Medical Research Ethical Guidelines for Biomedical Research for Human Participants( 15 ). All procedures involving human subjects/patients were approved by an independent review committee, ‘Ethics Committee for Human Research’ Written informed consent forms, approved by the ethics committee, were signed by the study participants. The study was registered at clinicaltrials.gov (registration no. NCT02144636).
A total of 122 subjects (fifty male and seventy-two female) aged between 21 and 65 years and having BMI≥23 kg/m2 (overweight as per ethnicity-specific cut-off values for Asian Indians) were recruited( Reference Misra, Chowbey and Makkar 16 ). Subjects with diabetes, CHD and advanced organ damage, on lipid-lowering therapy, on any other drug affecting kidney or liver functions within 30 d of study entry, pregnant and lactating women, and those allergic to the product were excluded. Anthropometric measurements, body fat estimation and biochemical measurements were carried out as described previously( Reference Misra, Misra and Wijesuriya 17 ). For measurement of weight, the subject was instructed to stand still on a platform, with body weight evenly distributed between both feet. After removing heavy clothing, weight was measured to the nearest 0·1 kg. Height was measured using a stadiometer to the nearest 0·1 cm with the subject’s head held in the Frankfort plane. BMI was calculated as weight (kg)/height (m2). Waist circumference (WC) was measured midway between the iliac crest and the lowermost margin of the ribs, with the subject breathing quietly.
Fat mass (FM), fat-free mass and %BF were assessed using the Tanita Multi-Frequency Body Composition Analyzer SC-330 (Tanita Corporation).
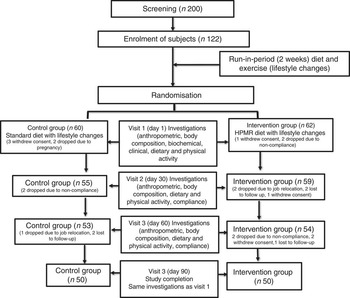
A free-living, randomised (using block randomisation with variable block size) controlled, open-labelled, parallel-arm study design (Fig. 1) was used to compare two diets over a period of 3 months after a run-in period of 2 weeks. Patients were given dietary advice at the time of enrolment. During the run-in period, all subjects consumed a standard diet formulated according to guidelines for Asian Indians( Reference Misra, Sharma and Gulati 18 ), which was continued in the control group for a further 3 months. Dietary counselling was provided to all participants according to height, weight and physical activity levels. Instructions were given verbally and in written form, and were discussed in detail individually and during group meetings. The general qualitative recommendations for both control and intervention diet groups were to consume a diet rich in vegetables and fruits; select whole-grain, high-fibre foods (except when the meal is being replaced by HPMR); select fat-free or low-fat dairy products; to limit foods containing partially hydrogenated vegetable oils; curtail consumption of sugar-sweetened beverages and foods with added sugar; cut down on salt; and limit alcohol intake. All study subjects (control and intervention group) were asked to visit the study site once in 30 d when dietary advice was further reinforced. Participants were encouraged to share their experiences with each other. We attempted to achieve a 2092 kJ (500 kcal) reduction from day 0 onwards for all subjects in the control and intervention groups. The aim was for this reduction to be maintained throughout the study. The subjects were advised 45 min of brisk walking daily. Physical activity was assessed using the Global Physical Activity Questionnaire throughout the study during their monthly visits to the study site. We attempted to achieve similar negative energy balance in both groups. Most of the participants were able to maintain negative energy balance as assessed by compliance checks. Subjects were following the diet and exercise regimen for at least 6 out of 7 d in a week. The compliance for diet and exercise was similar. Diet and exercise status was assessed telephonically on a biweekly basis, through text messages and face-to-face interactions (once every month), and by cross-checking with the spouse or a close relative of the subject in both study arms (Fig. 1). The diet and exercise record was maintained in a compliance log. On the basis of this log, compliance ranged from 75 to 85 % of days (averaging about 80 %). There was no difference in compliance between the intervention and control groups.
Flow chart of study subjects. HPMR, high-protein meal replacement.
Dietary composition was as follows – control diet: 60 % carbohydrate, 25 % fat and 15 % protein; and intervention diet (HPMR): 47 % carbohydrate, 24 % fat and 29 % protein. Participants assigned to the HPMR group were instructed to replace two daily meals (mainly breakfast and dinner, but flexible replacement allowed) with commercially available whey and soya protein isolates in the form of a protein shake (total amount 200–250 ml/serving). Low-fat (fat 1·5 %) milk (200 ml) was used as a vehicle to administer the protein powder. Diet data were collected using 24 h dietary recall and FFQ at enrolment, baseline and once every month during the study. The purpose of the FFQ was to check the pattern of food consumption at each point of contact. Diet data collected using 24 h dietary recall (analysed using software, ‘DietCal’ version 5.0; Profound Tech Solution; http://dietcal.in/) based on values from the Nutritive Value of Indian Foods), are presented in Table 1.
Macronutrient distribution of the control and intervention diets at enrolment, after run-in and during the intervention period (Mean values and standard deviations)

* Average energy intake during the intervention period.
Subjects’ information was recorded in a call log and in case-report forms, and regularly reviewed by the study coordinators. Subjects were asked to bring empty boxes of the protein powder given as investigation product at the time of their visit to the study site. Participants met with the investigators monthly to provide updates on diet and lifestyle compliance, and for general check-ups. Compliance to and acceptability of the diet was good (80 %), as meal replacement shakes were convenient, of known nutritional value, saved time in cooking especially for subjects staying away from family. Weight loss occurring because of the HPMR diet was also a motivational factor for good compliance. Information was collected on any adverse effects of HPMR from the study subjects, such as acidity, bloating, dyspepsia, etc. No such side effect was reported by any of the subjects during the 90 d of intervention.
Sample size
Sample size was computed for the two-group parallel superiority trial with the primary outcome as percentage body weight reduction, assuming that by day 90 (post-intervention) the expected percentage reduction in mean body weight in the control arm would be 2 % and an additional 3 % in intervention arm, and that pooled sd would be 1·8, that is, an effect size of 1·67 (3/1·8) per sd. The anticipated effect size and pooled standard deviations are from a pilot study conducted on fourteen subjects at our centre (data not shown). To detect this difference with a 95 % confidence level and 80 % power, forty-five subjects were required in each of the study arms. Assuming about 20 % loss to follow-up, 122 subjects were enrolled in the study. These 122 subjects were randomly allocated to the control (n 60) and test groups (n 62).
Statistical analysis
Quantitative variables were assessed for approximate normal distribution and were summarised as mean values and standard deviations. Student’s t test was used to compare the difference in mean values between the two groups. Variables following non-normal distribution were summarised by medians and 25th, 75th percentiles and the Wilcoxon rank-sum test was used to compare differences in the distribution between the two groups. The mean percentage change from baseline to the end of the intervention (at day 90) was also computed in each of the two groups. ANCOVA was used to compute mean values at day 90 post-intervention adjusting for age, family type and baseline values of outcome parameters. To compute the adjusted mean for percentage change, only age, family type and baselines values were included. For both absolute differences at day 90 post-intervention and percentage change results have been reported as effect size (95 % CI) and P value. We used ‘intention-to-treat’ and ‘per-protocol’ analysis for analysing data. In the ‘intention-to-treat’ analysis, for missing values, we used the ‘last observation carried forward’ method for imputing the values, and the ‘per-protocol’ analysis was used for analysing the data of subjects who completed the study.
Anthropometric measurements were taken at baseline, 30, 60 and 90 d to compare the difference in the outcome variable during the intervention period between the control and intervention groups. Considering a correlated data structure, generalised estimating equation (GEE) with and without covariates (age, family type and baseline outcome variable) was used. Groupwise results of the GEE analysis have been reported as mean values with their standard errors with the effect size and 95 % CI and P value for each outcome variable. Stata12.0 statistical software was used for data analysis. In this study, P<0·05 has been considered statistically significant.
Results
Out of 122 enrolled subjects, 100 subjects completed the study (fifty subjects in each study arm). Sex-wise distribution of the data was: the control group, twenty-five males and thirty-five females; and the HPMR group, twenty-seven males and thirty-five males. There was no statistical difference in the socio-demographic parameters of the study population between the two groups except for age and family type (Table 2). As per ‘intention-to-treat’ analysis, overall additional mean reduction compared with the control arm in the parameters (after adjusting for age, baseline values, family type for various parameters over 90 d) were as follows: body weight (primary outcome), −2·7 kg (95 % CI −3·3,−2·1; P<0·001); WC, −2·8 cm (95 % CI −3·6,−1·9; P<0·001); and BMI, −0·9 % (95 % CI −1·4,−0·5; P<0·001) (Table 3). Similar results were observed in the ‘per-protocol’ analysis.
Baseline characteristics (Numbers and percentages)

* Coparceners staying together.
† Parents staying together with married children.
Results of the generalised estimating equation (GEE) for overall comparison of anthropometric parameters between the control and intervention groups during 90 d intervention (Mean values with their standard errors; coefficients and 95 % confidence intervals)

* Adjusted for age, family type and baseline outcome variable.
As per ‘intention-to-treat’ analysis, additional mean reduction in the following parameters were observed in the HPMR group compared with the control group: body weight, 4·9 % (95 % CI 3·8, 6·1; P<0·001); WC, 3·8 % (95 % CI 2·5, 5·1), P<0·001), %BF, 6·3 %, (95 % CI 4·3, 8·2; P<0·001); systolic blood pressure, 2·8 % (95 % CI 0·4, 5·1; P=0·002); diastolic blood pressure, 3·5 % (95 % CI 0·7, 6·3; P= 0·01); total cholesterol, 2·5 %, (95 % CI 1·6, 3·5; P<0·001); LDL-cholesterol, 7·3 % (95 % CI 1·7, 12·9; P<0·01); serum TAG, −11·9 mg/dl (95 % CI −21·1, −2·7; P<0·01); post-oral glucose tolerance test (post-OGTT) blood glucose, 7·3 % (95 % CI 1·4, 13·1; P=0·02); alanine aminotransferase (ALT), 22·0 % (95 % CI 2·1, 42; P=0·03) and aspartate aminotransferase, 15·2 % (95 % CI 0·9, 29·5; P=0·04) (Table 4). A significant reduction was also observed in serum insulin and high-sensitivity C-reactive protein (hs-CRP) levels. Reduction in fasting serum insulin in the HPMR v. the control arm was 3·8 v. 0 % (P=0·002), in post-OGTT serum insulin was 50·3 v. 77·3 mU/l (P=0·005) and in hs-CRP was 16·7 v. 0 % (P=0·002) (Table 4).
Changes in outcome parameters post-interventionFootnote * (Mean values and standard deviations; medians and 25th, 75th (p25, p75) percentiles; differences and 95 % confidence intervals)
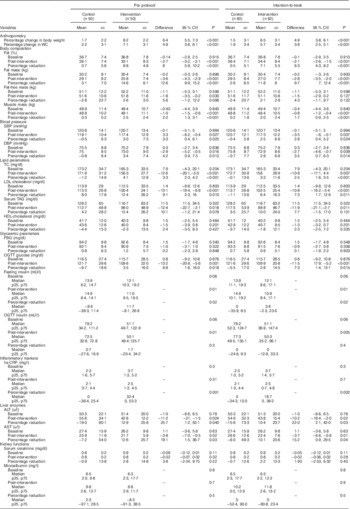
WC, waist circumference; SBP, systolic blood pressure; DBP, diastolic blood pressure; TC, total cholesterol; FBG, fasting blood glucose; OGTT, oral glucose tolerance test; hs-CRP, high-sensitivity C-reactive protein; ALT, alanine aminotransferase; AST, aspartate aminotransferase.
* For subjects who were not available post-intervention, the last observation values were carried forward as post-intervention values assuming that the intervention did not have an effect on them.
† Post-intervention values are adjusted for age, family type and baseline outcome variable.
Discussion
We show for the first time that the HPMR diet leads to significant weight loss, reduction in WC, body FM, fasting serum insulin, post-OGTT serum insulin, post-OGTT blood glucose, lipid variables, hs-CRP and liver transaminases in Asian Indians. These findings are of practical and clinical significance keeping in mind the body composition and dysmetabolic state of Asian Indians, and their greater tendency to convert to diabetes from prediabetes stage.
A decade ago, a meta-analysis of six randomised control trials (ranging from 3–12 months) in Caucasians reported a 7 % body weight reduction in subjects on a HPMR diet (P<0·01) v. 3 % in the subjects on an energy-controlled diet( Reference Heymsfield, van Mierlo and van der Knaap 19 ). Such magnitude of weight loss, as has been recorded in all randomised control trials with a high-protein diet to date, and as has been observed with the use of the oral drug orlistat, is comparable with that recorded in the present study (weight loss with HPMR; 6·5 v.·1·5 % of body weight in the control group). Of note, even such ‘apparently small’ magnitude weight loss is important for the prevention of diabetes and other OR-NCD. For example, the Diabetes Prevention Program showed that 1 kg of weight loss is associated with a 16 % risk reduction in the development of diabetes( Reference Hamman, Wing and Edelstein 20 ). Further, Nanditha et al., in a study on Asian Indians, showed that a slight decrease in BMI (0·406; 95 % CI 20·676, 20·136; P=0·002) could lead to significant conversion to a normoglycaemic state from a state of impaired glucose tolerance( Reference Nanditha, Ram and Snehalatha 21 ). As Asian Indians have a high prevalence of prediabetes and the metabolic syndrome, and rapid conversion to diabetes( Reference Misra, Ramchandran and Jayawardena 22 , Reference Sattar and Gill 23 ), such a strategy may also be useful for the prevention of diabetes in this ethnic group. Such dietary manipulations may also be useful in Asian Indians who consume diets low in protein and have low skeletal muscle mass( Reference Banerji, Faridi and Atluri 24 ). Further, such a high-protein diet without contribution from non-vegetarian sources would be appropriate for largely vegetarian Asian Indians. Finally, the paucity of any adverse event with meal replacement is reassuring, whereas, the use of orlistat (or of other drugs for weight reduction) may be associated with adverse drug reactions leading to high (up to 39 %) discontinuation rates( Reference James, Avenell and Broom 25 ).
Asian Indians possess a high percentage of body fat at BMI levels lower than Caucasians. Any weight loss strategy in Asian Indians which targets loss of FM along with weight would be metabolically beneficial. A meta-analysis by Krieger et al.( Reference Krieger, Sitren and Daniels 26 ) showed a greater FM loss (range 2·05–5·57 kg) with high-protein diets v. diets with higher percentage of energy from carbohydrates. These observations are in line with the findings of the present study, which showed a FM loss of 3·4 kg in the HPMR diet group compared with 0·7 kg in the control diet group.
Further, we found that a HPMR diet-based intervention led to significant reduction in WC, a finding which is particularly beneficial for Asian Indians who have multiple adverse effects associated with abdominal obesity( Reference Misra and Shrivastava 5 ). For example, Joshi et al.( Reference Joshi, Islam and Pais 7 ) showed that abdominal obesity (high waist:hip ratio) increases the odds of developing myocardial infarction by 2·44 (2·05–2·91) times in South Asians. Importantly, studies have also shown that a 1 cm increase in WC or a 0·01 unit increase in the waist:hip ratio measurement was associated with a 2 and 5 % increase in the risk for CVD, respectively( Reference Lu, Ma and Wang 27 ). Taking cognizance of these data, a 2·8 cm reduction in WC with the HPMR diet, as seen in the present study (after adjusting for covariates), may result in a 5·6 % decrease in CVD, which is clearly significant in the Indian context. Besides weight, body fat and WC, improvement of other parameters comprising the metabolic syndrome were observed in our study. The reduction observed in total cholesterol and serum TAG in the HPMR group in the present study is similar to the improvement in lipids reported with the use of high-protein diets seen in other studies( Reference Yancy, Olsen and Guyton 28 – Reference Samaha, Foster and Makris 30 ). Improvement in blood pressure in the HPMR group is also in line with the findings of the OmniHeart randomised trial, which shows that partial substitution of carbohydrate with protein can lower blood pressure in prehypertensive and hypertensive subjects and reduce estimated CVD risk( Reference Appel, Sacks and Carey 31 ). One of the central features of insulin resistance and the metabolic syndrome, hyperinsulinaemia, was also reduced in the HPMR group in our study, similar to data from previous studies( Reference Kitabchi, McDaniel and Wan 32 ). Importantly, we observed a significant reduction (16·7 %) in hs-CRP levels in subjects of the HPMR group, a particularly apt observation as Asian Indians typically exhibit higher levels of hs-CRP than white Caucasians( Reference Chandalia, Cabo-Chan and Devaraj 33 ). The reason for this is not entirely clear. This could be related to higher subcutaneous fat( Reference Munoz, Abate and Chandalia 34 ), hepatic fat( Reference Nigam, Bhatt and Misra 35 ) or to a high intake of SFA and trans-fat( Reference Gupta, Shah and Goel 36 ). Interestingly, two components of the metabolic syndrome, fasting blood glucose levels and HDL-cholesterol, did not change after intervention with HPMR diets in our study. Although the beneficial effects on components of the metabolic syndrome could be explained by weight and fat loss alone, some believe that other mechanisms may be responsible. For example, studies have shown that whey proteins contain certain compounds that act as natural angiotensin-converting-enzyme inhibitors, which could possibly lead to lowering the blood pressure( Reference De Leo, Panarese and Gallerani 37 ).
It is of significance to note the decrease in hepatic transaminases, particularly ALT levels, in the treatment group. This could be due to a decrease in hepatic TAG accumulation or a decrease in steatohepatitis. It would be interesting to research this issue further by accurate estimation of hepatic fat and inflammation using proton magnetic resonance spectroscopy or liver biopsy.
The mechanisms by which high-protein diets produce weight loss continues to be researched. Possible mechanisms include increased satiety( Reference Westerterp-Plantenga, Lemmens and Westerterp 38 , Reference Johnstone, Horgan and Murison 39 ) by inhibiting appetite and by reducing food intake. Satiety is influenced by postprandial amino acid concentrations through stimulation of gastrointestinal hormones cholecystokinin, Peptide YY and glucagon-like peptide-1( Reference Paddon-Jones, Westman and Mattes 40 – Reference Kissileff, Carretta and Geliebter 42 ). High-protein diets also influence the hypothalamic control of energy balance, mostly in the arcuate nucleus. Further, high protein concentration seems to reduce reward-driven eating behaviour or motivation to eat in the mesolimbic system. In the background of these mechanisms of a high-protein diet on satiety and food intake, it is important to note that increased satiety with high-protein diets has been reported in >60 % of studies( Reference Wycherley, Moran and Clifton 43 ).
It is also important to recognise that the protein shake used in the study is a combination of fast-acting whey and slow-acting casein proteins (whey:casein; 64:36). Both may have unique roles in weight loss and in increasing the muscle mass when combined with physical activity. Several studies have shown that leucine is essential for muscle protein synthesis( Reference Kurpad, Raj and El-Khoury 44 ) by enhancing the activation of the mechanistic target of rapamycin signalling( Reference Karlsson, Nilsson and Nilsson 45 , Reference Kimball and Jefferson 46 ) pathway and AMP-activated protein kinase in the hypothalamus( Reference Cota, Proulx and Smith 47 ).
Further, high-protein diets may also play an important role in energy balance through diet-induced thermogenesis and ketosis pathways, consequently leading to weight loss( Reference Astrup 48 – Reference Smeets, Soenen and Luscombe-Marsh 50 ). Specifically, diet-induced thermogenesis increases after protein ingestion by approximately 30 %, but only by 10 % after carbohydrate ingestion and by 5 % after fat ingestion( Reference Cuenca-Sanchez, Navas-Carrillo and Orenes-Pinero 51 ). Interestingly, data show that animals and humans have behavioural strategies to avoid protein shortage that is, a low-protein diet tends to increase food intake to meet protein requirements( Reference Whitedouble dagger, Porter and Martin 52 ).
Despite the benefits of HPMR as discussed above, adverse effects of these diets have been debated, particularly in the context of renal functions. Long-term elevation in glomerular filtration rate after high-protein consumption has been reported to be detrimental( Reference Friedman 53 ). Although a high-protein diet is not recommended for individuals with chronic renal insufficiency, there is little evidence that a high-protein intake is unsafe for healthy individuals( Reference Friedman 53 ). Importantly, we did not observe any harmful effect of the HPMR diet on liver and kidney functions over a period of 3 months (Table 4). In fact, there was significant improvement in liver enzymes in the meal replacement arm, which could be attributed to weight loss.
There are certain limitations of this study. First, the lack of blinding between the two groups is a definite limitation. Second, only one group received the HPMR, thereby making it difficult to disentangle the effects of high protein v. changes due to different macronutrient composition of the diet as a result of protein replacement. For example, as a result of HPMR, this group showed changes in other macronutrients (lower % en from carbohydrates) compared with the standard diet in the control group. It is therefore difficult to critically ascertain whether the observed beneficial effects of the intervention diet are due to high protein alone or due to a relatively low carbohydrate content. Further, in a 12-week study, the group with HPMR showed similar overall weight loss, significantly more fat loss and no significant difference in lean body mass v. the standard protein meal replacement( Reference Treyzon, Chen and Hong 54 ). In the present study, whole foods were used in the standard protein (control) diet, which may blur the effect of a high-protein diet. There is need for more meal replacement intervention studies using high protein v. comparatively lower protein to clearly understand the effect of high protein per se on weight loss and other metabolic parameters.
Conclusion
The 3-month intervention with the HPMR diet combined with standard lifestyle changes in overweight/obese Asian Indians has shown significant reduction in weight, abdominal obesity, blood pressure, lipids, glycaemic parameters and hepatic enzymes compared with a standard control diet in Indians. These results suggest that the HPMR diet may be an effective and safe strategy for weight loss in overweight and obese Asian Indians, and thus may be important for the prevention of dyslipidaemia and diabetes in Asian Indians. Long-term studies are required to further evaluate the effect of high-protein diets on the prevention of diabetes and related disorders.
Acknowledgements
The authors thank the subjects and sponsors for their support to complete this study.
The study was supported by Herbalife International India Pvt. Ltd. Herbalife Intrernational India Pvt. Ltd had no role in the design, analysis or writing of this article.
S. G. researched data, wrote the paper and conducted the study. A. M. wrote the paper, contributed to discussion and reviewed/edited the paper. R. M. P. and C. P. Y. performed statistical analysis. R. T. and M. S. contributed to data collection and conduct of the study.
The authors declare that there are no conflicts of interest.


