


1. Introduction
Understanding the characteristics of vortex shedding behind a bluff body is of paramount importance due to its ramifications in domains such as nuclear and conventional power generation, the structural design of heat exchangers, offshore platforms or bridges and controlling thermoacoustic instabilities within combustion (Griffin & Hall Reference Griffin and Hall1991; Choi, Jeon & Kim Reference Choi, Jeon and Kim2008; Sumner Reference Sumner2010; Æsøy et al. Reference Æsøy, Jankee, Yadala, Worth and Dawson2022). While many aspects of the physics of vortex shedding from bluff bodies such as formation criterion, near wake flow features and vortex patterns have been well established, there are still cases where the impact of vortex shedding is less explored and understood. In this paper, we investigate vortex shedding from a single circular cylinder in the presence of an incoming oscillating flow, generated by acoustic forcing.
The injection of energy into the flow field, through external disturbances, has been shown to alter the properties of the cylinder wake. Such flow disturbances can be achieved through controlled vibrations of the cylinder (translation oscillations in the transverse or streamwise direction or rotational oscillations) or through velocity fluctuations generated by upstream flaps, active grids or electromagnetic speakers that acoustically modulate the flow field (Williamson Reference Williamson1985; Barbi et al. Reference Barbi, Favier, Maresca and Telionis1986; Hall, Ziada & Weaver Reference Hall, Ziada and Weaver2003). While these mechanisms are different in nature, Griffin & Hall (Reference Griffin and Hall1991) found that the dynamics of a fixed cylinder exposed to an oscillating flow and an in-line oscillating cylinder in a steady flow are identical, provided that the acoustic wavelength is large compared with the cylinder's diameter, i.e. the cylinder is acoustically compact. This led to the definition of a reduced amplitude of oscillations,  $\epsilon$, which is equivalent to the amplitude of streamwise oscillations of a cylinder in a steady flow, normalised by its diameter (Barbi et al. Reference Barbi, Favier, Maresca and Telionis1986; Konstantinidis & Balabani Reference Konstantinidis and Balabani2007), as follows:
 \begin{equation} \epsilon=\frac{\Delta u}{2{\rm \pi} f_e d}, \end{equation}
where  $\Delta u$ is the amplitude of the velocity oscillations, $f_e$ is the excitation frequency and $d$ corresponds to the cylinder diameter.
Although studies employing acoustically generated oscillations are less common, Blevins (Reference Blevins1985) demonstrated that a sound field (standing wave) alters the motion of fluid particles and induces vortex shedding at a frequency fully correlated with the excitation frequency of the standing wave. The acoustic velocity fluctuations needed to exceed the background turbulence (root mean square (r.m.s.) velocities) in order to influence the bluff body wake. Blevins (Reference Blevins1985) further explained that it was not the sound pressure which affected the nature of the vortex shedding, rather it was due to synchronisation between the acoustic field and the wake behaviour.
Synchronisation of these two oscillating systems occurs only if the amplitude of the velocity oscillations is sufficiently above the background turbulence. This phenomenon is termed vortex lock-in and occurs when the vortex shedding frequency of the cylinder ( $\,f_s$) is shifted from its natural state ( $\,f_0$) and becomes half of the excitation frequency ( $\,f_e$). Barbi et al. (Reference Barbi, Favier, Maresca and Telionis1986) observed that a variation in $f_e$ altered $f_s$ smoothly until the point at which lock-in ensued, i.e. at $f_e/f_0$ of 1 and $f_s/f_0$ of 0.5. Multiple investigations have revealed that vortex lock-in is only sustained over a certain frequency range. For instance, Barbi et al. (Reference Barbi, Favier, Maresca and Telionis1986) reported a range for the lock-in envelope between $f_e/f_0$ of 1 and 2 while Al-Mdallal, Lawrence & Kocabiyik (Reference Al-Mdallal, Lawrence and Kocabiyik2007) found that at low amplitudes, this range extends to 3. Previous results also established that the nature of the oscillations can influence the lock-in range. Primary lock-in, which occurs when $f_s=f_e$, has been reported for cases with transverse or rotational oscillations or in the case of transverse fluidic oscillations (Williamson & Roshko Reference Williamson and Roshko1988; Du & Sun Reference Du and Sun2015). Additionally, secondary subharmonic lock-in, i.e. $f_s=0.5f_e$, exists for streamwise cylinder oscillations or streamwise fluidic oscillations (Kim et al. Reference Kim, Park, Park, Bae and Yoo2009).
A number of factors have been associated with the existence of these multiple lock-in regimes. The amplitude of oscillations with respect to the mean flow ( $\Delta u/U_\infty$) is one such universal parameter which controls the lock-in behaviour of the wake (Blevins Reference Blevins1985; Griffin & Hall Reference Griffin and Hall1991; Hall et al. Reference Hall, Ziada and Weaver2003; Munday & Taira Reference Munday and Taira2013). Al-Mdallal et al. (Reference Al-Mdallal, Lawrence and Kocabiyik2007) increased $\Delta u/U_\infty$ from 0.1 to 0.3 and noted a subsequent shift in the lock-in range from 1.5–2.2 to 1.1–3.0. Additionally, the Reynolds number based on the cylinder diameter ( $Re_d$) of the incoming flow can potentially influence the lock-in range but discrepancies exist between reported results: Konstantinidis, Balabani & Yianneskis (Reference Konstantinidis, Balabani and Yianneskis2003) found that higher $Re_d$ reduced the threshold for the onset of lock-in; Barbi et al. (Reference Barbi, Favier, Maresca and Telionis1986) surmised a correlation between the lock-in limits and $Re_d$; whereas the results of Griffin & Hall (Reference Griffin and Hall1991) advocate for the contrary. Blevins (Reference Blevins1985) also hinted at the potential influence of turbulence of the flow on vortex lock-in. Furthermore, Konstantinidis et al. (Reference Konstantinidis, Balabani and Yianneskis2003) reported that the lock-in range is not symmetric. The range of frequencies over which lock-in is inherent is wider for $f_e/f_0$ less than 2, compared with $f_e/f_0$ greater than 2. Although extensive research has identified the parameters associated with defining the boundaries of lock-in, no scaling has been derived that capture these limits. It is apt to assume, similar to Hall et al. (Reference Hall, Ziada and Weaver2003), that this can be attributed to the fact that the boundaries of vortex lock-in described hitherto remain estimates due to the insufficient amount of data points available in the lock-in regime diagram.
1.1. Flow fields of vortex lock-in
The lock-in behaviour can be further explored through an analysis of the topological features of the structures present in the wake of the cylinder. An extensive study by Detemple-Laake & Eckelmann (Reference Detemple-Laake and Eckelmann1989) characterised vortical structures as (i) being independent of  $f_e/f_0$, (ii) formed upon synchronisation, i.e. lock-in at $f_s=\frac {1}{2}f_e$ or (iii) occurring at $f_s=f_e$. Flow visualisations revealed a kaleidoscope of patterns induced by the velocity fluctuations, which included but are not limited to symmetric, alternate (Kármán vortex street), vortex strings and isolated vortex pairs. Identifying the type of vortical structures present across the lock-in range can help in understanding the physical mechanisms. However, this has proven to be a complex task as illustrated through the direct numerical simulations of Balachandar, Mittal & Najjar (Reference Balachandar, Mittal and Najjar1997), where a cylinder had the same shedding frequency in both a steady flow and an oscillating flow at $f_e/f_0 = 2$, but different vortex dynamics arise in each case. Despite the wide variety of vortex shedding patterns reported, recent results have revealed that the wake during lock-in can be primarily associated with two types of vortex shedding: alternating shedding (AS) and symmetric shedding (SS) modes.
Konstantinidis, Balabani & Yianneskis (Reference Konstantinidis, Balabani and Yianneskis2005) found the alternating mode corresponded to two single vortices being shed per cycle (2S mode), i.e. the classical Kármán vortex street which occurs when the incoming flow is steady. On the other hand, SS occurs when the imposed inflow perturbations have a symmetric component to them (Konstantinidis & Balabani Reference Konstantinidis and Balabani2007). Konstantinidis & Liang (Reference Konstantinidis and Liang2011) explained that in the SS mode, the flow perturbations promote the simultaneous formation of a vortex pair as the shear layer simultaneously rolls up on both sides of the cylinder (2P mode). This implies that the symmetric mode is synchronised with the incoming oscillatory flow. Both Al-Mdallal et al. (Reference Al-Mdallal, Lawrence and Kocabiyik2007) and Konstantinidis, Balabani & Yianneskis (Reference Konstantinidis, Balabani and Yianneskis2007) observed wake breathing in the symmetric mode, where the shear layers on both sides of the cylinder experienced an inward–outward motion over one cycle of oscillation. However, Konstantinidis & Liang (Reference Konstantinidis and Liang2011) observed that symmetrically formed vortices are highly unstable and lose their coherence within a few diameters downstream of the cylinder. Although many studies have reported the dominant shedding mode, the diversity in pattern over the lock-in range implies that the evolution of the vortical structures, both from a temporal and spatial aspect, remain incomplete.
1.1.1. Mode competition
A bimodal behaviour was observed by Ongoren & Rockwell (Reference Ongoren and Rockwell1988) and Griffin & Hall (Reference Griffin and Hall1991), resulting in a competition and switching between the alternating (2S) and symmetric (2P) modes in the near wake. Griffin & Hall (Reference Griffin and Hall1991) observed that the mode competition was affected by the upstream feedback of disturbances arising from the near wake of the cylinder. Konstantinidis & Balabani (Reference Konstantinidis and Balabani2007) attributed the coexistence of the alternate and symmetric mode to the influence of background turbulence which promotes transition in the shear layers at low  $Re_d$ numbers. Konstantinidis et al. (Reference Konstantinidis, Balabani and Yianneskis2007) explained that the number of occurrences of each mode was a function of the excitation frequency, the amplitude of the oscillations, as well as the Reynolds number of the incoming flow. The dominant shedding mode was also found to vary with $f_e/f_0$.
Over the lock-in range, Konstantinidis et al. (Reference Konstantinidis, Balabani and Yianneskis2005) found the existence of two vortex shedding patterns for  $f_e/f_0<2$ while only the 2S mode occurred for cases with $f_e/f_0\geq 2$. Konstantinidis et al. (Reference Konstantinidis, Balabani and Yianneskis2007) explained that for $f_e/f_0< 2$, i.e. $f_s/f_0< 1$, the period of the vortex shedding is increased compared with the unforced wake and thus, there is more time for vorticity to accumulate in the shear layers. However, there is a limit to the amount of vorticity that a coherent structure can contain, as defined by Jeon & Gharib (Reference Jeon and Gharib2004), since the rolled-up vortex needs to pinch-off under the action of strain. The pinched-off vortex pair then induces its own velocity field and advects away from the cylinder, while a new pair of vortices rolls up, eventually resulting in the 2P mode. For $f_e/f_0\geq 2$, i.e. $f_s/f_0\geq 1$, the inverse occurs as the period of vortex shedding is reduced compared with the unforced case. This implies that by the end of the forward stroke, the vortex pinches off even though the maximum vorticity level has not been reached. The vorticity then remains concentrated in one coherent structure and results in the 2S mode of shedding.
The type of mode also depends on the amplitude of the velocity oscillations. At low values, the alternating mode is predominant while at high values, even when the symmetric mode occurs, the shed vortices are unstable and break down within a few downstream diameters, giving rise to an antisymmetric arrangement of the vortex pair (Konstantinidis et al. Reference Konstantinidis, Balabani and Yianneskis2007). However, the existence of this bimodal behaviour highlights the ambiguous nature of the flow field during lock-in and demonstrates that the physical mechanisms responsible for lock-in are yet to be fully understood. Furthermore, although there is significant evidence which highlights a connection between the amplitude of the oscillations and the vortex lock-in regime, no scaling exists that captures this behaviour. This article primarily aims to establish such a scaling through a systematic parametric study by revisiting the concept of vortex lock-in for a single circular cylinder in an oscillating flow induced through in-line acoustic forcing. The cylinder wake flow fields are examined under conditions of lock-in with the aim of complementing existing explanations on the mechanisms driving vortex lock-in.
2. Experimental set-up
2.1. Facility and measurements
The experimental set-up is shown in figure 1(a). The rig consists of an inlet section, a plenum chamber with flow conditioning and a contraction which accelerates the flow into the test-section shown in figure 1(b), which is a 700 mm long acrylic pipe with a diameter of 35 mm. Cylinders with different diameters ( $d=1.7$, 2.0, 2.4, 4.0 and $6.0$ mm) were placed inside the pipe perpendicular to the streamwise direction. Varying the cylinder diameter also leads to different blockage ratios. In the current set-up, a maximum blockage ratio of $21.8\,\%$ occurs for the largest cylinder diameter of 6 mm. Studies with a similar experimental set-up reported blockage ratios of $20\,\%$ (Barbi et al. Reference Barbi, Favier, Maresca and Telionis1986), $9\,\%$ (Hall & Griffin Reference Hall and Griffin1993), $13\,\%$ (Jarża & Podolski Reference Jarża and Podolski2004) and $10\,\%$ (Konstantinidis & Balabani Reference Konstantinidis and Balabani2008). Although a blockage can introduce three-dimensional effects and cause flow distortion around the cylinder, the aforementioned studies observed no significant effect on the reported results. Hence, it is expected that blockage ratios used in this study will not have a considerable effect and no attempt at blockage correction is made.
Schematic of the test facility. (a) A sketch of the rig with an inlet, a plenum with flow conditioning features, a contraction and an acrylic pipe, allowing optical access. Loudspeakers were mounted on either side of the plenum to produce a longitudinal standing acoustic wave in the pipe section. (b) A sketch of the pipe section with the cylinder is shown. The hot-wire probe was positioned at a location of  $4d$ downstream of the cylinder and microphones ( $\kern 1.5pt p_{1\unicode{x2013}4}$) were used to monitor and control the standing acoustic wave.

The mass flow in the test section was set using an Alicat mass flow controller with a range of 0–1000 standard litres per minute (s.l.p.m.) and accuracy of  $\pm$2.5 s.l.p.m. This corresponds to a bulk velocity ranging between $U_\infty = [0 \to 17.3]$ m s $^{-1}$. The turbulence intensity of the unforced flow, without any cylinder, did not exceed $5\,\%$ for the range of bulk velocity tested. The coordinate system used in this article is represented by ( $x,y,z$) and is illustrated in figure 1. The streamwise direction is represented by $x$,
$x$,  $y$ is perpendicular to the cylinder and $z$ is along its length with the corresponding velocity components being $u$,
$u$,  $v$ and $w$, respectively.
Temporal modulation of the flow was achieved by forcing a standing acoustic wave in the pipe section. For this purpose, two loudspeakers were mounted on either side of the plenum and driven by monochromatic waves at frequency  $f_e$ generated by a TTi-40 MHz waveform generator. The location of the cylinder in the pipe was varied such that it was located at a pressure or a velocity node of the standing acoustic mode. In this way, the cylinder was exposed to pure velocity or pressure oscillations. To monitor and control the standing acoustic waves, pressure fluctuations $p_{1\unicode{x2013}4}$ were measured at the wall with Bruël and Kjær 1/4 in. (sensitivity 4 mV Pa $^{-1}$) condenser microphones at four different streamwise locations inside the pipe section. These were used to reconstruct and control the longitudinal acoustic field inside the pipe as described in § 3.
A thorough parametric study was carried out to assess the different features of vortex lock-in using hot-wire anemometry (table 1). These measurements were performed using a Dantec Streamware Pro system with a single-wire traversing 55P11 hot-wire probe, which was operated in constant temperature mode. The probe was aligned such that the wire was positioned in the shear layer, at 0.5 $d$ off the centre of the pipe in the transverse direction and at a downstream distance of 4 $d$, as shown in figure 1(b). The hot-wire probe was calibrated using King's law fit predata and postdata acquisition using a jet with a top-hat velocity profile and velocities ranging from 0–30 m s $^{-1}$. The hot-wire and pressure signals were sampled at a rate of 51.2 kHz for 10 s and digitised using a 24-bit NI-9234 data acquisition.
List of cases and parameters investigated in this study ( $d$, cylinder diameter; $f_e$, excitation frequency; $U_{\infty }$, mean bulk incoming velocity; $f_0$, natural shedding frequency of cylinder; $St_0$, Strouhal number based on $f_0$, $U^*_0$, reduced velocity calculated as $U_{\infty }/f_0 d$; $\Delta u/U_{\infty }$, normalised amplitude of the velocity fluctuations; $BR$, blockage ratio caused by cylinder). The symbols for each case have been kept constant throughout the paper and in subsequent plots. For each combination of cylinder diameter, excitation frequency and mean bulk velocity, 20 cases of $\Delta u/U_{\infty }$ were investigated in the range 0–0.38.

To obtain quantitative spatial data of the flow field, high-speed planar particle image velocimetry (PIV) was performed in the x–y plane as shown in figure 1(a). The set-up consisted of a Phantom V2012 1 MP camera fitted with a 200 mm focal length lens, providing a field of view ranging from  $-3d$ to $3d$ in the $y$-direction and $-2d$ to $8d$ in the $x$-direction. The flow was seeded with $\approx$1 $\mathrm {\mu }$m olive oil droplets that were produced using a Laskin nozzle and introduced into the air flow upstream of the plenum. Particle illumination was achieved using a Litron LDY300 high-speed laser with a beam splitter to create two laser sheets of thickness $\approx$1 mm, entering on either side of the pipe to avoid any shadows caused by the cylinder. For each case, 6000 image pairs were acquired at a rate of 3 kHz in double-frame mode with $\Delta t = 40$ $\mathrm {\mu }$s. Image acquisition, preprocessing and vector-field computation were performed using LaVision DaVis 10 software suite. Cross-correlation for the vector field computation was carried out with an initial step with a window size of $64\times 64$ pixel $^2$ with an overlap of 50 %, followed by two passes of $24\times 24$ pixel $^2$ with a 50 % overlap. This resulted in a spatial resolution of 0.236 mm per vector in both the $x$ and $y$ directions.
Following the approach of Raffel et al. (Reference Raffel, Willert, Wereley and Kompenhans2007) and Sciacchitano & Wieneke (Reference Sciacchitano and Wieneke2016), the uncertainty in the PIV velocity flow fields was computed. The correlation error associated with planar PIV can be estimated to be roughly  $0.1$ pixels (Raffel et al. Reference Raffel, Willert, Wereley and Kompenhans2007). Since the particle displacement in this study was approximately $10$ pixels, this results in a relative displacement error of the order of $1\,\%$. Due to the low values of $\Delta t$ between the frames, the error on the time separation is negligible. Correlation error is the main contributor to the uncertainty of the measured velocity in an instantaneous field, which can be expressed as $\epsilon _{U(t)}=1\,\%$ where $U(t)$ is a time series of instantaneous velocity fields. Following the guidelines of Sciacchitano & Wieneke (Reference Sciacchitano and Wieneke2016), the uncertainty is calculated using a linear error propagation technique, with the uncertainty in the velocity fields determined from the standard deviation of the respective time series and the number of uncorrelated samples in time. This resulted in a maximum uncertainty for the velocity field of $\epsilon _{\bar {u}} \approx 3\,\%$ and $\epsilon _{\bar {v}} \approx 2\,\%$, where $u$ and $v$ correspond to the streamwise and spanwise velocity components, respectively.
3. Acoustic forcing method
Since the forcing frequencies were restricted to standing acoustic modes of the pipe,  $U_{\infty }$ was varied to change the natural shedding frequency $f_0$ of the cylinder. This is shown in figure 2(a), where measurements of $f_0$, obtained from the hot-wire data, are plotted against $U_{\infty }$. The red lines indicate the excitation frequencies $f_e =730$, 1460 and 2190 Hz, corresponding to standing acoustic modes of the pipe. By changing $U_{\infty }$, the natural shedding frequency $f_0$ varies proportionally and subsequently, when forcing was applied to the system, the normalised excitation frequency, $f_e/f_0$, varied systematically in the range of 1 to 2.5. This also culminated in a cylinder-based Reynolds number $Re_d$ of the flow between 500 and 7200. The cylinder diameter was also varied in the range $d = [1.7 \to 6]$ mm, which led to different proportionality factors between $f_0$ and $U_{\infty }$ for the different cylinders. In figure 2(b), the data is plotted as a Strouhal number $\mathrm {St}_0$, which lies in the range $[0.19 \to 0.23]$, indicating classical behaviour (Roshko Reference Roshko1954).
Characterisation of the unforced vortex shedding frequency. (a) Plot of the shedding frequency  $f_0$ against $U_\infty$. The red horizontal lines indicate three longitudinal standing modes $f_e = 730$, 1460 and 2190 Hz, and the linear solid lines indicate the relationship to the Strouhal number $St_0 = f_0 d/ U_\infty$. (b) Plot of the Strouhal number $St_0$ plotted against the Reynolds number $Re_d = U_\infty d / \nu$.

In this study, acoustic waves are used to modulate the base flow at the cylinder, which is similar to the approach adopted by Blevins (Reference Blevins1985). The primary difference in the current study is that the forcing mechanism produces longitudinal acoustic waves which generate variations in the streamwise velocity or pressure. In the case of Blevins (Reference Blevins1985), the acoustic wave is aligned transverse to the flow direction and the transverse velocity is modulated. Furthermore, since the cylinder location relative to the velocity and pressure nodes can be varied, the effect of pressure oscillations on the lock-in behaviour can also be investigated.
The standing wave modes of the pipe can be estimated by the dispersion relation
 \begin{equation} f_e = \frac{n \bar{c}}{L}, \end{equation}
where  $\bar {c}$ is the speed of sound, $L$ is the length of the pipe and $n$ is the mode number. The values $n = 1.5$, $3.0$ and $4.5$ correspond to standing modes at $730$, $1460$ and $2190$ Hz, respectively. These were obtained by identifying peaks in the pressure spectra obtained through a frequency sweep of the rig. Figure 3(a) shows the reconstructed pressure mode in the pipe section for $n = 1.5$ and $n = 3.0$, together with the amplitude of the pressure oscillations $\hat {p}_{1\unicode{x2013}4}$.
Reconstructed acoustic modes using the multiple microphone method. (a) Pressure mode reconstructed by fitting  $p_{1\unicode{x2013}4}$ to (3.2). Black and blue solid lines indicate $n = 1.5$ and 2.5, corresponding to standing modes at $f_e = 730$ and 1460 Hz, respectively. (b) Acoustic pressure and velocity ((3.2) and (3.3)), in the vicinity of the cylinder when placed at the pressure and velocity nodes. For both cases illustrated here, the acoustic velocity is tuned to $|\hat {u}|/U_\infty = 0.055$ at the pressure node.

The acoustic pressure and velocity fluctuations in the pipe section were reconstructed using the multiple microphone method (Seybert & Ross Reference Seybert and Ross1977). Since the flow is at a low Mach number, and the acoustic mode in the pipe is approximately one-dimensional, the acoustic pressure and velocity  $p^{\prime }(x,t)={\rm Re}\{\kern 1.5pt\hat {p}(x)\,{\rm e}^{{\rm j}\omega t}\}$ and $u^{\prime }(x,t)={\rm Re}\{\hat {u}(x)\,{\rm e}^{{\rm j}\omega t}\}$ are described by
 \begin{equation} \hat{p}(x) = a^+ \exp(-{\rm j}k_x^+ x) + a^- \exp(\kern 1.5pt {\rm j}k_x^- x), \end{equation}
and
 \begin{equation} \hat{u}(x) = \frac{1}{\bar{\rho}\bar{c}}(a^+ \exp(-{\rm j}k_x^+ x) - a^- \exp(\kern 1.5pt {\rm j}k_x^- x)), \end{equation}
where  $\omega$ is the angular frequency, $\bar {\rho }$ is the fluid density, $k_x^{\pm }$ is the streamwise wavenumber and $a^+$ and $a^-$ are the Riemann invariants of the upstream and downstream propagating acoustic waves. Performing cross-power spectra on the pressure signals acquired by the microphones enables computation of $\hat {p}(x_i)$, as follows:
 \begin{equation} \hat{p}_i=\hat{p}(x_i)=\frac{{\rm PSD}(p_{ref}^{\prime},p_i^{\prime})}{\sqrt{{\rm PSD}(p_{ref}^{\prime},p_{ref}^{\prime})}}, \end{equation}
where  ${\rm PSD}(p_{ref}^{\prime },p_i^{\prime })$ is the cross-power spectrum between the reference signal $p_{ref}^{\prime }$ from the signal generator and the measured pressure fluctuations $p_i^{\prime }$, with $i$th corresponding to the microphone number. The spectra were obtained using the Welch method and by averaging 50 % overlapping segments of the signal, multiplied by a Hanning window. Finally the Riemann invariants ( $a^{\pm }$) are obtained by solving for the two unknowns in (3.2).
In figure 3(a) the reconstructed pressure mode shows that forcing at  $f = 730$ and $1460$ Hz results in a pressure node at $x/L = 0$. At this location, $\hat {p}\approx 0$, whereas the acoustic velocity $\hat {u}$ is at its maximum. This is shown in figure 3(b), where the velocity and pressure are reconstructed in the vicinity of the pressure node. The main features in this plot are, firstly, the acoustic wavelength $\lambda _a$ is very large relative to the diameter of the cylinder ( $\lambda _a/d \gg 60$), indicating that the acoustic velocity is approximately constant over the cylinder wake. Therefore, such a method of forcing is similar to oscillating the cylinder in the streamwise direction. Secondly, increasing the mode number from $n= 1.5$ to $3$ preserves the pressure node location. The same behaviour occurs for $n = 4.5$. Subsequently, by iteratively tuning the voltage of the speakers, the velocity amplitude can be adjusted at the pressure node location. A normalised forcing amplitude is defined as
 \begin{equation} \frac{\Delta u}{U_\infty} = \frac{|\hat{u}|_{(x/L = 0)}} {U_\infty}, \end{equation}
and for the two cases illustrated in figure 3(a), the value is tuned to  $\Delta u /U_\infty = 0.055$. Through this method it is possible to tune the acoustic forcing amplitude to high values for different frequencies. Moreover, by moving the cylinder location to $x/L = 0.17$, the $n = 1.5$ mode at $f_e = 730$ Hz now features a velocity node ( $\hat {u} \approx 0$) with large pressure oscillations $\hat {p}$, which allows the effect of pressure oscillations on lock-in to also be studied systematically. It is worth noting that the effect of acoustic forcing on the $v$ velocity fluctuations was tested and found to be negligible.
4. Results and discussions
4.1. Vortex lock-in for circular cylinders
The hot-wire anemometry data was analysed to determine the dominant frequencies present in the flow at each operating condition. The natural shedding frequency of the cylinder was first detected at each  $Re_d$, through identification of the most energetic peak in the power spectrum in the unforced flow as shown in figure 4. This showed that the Strouhal numbers for the tested cylinders varied between 0.19 and 0.23. In the presence of acoustic forcing, two peaks corresponding to $f_e$ and $f_s$ emerge from the power spectra as observed in figure 4. An example of the contour plot for the power spectra at multiple $f_e/f_0$ and constant $\Delta u/U_{\infty }$ of 0.125 for the 2 mm cylinder diameter is displayed in figure 5(a). The peak at the forcing frequency is constant ( $\,f/f_e=1$), but the secondary peak which corresponds to the shedding frequency of the cylinder changes with increasing $f_e/f_0$. Similar to the findings of Barbi et al. (Reference Barbi, Favier, Maresca and Telionis1986), we observe that the shedding frequency drifts past $f_e$ until it reaches 0.5 $f_e$. At this point, synchronisation with the forcing frequency (vortex lock-in) occurs and any subsequent increase in $f_e/f_0$ does not alter $f_s/f_e$, which remains at 0.5.
Example of the power spectra from hot-wire measurements for the  $d=2$ mm cylinder, subjected to $U_{\infty }$ of 6.1 m s $^{-1}$ for the unforced case and the forced case at (i) $f_s\neq f_0$ and (ii) $f_s\neq f_0$ but $f_s=0.5f_e$, i.e. the locked-in state.

(a) Contour plot for the power spectra for the  $d=2$ mm cylinder at $f_e=730$ Hz, $\Delta u/U_{\infty }=0.125$ and over the range of $f_e/f_0=0.46\unicode{x2013}2.67$, lock-in regime diagram for the 2 mm cylinder at the (b) velocity node and (c) velocity antinode, as the amplitude of the velocity oscillations at the velocity antinode is varied. The direction of the drift in the shedding frequency, $f_s$, is shown by the red arrow as $f_e/f_0$ increases.

By tracking the evolution of  $f_s$ with $f_e/f_0$, the lock-in characteristics of the cylinder can be quantified. Figure 5 plots the lock-in characteristics of the $d=2$ mm cylinder, located at the velocity node (figure 5b) and the velocity antinode (figure 5c). Figure 5(b) shows the variation of $f_s/f_0$ with $f_e/f_0$ as the forcing amplitude is increased, with the grey line representing a mean fitting curve from Barbi et al. (Reference Barbi, Favier, Maresca and Telionis1986). At a velocity node, lock-in does not occur as the acoustic fluctuations are zero. Although the acoustic pressure oscillations are large, the cylinder is exposed to steady flow conditions and vortex shedding occurs at $f_0$.
Figure 5(c) shows the flow response at the velocity antinode. An increase in  $\Delta u/U_{\infty }$ alters the shedding frequency of the cylinder for a constant value of $f_e/f_0$, and provided that $\Delta u/U_{\infty }$ is high enough, vortex lock-in is achieved where $f_s=0.5f_e$. This is in agreement with Blevins (Reference Blevins1985), who explained that it is not the acoustically generated pressure fluctuations themselves but rather the velocity induced from the acoustic wave which influences the vortex shedding. Such behaviour confirms that the amplitude of the velocity oscillations is an important parameter in dictating the lock-in behaviour of the cylinder positioned away from a velocity node. The lock-in behaviour of the single cylinder at the velocity antinode is in agreement with the limits identified by Barbi et al. (Reference Barbi, Favier, Maresca and Telionis1986). The lock-in envelope ranges from $f_e/f_0$ of 1 to 2.2, consistent with the findings of Barbi et al. (Reference Barbi, Favier, Maresca and Telionis1986) and Al-Mdallal et al. (Reference Al-Mdallal, Lawrence and Kocabiyik2007). However, the $f_e/f_0$ range tested in this study is not deemed exhaustive enough to assess the occurrence of multiple lock-in modes, as reported by Konstantinidis & Balabani (Reference Konstantinidis and Balabani2007). Note that for brevity, only the $d=2$ mm case is shown in figure 5 but all tested cylinder diameters exhibited similar behaviour.
4.2. Scaling of the onset of vortex lock-in
Additional insight into vortex lock-in can be achieved by analysing the frequency ratio ( $\,f_e/f_0$) corresponding to the onset of vortex lock-in for each amplitude of the velocity fluctuations. We define the onset of lock-in as the first value of $f_e/f_0$ in the regime diagram at which $f_s=0.5f_e$. Multiple studies have highlighted that the limits of lock-in can be described by the reduced amplitude $\epsilon$ (1.1), which varies with $f_e/f_0$ (Barbi et al. Reference Barbi, Favier, Maresca and Telionis1986; Kim, Yoo & Sung Reference Kim, Yoo and Sung2006; Konstantinidis & Balabani Reference Konstantinidis and Balabani2007). However, the amount of data from the previous literature is limited and there appear to be no studies yet, which have systematically varied all parameters of interest required to establish a universal scaling law. A large parametric study is conducted herein to fully explore the lock-in map. Figure 6 shows a comparison between the lock-in limits for the 2 mm cylinder tested in this study and data available from the literature. It can be observed that the data points tend to collapse towards a power law,
 \begin{equation} \epsilon=\lambda\left(\frac{f_e}{f_0}\right)^{\alpha_1}. \end{equation}
Variation of the reduced amplitude corresponding to the onset of lock-in with  $f_e/f_0$. For brevity only the 2 mm cylinder case from the current study is shown, together with available data from the literature.

While it is possible to fit the data against predefined non-dimensional groups such as  $\epsilon$ and $f_e/f_0$, such an operation will limit the scaling law to these assumed groups. Instead, a similar methodology as the one employed in Berk et al. (Reference Berk, Hutchins, Marusic and Ganapathisubramani2018) and Jankee & Ganapathisubramani (Reference Jankee and Ganapathisubramani2021) is used to fit the scaling parameters to dimensional variables first. Based on previous research efforts, the main parameters which influence the onset of lock-in are the cylinder diameter $d$, the amplitude of the velocity oscillations $\Delta u$, the bulk mean flow velocity $U_{\infty }$ which in turn alters the natural shedding frequency of the cylinder $f_0$ and the excitation frequency $f_e$. The values of $\Delta u$ corresponding to the onset of lock-in are fitted against these dimensional parameters as defined by
 \begin{equation} \Delta u \propto \mathscr{F} (U_{\infty}, f_0, f_e, d), \end{equation}
which can be rewritten as
 \begin{equation} \Delta u=\lambda U_{\infty}^{\alpha_1} f_0^{\alpha_2} f_e^{\alpha_3} d^{\alpha_4}, \end{equation}
where  $\lambda$ is a constant and $\alpha _1$, $\alpha _2$, $\alpha _3$ and $\alpha _4$ are the exponents obtained from nonlinear regression. The accuracy of the fits is measured as the r.m.s. of the residual ( $Res.$) between the experimental values and data-driven model. For each scaling law, 96 data points are used as shown in figure 7(a). The fitted coefficients, the r.m.s. of the residuals as well as the 95 % confidence interval limits are presented in table 2. Prior to grouping the variables, it is important to ensure that (4.3) satisfies dimensional consistency based on the values of the coefficients computed in table 2. This can be achieved by expressing the dimensional variables in terms of their respective SI units and equating both sides of the equation
 \begin{equation} [ms^{{-}1}]=[][ms^{{-}1}]^{\alpha_1}[s^{{-}1}]^{\alpha_2}[s^{{-}1}]^{\alpha_3}[m]^{\alpha_4}. \end{equation}
Comparing the left-hand side of the equation with the right-hand side results in two inequalities for  $m$ and $s$,
$s$,
 $$\begin{gather} m: 1=\alpha_1+\alpha_4=0.75+0.25=1, \end{gather}$$
 $$\begin{gather}s: -1={-}\alpha_1-\alpha_2-\alpha_3={-}0.75-2.82+2.57={-}1. \end{gather}$$
(a) Experimentally acquired data points describing the onset of lock-in for multiple values of  $f_e/f_0$ and different cylinder diameters, prior to scaling. The plot is overlaid with available data from the literature with the same symbols as in figure 6. (b) Comparison of $\Delta u/U_{\infty }$ corresponding to the onset of lock-in between experimental data $(\Delta u/U_{\infty })_{expt}$ and predictions by the data-driven model $(\Delta u/U_{\infty })_{mod}$ using data from this study for (4.8) and (c) validation of the newly derived scaling with data from literature. Note that the greyed-out points correspond to data from this study as plotted in (b).

Fitted coefficients and residuals for proposed scalings. The 95 % confidence interval limits ( $CI_{95}$) for the fitted parameters are also provided between brackets.

Since dimensional consistency is ascertained, the dimensional variables can be grouped together. Following the Buckingham  ${\rm \pi} $ theorem, a fixed number of non-dimensional groups can be formed out of these five dimensional parameters. Hence, grouping these parameters can be done in numerous different ways. Using the coefficients in table 2 and following the literature, it is reasonable to firstly combine the amplitude of the velocity fluctuations and the mean incoming flow velocity as $\Delta u/U_{\infty }$, and secondly to group the natural shedding frequency of the cylinder and the frequency of the velocity oscillations as $f_e/f_0$. Using these choices, the scaling parameter has reduced to
 \begin{equation} \frac{\Delta u}{U_{\infty}}=0.34\left(\frac{f_e}{f_0}\right)^{{-}2.57}U_{\infty}^{{-}0.25}f_0^{0.25}d^{0.25}. \end{equation}
 This indicates the emergence of another non-dimensional frequency term in comparison with (4.1). Since the coefficients are the same, the remaining dimensional parameters can be grouped together to form the cylinder-based Strouhal number, as  $(f_0d/U_{\infty })^{1/4}$. The final form of this data-driven model is shown as follows and a subsequent comparison between predicted values and experimentally measured values of $\Delta u/U_{\infty }$ displays good agreement (figure 7c):
 \begin{equation} \frac{\Delta u}{U_{\infty}}=\frac{1}{3}\left(\frac{f_e}{f_0}\right)^{{-}5/2}\left(\frac{f_0 d}{U_{\infty}}\right)^{1/4}=\frac{1}{3}\left(\frac{f_e}{f_0}\right)^{{-}5/2}St_0^{1/4}. \end{equation}
This novel data-driven model reveals that in addition to  $f_e/f_0$, the value of $\Delta u/U_{\infty }$ at which lock-in begins also depends on the Strouhal number based on the natural shedding frequency of the cylinder. This is because the Strouhal number is not a constant value, but rather, it denotes a narrow range of values in this experiment as we vary the diameter of the cylinder (0.19–0.23, see table 1).
The emergence of the additional Strouhal number term in (4.8) also highlights the limitations related to fitting predefined non-dimensional groups. It is important to note that it is also a constant for the given configuration. The procedure adopted in this study avoids any bias which occurs when fitting the scaling parameters against predefined groups, such as  $f_e/f_0$ and $\epsilon$ only, because the results are then only limited to these groups. In fact, table 2 shows that the r.m.s. of the residual of the fit was reduced when using the fitting method of Berk et al. (Reference Berk, Hutchins, Marusic and Ganapathisubramani2018) and Jankee & Ganapathisubramani (Reference Jankee and Ganapathisubramani2021). Figure 7(b) appears to be randomly distributed about the $(\Delta u/U_{\infty })_{mod}/(\Delta u/U_{\infty })_{expt}=1$ line, thereby indicating that the proposed scaling is adequate. Hence, using (4.8), the amplitude of the velocity oscillations required to induce lock-in can be predicted for a known cylinder diameter, free stream velocity, natural shedding frequency of the cylinder at that velocity and excitation frequency. The new scaling holds well with data from the literature as shown in figure 7(c), hinting at a universal scaling as the $\Delta u/U_{\infty }$ values corresponding to the onset of lock-in can be accurately predicted for other independent studies as well.
4.3. Velocity fields
While the scaling derived in (4.8) provides a reliable approach to determine the onset of lock-in, the underlying dynamics captured by the scaling are investigated using PIV. Firstly, the emergence of the Strouhal number can be associated with the vortex shedding in a steady flow, which usually takes the form of the classical Kármán vortex street (2S mode). Secondly, at the point of lock-in, since  $f_s=0.5f_e$, (4.8) can be rewritten using the shedding frequency of the cylinder under the influence of the applied forcing, $f_s$:
 \begin{equation} \frac{\Delta u}{U_{\infty}} = \frac{1}{3}\left(\frac{2f_s}{f_0}\right)^{{-}5/2}\left(\frac{f_0 d}{U_{\infty}}\right)^{1/4}. \end{equation}
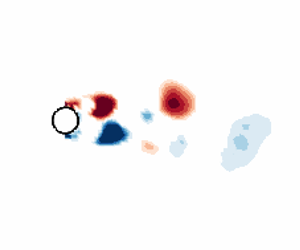
 The rearranged (4.9) reveals that at the point of lock-in, the shedding frequency ( $\,f_s$) is also an important parameter which can be linked to the vortex dynamics when the oscillating component of the flow becomes substantial. Ongoren & Rockwell (Reference Ongoren and Rockwell1988) and Konstantinidis et al. (Reference Konstantinidis, Balabani and Yianneskis2007) have already highlighted the bimodal nature of vortex shedding in forced conditions. An analysis of the instantaneous high-speed PIV snapshots in this study also confirms that the 2S and 2P modes competed against each other and the occurrence of one mode or another was random in time across all cases. Two such snapshots can be seen in figure 8, where the swirl strength of the instantaneous field coloured according to the sign of the corresponding vorticity is presented. Even if forcing is applied, there are instances where the shedding is asymmetric, which then manifests as the classical Kármán vortex street (2S mode) farther downstream as illustrated in figure 8(a). There are other instances as shown in figure 8(b), where the vortex shedding is symmetric. While it is not very clear in this figure, the occurrence of opposite-sign vorticity concentration is an indication of a 2P mode based on the definition of Konstantinidis et al. (Reference Konstantinidis, Balabani and Yianneskis2007). The random nature of the vortex shedding implies that the PIV data is restrictive, and we cannot perform phase-locking since the latter is only meaningful when the vortex roll-up process is synchronised with the imposed perturbation at all instances of time.
Swirl strength ( $\lambda _{ci} (d/U_{\infty })$) of example instantaneous velocity fields for $f_e/f_0 = 1.4$ and $\Delta u/U_{\infty }=0.15$ showcasing mode competition in time between (a) AS and (b) SS.

To further investigate the mode switching behaviour, the statistics of the wake properties behind the cylinder at various lock-in locations were compiled. As an example, a contour plot of the normalised mean streamwise velocity component for the  $d=1.7$ mm cylinder is shown in figure 9(a). The flow field shows the classical features of a flow around a cylinder. Upstream of the front of the cylinder, the flow decelerates due to the blockage effect caused by the cylinder, followed by an acceleration and separation of the flow forming a wake at the rear of the cylinder. Profiles of the mean and r.m.s. velocity values along the wake centreline for selected cases are shown in figure 9(b–e). From the centreline mean velocity profiles (figures 9b,c), a minimum value corresponding to the maximum velocity deficit is observed downstream of the cylinder within a distance of 2 $d$. The velocity then increases, followed by a slow recovery towards $U_{\infty }$. Also, as $f_e/f_0$ increases, the location of the maximum velocity deficit moves closer to the cylinder. This indicates that time-averaged wake structures become shorter with increasing $f_e/f_0$. Such a trend is also evident as the velocity recovers to $U_{\infty }$ more rapidly for $f_e/f_0=2.0$ compared with $f_e/f_0=0.7$.
(a) Contour plot of the normalised time-averaged streamwise velocity for  $f_e/f_0$ of 0.7 and $\Delta u/U_{\infty }$ of 0.075. The pink dotted line represents the location across which the profiles are taken. Note that for brevity, only one case for $d=1.7$ mm is shown here. (b,d) Profiles of the mean streamwise velocity and r.m.s. fluctuations of the transverse velocity along the wake centreline for various combinations of $f_e/f_0$ and $\Delta u/U_{\infty }=0.075$. (c,e) Profiles of the mean streamwise velocity and r.m.s. fluctuations of the transverse velocity along the wake centreline for various combinations of $f_e/f_0$ and $\Delta u/U_{\infty }=0.15$.

Similar to Konstantinidis & Liang (Reference Konstantinidis and Liang2011), the profiles of r.m.s. fluctuations in the transverse velocity component are plotted in figure 9(d,e). The peak in transverse velocity fluctuations follows the same trend as the mean velocity deficit. As  $f_e/f_0$ increases, the peak r.m.s. moves closer to the cylinder which not only implies a faster wake recovery, but also that vortex roll-up and shedding occurs closer to the cylinder. The r.m.s. profiles also show that higher amplitudes of velocity oscillations generally result in higher $u_{r.m.s.}/U_{\infty }$ and more compact wakes. This occurs since there is a higher amount of energy transferred from velocity fluctuations of the flow to the shear layers rolling up on the sides of the cylinder. While the circulation contained in the vortex cores does not change significantly, the concentration of vorticity in the vortex cores is increased by this phenomenon. Subsequently, the shear layers react by retracting, resulting in a smaller vortex roll-up region. This trend is clear for $f_e/f_0$ of 1.4 and 2.0, but more subtle for $f_e/f_0$ of 0.7, possibly due to a higher amount of energy being required for synchronisation in the latter.
4.3.1. Spatial organisation of fluctuating fields
An effective way of elucidating the spatiotemporal features of the wake is through proper orthogonal decomposition (POD). The POD represents an objective method to decompose data into a minimal set of basis functions or modes which capture much of the flow's total energy. In the current framework, the snapshot-POD formulation proposed by Sirovich (Reference Sirovich1987) is employed for this purpose. A detailed description of snapshot-POD can be found in Sirovich (Reference Sirovich1987) or the review by Taira et al. (Reference Taira, Brunton, Dawson, Rowley, Colonius, McKeon, Schmidt, Gordeyev, Theofilis and Ukeiley2017). By applying this technique, the fluctuating velocity fields ( $\tilde {U}=[\tilde {u} ; \tilde {v}]$) are decomposed in the following manner:
 \begin{equation} \tilde{U}(x,y,t) = \sum_{n} \gamma_n a_n(t) \varPsi^n(x,y), \end{equation}
where  $\varPsi ^n(x,y)$ are a set of empirical eigenfunctions (spatial POD modes) that contain information regarding the spatial organisation of various fluctuations with corresponding eigenvalues $\gamma _n$, which represent modal energy, and temporal coefficients $a_n(t)$, where $n$ represents the mode number. This decomposition is used here to gain insight into the contribution of the 2S and 2P shedding modes and the spatial organisation of the corresponding fluctuating velocity fields, for the various test cases. The decomposition was performed on all the acquired velocity fields (10 000 fields for the unforced case and 6000 fields for the acoustically forced cases).
The relative energy of the 10 most energetic POD modes for  $f_e/f_0=1.4$ as the amplitude of the velocity oscillations is increased is presented in figure 10. Note that the computed POD modes for each case are sorted in descending order of their relative modal energy ( $\gamma _n/(\sum \gamma _n)$). In the unforced case, the two most energetic POD modes contain $\approx$51 % of the total energy. As the forcing level is increased, the relative dominance of these modes are seen to reduce. As will be discussed later, this is expected to be the result of flow dynamics related to the forcing frequency becoming more dominant with increasing forcing level, and competing with the natural shedding mode of the cylinder. It is worth noting that henceforth, any reference made to the mode number corresponds to its rank based on its relative modal energy.
Relative energy of the 10 most energetic POD modes for  $f_e/f_0=1.4$ as the amplitude of the velocity oscillations is varied.

Analysing the temporal coefficients of the POD modes provides insight regarding the nature of the related coherent structures and the dominant frequency represented by the modes. The power spectra of the six most energetic POD modes’ temporal coefficients are shown in figure 11 for  $f_e/f_0=1.4$ cases. In the unforced case shown in figure 11(a), spectral content at the natural shedding frequency is found in the first and second most energetic modes only. As $\Delta u/U_{\infty }$ is increased to $0.075$, the emergence of a peak at the excitation frequency $f_e$ can be observed in the third and fourth modes in figure 11(b), while there is a shift in the natural shedding frequency $f_0$ in the first two most energetic modes. Additionally, the fifth and sixth modes capture only one frequency which is at $0.5f_e$, denoting lock-in. The fact that it is captured in lower energy modes suggests that lock-in is not yet substantial. This corroborates well with the hot-wire anemometry measurements where lock-in for this forcing condition was not observed until $\Delta u/U_{\infty }=0.10$. At $\Delta u/U_{\infty }$ of 0.15 shown in figure 11(c), the excitation frequency is most energetic and is found in the first and fourth modes. The second and third modes have a broadband spectrum that contains both the natural shedding frequency and $0.5f_e$.
Power spectra of the six most energetic POD modes’ temporal coefficients for  $f_e/f_0=1.4$ as the amplitude of the velocity oscillations is varied: (a) the unforced case; (b) $\Delta u/U_{\infty }=0.075$; (c) $\Delta u/U_{\infty }=0.15$. In these plots, spectra of POD modes $n=2-6$ are shifted by $10^{-(n-1)}$ for clarity.

Across all cases, the first four POD eigenmodes account for approximately 40 %–60 % of the total energy. It is a natural outcome of the POD procedure applied to a flow that the eigenmodes occur in pairs which are orthogonal to each other in the mean advection direction. Since the same applies to the current data-set, only one of these modes is presented here for brevity. Figure 12(a–l) display the transverse component of the first and third most energetic orthogonal modes ( $\varPsi _v^1$ and $\varPsi _v^3$), as $\Delta u/U_{\infty }$ is varied. In the unforced case, mode pair 1–2 contains $\approx$51 % of the total energy while mode pair 3–4 contains only $\approx$7 %. Therefore, for the unforced case only the spatial structures described by mode pair 1–2 are relevant to the discussion. In fact, the spatial organisation of the structures in figure 12(a) bears similitude to the results of Konstantinidis et al. (Reference Konstantinidis, Balabani and Yianneskis2007) which associated these modes with the basic wake instability of the classical Kármán vortex street, i.e. the asymmetric 2S pattern. This is consistent with the power spectra of the corresponding temporal coefficients as well, as shown in figure 11(a), where the frequency corresponding to the natural shedding frequency of the cylinder was only captured in mode pair 1–2. In the case of the highest forcing amplitude, $\Delta u/U_{\infty }=0.15$, the power spectrum of the most energetic eigenmode's temporal coefficients, shown in figure 11(c), indicates frequency content at only the forcing frequency. Given that Konstantinidis et al. (Reference Konstantinidis, Balabani and Yianneskis2007) showed that symmetric roll-up occurs at this frequency and results in a 2P shedding pattern, the corresponding spatial mode shown in figure 12( f) can be associated with symmetric shear layer roll-up. For clarity, the abbreviations AS and SS are included in the top right-hand corner of figure 12(a–l) whenever the presented modes correspond to these. This is also evident in the instantaneous snapshots in figure 8 and is further discussed in § 4.4.
The POD analysis of fluctuating fields for  $f_e/f_0=1.4$ as $\Delta u/U_{\infty }$ is varied between 0 and 0.15. Panels (a–f) show the transverse component of the first POD mode ( $\varPsi _v^1$) for different cases, while (g–l) show the corresponding third POD mode ( $\varPsi _v^3$). Panels (m–r) show the amplitude of fluctuations related to AS (light blue) and SS (dark blue) along the streamwise direction.

Consequently, specific flow features can now be highlighted using the different eigenmodes shown in figure 12. Firstly, from the eigenmodes corresponding to the asymmetric shear layer roll-up, spatial structures are observed to persist across the entire measured domain whereas the spatial structures in the eigenmodes indicative of symmetric roll-up only extend downstream to  $x/d\approx 3$, consistent with the work of Konstantinidis et al. (Reference Konstantinidis, Balabani and Yianneskis2007). Furthermore, as $\Delta u/U_{\infty }$ is increased, it can be noted in figure 12 that the mode corresponding to the SS increases in energy content. For instance, at $\Delta u/U_{\infty }=0.075$, it is the third most energetic mode while at $\Delta u/U_{\infty }=0.15$, it becomes the most energetic mode. While the spatial modes generally indicate the locations where the variation in the fluctuations occurs, the modes which dominate the flow field at any given location cannot be established without considering the amplitude of the spatial variations. The amplitude is computed to further understand the lock-in aspect, using the following system of equations:
 $$\begin{gather} A_n = [ \sqrt{\gamma_n}| \varPsi^n(x,y) | \sigma( a_n(t) )] {\cdot} \sqrt{2}, \end{gather}$$
 $$\begin{gather}A_v = \sqrt {\sum_{n} A_n^2 }. \end{gather}$$
 The contribution from each of the eigenmodes is computed with (4.11a), where the multiplication operation within the square brackets ( $[\ldots ]$) provides the contribution of each eigenmode to the total r.m.s. of the velocity in the flow field. The use of $\sqrt {2}$ in the product results in an estimate of the amplitude ( $A_n$), where $n$ denotes the corresponding eigenmode. Summation of the different contributing eigenmodes generates the total amplitude ( $A$) of the related fluctuations (4.11b). The procedure adopted in order to choose the necessary modes describing each shedding pattern in each case is as follows. Firstly, only the first $n$ modes which contribute to $90\,\%$ of the total energy are considered. The discrete Fourier transform of the temporal coefficients of each of these modes is then computed and the frequency associated with the maximum amplitude is noted. Any mode whose dominant frequency falls within a $\pm 20$ Hz band around the frequency of interest (i.e. shedding mode frequency) is added together through (4.11b). Further, since the spatial modes related to the AS and SS do not bear the same geometric pattern, especially along the transverse ( $\kern 1.5pt y$) direction (e.g. see figure 12a, f), the comparison of the fluctuation amplitude depends on the chosen $y$ location. To circumvent this problem, a mask based on $u_{r.m.s}/U_{\infty }\geq 0.12$ was applied on the spatial modes ( $| \varPsi ^n(x,y) |$) in (4.11a) prior to spatially averaging them along the $y$-direction. The resulting profile along the streamwise direction can then be used to estimate the amplitudes.
The non-dimensional amplitude of fluctuations for the transverse component, corresponding to AS and SS modes along the streamwise direction,  $A_v(x)/U_{\infty }$, for different forcing levels at $f_e/f_0=1.4$, is presented in figure 12(m–r). In the unforced case, only the amplitude of the fluctuations related to AS can be estimated. The maximum amplitude attained by these fluctuations is observed to reduce linearly with increasing $\Delta u/U_{\infty }$. However, the streamwise location of the amplitude maxima shows no variation and always occurs at ${\approx } 3.3d$ in figure 12(m–r). On the other hand, the amplification of the fluctuations corresponding to the SS ends before $x/d=2$ and approximately coincides with the end of the reverse-flow region in the cylinder's wake as shown in figure 9(b,c). Prior to lock-in, e.g. $\Delta u/U_{\infty } = 0.05$ and 0.075 in figure 12(n,o), respectively, the amplitude of both the symmetric and asymmetric fluctuations is similar in the wake region while the AS dominates the entire measured domain. Once lock-in occurs, e.g. $\Delta u/U_{\infty } = 0.125$ and 0.15 in figure 12(q,r), fluctuations due to SS amplify in the near wake region which are more dominant than the fluctuations produced by AS until a downstream location of $x/d=2.2$, beyond which the opposite ensues. These computations hint at the mode competition aspect mentioned in § 1.1.1 and indicate that the lock-in phenomenon is only inherent in the near-wake region (i.e. up to $x/d \approx 2$).
When  $f_e/f_0=2.0$, the most energetic modes always correspond to spatial structures representing the asymmetric 2S wake structure, irrespective of the amplitude of the imposed velocity oscillations as shown in figure 13, while the spatial structures corresponding to SS are always found in the lower energy contained mode pair 3–4. This trend can be explained by comparing the time scales present in the flow. At $f_e/f_0\geq 2$, $f_s/f_0\geq 1$. This implies that the period over which vortex shedding occurs is less than in the unforced case. Konstantinidis et al. (Reference Konstantinidis, Balabani and Yianneskis2007) explained that under such a condition, the end of the forward stroke in the imposed sinusoidal flow oscillation is reached before maximum circulation is achieved in the shear layer, leading to the rolled-up shear layer pinching-off. The vorticity then remains concentrated in one coherent structure and results in the 2S mode of shedding as only one vortex is formed per cycle. Based on the observations in figures 12 and 13, it appears that mode competition is more prevalent for cases where $f_e/f_0<2$.
The POD analysis of fluctuating fields for  $f_e/f_0=2.0$ as $\Delta u/U_{\infty }$ is varied between 0 and 0.15. Panels (a–f) show the transverse component of the first POD mode ( $\varPsi _v^1$) for different cases, while (g–l) show the corresponding third POD mode ( $\varPsi _v^3$).

To further investigate this, the variation of the cumulative energy of eigenmodes which specifically correspond to either the AS or the SS as  $\Delta u/U_{\infty }$ is increased is presented in figure 14. This plot shows which shedding pattern is more dominant in a global sense. In figure 14(a), a crossover amplitude can be observed at which the added energy of the SS modes exceeds that of the AS modes. This crossover amplitude correlates with the power spectral density from figure 11 and denotes the value of $\Delta u/U_{\infty }$ at which the influence of the externally imposed excitation frequency dominates the flow field. Furthermore, in the case of $f_e/f_0=2$ shown in figure 14(b), the crossover point is never achieved, irrespective of the forcing amplitude, and this implies that the most dominant spatial structure corresponds to the 2S mode of shedding throughout. These findings support the observations of Konstantinidis et al. (Reference Konstantinidis, Balabani and Yianneskis2005), who also identified the occurrence of two vortex shedding patterns at $f_e/f_0=1.74$ but only the asymmetric 2S mode at $f_e/f_0\geq$2.
Variation of the summed energy of paired modes corresponding to the symmetric and asymmetric modes of shedding with  $\Delta u/U_{\infty }$ for (a) $f_e/f_0=1.4$ and (b) $f_e/f_0=2.0$.

4.4. Mode competition and emergence of the lock-in frequency
The POD analysis of the fluctuating fields for the  $f_e/f_0=1.4$ case illustrates the mode competition between the AS and SS pattern that ensues when flow oscillations with sufficiently high amplitude are imposed. The primary consequences of such mode competition are the emergence of the 2P vortex shedding pattern and also, vortex lock-in (i.e. frequency content at $0.5f_e$). While the manifestation of the 2P mode was explained in the previous section, the dynamics of vortex lock-in itself are not particularly clear and an attempt is made here to explain the appearance of the $0.5f_e$ frequency content. To this end, a reduced-order reconstruction of the instantaneous velocity fields from selected POD eigenmodes is carried out using (4.10). Three reconstructions of the flow fields are performed for $f_e/f_0=1.4$ at $\Delta u/U_{\infty }=0.15$ as shown in figure 15. The first two reconstructions utilise modes corresponding to the AS and SS separately. It should be highlighted here that the set of POD modes used is the same as the one previously used for the amplitude computation in figure 12(r). The third reconstruction uses all these POD modes combined together to reconstruct the flow field. The swirl strength of two consecutive snapshots from these reconstructions is presented in figure 15.
(a–f) Swirl strength ( $\lambda _{ci} (d/U_{\infty })$) of reconstructed velocity fields using AS modes, SS modes and both of them together for $f_e/f_0 = 1.4$ and $\Delta u/U_{\infty }=0.15$. Two consecutive snapshots in time are shown. The green and purple contours represent $\lambda _{ci} (d/U_{\infty })= \pm 0.15 \times 10^{-3}$ from the asymmetric and SS modes reconstruction, respectively. Black (dashed) line at $x/d=2.1$ represents location where asymmetric mode becomes dominant (see figure 12r). (g) Variation of the normalised mean velocity profile at $y/d=0$ with downstream distance $x$ for the case decoupled in (a–f).

The contribution of the asymmetric and symmetric modes (representing  $18\,\%$ and $31\,\%$ of the total energy, respectively) is shown in figure 15, where the shedding pattern of the cylinder also corresponds to these specific modes at both instances of time. The subsequent impact of these two sets of modes on the flow field can be seen in the combined reconstruction in figure 15(e, f). The superposed fields show that the features associated with the forcing frequency control the shear layer roll-up until $x/d=2.1$, consistent with trends from the variation in amplitude of the fluctuations in figure 12(r). Within this region, the vortex roll-up on either side of the cylinder (in the transverse direction) synchronises with the imposed forcing, causing a pair of counter-rotating vortices (CVP) to be shed symmetrically (figure 15c,d). These results reveal that the forcing frequency controls the dynamics in the near field region, as demonstrated by the similarity between the reconstructed fields when using all modes together and when only using the SS modes. The CVP is then advected downstream by the mean streamwise flow which leads to the formation of the so called 2P shedding, which is attributed to the synchronisation of the initial shear layer roll-up to the applied forcing.
Beyond the  $x/d=2.1$ location, the influence of the asymmetric modes can be noted in the flow field. Figure 15(e, f) shows that these modes do not directly result in high magnitude vortical structures in the combined flow field; rather, they alter the trajectory of the CVP generated by symmetric rolling-up of the shear layers due to forcing. Such a feature can be inferred through a comparison between the flow field reconstructed from the symmetric modes in figure 15(d) and the one reconstructed from all the modes combined together in figure 15( f). Between $x/d =2$ and $4$, it is clear that the vortical structure in $y/d<0$ has been displaced by the asymmetric mode, leading to a skewed CVP. However, it is important to note that there are instances in the current data-set where the flow field bears more resemblance to the asymmetric-shedding-modes reconstruction and there are others where the displacement of the CVP is marginal as in figure 15(e). This variation could possibly be attributed to the relative phase between these two sets of modes. As the current data-set has a limited number of samples along the phase-space ( $\,f_{PIV}/f_e \approx 4.1$), no clear pattern could be discerned from the instantaneous data. Nevertheless, this variation in the shedding pattern resulting from the mode competition is expected to be the cause of the broadband nature of the spectra measured behind the cylinder, even under conditions of high forcing amplitude.
The reconstructed flow fields from POD modes are also used to explain the occurrence of vortex lock-in (at  $0.5f_e$). While in figure 15(e), the resulting shedding resembles the SS mode induced by the forcing frequency ( $\,f_e$), the streamwise separation distance between two consecutive vortical structures of the same sign has increased with downstream distance. More specifically, as denoted in figure 15(e), the distance between the first and second vortex pair ( $\lambda _1=1.6d$) is half the distance between the second and third vortex pair ( $\lambda _1=3.2d$). The vortex roll-up process itself ends before $x/d=2.1$ and this location also lies just downstream of where the flow reversal in the cylinder's wake ends, which leads to an acceleration, as shown by the mean streamwise velocity profile in figure 15(g). It is expected that the CVP experiences this acceleration, resulting in the distance between two subsequent pairs increasing by a factor of two. The increase in separation distance between consecutive CVPs by this exact factor of two is hereby proposed as the source of the $0.5f_e$ lock-in since the near-field and shear layer roll-up is modulated by $f_e$. While only two timestamps are shown in figure 15 for brevity, this factor of two was observed for multiple timestamps and across other lock-in cases such as $f_e/f_o=1.4$, $\Delta u/U_{\infty }=0.125$ as well, highlighting a generalised feature.
5. Conclusion
A parametric study was conducted in order to investigate the concept of vortex lock-in for circular cylinders in an oscillatory flow. Cylinders of various diameters were positioned at the velocity node and velocity antinode in a standing wave, and hot-wire anemometry was performed to determine the dominant frequencies present in the flow field. Planar high-speed PIV measurements were subsequently carried out for selected cases in order to better understand the physical mechanisms driving lock-in.
The results demonstrated good agreement with the previous findings of Barbi et al. (Reference Barbi, Favier, Maresca and Telionis1986) and the significance of the velocity perturbations was also established by comparing the shedding frequency at the velocity antinode and the velocity node. This led to the derivation of a novel scaling based on the experimental data, which encapsulates both the fluidic properties of the flow and the geometrical properties of the cylinder. This newly established data-driven model allows the prediction of the flow perturbations required to trigger lock-in, given the cylinder diameter, excitation frequency, steady mean velocity and the corresponding natural shedding frequency are known. While the model and experimental data showed good agreement with an r.m.s. error of only 0.01, the new scaling was also validated with data obtained from the literature. The scaling established the Strouhal number of the cylinder as an important parameter, even at the point of lock-in. The non-dimensional parameters established by the scaling were also used to provide an explanation for the bimodal nature of the vortex shedding, as observed from PIV measurements. The POD analysis of the vortex shedding patterns was carried out and the time-averaged wake properties were assessed, with any sensitivity on the flow perturbations and/or  $f_e/f_0$ discussed. The amplitude of the fluctuations, obtained from POD modes, and the subsequent flow field reconstructions enabled the dynamics of the shedding mode competition and the emergence of lock-in ( $0.5f_e$) to be established. In particular, a wavelength doubling was measured between the vortical structures in the flow field and coupled with an acceleration of the flow after the cylinder's wake, this was advocated as the source of lock-in ( $0.5f_e$). Finally, the results and scaling law derived herein were determined for a Reynolds number range between 500 and 7200 and additional experiments are required to assess the universality of the results when applied to other Reynolds number ranges.
Funding
The authors acknowledge funding from the Research Council of Norway (FRIPRO), project 299946.
Declaration of interests
The authors report no conflict of interest.
Data availability statement
The data that support the findings of this study are openly available in the NTNU Open Research repository at https://doi.org/10.18710/BSTYXU.
Author contributions
G.K.J., S.Y. and E.Æ. conceptualised research, conducted the experiments, performed data analysis, and wrote and edited the paper. N.A.W. and J.R.D. acquired the funding, conceptualised research and edited the paper.


 Open access