


1 Introduction
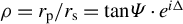
High-power laser systems are often used in a vacuum environment to avoid non-linear phenomena[ Reference Danson, Haefner, Bromage, Butcher, Chanteloup, Chowdhury, Galvanauskas, Gizzi, Hein, Hillier, Hopps, Kato, Khazanov, Kodama, Korn, Li, Li, Limpert, Ma, Nam, Neely, Papadopoulos, Penman, Qian, Rocca, Shaykin, Siders, Spindloe, Szatmári, Trines, Zhu, Zhu and Zuegel 1 ] or when applications are in space[ Reference Ristau 2 ]. Despite the sub-threshold (for one pulse) irradiation level, the performance of optical components is still degrading after the long exposure. Such laser-induced behavior is especially common and becomes an increasing problem at MHz or higher frequencies, where cumulative laser-induced effects lead to a progressive decline in optical performance. Irradiation by ultrashort pulses can generate self-trapped excitons, which may form color centers in transparent dielectrics[ Reference Guizard, Martin, Petite, D'Oliviera and Meynadier 3 ]. The following pulses only enhance such behavior and laser-induced damage (LID) occurs (see Figure 1(a)). The fatigue effect in optical coatings drastically reduces their lifetime. It mainly depends on the material band gap and defect density, which can be partly controlled by changing the coating design and by mitigating defect sources[ Reference Smalakys, Drobužaitė, Momgaudis, Grigutis and Melninkaitis 4 ]. Unfortunately, despite the minimized fatigue effect influence, surfaces are still being damaged due to laser-induced contamination (LIC) (see Figure 1(c)). Organic contamination within the vacuum chambers can originate from the outgassing of optomechanical parts in laser systems. Such molecules can be adsorbed (or even absorbed) directly on the optical surfaces or can be dragged by the intense light pulses and deposited on the irradiated surfaces. Nucleation of hydrocarbon molecules induces light losses in transmittance and reflectance. When the absorption reaches a certain level, catastrophic damage is initiated. LIC is common in most high-power laser systems that work under vacuum conditions or in space. It can cause a loss in the output power and induce laser beam quality issues. Laser pulses with high photon energies or with ultrafast pulses enabling multiphoton absorption can deplete the deposited molecules of hydrogen and thus form carbonized layers[ Reference Hollenshead, Klebanoff and Delgado 5 ].
The schematics of laser-induced (a) damage, (b) discoloration and (c) contamination. The figures at the top show Nomarski optical microscopy images of the corresponding laser-induced modes in multilayer dielectric mirrors. The figures at the bottom represent the principal change in coating structures.

Initiated LIC is one of the major limiting factors in high-intensity ultrafast laser systems. Therefore, mitigation procedures are crucial for successful operation. Currently, there are two main strategies for cleaning or avoiding LIC, and both of them use oxygen ions. The first one uses radio frequency (RF) plasma and the second one uses ultraviolet (UV) light or ultrafast pulses. Bombardment of contaminated optics surfaces by energetic particles using plasma is currently a standard practice in facilities such as ELI ERIC[ Reference Hubka, Novák, Majerová, Green, Velpula, Boge, Antipenkov, Šobr, Kramer, Majer, Naylon, Bakule and Rus 6 ]. The energy of plasma particles must be sufficient for the removal of the carbonous layer, but should not exceed the bonding energy of the coating surface. Such a procedure can take up to more than 10 h and interrupts daily procedures. Injection of oxygen in a vacuum chamber and ionizing it by UV light or laser beams itself creates radicals, which react with the contamination layer. Previous investigations indicate[ Reference Hippler, Wagner, Schroeder and Riede 7 ] a threshold behavior, where a sufficient amount of oxygen starts cleaning or prevents the contamination. Such an approach is used for laser systems in space applications. Both solutions allow one to minimize the contamination influence, but require additional active intervention in the setup.
It was shown in recent papers that LIC behavior, namely the growth rate, differs in separate materials[ Reference Stehlík 8 , Reference Wagner 9 ]. Experimental results indicate that silica material has the highest contamination growth rate compared to materials such as hafnia or niobia. Unfortunately, to the authors’ knowledge, only comparisons between single layers have been demonstrated. During the investigation of multilayers the electric field (E-field) distribution was found to play an important role[ Reference Abromavicius, Buzelis, Drazdys, Melninkaitis and Sirutkaitis 10 , Reference Jupé, Lappschies, Jensen, Starke, Ristau, Melninkaitis, Sirutkaitis, Cravetchi and Rudolph 11 ] for LID. Depending on the strength of the E-field within the layers of different materials, LID or color changes were detected at different fluences. Therefore, it is crucial to investigate the influence of E-field distribution on the LIC as well.
In the current paper, we aim to explore the mitigation of the LIC effect by changing the coating design of high-reflectivity mirrors. Coatings with different materials for the top layer and different E-field distributions at the surface-to-vacuum interface were investigated by optical microscopy for visual comparison and by imaging ellipsometry for quantitative insights into the optical property changes.
2 Methods
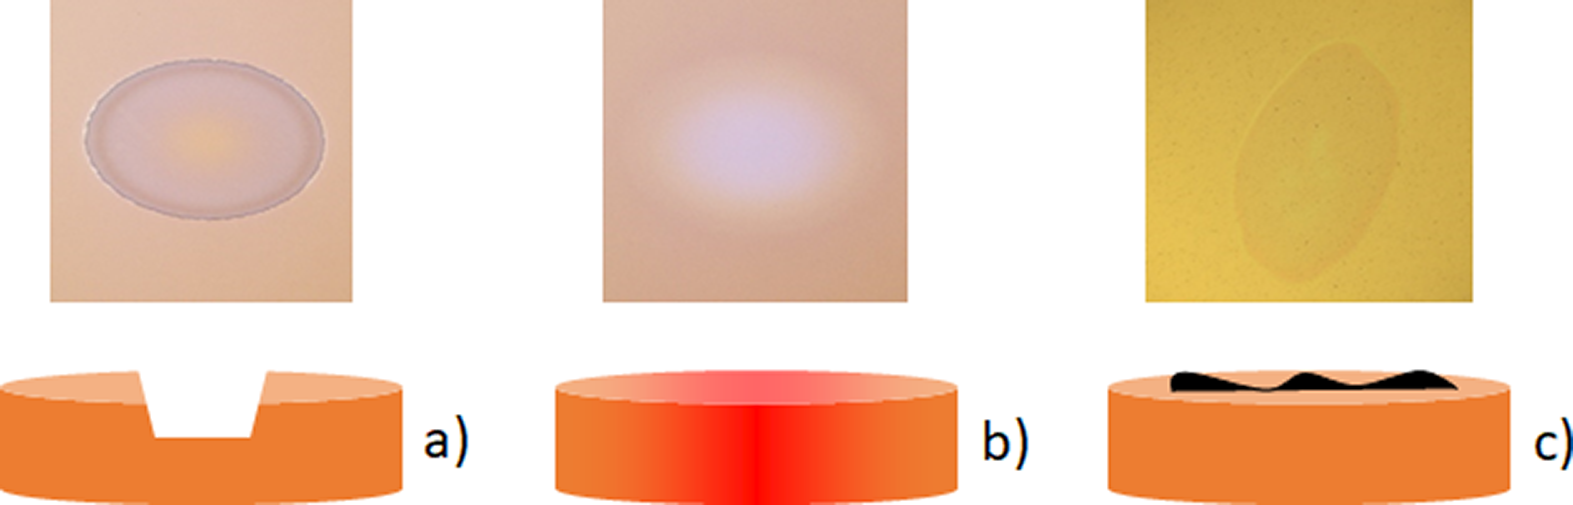
For the investigation of how the top-layer material and the E-field distribution within the multilayer dielectric mirrors influence the formation of LIC, four designs were devised. The base structure of all samples consisted of quarter-wavelength-optical-thickness (QWOT) layers. A total of 31 layers of hafnia and silica were kept at the same optical thickness and only the last, namely the 32nd, layer was different in each design. The first 31 layers were all equal to one QWOT at the wavelength of 810 nm for the 45 deg angle of incidence (AOI). Therefore, the physical thickness of hafnia was modeled to be 121 nm, and for silica it was 170.6 nm. For the first sample, only 31 layers were deposited, keeping the last layer of the design as hafnia. For the other three designs, the last layer was silica, but with the different optical thicknesses: 1, 1.5 and 2 QWOTs. Therefore, the four samples were named ‘0L’, ‘1L’, ‘1.5L’ and ‘2L’, respectively. The E-field distributions of all designs are presented in Figure 2.
E-field distributions within the last four or five layers of the (a) ‘0L’, (b) ‘1L’, (c) ‘1.5L’ and (d) ‘2L’ designs.

All experimental samples were deposited using electron beam evaporation technology. The VERA 1100 (VTD, Germany) deposition plant was used for all processes. Hafnia and silica layers were coated by evaporating silica granules (1.5–3.5 mm, Umicore) and (1–4 mm, Umicore) materials from copper crucibles. Depositions were performed under the vacuum conditions of ( $1.4\times {10}^{-5}$
Pa) and by injecting oxygen of 100 sccm for oxidation (sccm, standard cubic centimeters per minute). The evaporation speed and thickness of each layer were controlled by quartz crystal monitoring. Deposition rates were maintained at 3 Å/s for both silica and hafnia. The plasma source IS300 (CCR Technology GmbH) was used during the deposition process with the power of 2500 W.
$1.4\times {10}^{-5}$
Pa) and by injecting oxygen of 100 sccm for oxidation (sccm, standard cubic centimeters per minute). The evaporation speed and thickness of each layer were controlled by quartz crystal monitoring. Deposition rates were maintained at 3 Å/s for both silica and hafnia. The plasma source IS300 (CCR Technology GmbH) was used during the deposition process with the power of 2500 W.
For the LIC, all experimental samples were tested using a femtosecond pulsed laser ( $\tau =$
46 fs,
$\tau =$
46 fs, $\lambda =810\;\mathrm{nm}$
,
$\lambda =810\;\mathrm{nm}$
, $f=1\;\mathrm{kHz}$
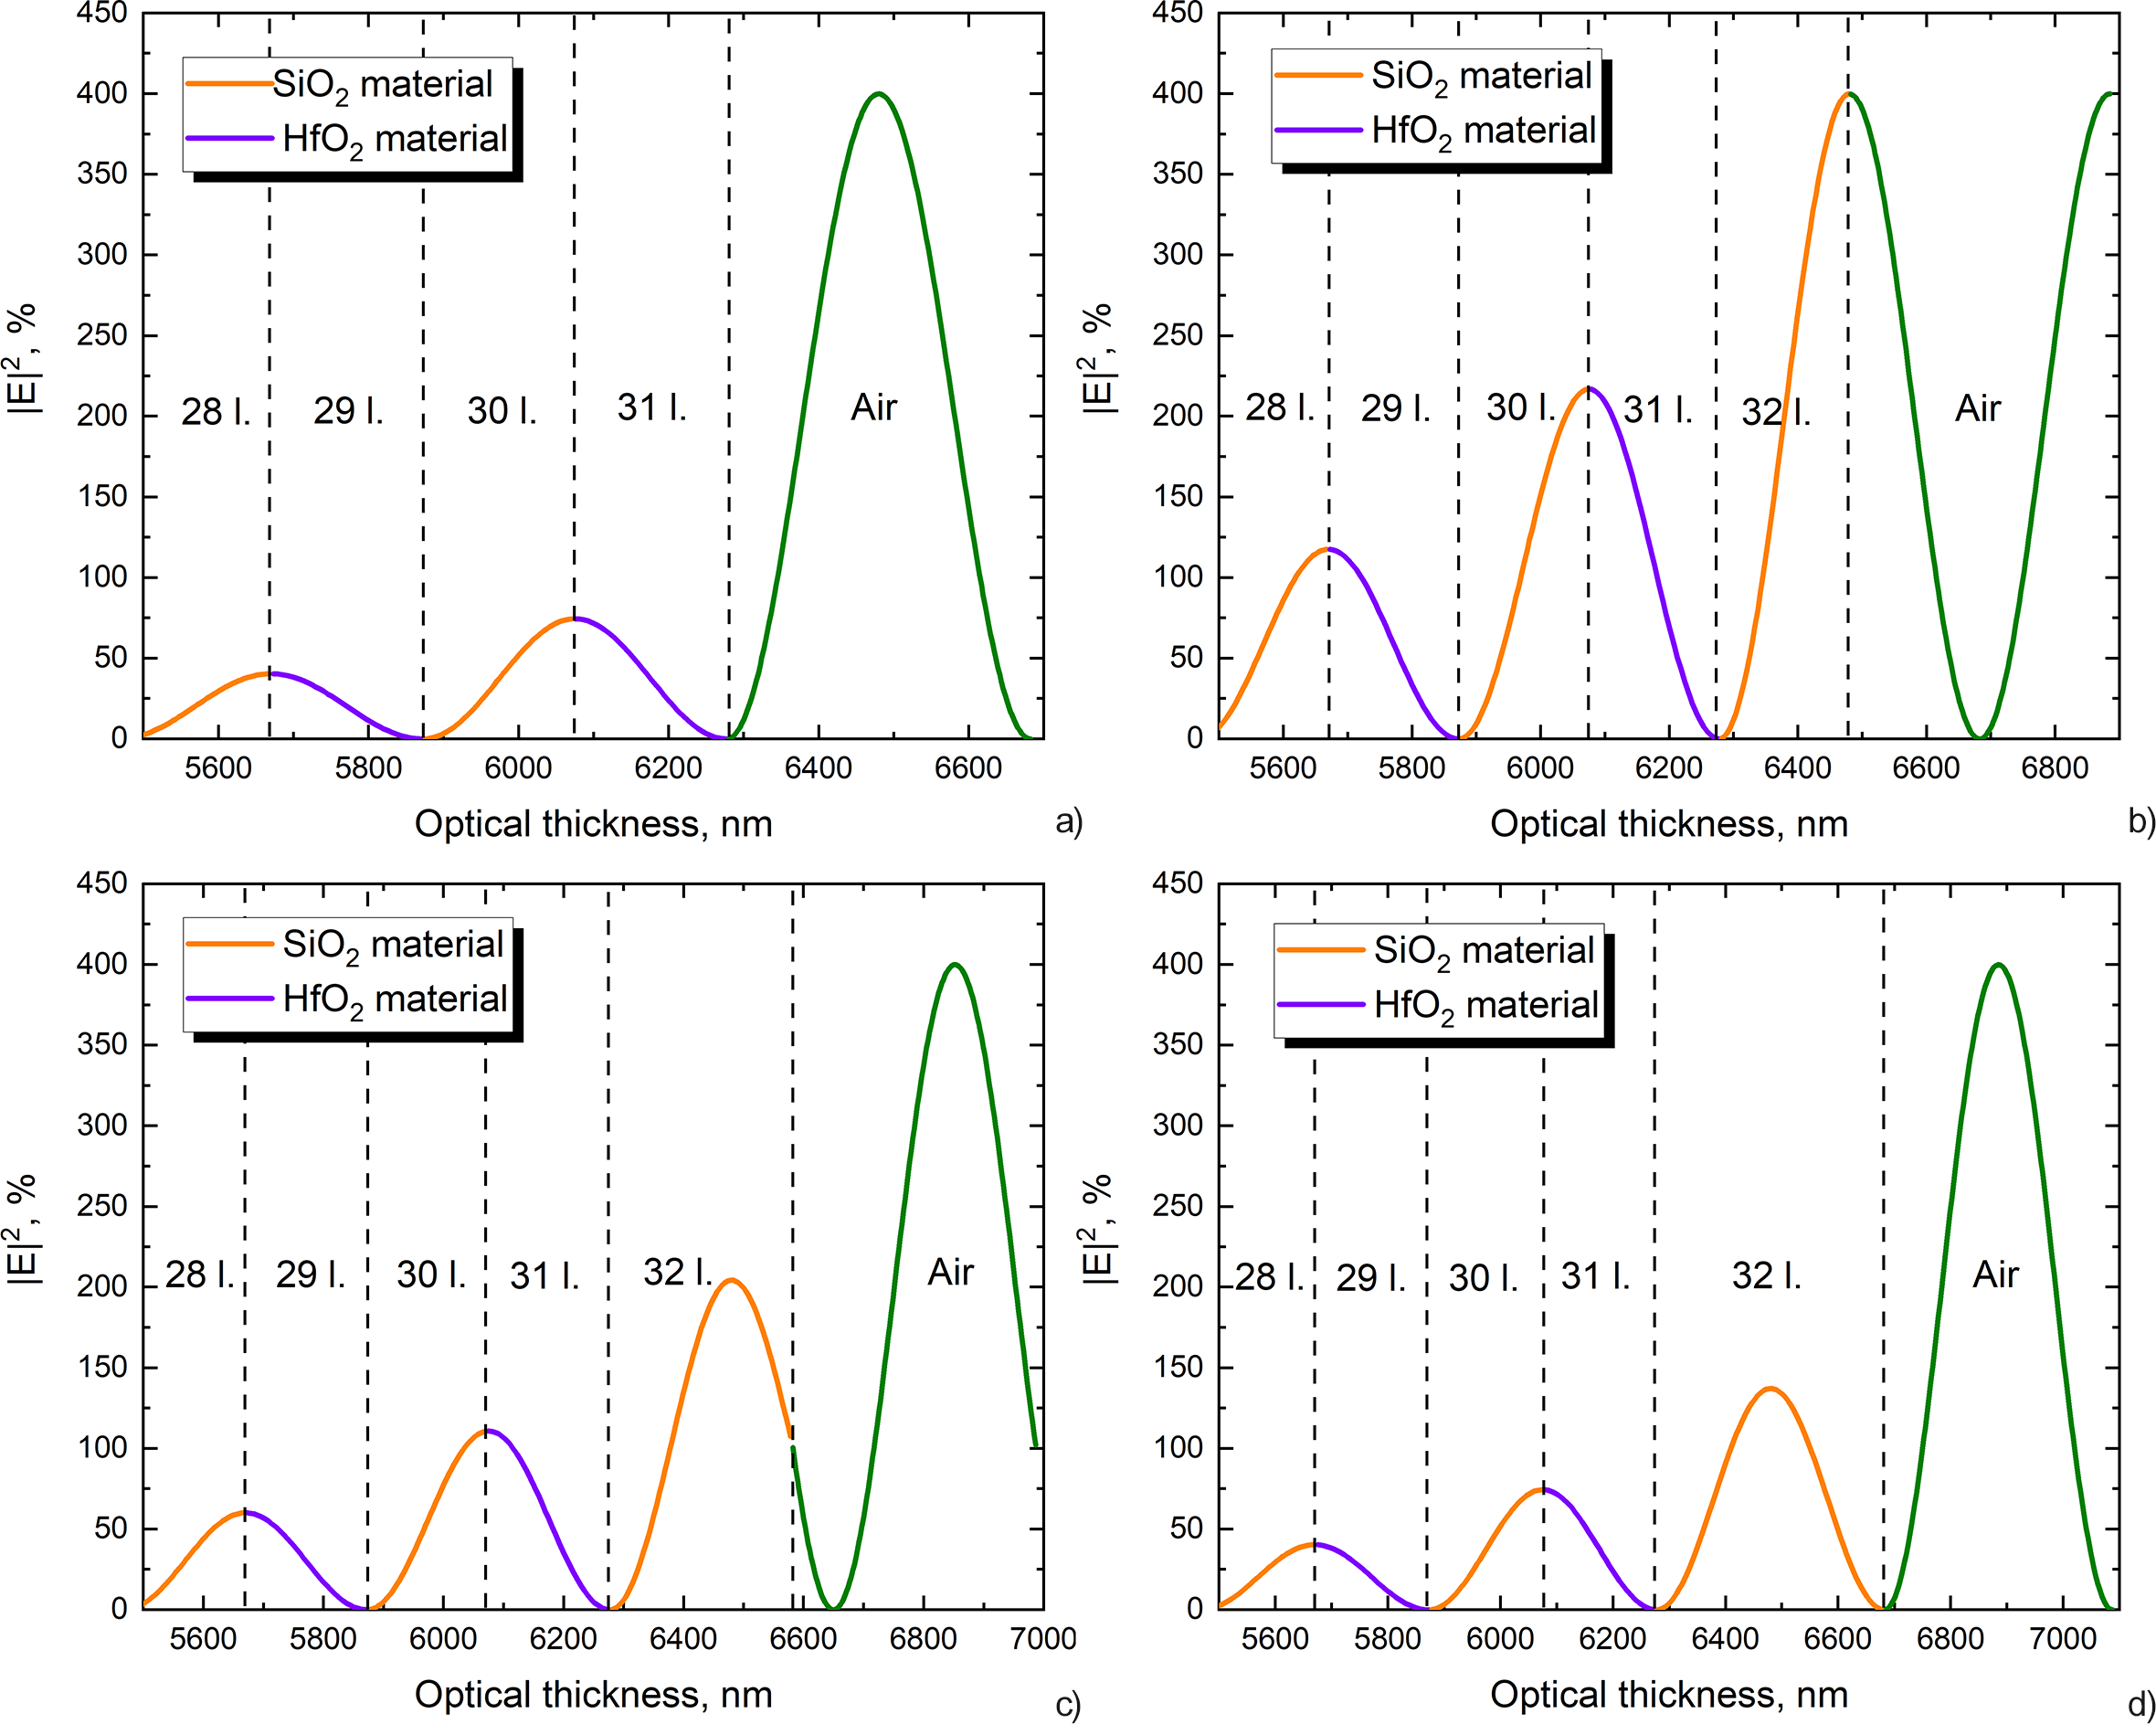
; Astrella (Coherent)). Each sample was irradiated at one site with a fixed fluence of 350 mJ/cm2, which was attenuated by a half-waveplate and polarizer combination. Samples were also tested at 150 mJ/cm2 fluence and no LIC was detected. From our previous measurements of similar coatings we know that the threshold of LID can be somewhere between 500 mJ/cm2 and 1 J/cm2 depending on E-field distribution. This value may be reduced using several million pulses. Therefore, the irradiation at lower values, namely 350 mJ/cm2, was considered as safe value for investigation. The laser beam was directed to the vacuum chamber, which was pumped to the level of 10–6 mbar using mechanical and turbomolecular pumps. The beam size was set by an f = 800 mm concave mirror and fixed at 360 μm in diameter. The direct beam profile was recorded before and after the experiments with a charge-coupled device (CCD) camera by tilting the sample 90 deg with respect to the analysis position (shown in Figure 3) and during the tests with a leak camera. Samples were irradiated at 45 deg AOI. Each site was irradiated at 1 kHz for 3 h with a total of 10.8 million pulses. Prior to the measurements, residual gas analysis (RGA) was recorded to follow the vacuum quality by a quadrupole mass spectrometer (Extorr). The setup of the LIC system is presented in Figure 3.
$f=1\;\mathrm{kHz}$
; Astrella (Coherent)). Each sample was irradiated at one site with a fixed fluence of 350 mJ/cm2, which was attenuated by a half-waveplate and polarizer combination. Samples were also tested at 150 mJ/cm2 fluence and no LIC was detected. From our previous measurements of similar coatings we know that the threshold of LID can be somewhere between 500 mJ/cm2 and 1 J/cm2 depending on E-field distribution. This value may be reduced using several million pulses. Therefore, the irradiation at lower values, namely 350 mJ/cm2, was considered as safe value for investigation. The laser beam was directed to the vacuum chamber, which was pumped to the level of 10–6 mbar using mechanical and turbomolecular pumps. The beam size was set by an f = 800 mm concave mirror and fixed at 360 μm in diameter. The direct beam profile was recorded before and after the experiments with a charge-coupled device (CCD) camera by tilting the sample 90 deg with respect to the analysis position (shown in Figure 3) and during the tests with a leak camera. Samples were irradiated at 45 deg AOI. Each site was irradiated at 1 kHz for 3 h with a total of 10.8 million pulses. Prior to the measurements, residual gas analysis (RGA) was recorded to follow the vacuum quality by a quadrupole mass spectrometer (Extorr). The setup of the LIC system is presented in Figure 3.
Schematic of the experimental setup used for the LIC test.

Qualitative analysis of LIC was performed by an optical microscope (LEXT OLS5100SAF (Olympus)). Different magnifications were used for a general overview of irradiated sites and characteristic features. All images were obtained in reflection mode and using differential interference contrast (DIC) microscopy.
The surface of the ‘1L’ experimental sample was also analyzed using atomic force microscopy (AFM). For measuring the sample we used AFM Nanowizard 3 from JPK Instruments, Germany (now Bruker, United States), operated via control station VortisTM and Advanced SPMControl and controlled via JPK SPM Desktop software, which is placed on top of an inverted microscope Olympus IX73. Data were processed with JPK data processing software. The sample was measured in AC mode with the use of an Acta cantilever from AppNano.
The reflectance of all experimental samples was measured using a Photon RT spectrophotometer (EssentOptics). Measurements were performed in a clean-room environment, at room temperature. Reflectances at 45 deg AOI were measured for s- and p-polarizations using linearly polarized light.
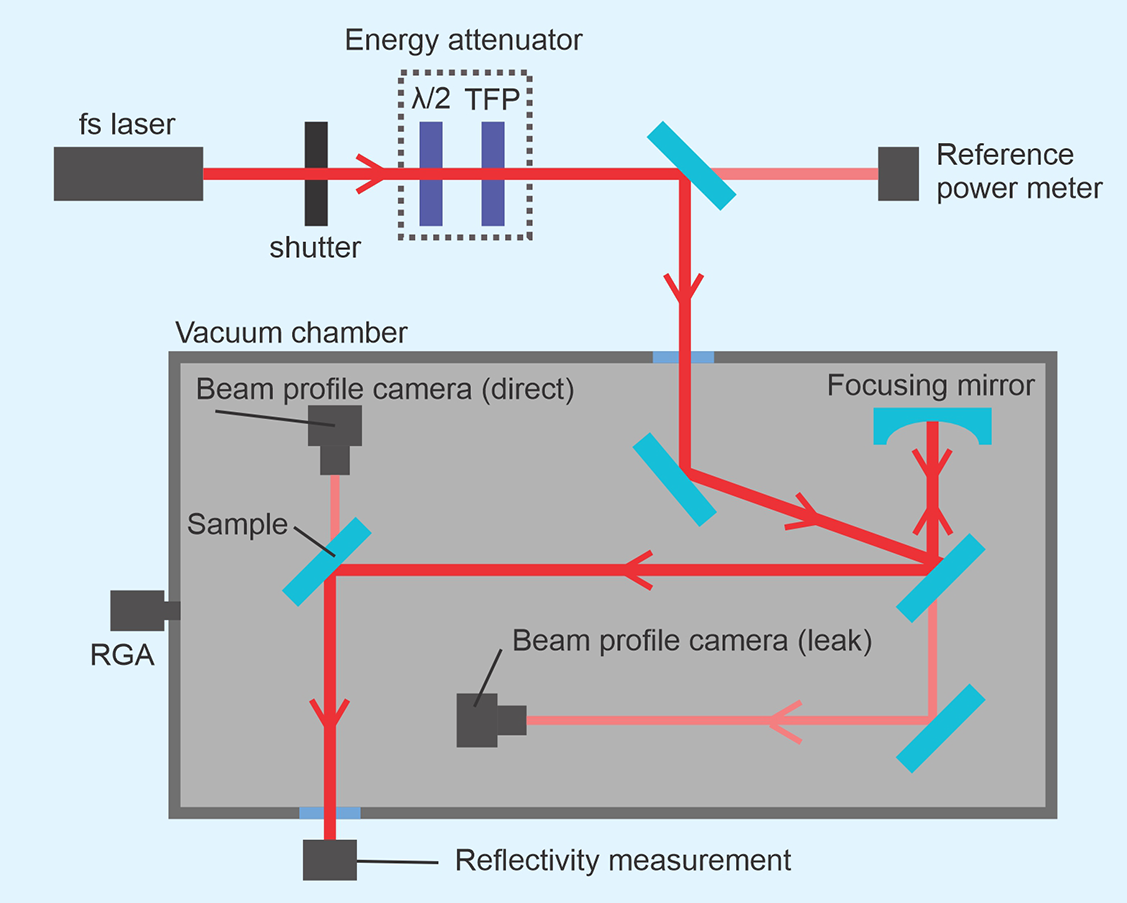
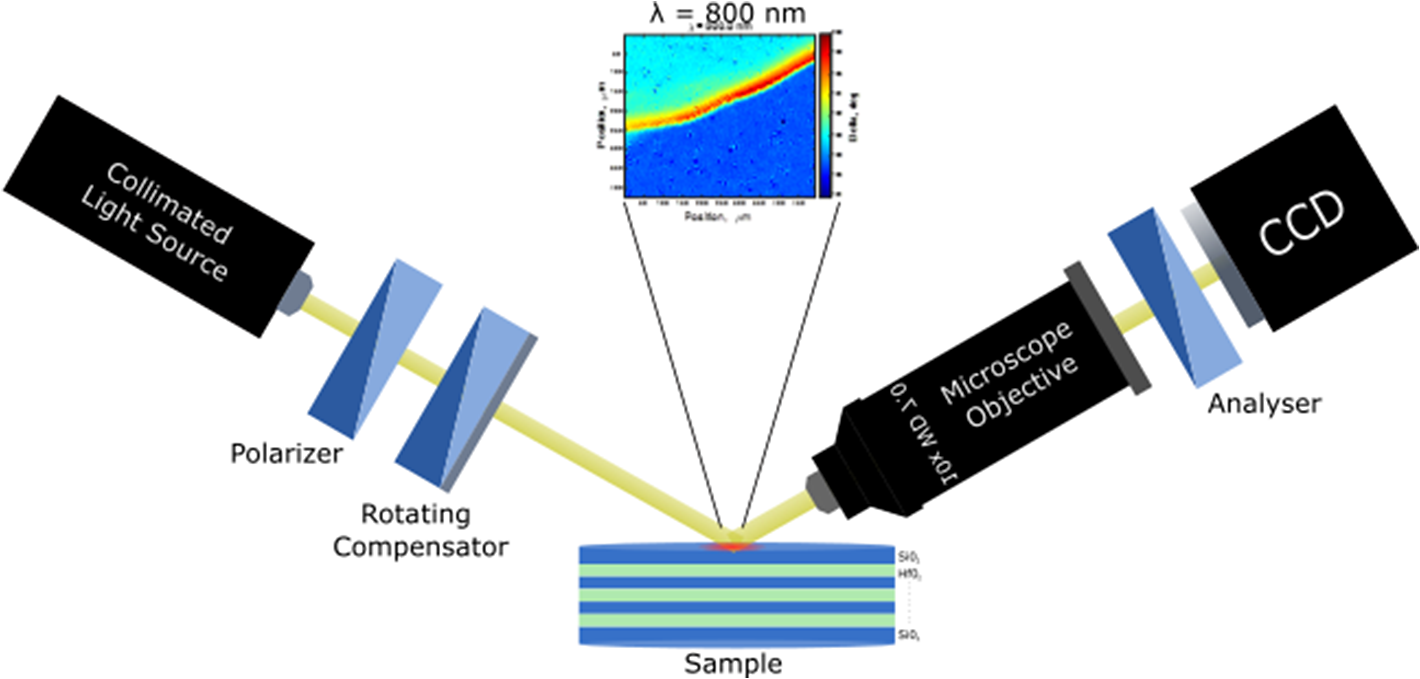
Spectroscopic imaging ellipsometry (SIE) measurement of the ellipsometric angles Ψ and Δ was performed on the multilayer dielectric mirrors with an imaging ellipsometry spectrometer, EP4 (Accurion), in nulling mode. The objective of the EP4 was a Nikon CF Plan SLWD 10× (numerical aperture (NA) = 0.21). All the experiments were performed in ambient conditions at room temperature, across the 450–1000 nm wavelength range. The monochromatic light was provided by a laser-driven xenon lamp and a monochromator. Measurements were performed with equally spaced steps of 5 nm at an AOI of 50°. The principal schematics and main components of the imaging ellipsometry setup are shown in Figure 4.
Principal schematic of scanning imaging ellipsometry used for detecting LIC sites on experimental samples.

For SIE, the light passes through a polarizer for linear polarization and then through a compensator to produce elliptically polarized collimated light such that the light reflected from the sample is again linearly polarized. The reflected light passes through a 10× objective and an analyzer to a CCD camera enabling a lateral resolution of approximately equal to 1 μm. In an appropriate coordinate system, the complex reflectance matrix is described by $\rho = r_\mathrm{p}/r_\mathrm{s} = \mathrm{tan}\varPsi \cdot e^{i\Delta}$
, with
$\rho = r_\mathrm{p}/r_\mathrm{s} = \mathrm{tan}\varPsi \cdot e^{i\Delta}$
, with $r_\mathrm{p}$
and
$r_\mathrm{p}$
and $r_\mathrm{s}$
being the amplitudes of the parallel (p) and orthogonal (s) components of the reflected light normalized to their initial amplitudes (amplitude of incoming light) and the ellipsometric angles Ψ and Δ, respectively[
Reference Drude
12
].
$r_\mathrm{s}$
being the amplitudes of the parallel (p) and orthogonal (s) components of the reflected light normalized to their initial amplitudes (amplitude of incoming light) and the ellipsometric angles Ψ and Δ, respectively[
Reference Drude
12
].
In the SIE mode, the intensity of the reflected light is minimized by a 90 deg alignment of the analyzer with respect to the reflected light fulfilling the nulling condition[ Reference Bashara and Azzam 13 , Reference Tompkins and Irene 14 ] for the selected region of interest (ROI). The ROI is a certain area on the sample under investigation and, therefore, just a reduced number of pixels on the CCD camera will be used to adjust for the nulling conditions. The ROI can be as small as the area of an individual pixel on the CCD. Here, an ROI is defined such that selected pixels are accumulated to achieve a sufficient signal to noise ratio. The area of the sample has been divided into two equally sized ROIs with a lateral size of about 100 μm × 50 μm. In this way, the Ψ- and Δ-values, representing amplitude and phase difference between the respective polarization components, respectively, are taken individually for different ROIs on the sample with a high lateral resolution given by the overall resolution of the optics in the reflected light beam. For SIE maps, the polarizer and analyzer angles are determined by fulfilling the nulling condition for each ROI.
3 Results and discussion
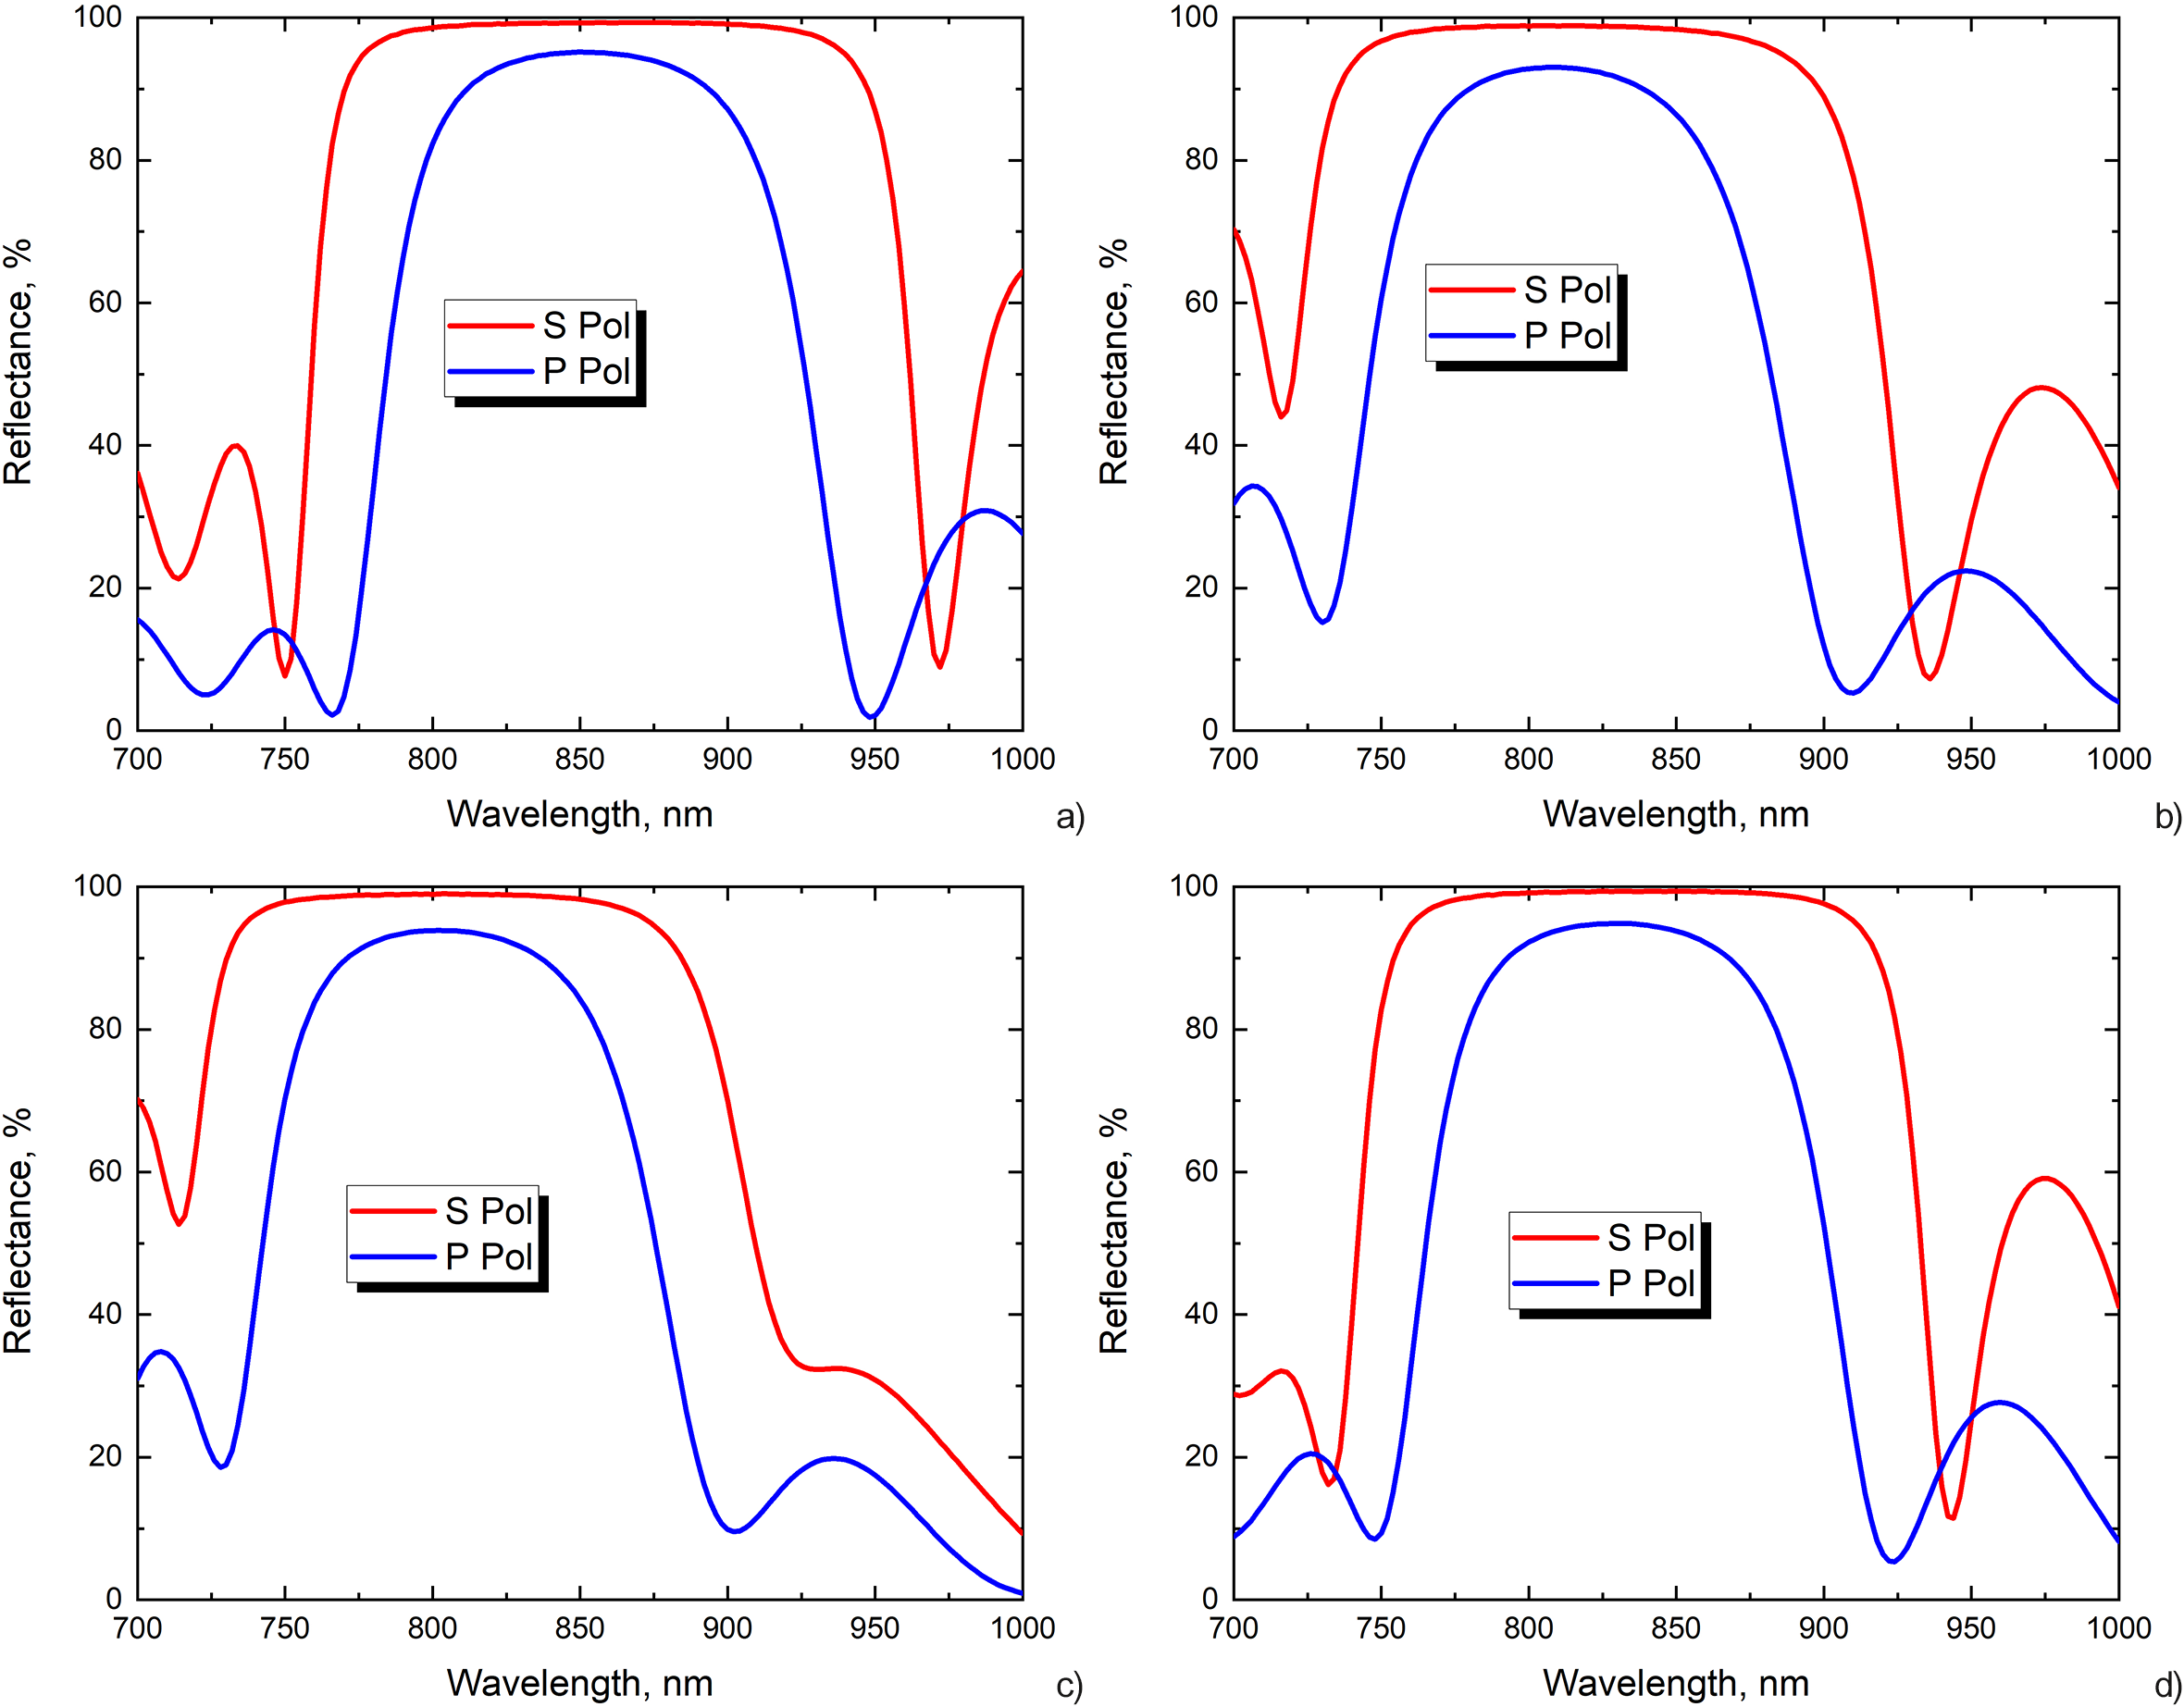
Each of the experimental samples is a Bragg mirror at 810 nm wavelength. Therefore, the spectral properties near the Bragg region should be similar. Reflectance measurements of experimental samples are presented in Figure 5. The reflectance at the wavelength of 810 nm exceeds 99.5% for s-polarization for all the samples at the angle of 45 deg. The characteristics of the spectra within the Bragg zone are typical for QWOT-based dielectric mirrors. Further from the reflectance zones, the reflectance curves differ due to individual thicknesses of the last layer in each of the samples.
Spectrophotometric measurements for s- and p-polarized light reflectance of the (a) ‘0L’, (b) ‘1L’, (c) ‘1.5L’ and (d) ‘2L’ experimental samples before the laser irradiation.

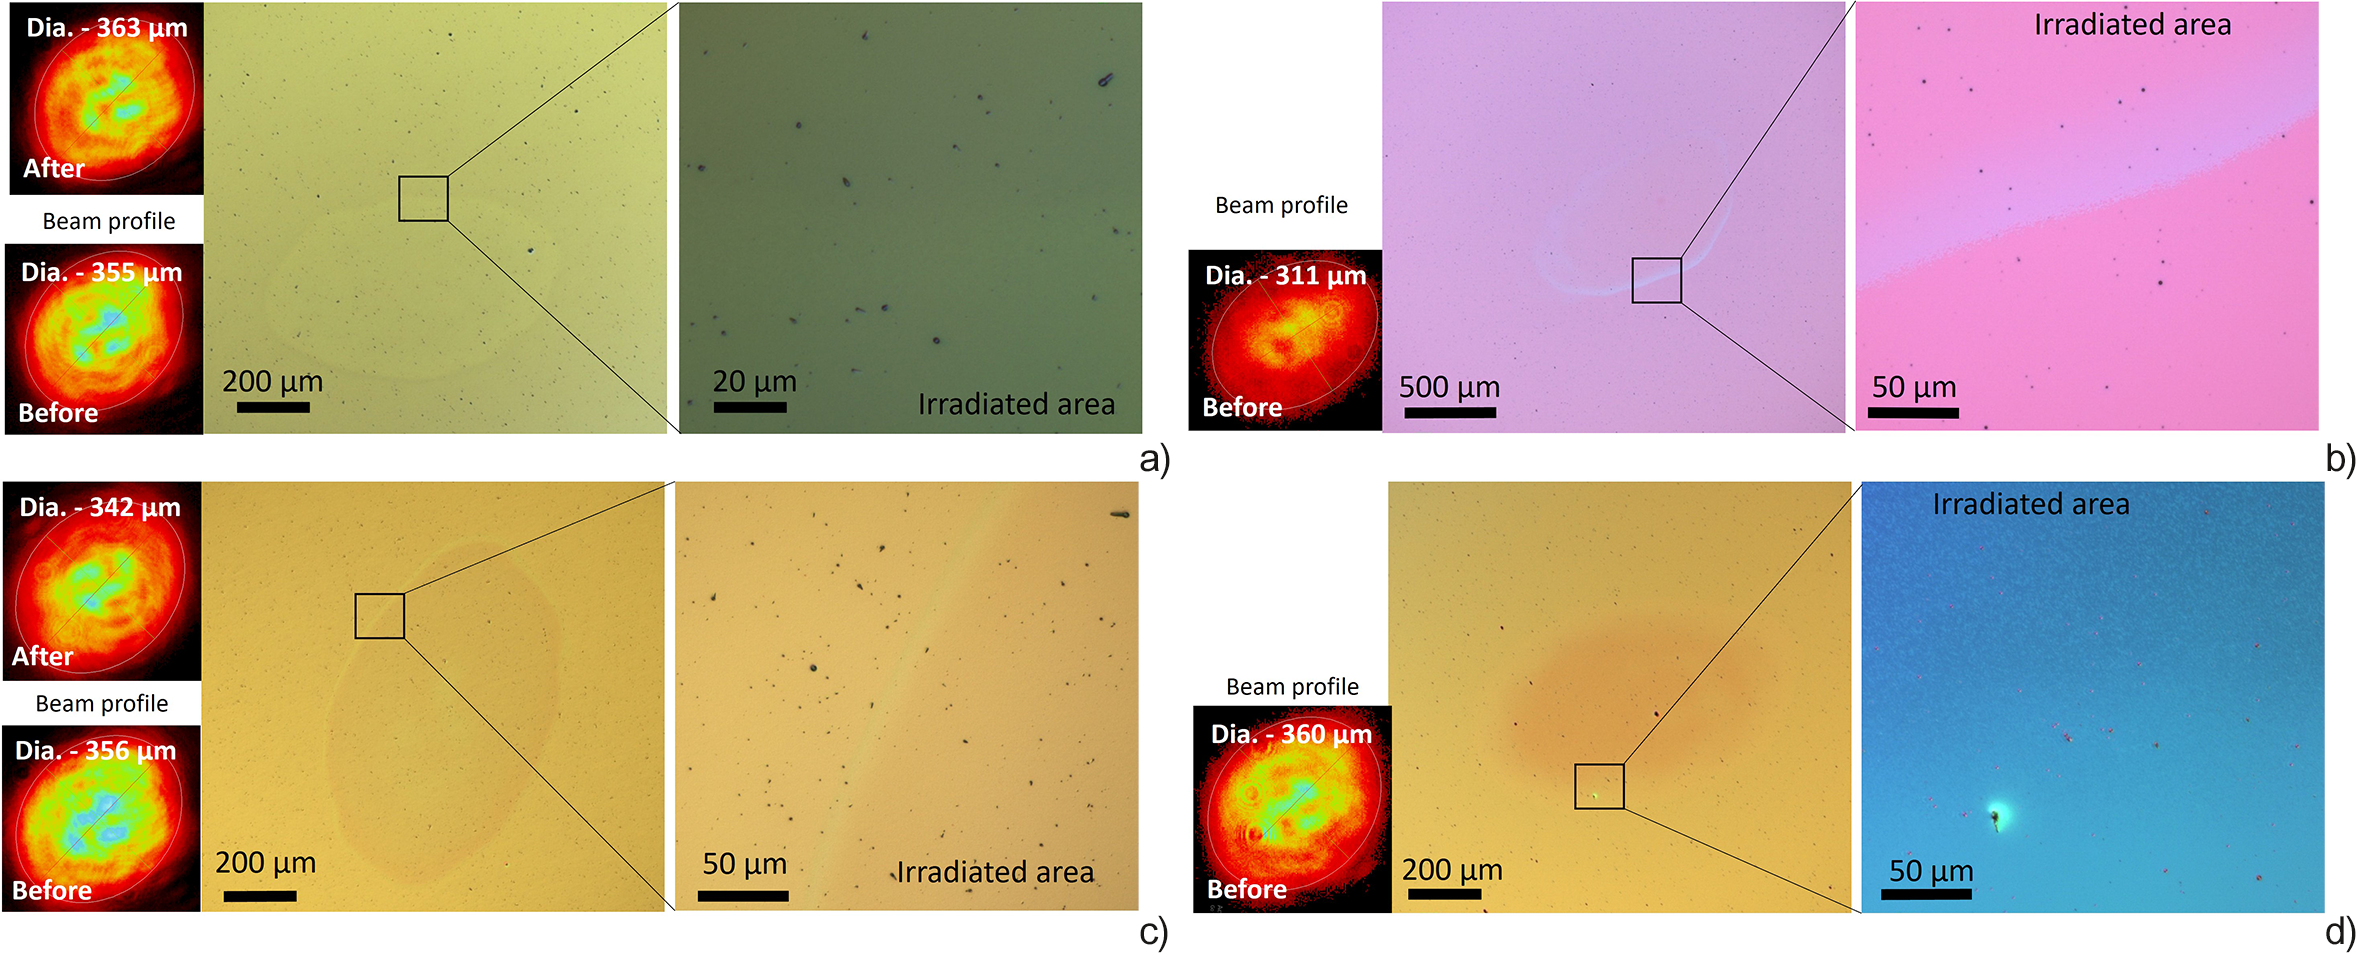
LIC areas are presented in Figure 6. Each irradiated spot is plotted with corresponding beam profile measurements and zoomed on the edge of the image for better observation. Irradiation of the sample with the hafnia layer on top (‘0L’, Figure 6(a)) resulted in a barely visible contamination spot. Sharper discoloration is seen at the edges, but zooming by a 100 magnification long focal length lens system showed no distinctive difference between the two areas. The size of the contaminated area was determined by fitting the elliptical shape, which had 493 and 821 μm minor and major axes, respectively, in this case. A more distinctive irradiation imprint can be seen for the ‘1L’ sample (Figure 6(b)). The discoloration of induced contamination gradually changes going from the center to the edge. The size of the observed contamination was 734 and 1223 μm for the minor and major axes, respectively. For the experimental sample ‘1.5L’ (Figure 6(c)), the irradiation imprint is also distinctive and clear edges are observed. The induced contamination is seen as discoloration of the area with the size of 576 and 960 μm for the minor and major axes, respectively. The last sample, namely ‘2L’ (Figure 6(d)), contained a darkened irradiation imprint with a similar size to the ‘0L’ sample case. The zoomed image indicates the rough structure of the contamination.
Images of LIC of the (a) ‘0L’, (b) ‘1L’, (c) ‘1.5L’ and (d) ‘2L’ experimental samples obtained by DIC microscopy. For the observation of the full irradiated spot, magnifications of 5× and 10× were used by standard lens systems. In the zoomed areas, long focus lenses of 50× or 100× were used. The small images on the left-hand side are beam profile measurements by CCD camera in each case before or after irradiation (normal to beam propagation).

According to the beam profile measurements, the peak intensity was at the center of the spot following a Gaussian profile. Such a profile was not embedded in any of the experimentally observed features during irradiation for 3 h. In contrast, the edges of the irradiated spots were affected the most.
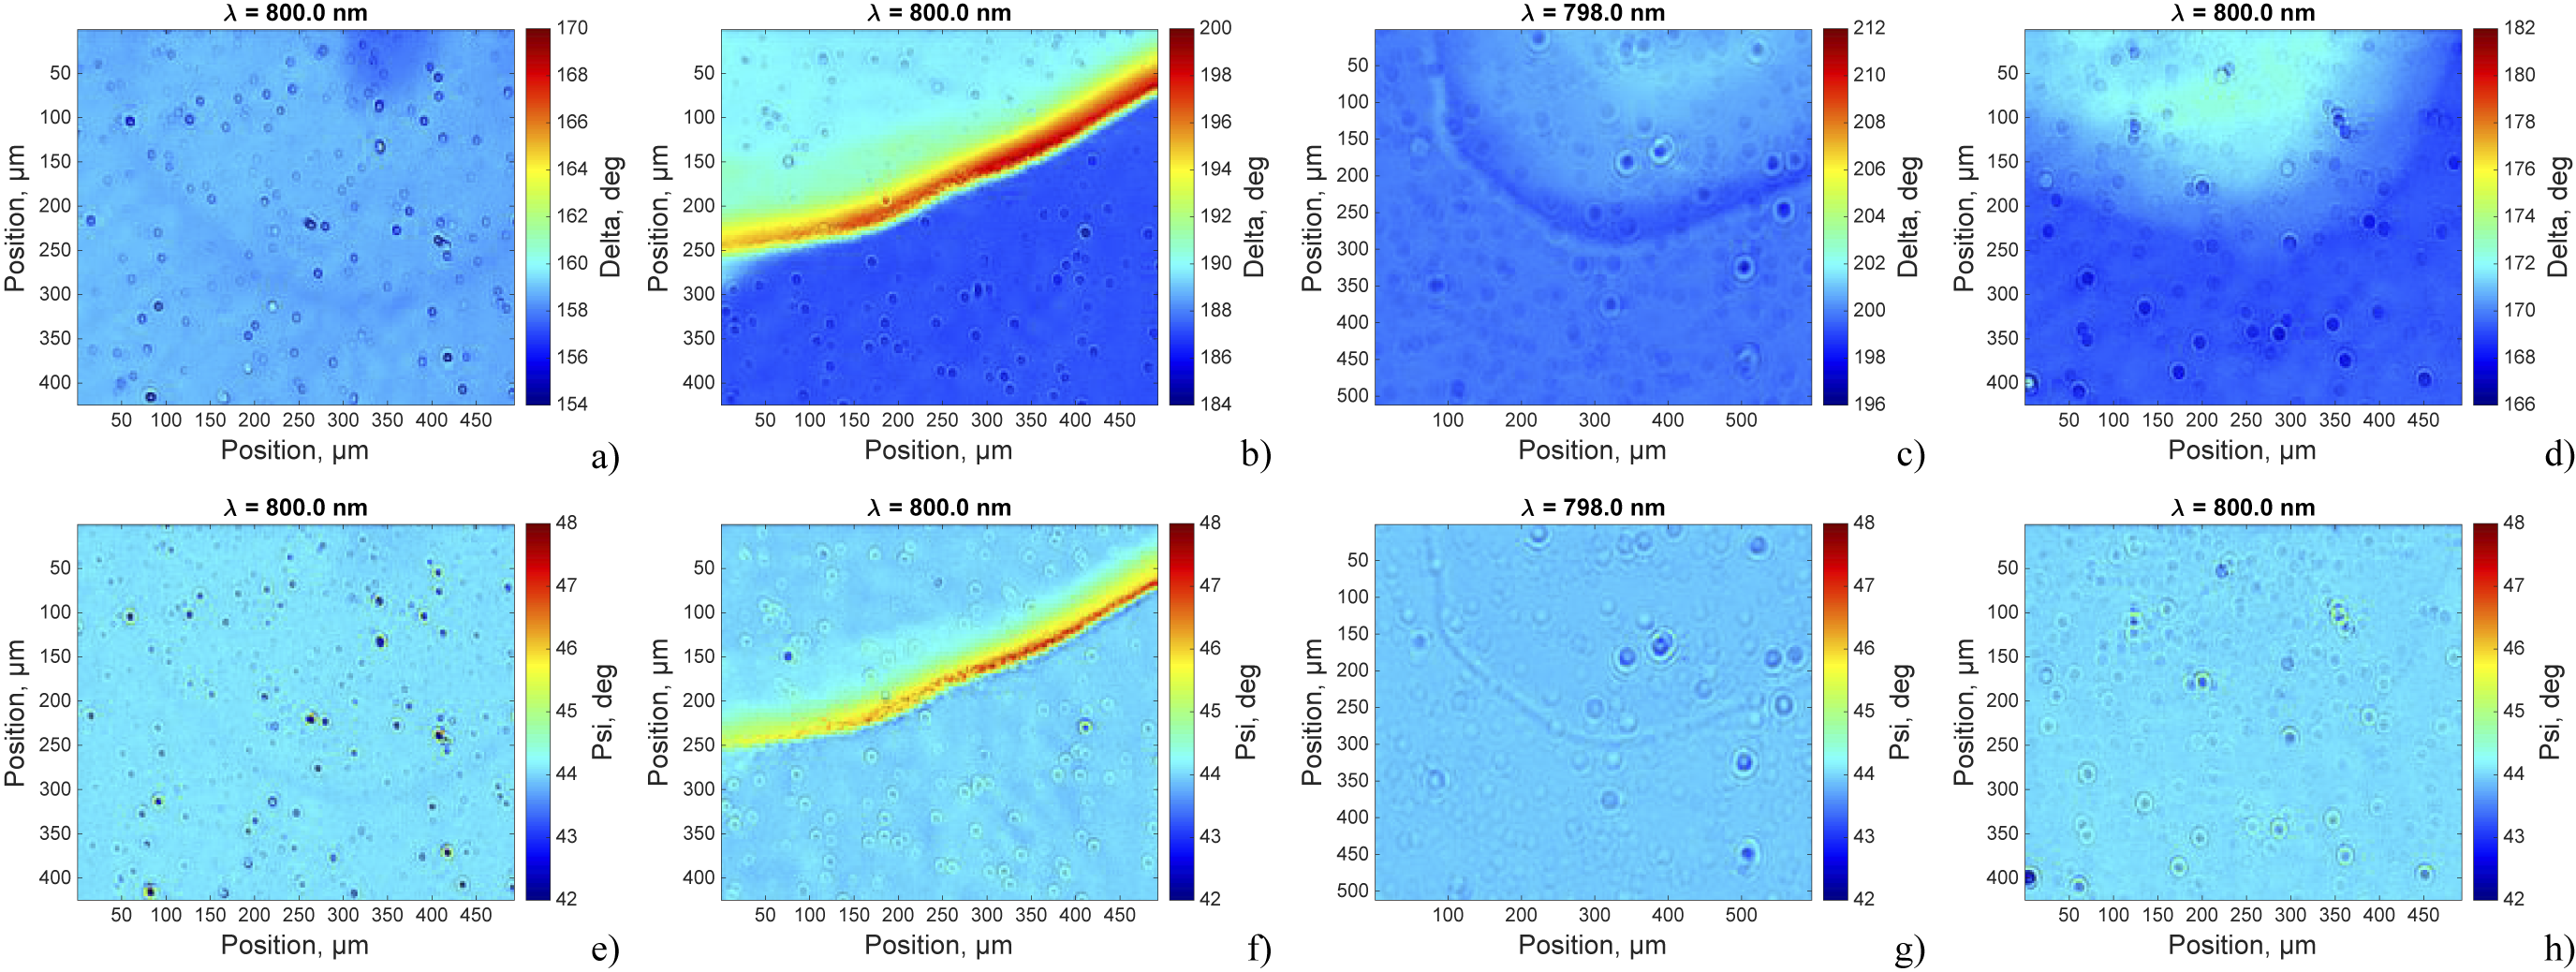
Imaging ellipsometry measurements of the area containing clear and irradiated surfaces are presented in Figure 7. Results are presented only at the 800 nm wavelength, which is within the Bragg zone for all the samples. The data at other wavelengths, which are close to the reflection zone, are similar. The absolute value of the delta (∆) parameter is different for each of the samples, but the differences of max and min in the graph colorbars (range of 16 deg) were kept the same for all the samples for better comparison. Differences of irradiated areas are visible in all cases. The largest difference was detected for the sample ‘1L’ (Figure 7(b)). A gradual increase of the delta parameter was mostly observed at the edge of the contaminated area (Figures 7(a)–7(d)).
Imaging ellipsometry measurement maps at 800 nm wavelength of the delta parameter for the (a) ‘0L’, (b) ‘1L’, (c) ‘1.5L’ and (d) ‘2L’ experimental samples and of the psi parameter for the (e) ‘0L’, (f) ‘1L’, (g) ‘1.5L’ and (h) ‘2L’ experimental samples.

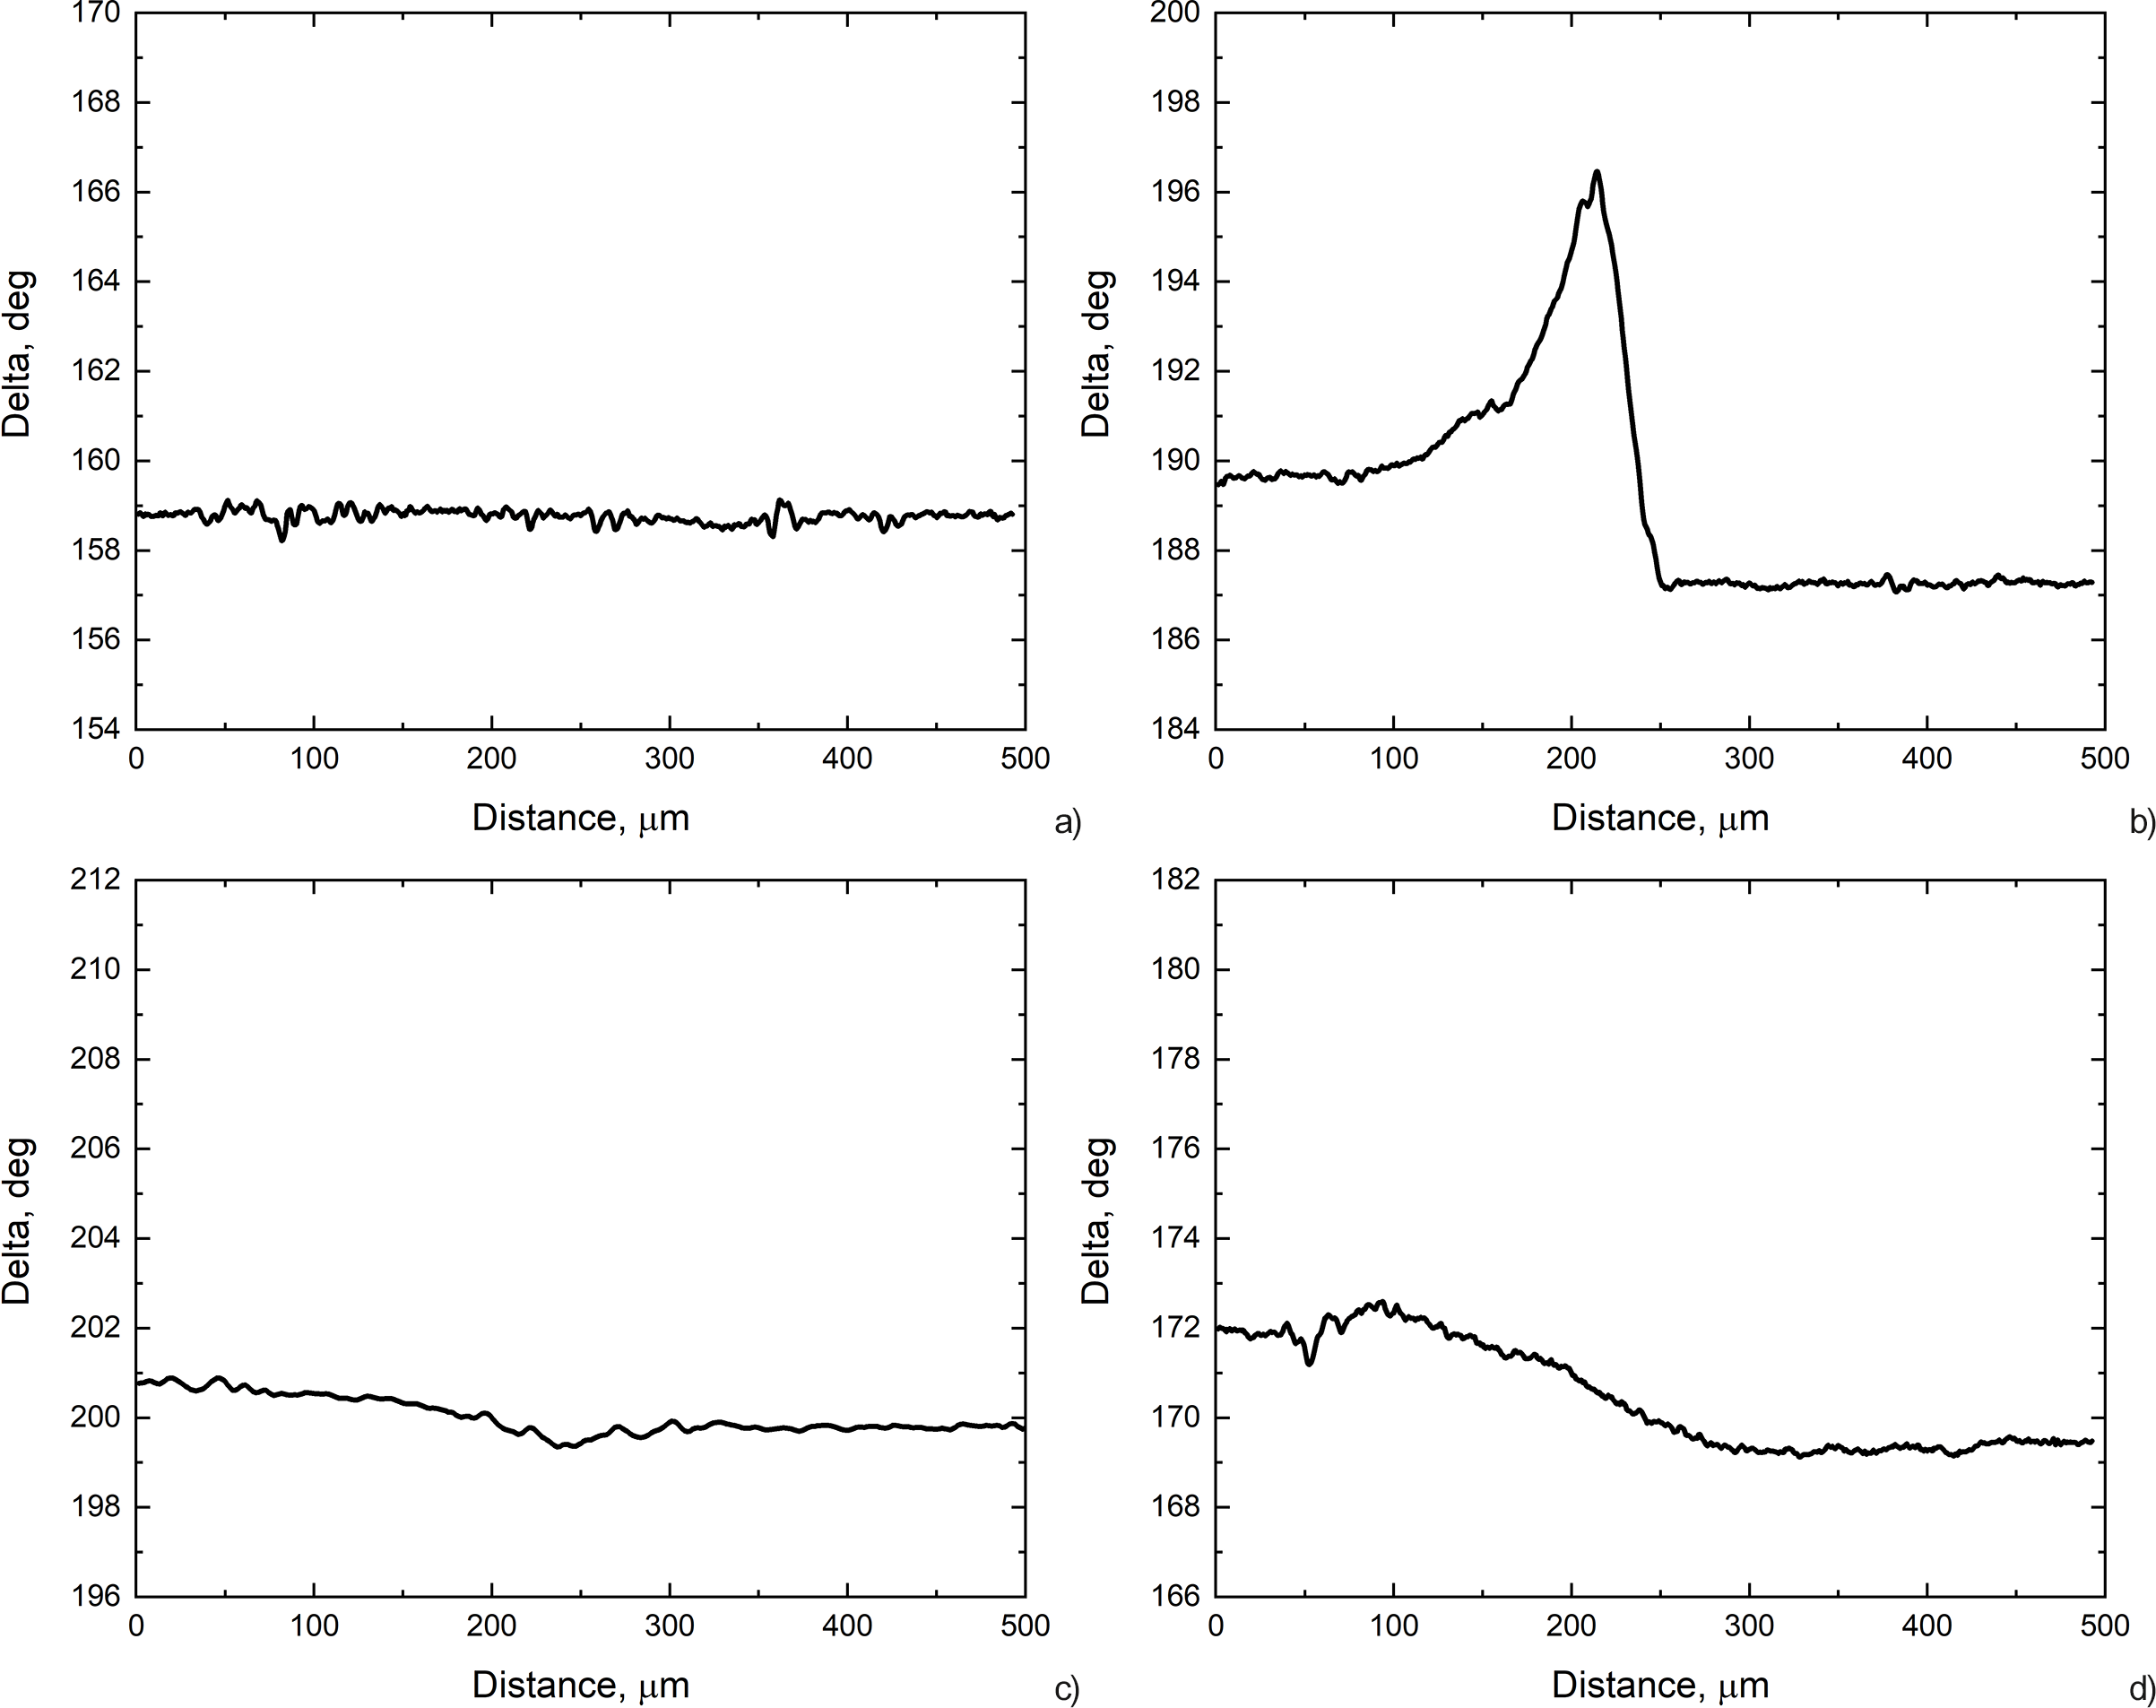
The Δ (delta parameter) represents the phase difference between the reflected p-polarized (parallel) and s-polarized (perpendicular) components of light after the reflection. An increase or decrease of Δ indicates a modification in the optical structure of the material. LIC modifies the surface dielectric properties, leading to a shift in Δ. For quantitative comparison, cross-sections of delta parameter surface maps were plotted (see Figure 8). The values were collected by taking averaged data from the 30 μm width area (in the horizontal direction) and plotting them at each vertical coordinate. The changes of the delta parameter are minimal for the ‘0L’ sample and fluctuate within less than 1 deg throughout the scan length (Figure 8(a)). Delta for the ‘1L’ sample (Figure 8(b)), on the other hand, has largest variation between affected areas and clean surfaces (~10 deg at the edge of the irradiated area and approximately 2.5 deg for the central part of the contaminated spot). Variation of delta for the ‘1.5L’ sample (Figure 8(c)) is approximately 1 deg and for ‘2L’ (Figure 8(d)) it is approximately 3 deg.
Cross-section of the delta parameter for the (a) ‘0L’, (b) ‘1L’, (c) ‘1.5L’ and (d) ‘2L’ experimental samples.

The Ψ (psi parameter) represents the ration of amplitude between the p- and s-polarized light components after reflection. A decrease in Ψ indicates an increase in absorption or scattering due to surface contamination. The psi value for all the samples remains close to 45 deg and varies only within $\pm\ 5\ \mathrm{deg}$
(Figures 7(e)–7(h)). The largest fluctuation is visible for the ‘1L’ sample (Figure 7(f)), consistent with the strongest LIC effect. The increase in the psi parameter to the level of approximately 48 deg is located only at the edge of the irradiated area. Minimal Ψ variation (<1 deg) is observed in the ‘0L’ and ‘1.5L’ samples, confirming reduced contamination.
$\pm\ 5\ \mathrm{deg}$
(Figures 7(e)–7(h)). The largest fluctuation is visible for the ‘1L’ sample (Figure 7(f)), consistent with the strongest LIC effect. The increase in the psi parameter to the level of approximately 48 deg is located only at the edge of the irradiated area. Minimal Ψ variation (<1 deg) is observed in the ‘0L’ and ‘1.5L’ samples, confirming reduced contamination.
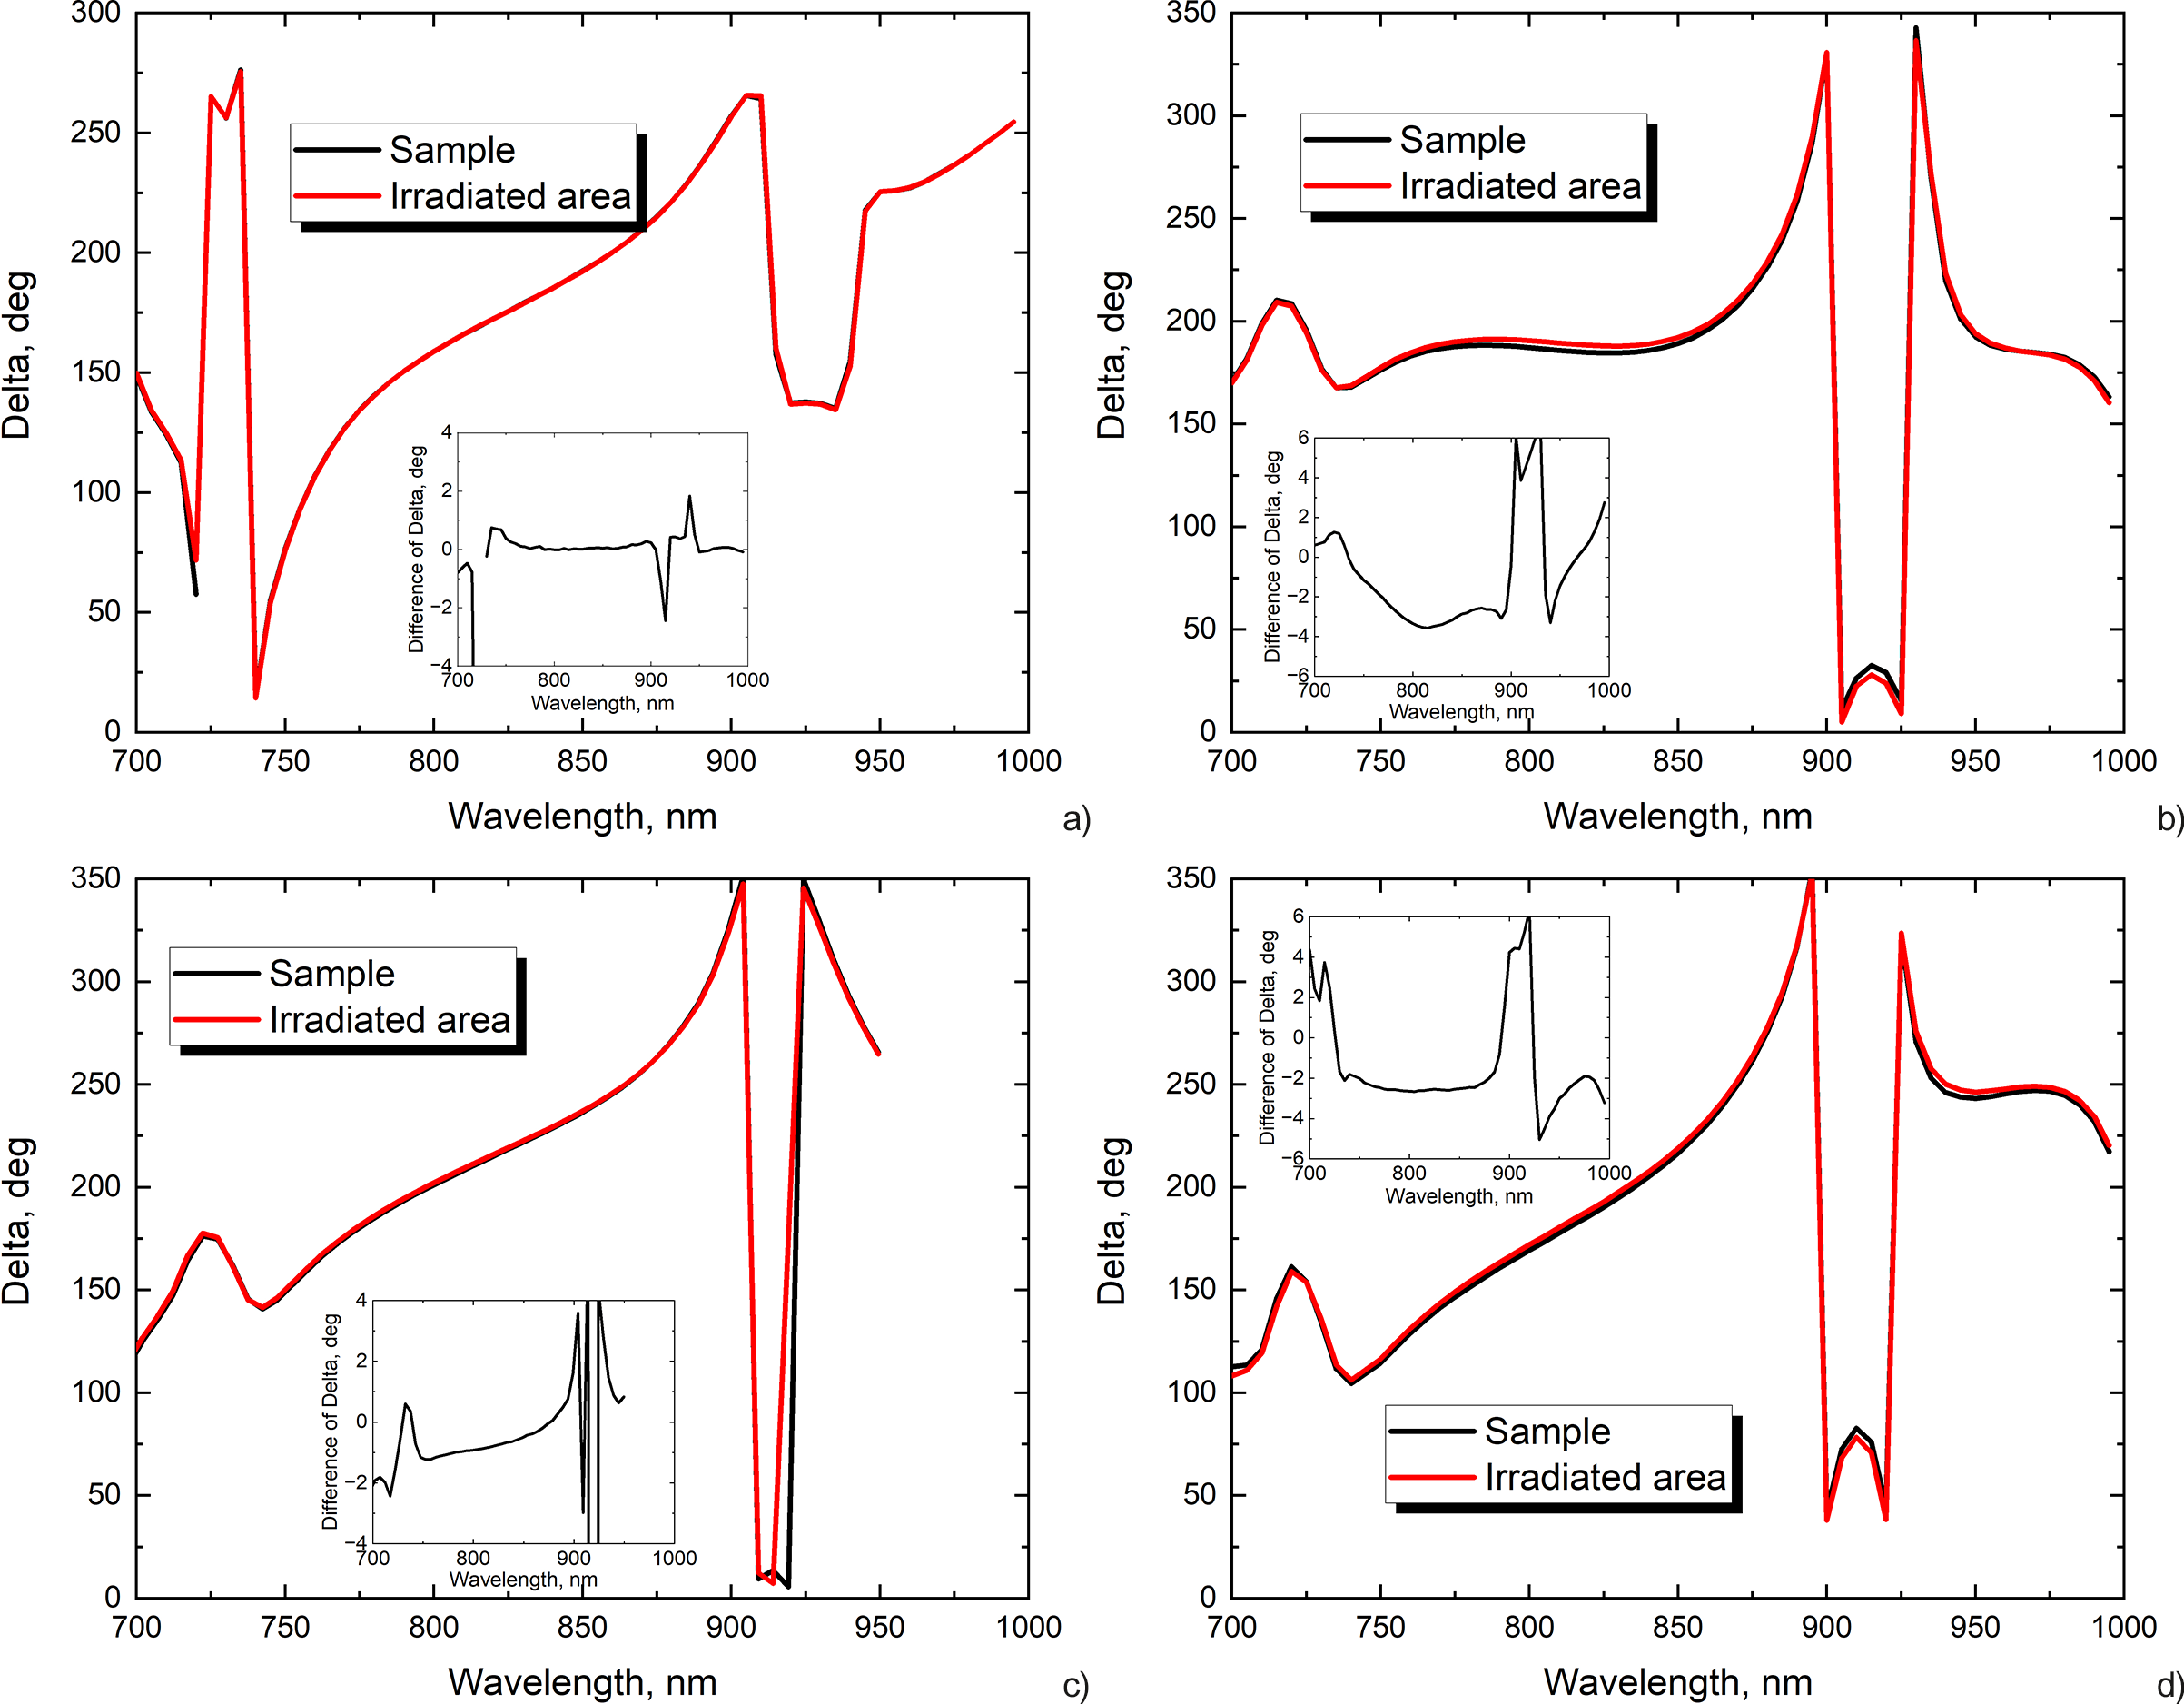
Ellipsometric measurements were taken beyond the Bragg region, for a broad spectral range from 450 to 1000 nm. The spectra close to the Bragg zone of the unaffected and irradiated sample areas are shown in Figure 9. The data were collected by averaging 30 μm × 30 μm spots of the maps (whole maps shown in Figure 7) for both cases (see Figure S1 in the Supplementary Material). Differences between the delta spectra are minimal for the ‘0L’ sample (Figure 9(a)) and ‘1.5L’ sample (Figure 9(c)) within the Bragg spectral zone. In case of the ‘1L’ (Figure 9(b)) and ‘2L’ (Figure 9(d)) samples, the differences reach 4 and 3 deg, respectively. Differences between irradiated and unirradiated surface areas are presented as insets of the respective graphs in Figure 9. The psi parameter remained similar (Figure S2 in the Supplementary Material) within the Bragg spectral zone for all experimental samples. This suggests that LIC introduces spectral dispersion, altering the surface optical properties beyond the primary reflection band.
Averaged spectroscopic ellipsometry delta parameter for irradiated and unirradiated zones of the (a) ‘0L’, (b) ‘1L’, (c) ‘1.5L’ and (d) ‘2L’ samples. Insets in each figure indicate the difference between the two respective datasets.

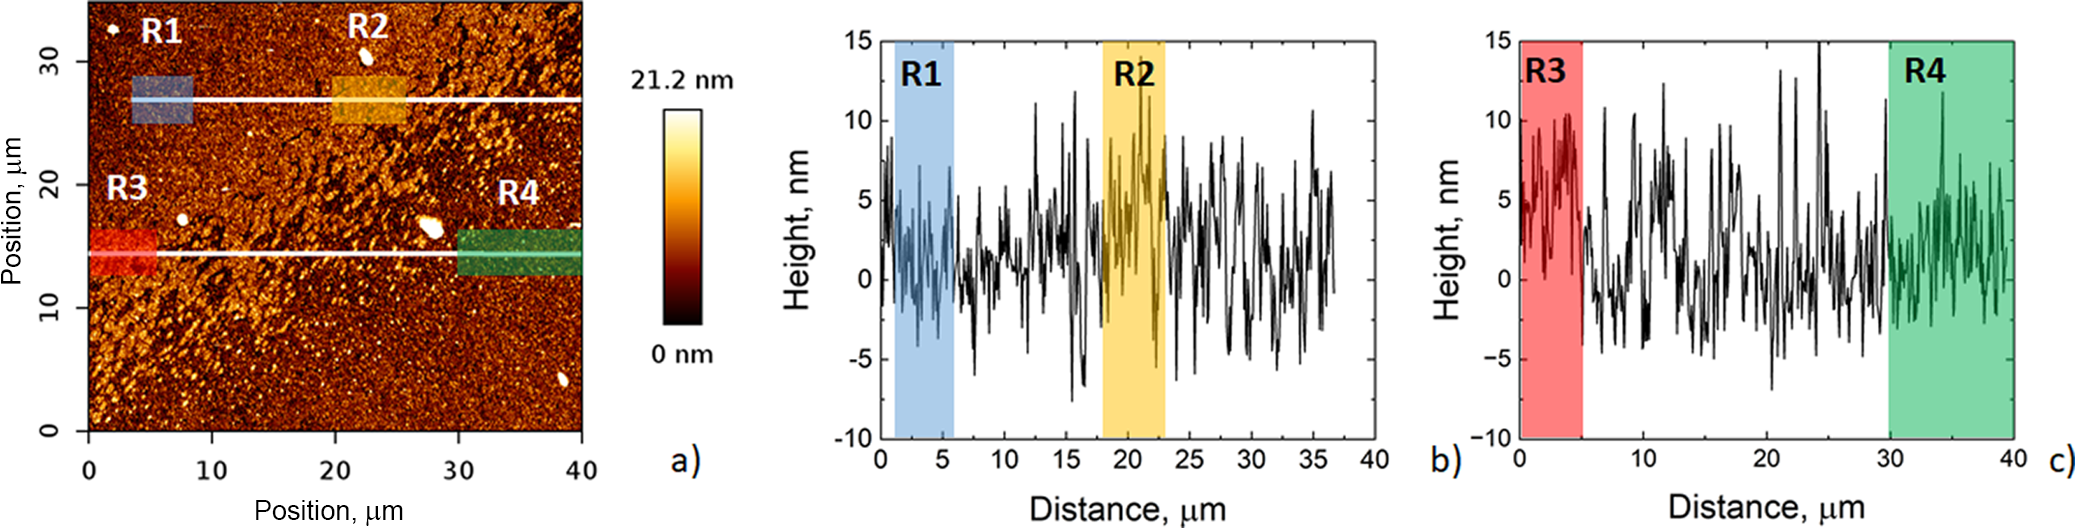
The thickness distribution of LIC for the ‘1L’ experimental sample was analyzed using AFM. The surface map for the area at the edge of the irradiated site is presented in Figure 10. Two height line scans were analyzed for comparison of height differences between the middle of the irradiated area (R1), the edge (R2 and R3) and the sample outside the LIC site (R4). The average values of height distribution for the R1 and R2 ranges are 1.5 and 3.8 nm, respectively. In the second line scan, the average values of height distribution for the R3 and R4 ranges are 5.4 and 1.8 nm, respectively. Therefore, the difference in surface heights between the center and edge of the LIC site is 2.3 nm. At the same time, the difference between the edge of the LIC site and the clear area is 3.6 nm. A three-dimensional (3D) plot is presented in Figure S3 of the Supplementary Material.
AFM analysis of the ‘1L’ experimental sample shown as (a) an image of the surface topography with indicated ranges in two line scans: R1, R2, R3 and R4. Cross-sections with height distributions are shown in (b) and (c).

4 Discussion
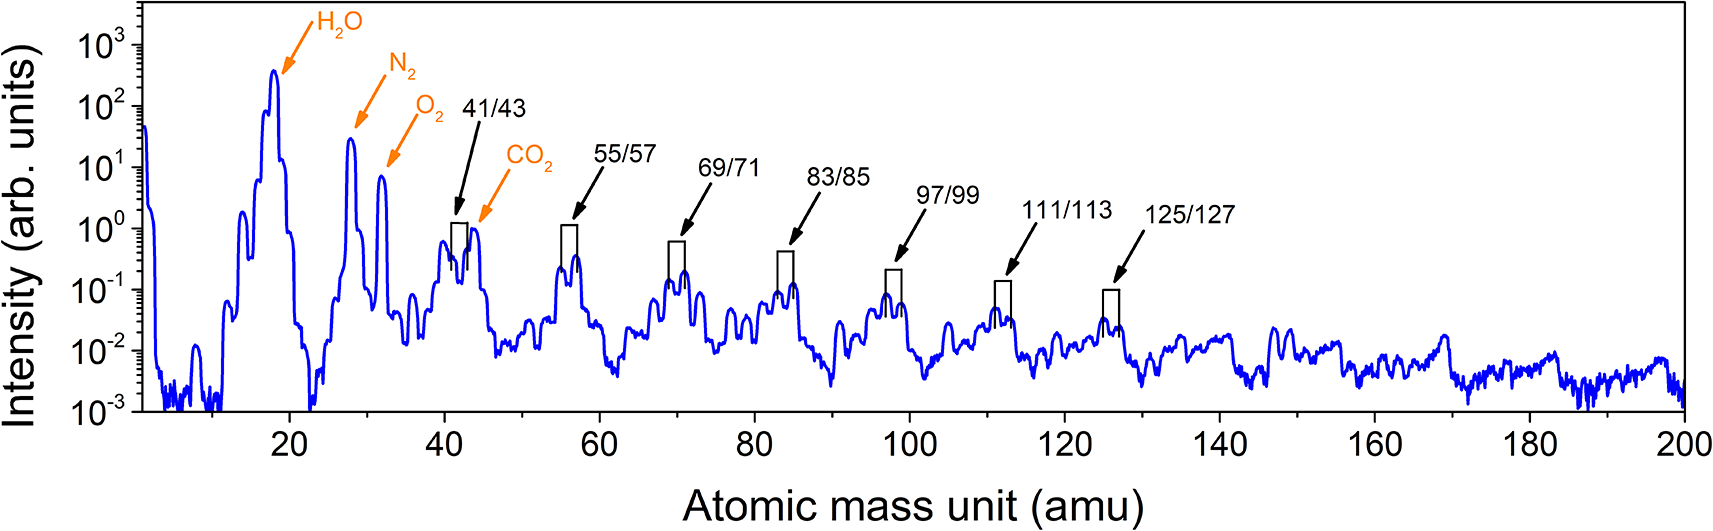
The pumping process took about 1 h to reach a pressure of 10–6 mbar. The chamber was previously vented through the primary scroll pump to obtain contamination levels common to many labs. No further cleaning was done after the pumping was carried out. To get insight into the contamination, RGA was sampled when the working pressure was reached prior to each LIC experimental run. The typical RGA spectrum is displayed in Figure 11. The series of all RGA measurements during the experiments are presented in the Supplementary Material (Figure S6) to show that contamination conditions during the experiments were similar.
RGA spectrum of the LIC chamber measured at 10–6 mbar prior to the experiments. The spectrum is normalized to the CO2 peak at 44 amu.

The RGA spectrum shows a presence of H2O, N2, O2 and CO2, which is expected during the pumping of a chamber from ambient air. Moreover, we can notice contamination by hydrocarbons. These hydrocarbons give fragments of C3H5 and C3H7 at 41 and 43 amu, respectively. The peaks are separated by 14 amu when going to higher atomic mass, corresponding to the mass increase of CH2. The doublet can be clearly seen up to 125/127 amu, indicating the presence of long molecular chains and an elevated amount of hydrocarbon contamination in general. Moreover, the ratio between the CO2 and hydrocarbon (C3H7) peaks, located at 44 and 43 amu, respectively, is 0.5 which also indicates a rather high amount of contamination compared to the standard limit of 0.01 used for laser experiments in high-vacuum environments[ Reference Hubka, Novák, Majerová, Green, Velpula, Boge, Antipenkov, Šobr, Kramer, Majer, Naylon, Bakule and Rus 6 , 15 ].
AFM analysis indicates the growth of the contamination layer on top of the coating. The edge of the irradiation site is thicker compared to the center, which agrees with the results of other research, that is, Ref. [Reference Hippler, Wagner, Schroeder and Riede7]. Besides the LIC phenomenon, the intense irradiation of the optical surface can also remove contamination. The pulse in the focal region reaches its peak intensity in the center. However, at the edges of the irradiating spot, the energy is insufficient for laser cleaning, so the contamination can accumulate more.
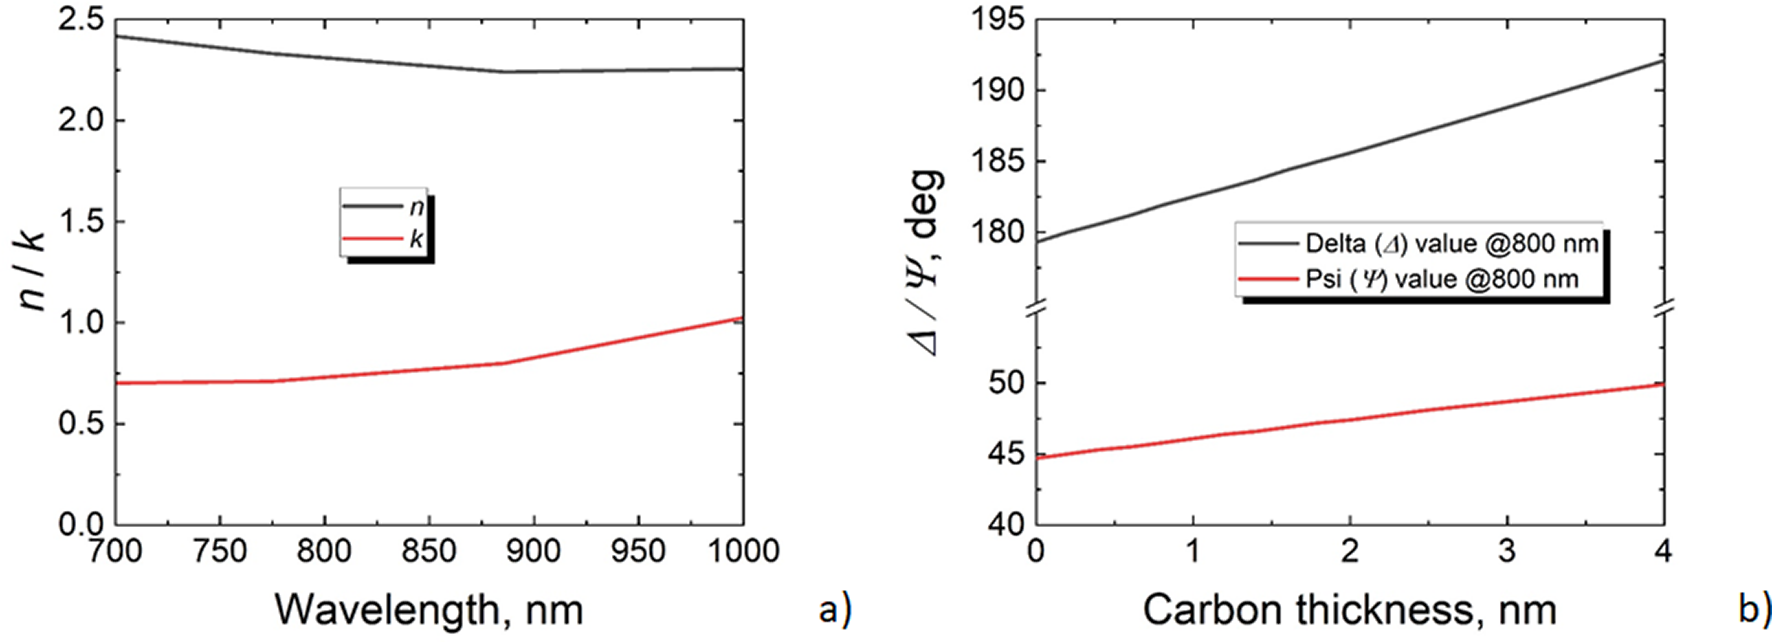
Simulations of ellipsometric parameters for the ‘1L’ experimental sample were performed using OTF Studio software[ 16 ] using different amorphous carbon thicknesses[ Reference Arakawa, Williams and Inagaki 17 ]. The optical parameters of carbon are shown in Figure 12(a). The growth of 3 nm of carbon increases the delta and psi values by 9 and 4 deg, respectively (see Figure 12(b)). Such values are very similar to the measured results, which are demonstrated in Figure 7. The absolute values are slightly different, which can be caused by deposition errors in the coating. Simulation results agree with AFM measurements close to the edge of the LIC spot. Therefore, it is reasonable to assume that contamination consists of a 3 nm carbon layer around the irradiated area.
Impact of ellipsometric psi and delta parameters by the growth of (a) an amorphous carbon layer of (b) different thicknesses.

Additional simulations were performed to evaluate the spectral reflectivity changes with and without the 3 nm amorphous carbon layer. Plots are presented in the Supplementary Material (Figure S5). Analysis indicates that changes in reflectance are large when the E-field values at the surface are above zero. Reflectivity can drop to approximately 40% due to large E-field enhancement for the ‘1L’ sample at the surface with the absorbing carbon layer. Transmission remains the same and all losses in reflection are regarded as absorption. Changes in reflectance and transmittance for the ‘0L’ and ‘2L’ experimental samples are minimal due to zero E-field enhancement at the surface. Reflectance measurements during the LIC are also presented in the Supplementary Material (Figure S4). Due to minimal detected changes or even a registered increase in reflectivity for the ‘1L’ sample, the data are considered unreliable. Despite that, we present our findings in the Supplementary Material and aim to modify the reflectivity measurement setup for the next research stage.
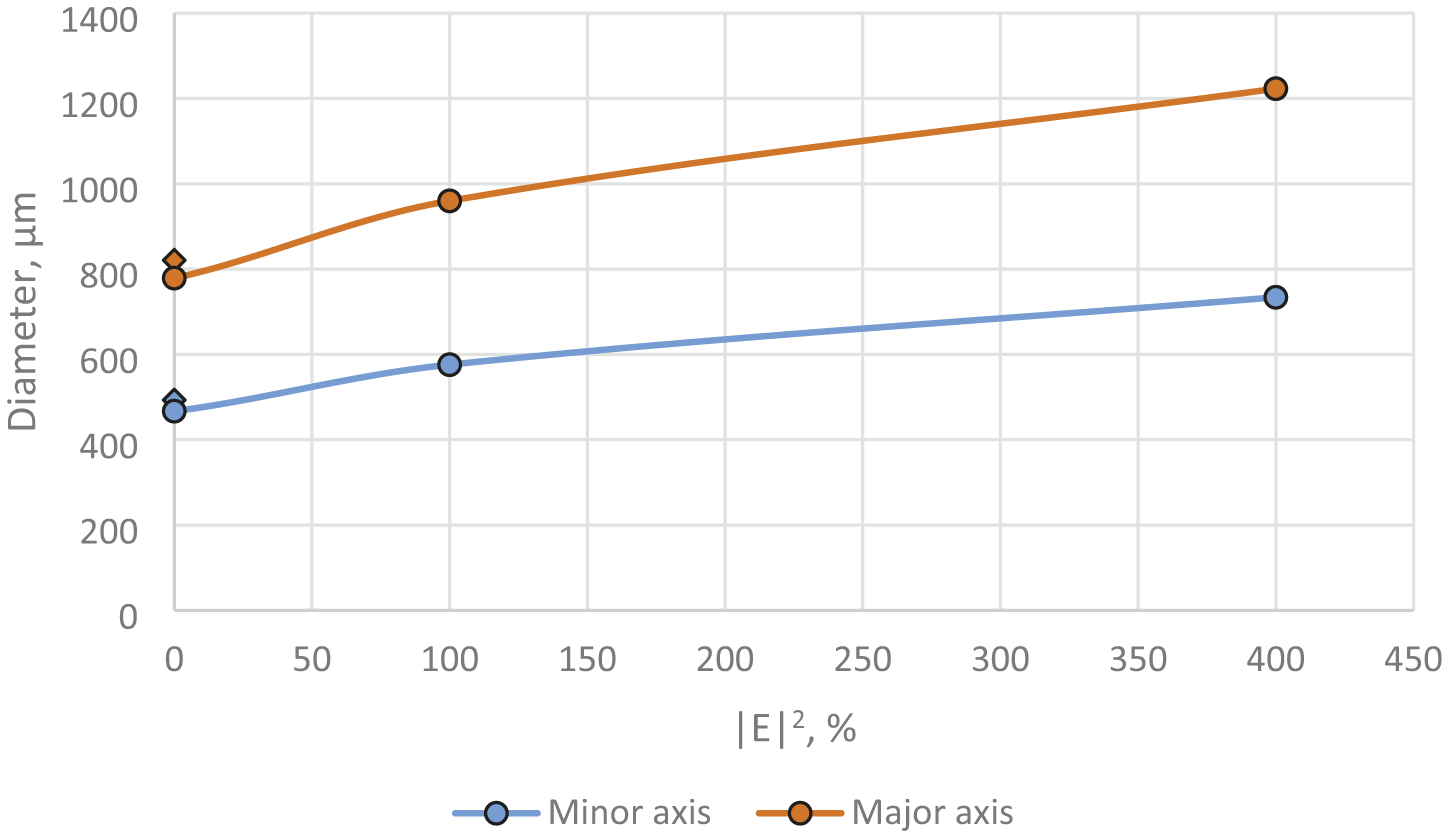
All the experimental samples were irradiated by a nearly identical diameter beam spot. Nevertheless, LIC affected areas had different sizes for each tested mirror. Each irradiation site was processed by ImageJ software and elliptical axes were evaluated. The results are plotted in Figure 13. As shown in the graph, the affected area of the LIC grows depending on the strength of electrical field enhancement. The major axis increased from 821 to 1223 μm, while the E-field level at the coating–vacuum interface increased from zero to 400%. A similar tendency is observed for the minor axes, too. Two of the samples had the same E-field distribution at the surface. The lengths of the minor and major axes for the ‘0L’ and ‘2L’ samples are nearly identical. The LIC strongly depends on the peak intensity of laser pulses[ Reference Wagner 9 ]. Ionization of hydrocarbons occurs at a certain intensity threshold. Therefore, when the light intensity is enhanced on the surface of a coating, a larger area of the Gaussian beam can initiate the buildup of LIC.
Growth of the LIC affected area for coatings with different E-field enhancement values on the top of coating surface.

The transverse profile of LIC features on the sample surface does not reproduce the focal spot profile. This could be caused, for example, by space-charge effects during the transport of contamination from the rest gas to the sample surface or by subsequent action of the high-intensity pulses (i.e., ablation, oxidation by residual singlet oxygen).
LIC can also lead to laser damage of the coatings due to absorption by the amorphous carbon. It is worth noting that laser-induced discoloration can also be wrongly considered as contamination. Since the LID threshold directly correlates to E-field enhancement in optical coatings, the optical coating with the largest E-field value at the interface between hafnia and silica will have the lowest LID threshold value. In our case such coating is the ‘1L’ sample. Therefore, the experimental sample ‘1L’ was ashed in an oxygen-rich plasma for 24 h (~60 W) after the experiment and measurements. After the ashing, no contamination was found on the sample, which confirms it was not irreversible laser-induced discoloration/LID. In addition, it should be mentioned that LIC for the ‘0L’ sample was barely detectable. Therefore, irradiation at 350 mJ/cm2 is close to the threshold of the LIC phenomenon for that sample.
The growth of LIC was observed for all the experimental samples. At the same time, strong evidence was presented for the mitigation of LIC by changing the design structure of the high-reflectivity mirrors, namely the top layer in our case. The area where the contamination layer grows depends on spatial laser beam distribution and can be reduced by minimizing the E-field strength at the surface. The affected area further can be controlled by changing the material of the top layer. Contamination on silica surfaces has shown a tendency to have a higher impact compared to that on hafnia material. It can be related to dangling bonds of silanols, which are common for silica material[ Reference Zhuravlev and Potapov 18 ]. The investigation presented here indicates that minimized E-field distribution and hafnia material as the last layer in the mirror minimized the growth rate of LIC. Such an approach can be used for other designs as well – polarizers, beam splitters, chirped mirrors, etc. Currently we compared two top-layer materials – hafnia and silica. In the future we plan to investigate more materials, coating designs and different deposition technologies.
5 Conclusions
Long exposure under a high-vacuum environment by fs laser radiation of electron beam deposited hafnia/silica mirrors clearly initiated LIC. Investigation of different multilayer designs revealed that the contamination area size strongly depends on the surface E-field enhancement of the coating. Imaging ellipsometry measurements of irradiated sites showed that the smallest optical changes were initiated for the sample that had a hafnia layer on top. The present research has demonstrated that LIC can be controlled by changing the multilayer coating design. Effective optimization of surface E-field values and appropriate material at the top of the coating stack can minimize the contamination growth for optical coatings in high-power high-intensity laser systems. SIE provided a highly sensitive method for detecting and quantifying LIC, with variations in Δ (phase shift) and Ψ (reflectance ratio) serving as key optical markers. LIC effects extended beyond the primary Bragg reflection region, influencing the spectral response of the mirrors. This work provides critical insights for designing contamination-resistant coatings in high-power laser applications, particularly in industrial and space-based laser systems where optical longevity is crucial.
Supplementary material
The supplementary material for this article can be found at http://doi.org/10.1017/hpl.2025.10069.
Acknowledgments
The authors acknowledge the use of the ELI Beamlines Facility, The Extreme Light Infrastructure ERIC. This research was funded by the European Union through the IMPULSE project EU Horizon 2020 grant agreement No. 871161 and the THRILL project EU HORIZON-INFRA-2022-TECH-01 grant agreement No. 101095207. SVM, SE and JA acknowledge the project ADONIS (No. CZ.02.1.01/0.0/0.0/16-019/0000789) from the European Regional Development Fund.


 Open access