





1. Introduction
An overview of new experimental results obtained at the GOL-NB multiple-mirror trap over the past two years will be presented. We will also discuss the status of the machine and the development of its capabilities. This paper is a short outline of the current state of the GOL-NB experiment. The main topics will be discussed in more detail in specialised papers.
Multiple-mirror traps are a sort of linear open traps, which are considered as an alternative magnetic confinement path to fusion. Recently, there has been a significant revitalisation in experimental research in physics and technology of various types of open traps in both the public and private research sectors, see, for example, Lim et al. (Reference Lim, You, Lee, Ahn, Moon, Kim, Woo, Lho, Choe and Ghim2020), Endrizzi et al. (Reference Endrizzi2023), Yang et al. (Reference Yang, Xu, Zhu, Ren and Sun2023), Forest et al. (Reference Forest2024), Lee et al. (Reference Lee, Jang, Yoo and Lee2024), Oh et al. (Reference Oh, Choe, Baek, Kim, Jung, Chung, Kourakis and Sung2024), Scheffel et al. (Reference Scheffel, Jäderberg, Bendtz, Holmberg and Lindvall2025), Takahashi et al. (Reference Takahashi2025), Kinashi et al. (Reference Kinashi2025), Roy et al. (Reference Roy, Karmakar, Lachhvani, Khodiyar, Chattopadhyay and Sen2025), Schwartz et al. (Reference Schwartz2025), Travis & Carter (Reference Travis and Carter2025). Similarly, growing activity occurs with magnetic configurations in which plasma with a high relative pressure $\beta$
is formed and then confined inside an open magnetic trap (Gota et al. Reference Gota2019, Reference Gota2024; Kirtley & Milroy Reference Kirtley and Milroy2023; Asai et al. Reference Asai, Seki, Kobayashi, Roche and Tajima2024). Intensive research is being conducted in the analytical theory and numerical simulation of the physics of open traps, as well as in the related field of linear simulators of divertors.
$\beta$
is formed and then confined inside an open magnetic trap (Gota et al. Reference Gota2019, Reference Gota2024; Kirtley & Milroy Reference Kirtley and Milroy2023; Asai et al. Reference Asai, Seki, Kobayashi, Roche and Tajima2024). Intensive research is being conducted in the analytical theory and numerical simulation of the physics of open traps, as well as in the related field of linear simulators of divertors.
The Budker Institute of Nuclear Physics is developing a project for the GDMT next generation open trap, which is intended to demonstrate fusion-relevant plasma parameters (Skovorodin et al. Reference Skovorodin2023). Several new ideas in the confinement physics were included in this project (Bagryansky, Beklemishev & Postupaev Reference Bagryansky, Beklemishev and Postupaev2019). Individual physical tasks necessary for the success of the GDMT project will be solved at moderate-scale devices, including GDT (Bagryansky et al. Reference Bagryansky2015; Yakovlev et al. Reference Yakovlev, Shalashov, Gospodchikov, Maximov, Prikhodko, Savkin, Soldatkina, Solomakhin and Bagryansky2018), GOL-NB (Postupaev et al. Reference Postupaev2017), SMOLA (Sudnikov et al. Reference Sudnikov, Beklemishev, Postupaev, Burdakov, Ivanov, Vasilyeva, Kuklin and Sidorov2017, Reference Sudnikov, Ivanov, Inzhevatkina, Kozhevnikov, Postupaev, Tolkachev and Ustyuzhanin2024) and CAT (Akhmetov et al. Reference Akhmetov, Davydenko, Ivanov and Murakhtin2018; Davydenko et al. Reference Davydenko, Deichuli, Ivanov and Murakhtin2019).
Multiple-mirror magnetic systems were suggested by Budker, Mirnov & Ryutov (Reference Budker, Mirnov and Ryutov1971) and Logan et al. (Reference Logan, Lichtenberg, Lieberman and Makhijani1972) to reduce the longitudinal particle losses from an open trap, When the plasma flow moves along a multiple-mirror (periodically modulated along the axis) magnetic field, a friction force arises, which transfers part of the plasma flow momentum to the magnetic field and thereby reduces the plasma flow velocity. The physics of multiple-mirror confinement is discussed in more detail in the next section.
The main scientific objectives of GOL-NB are the direct demonstration of the multiple-mirror confinement efficiency with hydrogen plasma and the development of technology for suppressing longitudinal losses of particles and energy from open traps with reactor-grade plasma, and creation of a physical base for the GDMT project. The device has a configuration that simulates, at reduced plasma parameters, the configuration of a reactor-class facility with a central gas dynamic trap and sections with a strong magnetic field attached to it, which can be turned on both as long solenoids or as multiple mirrors. Plasma is heated by 1 MW neutral beam injection. The details of the GOL-NB device and its operation are described in § 3.
The following elements of the recent activity are briefly discussed in the paper: magnetohydrodynamic (MHD) stability in GOL-NB, plasma parameters in the central trap, neutral beams trapping and fast ions spectrum, comparison of the multiple-mirror and solenoidal configurations at high collisionality, and measures for the reduction in neutrals density. The main goals of the experiments were plasma properties characterisation in the central trap and studies of the plasma flow in the strong-field sections. In the paper, we also introduce two new systems for additional plasma heating, which will be important in the low-density part of the parameters space where heating by neutral beams is not effective. The first one is an injector of a low-energy electron beam mounted at the exit plasma receiver. Currently, the electron beam parameters are 100–400 eV, 20–100 A. The second new system is a 13.56 MHz ICRH system, which is under tests at several kilowatts of input power.
2. Multiple-mirror confinement
Multiple mirrors are a technology independently suggested by Budker et al. (Reference Budker, Mirnov and Ryutov1971) and Logan et al. (Reference Logan, Lichtenberg, Lieberman and Makhijani1972) for suppressing longitudinal losses of particles and energy from an open trap. Such a field is often called a corrugated field because of the characteristic shape of magnetic surfaces. Plasma confinement in a multiple-mirror trap is determined by a combination of three main dimensionless parameters: $N \gg 1$
is the number of elementary mirror cells in a multiple-mirror system,
$N \gg 1$
is the number of elementary mirror cells in a multiple-mirror system, $R_{\textit{mm}} = B_{\textit{max}} / B_{\textit{min}}$
is the modulation depth (the mirror ratio of the corrugated magnetic field) and the collisionality
$R_{\textit{mm}} = B_{\textit{max}} / B_{\textit{min}}$
is the modulation depth (the mirror ratio of the corrugated magnetic field) and the collisionality $\nu ^* = l / \lambda$
, where
$\nu ^* = l / \lambda$
, where $l$
is the period of field modulation, which is also the length of the elementary mirror cell, and
$l$
is the period of field modulation, which is also the length of the elementary mirror cell, and $\lambda$
is the mean free path of ions relative to scattering by an angle of the order of unity. At a sufficiently high collisionality of
$\lambda$
is the mean free path of ions relative to scattering by an angle of the order of unity. At a sufficiently high collisionality of $\nu ^* \sim 1$
, a friction force arises in between populations of locally trapped and transiting particles, reducing losses from the trap.
$\nu ^* \sim 1$
, a friction force arises in between populations of locally trapped and transiting particles, reducing losses from the trap.
Figure 1 shows the particle balance in an elementary mirror cell of a long classical multiple-mirror system with $N \gg 1$
and
$N \gg 1$
and $R_{\textit{mm}} - 1 \approx 1$
. Plasma flows from the confinement zone on the left to the exit receiver on the right. In a classical multiple-mirror trap, there is an intensive exchange of particles between populations of locally trapped and transiting plasma populations. Every passing particle that is trapped in the elementary mirror cell because of collisions leaves that cell in a random direction after some time. Such an exchange of particles leads to the appearance of a return particles flow towards the confinement zone (green arrows in figure 1). Particle motion in a multiple-mirror system looks like random walks in a chain of elementary mirror cells. The theory predicts (Mirnov & Ryutov Reference Mirnov and Ryutov1972) that, under optimal conditions, the particle flow suppression coefficient is equal to the number of field corrugation periods
$R_{\textit{mm}} - 1 \approx 1$
. Plasma flows from the confinement zone on the left to the exit receiver on the right. In a classical multiple-mirror trap, there is an intensive exchange of particles between populations of locally trapped and transiting plasma populations. Every passing particle that is trapped in the elementary mirror cell because of collisions leaves that cell in a random direction after some time. Such an exchange of particles leads to the appearance of a return particles flow towards the confinement zone (green arrows in figure 1). Particle motion in a multiple-mirror system looks like random walks in a chain of elementary mirror cells. The theory predicts (Mirnov & Ryutov Reference Mirnov and Ryutov1972) that, under optimal conditions, the particle flow suppression coefficient is equal to the number of field corrugation periods $N$
. Depending on the magnetic system, the plasma confinement time scales as
$N$
. Depending on the magnetic system, the plasma confinement time scales as $N^2$
in a fully multiple-mirror system or as
$N^2$
in a fully multiple-mirror system or as $N$
in a system in which a multiple-mirror magnetic field is applied only to reduce longitudinal losses from the confinement zone. The usual assumption here is that transverse losses are negligible. More details on the multiple-mirror confinement can be found in the review papers of Mirnov & Lichtenberg (Reference Mirnov and Lichtenberg1996) and Burdakov & Postupaev (Reference Burdakov and Postupaev2018).
$N$
in a system in which a multiple-mirror magnetic field is applied only to reduce longitudinal losses from the confinement zone. The usual assumption here is that transverse losses are negligible. More details on the multiple-mirror confinement can be found in the review papers of Mirnov & Lichtenberg (Reference Mirnov and Lichtenberg1996) and Burdakov & Postupaev (Reference Burdakov and Postupaev2018).
Particle balance in a separate elementary cell of a classical multiple-mirror trap. The plasma flows from the confinement zone, which is located far to the left, to the plasma receiver, which is located far to the right. At $\nu ^* \approx 1$
and
$\nu ^* \approx 1$
and $R_{\textit{mm}} - 1 \approx 1$
, there is an intensive exchange of particles between populations of locally trapped (blue oval) and transiting plasma populations. As a result, some of the transiting particles leaving the trap (red arrows) redirect towards the main confinement zone (green arrows).
$R_{\textit{mm}} - 1 \approx 1$
, there is an intensive exchange of particles between populations of locally trapped (blue oval) and transiting plasma populations. As a result, some of the transiting particles leaving the trap (red arrows) redirect towards the main confinement zone (green arrows).

If the corrugation depth $R_{\textit{mm}}$
is less than 2, the limiting flow suppression coefficient is also reduced. Figure 2 shows the predicted flow velocity as a function of
$R_{\textit{mm}}$
is less than 2, the limiting flow suppression coefficient is also reduced. Figure 2 shows the predicted flow velocity as a function of $\nu ^*$
for the GOL-NB parameters (weak corrugation with
$\nu ^*$
for the GOL-NB parameters (weak corrugation with $R_{\textit{mm}} = 1.4$
and
$R_{\textit{mm}} = 1.4$
and $N = 13$
). The dark green polyline there is the estimate based on the compilation of different flow regimes by Kotelnikov (Reference Kotelnikov2007).
$N = 13$
). The dark green polyline there is the estimate based on the compilation of different flow regimes by Kotelnikov (Reference Kotelnikov2007).
Dependence of the plasma flow velocity through the GOL-NB multiple-mirror magnetic system on the collisionality $\nu ^*$
. The polyline corresponds to seven flow modes (Kotelnikov Reference Kotelnikov2007). The multiple-mirror confinement is predicted at
$\nu ^*$
. The polyline corresponds to seven flow modes (Kotelnikov Reference Kotelnikov2007). The multiple-mirror confinement is predicted at $(R_{\textit{mm}} - 1)^{3/2} \lt \nu ^* \lt 1$
; the expected value of slowing down is
$(R_{\textit{mm}} - 1)^{3/2} \lt \nu ^* \lt 1$
; the expected value of slowing down is $u / v_{Ti} = (R_{\textit{mm}} - 1)^{-2} / N = 0.48$
. The dots and arrow indicate the scenario at
$u / v_{Ti} = (R_{\textit{mm}} - 1)^{-2} / N = 0.48$
. The dots and arrow indicate the scenario at $n \approx 3 \times 10^{19}$
m
$n \approx 3 \times 10^{19}$
m $^{-3}$
with the initial filling of the trap with collisional starting plasma at
$^{-3}$
with the initial filling of the trap with collisional starting plasma at $T \approx 5$
eV and the following confinement stage with heating by neutral beams to
$T \approx 5$
eV and the following confinement stage with heating by neutral beams to $T \approx 30$
eV.
$T \approx 30$
eV.

The width and depth of the multiple-mirror confinement domain depend on $R_{\textit{mm}}$
and
$R_{\textit{mm}}$
and $N$
. The effective multiple-mirror confinement is between two vertical dashed lines at
$N$
. The effective multiple-mirror confinement is between two vertical dashed lines at $(R_{\textit{mm}} - 1)^{3/2} \lt \nu ^* \lt 1$
. The expected value of slowing down the flow is
$(R_{\textit{mm}} - 1)^{3/2} \lt \nu ^* \lt 1$
. The expected value of slowing down the flow is $u / v_{\textit{Ti}} = (R_{\textit{mm}} - 1)^{-2} / N = 0.48$
. The left part of the polyline corresponds to the classical regime of collisionless plasma confinement in non-interacting elementary mirror cells. Its right-hand side corresponds to a free MHD flow along the spatially varying magnetic flux tube.
$u / v_{\textit{Ti}} = (R_{\textit{mm}} - 1)^{-2} / N = 0.48$
. The left part of the polyline corresponds to the classical regime of collisionless plasma confinement in non-interacting elementary mirror cells. Its right-hand side corresponds to a free MHD flow along the spatially varying magnetic flux tube.
For the magnetic system of GOL-NB, a twofold decrease in the plasma flow velocity is expected. When $R_{\textit{mm}}$
is increased, the left vertical dashed line in figure 2 will approach the right one, and the efficiency of the plasma flow slowdown will increase up to
$R_{\textit{mm}}$
is increased, the left vertical dashed line in figure 2 will approach the right one, and the efficiency of the plasma flow slowdown will increase up to $u / v_{\textit{Ti}} = 1 / N$
at
$u / v_{\textit{Ti}} = 1 / N$
at $R_{\textit{mm}} = 2$
and the exact equality
$R_{\textit{mm}} = 2$
and the exact equality $\nu ^* = 1$
. A further increase in
$\nu ^* = 1$
. A further increase in $R_{\textit{mm}} \gt 2$
(the transition to the strong corrugation regime) will not lead to an increase in confinement efficiency; however, the
$R_{\textit{mm}} \gt 2$
(the transition to the strong corrugation regime) will not lead to an increase in confinement efficiency; however, the $\nu ^*$
range will expand, which will make the multiple-mirror system more efficient as a whole due to the presence of radial dependences of plasma parameters.
$\nu ^*$
range will expand, which will make the multiple-mirror system more efficient as a whole due to the presence of radial dependences of plasma parameters.
Once again, we draw attention to the theory prediction that effective multiple-mirror confinement is possible only in a certain range of parameter $\nu ^*$
. Outside of that range, the corrugated magnetic field will not slow down the plasma flow. The dots and arrow in figure 2 show the scenario of the GOL-NB experiment at
$\nu ^*$
. Outside of that range, the corrugated magnetic field will not slow down the plasma flow. The dots and arrow in figure 2 show the scenario of the GOL-NB experiment at $n \approx 3 \times 10^{19}$
m
$n \approx 3 \times 10^{19}$
m $^{-3}$
with the initial free filling of the central trap with collisional starting plasma from an arc plasma gun at
$^{-3}$
with the initial free filling of the central trap with collisional starting plasma from an arc plasma gun at $T \approx 5$
eV and the following confinement stage with heating by neutral beams to
$T \approx 5$
eV and the following confinement stage with heating by neutral beams to $T \approx 30$
eV that corresponds to
$T \approx 30$
eV that corresponds to $\nu ^* \approx 1$
for the classical binary collisions.
$\nu ^* \approx 1$
for the classical binary collisions.
3. GOL-NB device and operation regimes
The layout of the GOL-NB multiple-mirror trap is shown in figure 3. It includes a gas dynamic central trap, two adjacent strong-field sections and two end tanks of magnetic flux expanders. The central trap of 2.5 m mirror-to-mirror length has the magnetic field in the centre of $B_0 = 0.3$
T and the main mirror ratio of
$B_0 = 0.3$
T and the main mirror ratio of $R = B_{\textit{max}} / B_0 \approx 15$
. Each strong-field section can be configured either as a solenoid or as a multiple-mirror system with 13 corrugation periods, the corrugation depth of
$R = B_{\textit{max}} / B_0 \approx 15$
. Each strong-field section can be configured either as a solenoid or as a multiple-mirror system with 13 corrugation periods, the corrugation depth of $R_{\textit{mm}} = B_{\textit{max}} / B_{\textit{min}} = 1.4$
and the elementary mirror length of
$R_{\textit{mm}} = B_{\textit{max}} / B_{\textit{min}} = 1.4$
and the elementary mirror length of $l$
= 22 cm. The axial profiles of the magnetic field are also shown in figure 3 for both magnetic configurations. Four limiter units are installed for setting the plasma radius. Of these, two inner limiters are located in the central trap outside the zone accessible by fast ions and two outer limiters are mounted in the exit expander tanks. The inner limiters are biased (details will follow in the next section) and the outer limiters have a floating potential. In both magnetic configurations, the magnetic field profile in the central trap between the limiters is the same.
$l$
= 22 cm. The axial profiles of the magnetic field are also shown in figure 3 for both magnetic configurations. Four limiter units are installed for setting the plasma radius. Of these, two inner limiters are located in the central trap outside the zone accessible by fast ions and two outer limiters are mounted in the exit expander tanks. The inner limiters are biased (details will follow in the next section) and the outer limiters have a floating potential. In both magnetic configurations, the magnetic field profile in the central trap between the limiters is the same.
Layout of GOL-NB in the full design configuration. Designations are: CT, central gas dynamic trap; SFS, strong-field section; ET, vacuum vessel of the magnetic expander; PG, plasma gun; NBI, neutral beam injector; L, limiter; ICRH, antenna for ion cyclotron resonsnce heating; EB, low-energy electron beam emitter. Bottom, the axial profiles of the magnetic field for the solenoidal (S) and multiple-mirror (M) configurations of the strong-field sections.

The five-element radially sectioned end plasma receivers are located in the expander tanks. The right (exit) receiver is biased; the electrodes of the left receiver have passive resistive connections to the vacuum vessel. A low-temperature starting plasma with $n = (1-10) \times 10^{19}$
m
$n = (1-10) \times 10^{19}$
m $^{-3}$
and
$^{-3}$
and $T_{e} \approx 7$
eV is created in the central trap using an arc source located in the orifice of the left plasma receiver (see Ivanov et al. Reference Ivanov, Batkin, Burdakov, Kuklin, Mekler, Postupaev, Rovenskikh and Sidorov2021). In the experiments under discussion, plasma heating in the central trap was provided by two neutral beam injectors, which deliver a total power of 1 MW at
$T_{e} \approx 7$
eV is created in the central trap using an arc source located in the orifice of the left plasma receiver (see Ivanov et al. Reference Ivanov, Batkin, Burdakov, Kuklin, Mekler, Postupaev, Rovenskikh and Sidorov2021). In the experiments under discussion, plasma heating in the central trap was provided by two neutral beam injectors, which deliver a total power of 1 MW at $z = \pm 0.4$
m.
$z = \pm 0.4$
m.
More information about individual systems of GOL-NB can be found from Postupaev et al. (Reference Postupaev2022).
The GOL-NB diagnostic suite currently includes the following major systems. Two multi-wire detectors measure the current density of both neutral beams after passing through the plasma. This enables the determination of the beam capture efficiency and plasma density profile in the central trap at $z = \pm 0.4$
m. The neutral particle analyser (NPA) has 15 detection channels in the energy range from 2 up to 25 keV with the energy resolution of approximately
$z = \pm 0.4$
m. The neutral particle analyser (NPA) has 15 detection channels in the energy range from 2 up to 25 keV with the energy resolution of approximately $15\,\%$
. The analyser is installed at an angle of
$15\,\%$
. The analyser is installed at an angle of $90^{\circ }$
in the same plane with NBI. Its design repeats the schemes of analysers previously developed for the MST and C-2 facilities (Polosatkin, Belykh & Rovenskikh Reference Polosatkin, Belykh and Rovenskikh2025) except for the possibility of separating the detected ions by mass. A diagnostic neutral beam with 8 keV accelerating voltage is located in the right strong-field section at
$90^{\circ }$
in the same plane with NBI. Its design repeats the schemes of analysers previously developed for the MST and C-2 facilities (Polosatkin, Belykh & Rovenskikh Reference Polosatkin, Belykh and Rovenskikh2025) except for the possibility of separating the detected ions by mass. A diagnostic neutral beam with 8 keV accelerating voltage is located in the right strong-field section at $z = 2.02$
m for measuring plasma density (Nikishin et al. Reference Nikishin, Ivanov, Batkin, Burdakov, Kuklin, Mekler, Postupaev and Rovenskikh2022). Three spectral systems are currently active. The ThorLabs CCS100 broadband spectrometer provides detection in the 350–700 nm range. Two high-resolution MDR-12 and M522 spectrometers are equipped with high-speed CCD cameras. These systems provide the dynamics of the shape and time evolution of selected spectral lines. There are also several minor diagnostics, photo and video imaging, and the device monitoring systems.
$z = 2.02$
m for measuring plasma density (Nikishin et al. Reference Nikishin, Ivanov, Batkin, Burdakov, Kuklin, Mekler, Postupaev and Rovenskikh2022). Three spectral systems are currently active. The ThorLabs CCS100 broadband spectrometer provides detection in the 350–700 nm range. Two high-resolution MDR-12 and M522 spectrometers are equipped with high-speed CCD cameras. These systems provide the dynamics of the shape and time evolution of selected spectral lines. There are also several minor diagnostics, photo and video imaging, and the device monitoring systems.
A set of movable probes is intensively used to measure the radial profiles of the main plasma parameters (ion density, electron temperature, Mach number, electric potential and radial electric field). The kit includes four-electrode asymmetric Langmuir probes (Sidorov et al. Reference Sidorov, Batkin, Burdakov, Ivanov, Kuklin, Mekler, Nikishin, Postupaev and Rovenskikh2021), triple probes, Mach probes (Sidorov et al. Reference Sidorov, Batkin, Ivanov, Kuklin, Melnikov, Polosatkin, Postupaev and Rovenskikh2024) and electric probes. Probe measurements can be done in the central trap at $z = \pm 0.86$
m outside the zone populated with hot ions and at four locations along each high-field section.
$z = \pm 0.86$
m outside the zone populated with hot ions and at four locations along each high-field section.
The latest major addition to diagnostics is the Thomson scattering system located in the same cross-section as one of the neutral beams at $z = \pm 0.4$
m. It uses the BeamTech SGR Extra 15 Nd-glass laser with a wavelength of 1064 nm, a controllable pulse energy from 1 to 15 J and a pulse duration of 11 ns. The laser operates in the single-pulse mode. The detection system was developed at the Ioffe Institute as a lite version of Kurskiev et al. (Reference Kurskiev2020). It has eight polychromators with four spectral channels each. The signals are digitised with a sampling rate of 5 GHz. The design parameters of the Thomson scattering system are
$z = \pm 0.4$
m. It uses the BeamTech SGR Extra 15 Nd-glass laser with a wavelength of 1064 nm, a controllable pulse energy from 1 to 15 J and a pulse duration of 11 ns. The laser operates in the single-pulse mode. The detection system was developed at the Ioffe Institute as a lite version of Kurskiev et al. (Reference Kurskiev2020). It has eight polychromators with four spectral channels each. The signals are digitised with a sampling rate of 5 GHz. The design parameters of the Thomson scattering system are $5 \times 10^{18} \lt n_e \lt 10^{20}$
m
$5 \times 10^{18} \lt n_e \lt 10^{20}$
m $^{-3}$
,
$^{-3}$
, $3 \lt T_e \lt 250$
eV and
$3 \lt T_e \lt 250$
eV and $-0.14 \lt r \lt 0.14$
m.
$-0.14 \lt r \lt 0.14$
m.
The neutral beam injection system consists of two identical injectors that operate at an acceleration voltage of up to 25 kV and an ion source current of 40 A (Batkin et al. Reference Batkin, Bambutsa, Burdakov, Burmasov, Gafarov and Voskoboinikov2016). The accelerating grids provide geometric focusing of the neutral beam approximately at the inlet (the beam envelope is shown in figure 4). Each beam demonstrated a power of 0.75 MW during commissioning in the start configuration of GOL-NB without the central trap (Postupaev et al. Reference Postupaev, Batkin, Burdakov, Burmasov, Ivanov, Kuklin, Mekler, Rovenskikh and Sidorov2020). Currently, the combined power of the beams was reduced to 1 MW for two reasons. The first of these is the need for additional magnetic shielding due to the significant magnetic field generated by the large-aperture coils of the central trap at the injection cites. In the end, this resulted in changes in the inner hardware and operation regime, and to a below-than-optimal neutralisation efficiency of approximately $60\,\%$
. The second reason was the requirement for good stability of the beam power during long-term experimental campaigns. This led to the decision to reduce the ion current in the injector No. 2 to 30 A. The left part of figure 4 shows typical waveforms of the beam parameters.
$60\,\%$
. The second reason was the requirement for good stability of the beam power during long-term experimental campaigns. This led to the decision to reduce the ion current in the injector No. 2 to 30 A. The left part of figure 4 shows typical waveforms of the beam parameters.
(Left column) Parameters of the neutral beams, the total NBI power $P_{\textit{NBI}}$
, the ion beams currents
$P_{\textit{NBI}}$
, the ion beams currents $J$
and the accelerating voltages
$J$
and the accelerating voltages $U$
. The beams 1 and 2 are shown by blue and red lines. (Right column) Typical signals of the plasma gun current
$U$
. The beams 1 and 2 are shown by blue and red lines. (Right column) Typical signals of the plasma gun current $I_{gun}$
, neutral beams injection power
$I_{gun}$
, neutral beams injection power $P_{\textit{NBI}}$
, currents to limiters
$P_{\textit{NBI}}$
, currents to limiters $I_{\textit{lim}}$
and to the exit plasma receiver
$I_{\textit{lim}}$
and to the exit plasma receiver $I_{\textit{end}}$
, and ion saturation currents of the probe at
$I_{\textit{end}}$
, and ion saturation currents of the probe at $z = 0.86$
m at
$z = 0.86$
m at $r$
= 0 and 35 mm.
$r$
= 0 and 35 mm.

A typical experimental scenario is shown in the right column of figure 4. The plasma gun operates in the interval $t = 0{-}2.7$
ms. During this time, a gradual accumulation of plasma occurres in the central trap. Figure 4 shows the case when the neutral beams are switched on simultaneously with the plasma gun. During plasma accumulation, there is a gradual expansion of peripheral plasma. At
$t = 0{-}2.7$
ms. During this time, a gradual accumulation of plasma occurres in the central trap. Figure 4 shows the case when the neutral beams are switched on simultaneously with the plasma gun. During plasma accumulation, there is a gradual expansion of peripheral plasma. At $t = 0.5$
ms, the plasma reaches the limiter, which has a potential of +100 V relative to the wall, and a current appears in the limiter circuit. Currently, GOL-NB does not have a density control system; therefore, after switching off the plasma gun, the density gradually decreased.
$t = 0.5$
ms, the plasma reaches the limiter, which has a potential of +100 V relative to the wall, and a current appears in the limiter circuit. Currently, GOL-NB does not have a density control system; therefore, after switching off the plasma gun, the density gradually decreased.
The ion saturation currents of the triple probes shown in the lower part of figure 4 demonstrate the existence of two phases of the plasma discharge. At $0 \lt t \lt 2.7$
ms, plasma near the axis is significantly denser than at the periphery. After
$0 \lt t \lt 2.7$
ms, plasma near the axis is significantly denser than at the periphery. After $t \approx 2$
ms, the density at the axis begins to decrease, while at the periphery, it continues to grow. After
$t \approx 2$
ms, the density at the axis begins to decrease, while at the periphery, it continues to grow. After $t \approx 2.7$
ms, the radial density profile flattens, and the density decays in the centre and at the periphery almost equally. One should also note a significantly higher level of density fluctuations at the plasma buildup stage. The azimuthal magnetic field fluctuations, which were measured in the centre of the left strong-field section and in the central trap, were also more intensive during the plasma gun operation.
$t \approx 2.7$
ms, the radial density profile flattens, and the density decays in the centre and at the periphery almost equally. One should also note a significantly higher level of density fluctuations at the plasma buildup stage. The azimuthal magnetic field fluctuations, which were measured in the centre of the left strong-field section and in the central trap, were also more intensive during the plasma gun operation.
Figure 5 shows the dynamics of plasma density and electron temperature in the axial region, measured by triple probes at $z$
= –0.86, +0.86 and +1.37 m. The first two measurement points are located in the central trap between the beam injection points and limiters located in a stronger magnetic field, and the third point is located in the first diagnostic window in the output strong-field section.
$z$
= –0.86, +0.86 and +1.37 m. The first two measurement points are located in the central trap between the beam injection points and limiters located in a stronger magnetic field, and the third point is located in the first diagnostic window in the output strong-field section.
(a) Density and (b) electron temperature dynamics at the axis. Solid lines are probe measurements in the central trap at $z$
= –0.86 m (red) and
$z$
= –0.86 m (red) and $z$
= 0.86 m (blue), and in the left strong-field section at
$z$
= 0.86 m (blue), and in the left strong-field section at $z$
= 1.37 m (black). The green dots are Thomson scattering data at
$z$
= 1.37 m (black). The green dots are Thomson scattering data at $z$
= 0.40 m.
$z$
= 0.40 m.

During the plasma buildup at $0 \lt t \lt 2.7$
ms, a stream of low-temperature plasma flows from the gun through the left strong-field section; therefore, at
$0 \lt t \lt 2.7$
ms, a stream of low-temperature plasma flows from the gun through the left strong-field section; therefore, at $z$
= –0.86 m, the density is higher and the temperature is lower than at the symmetrical
$z$
= –0.86 m, the density is higher and the temperature is lower than at the symmetrical $z$
= 0.86 m coordinate. After the plasma gun is turned off, the signals of these two probes are almost identical. The Thomson scattering data at
$z$
= 0.86 m coordinate. After the plasma gun is turned off, the signals of these two probes are almost identical. The Thomson scattering data at $z$
= 0.40 m is generally consistent with the probe measurements. Figure 6 shows the radial profiles of plasma temperature and density from probe measurements at
$z$
= 0.40 m is generally consistent with the probe measurements. Figure 6 shows the radial profiles of plasma temperature and density from probe measurements at $z$
= 0.86 m for three characteristic time points. The specific design of the triple probe is sensitive to the radial electric field. On the one hand, this affects the probe readings. On the other hand, this allows knowledge of the radial electric field in addition to temperature and density with a proper procedure. The data in figure 6 were calculated under the assumption that the temperature and density are symmetrical about the axis, and the radial electric field is antisymmetric.
$z$
= 0.86 m for three characteristic time points. The specific design of the triple probe is sensitive to the radial electric field. On the one hand, this affects the probe readings. On the other hand, this allows knowledge of the radial electric field in addition to temperature and density with a proper procedure. The data in figure 6 were calculated under the assumption that the temperature and density are symmetrical about the axis, and the radial electric field is antisymmetric.
Symmetrised radial profiles of plasma parameters at $z$
= 0.86 m, measured by the triple probe. The colour indicates different time points: black is 2.5 ms, red is 3.0 ms, blue is 4.5 ms. Vertical dashed lines show the last magnetic surface bounded by limiters.
$z$
= 0.86 m, measured by the triple probe. The colour indicates different time points: black is 2.5 ms, red is 3.0 ms, blue is 4.5 ms. Vertical dashed lines show the last magnetic surface bounded by limiters.

The temperature is almost uniform in radius up to the separatrix due to the uniform heating (average specific energy release per plasma particle) by beams due to the large Larmor radius of fast ions trapped by plasma from heating beams. A density peak near the axis exists during the plasma gun operation, which corresponds to the diameter of the starting plasma stream from the gun. After the plasma gun is turned off, the density profile changes to a flat one. This rapid profile change can be seen in figure 5 as a rapid decrease in density after $t$
= 2.5 ms.
$t$
= 2.5 ms.
4. MHD stability in GOL-NB
The magnetic system of GOL-NB does not provide the MHD stability of the plasma according to the Rosenbluth & Longmire (Reference Rosenbluth and Longmire1957) criterion. Therefore, two techniques were suggested to MHD-stabilise the plasma in the trap and limit transverse losses.
At the stage of initial filling of the trap with low-temperature starting plasma the primary plasma flow from the gun is stabilised by line-tying to a conducting wall (Prater Reference Prater1974; Molvik et al. Reference Molvik, Breun, Golovato, Hershkowitz, McVey, Post, Smatlak and Yujiri1984), which is an arc source of the plasma gun. The line-tying does not provide the true stabilisation; it reduces the instability growth rate instead. Our experiments (Postupaev et al. Reference Postupaev, Batkin, Ivanov, Kuklin, Melnikov, Mekler, Rovenskikh and Sidorov2024) have generally confirmed this assumption, with some peculiarities in the radial dimensions of the stabilzed region. In those experiments, we varied the duration of the hydrogen supply to the plasma gun after the end of the discharge current. Depending on this parameter, we observed either good electrical contact of the plasma with the end face during the entire discharge pulse or plasma detachment from the surface with the formation of a luminous area resembling the detachment in radiative divertors in tokamaks.
Plasma stabilisation during the injection of neutral beams is provided by differential rotation around the axis. The theory of suppressing radial transport in open traps was studied by Beklemishev (Reference Beklemishev2008), with a model with forced formation of a radial electric field profile upon plasma contact with electrodes, and by Pastukhov & Chudin (Reference Pastukhov and Chudin2011), with a closed model in which there is no electrical connection to the ends. Several types of differential rotation techniques were used in experiments at open traps (see e.g. Severn et al. Reference Severn, Hershkowitz, Breun and Ferron1991; Sakai, Yasaka & Itatani Reference Sakai, Yasaka and Itatani1993; Cho et al. Reference Cho2005; Beklemishev et al. Reference Beklemishev, Bagryansky, Chaschin and Soldatkina2010; Schmitz et al. Reference Schmitz2016; Sudnikov et al. Reference Sudnikov, Beklemishev, Postupaev, Burdakov, Ivanov, Vasilyeva, Kuklin and Sidorov2017). GOL-NB relies on a ‘vortex confinement’ technique (Beklemishev Reference Beklemishev2008; Beklemishev et al. Reference Beklemishev, Bagryansky, Chaschin and Soldatkina2010), which does not stabilise the plasma, but limits transverse losses using differential rotation. Later in the text, we will use the term ‘stabilisation’ with this understanding.
The vortex confinement system of GOL-NB controls the radial electric field by biasing several axisymmetric electrodes installed inside the vacuum chamber. This system includes inner limiters with a positive bias, floating outer limiters and sectioned plasma receivers, the right one of which has a negative bias. The optimal parameters of the biasing were found in experiments (Ivanov et al. Reference Ivanov2023).
Figure 7 shows a series of frames of a high-speed video that imaged plasma through a window in the middle part of the left strong-field section. In the initial period of the discharge, a dense low-temperature plasma stream from the gun is visible, occupying the axial region. The boundary of this stream is unstable. Plasma gradually fills the peripheral region up to the separatrix set by limiters. At the stage of decreasing the discharge current in the plasma gun, the line-tying stabilisation disengages and a rapid restructuring of the radial plasma density profile occurs. At the stage of plasma decay, its radius is limited by the separatrix. The images show the tilt of the magnetic field line due to the multiple-mirror configuration in that experiment.
Frames from a high-speed video through a side window in the strong-field section at $z$
= 2.02 m. The exposure of each frame is 50
$z$
= 2.02 m. The exposure of each frame is 50 $\unicode{x03BC}$
s. The colours of the images are approximate, so the camera processor interprets the linear spectrum of plasma radiation.
$\unicode{x03BC}$
s. The colours of the images are approximate, so the camera processor interprets the linear spectrum of plasma radiation.

The moment of the density profile restructuring depends on the experimental conditions. In the multiple-mirror configuration, this happens earlier than in the solenoidal one. This fact confirms the conclusion that a multiple-mirror magnetic field worsens the plasma stability (see Skovorodin et al. Reference Skovorodin2023 for details). The central stream lives longer in a starting plasma than in the NBI-heated one. Plasma decay with higher temperature occurs faster.
Figure 8 shows the symmetrised profiles of the electric potential relative to the limiters at different time points. In addition to the potential of the limiters, the formation of a radial electric field in the trap is influenced by the potential of the emitting surface of the plasma gun and the potential of the plasma receiver. The potentials of these electrodes are translated along the magnetic field into the central trap. These results indicate that a layer of differential $E \times B$
rotation is actually formed at the plasma periphery and, additionally, in the starting plasma stream during the plasma gun operation.
$E \times B$
rotation is actually formed at the plasma periphery and, additionally, in the starting plasma stream during the plasma gun operation.
Electrical potential relative to the limiter potential, obtained from probe measurements for different time points (labelled in ms). The entire plasma lifetime is on the left, the period of restructuring the radial density profile is on the right. Note the potential drop near the separatrix, which is shown by dashed lines. The dataset is the same as in figure 6.

The summary of this section is that our initial assumption about two plasma stabilisation methods for different stages of the GOL-NB plasma life cycle has been confirmed. We know how to ‘turn off’ either of these two stabilisation methods.
5. Neutral beams trapping and fast ions
Preliminary modelling of the plasma in GOL-NB with the one-dimensional (1-D) DOL code of Postupaev & Yurov (Reference Postupaev and Yurov2016) predicted the following. At the initial plasma density and temperature $n_{e0} = n_{i0} \approx 3 \times 10^{19}$
m
$n_{e0} = n_{i0} \approx 3 \times 10^{19}$
m $^{-3}$
and
$^{-3}$
and $T_{e0} = T_{i0}$
= 3 eV, the influx of cold plasma ions to maintain the particle balance
$T_{e0} = T_{i0}$
= 3 eV, the influx of cold plasma ions to maintain the particle balance $I_c$
= 1000 eq. A (here 1 eq. A corresponds to a particle flux of
$I_c$
= 1000 eq. A (here 1 eq. A corresponds to a particle flux of $6.3 \times 10^{18}$
atoms s–1), the energy and current of neutral beams
$6.3 \times 10^{18}$
atoms s–1), the energy and current of neutral beams $E_b$
= 25 keV and
$E_b$
= 25 keV and $I_b$
= 60 A, the final stationary state in the trap
$I_b$
= 60 A, the final stationary state in the trap $n_e = n_i \approx 1.5 \times 10^{19}$
m
$n_e = n_i \approx 1.5 \times 10^{19}$
m $^{-3}$
,
$^{-3}$
, $T_e \approx$
40 eV and
$T_e \approx$
40 eV and $T_i \approx$
20 eV. The difference in the temperatures of electrons and ions is determined by the balance among the processes of heating electrons by drag on fast ions, heating ions in collisions with electrons and replacing warm ions with cold ones coming from a particle balance system. At the same time, the capture efficiency of neutral beams varied over time from 40
$T_i \approx$
20 eV. The difference in the temperatures of electrons and ions is determined by the balance among the processes of heating electrons by drag on fast ions, heating ions in collisions with electrons and replacing warm ions with cold ones coming from a particle balance system. At the same time, the capture efficiency of neutral beams varied over time from 40 $\,\%$
to 30
$\,\%$
to 30 $\,\%$
with the fixed plasma diameter of 20 cm. The plasma parameters predicted by the simulation correspond to the optimal operation mode of the multiple-mirror system at the ion free path length determined by classical binary collisions.
$\,\%$
with the fixed plasma diameter of 20 cm. The plasma parameters predicted by the simulation correspond to the optimal operation mode of the multiple-mirror system at the ion free path length determined by classical binary collisions.
In the experiments, the neutral beams power is less than expected in the simulation, 1 MW instead of 1.5 MW. Therefore, the expected electron temperature in the experiment should have been $T_e \approx 25{-}30$
eV. However, the plasma parameters at the initial stage of the experiments were significantly lower than the calculated ones. As can be seen from figure 5, the electron temperature in the trap was
$T_e \approx 25{-}30$
eV. However, the plasma parameters at the initial stage of the experiments were significantly lower than the calculated ones. As can be seen from figure 5, the electron temperature in the trap was $T_e \approx 15{-}20$
eV. At the same time, measurements of the Doppler broadening of the spectral profile of the
$T_e \approx 15{-}20$
eV. At the same time, measurements of the Doppler broadening of the spectral profile of the $H_{\alpha }$
line gave
$H_{\alpha }$
line gave $T_i \approx 5{-}6$
eV, which is significantly less than expected. This means that there is an additional ion energy loss channel, which was absent in the numerical model.
$T_i \approx 5{-}6$
eV, which is significantly less than expected. This means that there is an additional ion energy loss channel, which was absent in the numerical model.
Figure 9 shows the dynamics of the beam capture efficiency over time in two experimental scenarios: with the start of neutral beams at $t$
= 0 and at
$t$
= 0 and at $t$
= 1.5 ms. These data were obtained during special experiments with a magnetic field in the strong-field sections of 50
$t$
= 1.5 ms. These data were obtained during special experiments with a magnetic field in the strong-field sections of 50 $\,\%$
of the nominal value; that was done to ensure a greater plasma flow from the gun into the trap. The beam capture efficiency reached 40
$\,\%$
of the nominal value; that was done to ensure a greater plasma flow from the gun into the trap. The beam capture efficiency reached 40 $\,\%$
at maximum density. This is almost the same as the predicted value. An interesting feature of figure 9 is that the early start of the injection leads to almost the same peak value of capture efficiency, but to a much faster decrease in density after the rapid restructuring of the radial plasma density profile. Despite faster plasma decay with the heating start at
$\,\%$
at maximum density. This is almost the same as the predicted value. An interesting feature of figure 9 is that the early start of the injection leads to almost the same peak value of capture efficiency, but to a much faster decrease in density after the rapid restructuring of the radial plasma density profile. Despite faster plasma decay with the heating start at $t$
= 0, we use this scenario due to an additional information on density profile dynamics from neutral beams attenuation measurements.
$t$
= 0, we use this scenario due to an additional information on density profile dynamics from neutral beams attenuation measurements.
Proportion of beam atoms captured by the plasma: magenta circles are for the NB6644 experiment, beam injection start at $t$
= 0; blue dots are for the NB6648 experiment, beam injection start at
$t$
= 0; blue dots are for the NB6648 experiment, beam injection start at $t$
= 1.5 ms.
$t$
= 1.5 ms.

Measurements of the spectrum of fast charge-exchange neutrals demonstrated that the reason for the low plasma temperature at the initial stage of experiments is the presence of neutral hydrogen in plasma. The main process of interaction of fast ions with plasma is deceleration due to collisions with electrons. Neutral hydrogen in the space of motion of fast ions leads to their transverse losses due to resonant charge-exchange.
This assumption was tested in a special experiments in which the dynamics of the distribution function of fast neutrals after switching off the neutral injection was studied. In the following is a simple kinetic model in which the left part describes the deceleration of ions in a spatially homogeneous plasma and the right part describes particle losses due to the charge-exchange process:
 \begin{align} \frac {1}{m_i} \frac {\partial }{\partial v_i}(-f_i(v_i) \times F_{dr}(v_i,n_e,T_e)) = -\frac {f_i(v_i)}{{\tau }_{CX}(v_i,n_{H2})}. \end{align}
The solution to this equation is the following:
 \begin{align} \frac {f_{i}(E)}{f_{i}(E_{\textit{inj}})}=\left (\frac {E_{\textit{inj}}}{E}\right )^{3/2} \frac {\xi (T_{e},E_{inj})}{\xi (T_{e},E)} \exp\Bigg(\chi \int \limits _{E}^{E_{\textit{inj}}} \frac {\sigma _{\textit{CX}}(E')}{\sigma _{\textit{tr}}(E') \xi (T_{e},E') E'} \,{\rm d}E'\Bigg)\!, \end{align}
 \begin{align} \xi (T_{e},E')= \frac {1}{n_{e}} \int \limits _0^{({m_{e}}/{m_{i}})E_{i}} f_{M}(T_{e},E_{e})\, {\rm d}E_e , \end{align}
 \begin{align} \sigma _{\textit{tr}}=4 \pi {a_{B}^2} \frac {m_{i}}{m_{e}} \left (\frac {Ry}{E}\right )^2 \varLambda , \end{align}
where $\xi (T_{e},E')$
is the Maxwell integral,
$\xi (T_{e},E')$
is the Maxwell integral, $\sigma _{\textit{tr}}$
is the transport cross-section for e–i collisions, and
$\sigma _{\textit{tr}}$
is the transport cross-section for e–i collisions, and $\chi \equiv n_{H_2}/n_{e}$
is the ratio of the densities of neutral gas and plasma electrons. As can be seen from the formula, the model depends on electron temperature and parameter
$\chi \equiv n_{H_2}/n_{e}$
is the ratio of the densities of neutral gas and plasma electrons. As can be seen from the formula, the model depends on electron temperature and parameter $\chi$
, which can be found from measurements with the analyser of charge-exchange neutrals.
$\chi$
, which can be found from measurements with the analyser of charge-exchange neutrals.
Figure 10(a) shows the expected time evolution of the distribution function of fast ions after the termination of the neutral beams injection at $t$
= 0. The rightmost red line corresponds to the starting time. Each next line to the left of a different colour corresponds to later point in time. The expected behaviour of the spectrum is its shift towards low energies due to ions deceleration and a decrease in the number of particles due to charge-exchange losses. For clarity, the numerical model includes two features of neutral injection that are present in the experiment. These are the different injection energies for the beams 1 and 2, as well as the presence of a beams fraction with half the energy, which is visible in the figure as a peak of 12 keV and below.
$t$
= 0. The rightmost red line corresponds to the starting time. Each next line to the left of a different colour corresponds to later point in time. The expected behaviour of the spectrum is its shift towards low energies due to ions deceleration and a decrease in the number of particles due to charge-exchange losses. For clarity, the numerical model includes two features of neutral injection that are present in the experiment. These are the different injection energies for the beams 1 and 2, as well as the presence of a beams fraction with half the energy, which is visible in the figure as a peak of 12 keV and below.
(a) Predicted evolution of the distribution function of fast ions after the termination of neutral beams. The different line colours correspond to different times after the injection stops. The beam components with $E_0$
and
$E_0$
and $E_0 / 2$
are included in the calculations. The steps at the high-energy sides of the lines are due to difference in the acceleration voltage of neutral beam injectors. (b) Comparison of the measured waveforms of high-energy channels of the neutral particles analyser in the experiment NB8809 with the simulated ones. Labels indicate the median energy of the channels in keV. Sensitivities of analyser channels are different.
$E_0 / 2$
are included in the calculations. The steps at the high-energy sides of the lines are due to difference in the acceleration voltage of neutral beam injectors. (b) Comparison of the measured waveforms of high-energy channels of the neutral particles analyser in the experiment NB8809 with the simulated ones. Labels indicate the median energy of the channels in keV. Sensitivities of analyser channels are different.

Figure 10(b) shows a comparison of the measured signals of the high-energy channels of the neutral particles analyser with the simulated waveforms. On the 12.9 keV channel at $0 \lt t\lt 0.03$
ms, the rapid shift of the
$0 \lt t\lt 0.03$
ms, the rapid shift of the $E_0 / 2$
fraction to lower energies is visible. For all eight channels, fitting was performed for the following parameters:
$E_0 / 2$
fraction to lower energies is visible. For all eight channels, fitting was performed for the following parameters: $n_{e} / n_{H_2} \approx 45$
,
$n_{e} / n_{H_2} \approx 45$
, $n_{e} = (5.5 \pm 0.3) \times 10^{18}$
m
$n_{e} = (5.5 \pm 0.3) \times 10^{18}$
m $^{-3}$
,
$^{-3}$
, $n_{H_2} = (1.26 \pm 0.6) \times 10^{17}$
m
$n_{H_2} = (1.26 \pm 0.6) \times 10^{17}$
m $^{-3}$
. In this case, the fraction of the power of neutral beams trapped in the plasma used to heat the plasma by collisions equals to
$^{-3}$
. In this case, the fraction of the power of neutral beams trapped in the plasma used to heat the plasma by collisions equals to $P_{\textit{drag}} / P_{\varSigma } = 0.187 \pm 0.013$
.
$P_{\textit{drag}} / P_{\varSigma } = 0.187 \pm 0.013$
.
A significant decrease in heating power compared with the expected value is the reason for the low plasma temperature in the first experimental campaigns at GOL-NB. Cold neutral hydrogen also effectively cools plasma ions during the same process, the cross-section of which is large in the low-energy region (see for example, Rapp & Francis Reference Rapp and Francis1962). Some of the neutral hydrogen enters the plasma in the form of heating neutral beams, which is an integral part of the experiment. The main part of the neutrals comes as gas recycling from the walls. Measures to reduce the density of neutrals and their results are given in § 7.
6. Comparison of multiple-mirror and solenoidal configurations at high collisionality
Experiments comparing the characteristics of plasma flow through the strong-field sections in the solenoidal and the multiple-mirror configurations were carried out before measures to reduce recycling were taken. Thus, plasma parameters corresponded to the collisional flow with $\nu ^* \gg 1$
, that is, far from the predicted domain of effective multiple-mirror confinement.
$\nu ^* \gg 1$
, that is, far from the predicted domain of effective multiple-mirror confinement.
Plasma flow parameters were studied using the triple probe and the Mach probe at several locations along the left and right strong-field sections. In this section, we present the measurement results in the right strong-field section at $z$
= 1.37 m. Figure 11 shows the dynamics of density, electron temperature and Mach number at the axis. It can be seen that, despite the high collisionality, the plasma flow velocity in the multiple-mirror configuration is lower than in the solenoidal one. There is a significant difference in the radial density distribution in the axial region, in which the primary starting plasma stream from the gun in the multiple-mirror configuration is much less pronounced than in the solenoidal one.
$z$
= 1.37 m. Figure 11 shows the dynamics of density, electron temperature and Mach number at the axis. It can be seen that, despite the high collisionality, the plasma flow velocity in the multiple-mirror configuration is lower than in the solenoidal one. There is a significant difference in the radial density distribution in the axial region, in which the primary starting plasma stream from the gun in the multiple-mirror configuration is much less pronounced than in the solenoidal one.
Dynamics of the density $n$
, electron temperature
$n$
, electron temperature $T_{e}$
and Mach number
$T_{e}$
and Mach number $M$
at the axis in the right strong-field section at
$M$
at the axis in the right strong-field section at $z$
= 1.37 m in the solenoidal (blue lines) and multiple-mirror configurations (red lines). The 1 MW NBI started at
$z$
= 1.37 m in the solenoidal (blue lines) and multiple-mirror configurations (red lines). The 1 MW NBI started at $t$
= 0. The actual values are shown in pale colours and the smoothed functions with a sliding window of 50
$t$
= 0. The actual values are shown in pale colours and the smoothed functions with a sliding window of 50 $\unicode{x03BC}$
s wide are shown in dark colours.
$\unicode{x03BC}$
s wide are shown in dark colours.

Detailed measurements of the plasma flows entering and exiting the trap revealed one important feature of the plasma accumulation process. At the stage of density accumulation, plasma stabilisation exists only within the primary plasma jet and near the separatrix, when the plasma expands to this radius. There is convective transport in the rest of the plasma. Our understanding is that this transport is caused by processes in the primary low-temperature plasma during the operation of the plasma gun. We observe fluctuations in the azimuthal magnetic field, fluctuations in the plasma potential near the separatrix with an amplitude of the electron temperature scale, fluctuations in probe signals and the appearance of filaments in plasma images. The processes of radial transport lead to the fact that approximately half of the particles are lost across the magnetic field at the stage of plasma accumulation in the scenario when neutral beams start at $t$
= 0.
$t$
= 0.
Figure 12 shows the procedure for estimating the radial transport. Probe measurements provide radial profiles of the main plasma parameters, from which the total particle fluxes to the left and right of the central trap are calculated. The integral of the difference between these fluxes in time gives the total number of particles that should be trapped. The actual number of particles in the trap is measured by the attenuation of the neutral beams. The difference of these values corresponds to the transverse losses. As can be seen from the right side of figure 12, after switching off the plasma gun, the rate of transverse losses decreases significantly.
Dynamics of plasma accumulation and decay in the central trap of GOL-NB. Shown are: the measured parameters (left), the calculated particle fluxes in the left ( $L$
) and right (
$L$
) and right ( $R$
) strong-field sections (centre panel a), the net particle flux to the central trap (centre panel b), the total number of particles trapped (right) by the calculated particle flux (M) and by the measured NBIs attenuation in plasma (NB). The positive sign of the particle flux in the central panel (a) corresponds to plasma flow from the gun to the exit receiver. The vertical dashed line shows the moment of the peak measured density.
$R$
) strong-field sections (centre panel a), the net particle flux to the central trap (centre panel b), the total number of particles trapped (right) by the calculated particle flux (M) and by the measured NBIs attenuation in plasma (NB). The positive sign of the particle flux in the central panel (a) corresponds to plasma flow from the gun to the exit receiver. The vertical dashed line shows the moment of the peak measured density.

A rough estimate of the effective coefficient of transverse diffusion can be found as
 \begin{align} \varPhi _{\perp } \approx -D_{\perp } \frac {\partial n}{\partial r} S \approx -D_{\perp }n(r_{c}) \frac {a}{a-r_{c}} 2 \pi L\approx 2.5 \times 10^{21}\, {\rm s}^{-1}, \end{align}
where $S \approx 2 \pi aL$
is the area of the lateral surface of the plasma,
$S \approx 2 \pi aL$
is the area of the lateral surface of the plasma, $a$
is the plasma radius,
$a$
is the plasma radius, $r_{c}$
is the radius of the stabilised plasma centre, and
$r_{c}$
is the radius of the stabilised plasma centre, and $L$
is the trap length. Using this rough estimate and the density value from the Langmuir probe measurements, we obtain
$L$
is the trap length. Using this rough estimate and the density value from the Langmuir probe measurements, we obtain $D_{\perp } \approx$
1.6 m
$D_{\perp } \approx$
1.6 m $^2$
s–1 assuming zero particle flux from walls. For the same plasma parameters, the Bohm diffusion coefficient is
$^2$
s–1 assuming zero particle flux from walls. For the same plasma parameters, the Bohm diffusion coefficient is $D_{B} = cT / 16eB \approx$
2.3 m
$D_{B} = cT / 16eB \approx$
2.3 m $^2$
s–1. Diagnostics record a rapid decrease in plasma density with radius behind the separatrix. Therefore, the main channel of transverse losses looks like convective radial transport up to the separatrix, and then movement mainly along the magnetic field and neutralisation at the limiter. The images of the limiter area show an increased brightness of the plasma glow in this area.
$^2$
s–1. Diagnostics record a rapid decrease in plasma density with radius behind the separatrix. Therefore, the main channel of transverse losses looks like convective radial transport up to the separatrix, and then movement mainly along the magnetic field and neutralisation at the limiter. The images of the limiter area show an increased brightness of the plasma glow in this area.
A summary from this experimental set is the following. A significant difference was observed between the plasma parameters in the central trap and the plasma flow parameters in the strong-field sections with the switch-over from the solenoidal configuration to the multiple-mirror one. In the multiple-mirror configuration, the plasma flow velocity decreases, its temperature somewhat increases and its density decreases compared with the case of the solenoid field; this is consistent with the multiple-mirror deceleration of plasma flow from the gun. The decay of the central core occurred at an earlier time. This can be attributed to the destabilising role of the corrugated field.
The experiment was done at low ion temperature outside the parameters range required for good multiple-mirror confinement. For these conditions, both theory and our previous experiments (Ivanov et al. Reference Ivanov, Batkin, Burdakov, Burmasov, Kuklin, Mekler, Polosatkin, Postupaev, Sidorov and Rovenskikh2017; Postupaev et al. Reference Postupaev, Batkin, Burdakov, Burmasov, Ivanov, Kuklin, Mekler, Rovenskikh and Sidorov2020) did not predict any significant differences in the plasma flow. Part of this discrepancy can be attributed to the following features of the experiment: the comparison is not with a classical mirror trap, but with a trap with long magnetic mirrors; transverse losses and transverse transport are significant; a sufficiently high residual gas pressure additionally slows down the flow even in a simple solenoid; the real system is much more complicated with biased electrodes and currents in the plasma.
Achieving higher efficiency of plasma flow deceleration requires the following: reducing the role of residual gas (especially the charge-exchange cooling); reduction of the proportion of transverse losses with increasing plasma temperature (new heating systems are required); and the optimisation of the magnetic system for the corrugation depth $R_{mm} \gt 2$
.
$R_{mm} \gt 2$
.
7. Reduction in neutrals density
The initial vacuum system of GOL-NB used four turbomolecular pumps for the central vessel and both expander tanks. After completing the experiments described in § 6, two rod-shaped arc titanium evaporators were installed in the central trap. The equipment was provided by the GDT team, which had a positive experience in reducing recycling using such systems (Bagryansky et al. Reference Bagryansky, Bender, Ivanov, Karpushov, Murachtin, Noack, Krahl and Collatz1999).
A newly deposited titanium layer ensures a clean surface of the first wall immediately before the plasma discharge. This significantly reduces the number of monolayers of gas adsorbed by the surface and, accordingly, reduces the number of neutrals knocked off the wall. We have adopted a titanium deposition procedure during every experimental session. As a result, the vacuum between discharges improved to $(1-2) \times 10^{-6}$
Pa. After pumping from atmospheric pressure, a full working day (10–12 plasma discharges with intermediate titanium deposition) is required to condition the first wall and bring it into the stable state. Additionally, in a regular experimental campaign, the first few plasmas of each day serve to stabilise the plasma parameters. The side effects of this technology include the metallisation of optical windows and other surfaces that are not covered by caps and the periodic appearance of flakes in plasma caused by the crumbling of the titanium layer from surfaces with poor adhesion like foil screens.
$(1-2) \times 10^{-6}$
Pa. After pumping from atmospheric pressure, a full working day (10–12 plasma discharges with intermediate titanium deposition) is required to condition the first wall and bring it into the stable state. Additionally, in a regular experimental campaign, the first few plasmas of each day serve to stabilise the plasma parameters. The side effects of this technology include the metallisation of optical windows and other surfaces that are not covered by caps and the periodic appearance of flakes in plasma caused by the crumbling of the titanium layer from surfaces with poor adhesion like foil screens.
Reducing recycling has significantly improved the overall efficiency of GOL-NB. Figure 13 shows the difference in the spectra of charge-exchange neutrals before and after the titanium gettering. One can see that the number of neutrals that survive to decelerate from $E_0$
to
$E_0$
to $E_0/2$
energy has increased many times. For these specific discharges, the numerical model provides the following parameters:
$E_0/2$
energy has increased many times. For these specific discharges, the numerical model provides the following parameters: $n_{e}/n_{H_2} = 131 \pm 13$
,
$n_{e}/n_{H_2} = 131 \pm 13$
, $P_{\textit{drag}}/P_{\sigma } = 0.155 \pm 0.013$
before gettering and
$P_{\textit{drag}}/P_{\sigma } = 0.155 \pm 0.013$
before gettering and $n_{e}/n_{H_2} = 970 \pm 450$
,
$n_{e}/n_{H_2} = 970 \pm 450$
, $P_{\textit{drag}}/P_{\sigma } = 0.61 \pm 0.13$
with it. This means that with the same neutral beams, the power delivered to plasma electrons increased four times, see figure 14. As the result, the ‘standard’ electron temperature measured by Thomson scattering increased from 15 to 25 eV.
$P_{\textit{drag}}/P_{\sigma } = 0.61 \pm 0.13$
with it. This means that with the same neutral beams, the power delivered to plasma electrons increased four times, see figure 14. As the result, the ‘standard’ electron temperature measured by Thomson scattering increased from 15 to 25 eV.
Energy spectra of fast charge-exchange neutrals before the titanium gettering (panel a) and with it (panel b). The blue circles are the measured data, the red squares are the fitted data with the instrumental functions taken into account and the red lines are the fitted spectra. The steps at the high-energy sides of the lines are due to $\sim$
0.5 kV difference in the acceleration voltage of NBIs. The lowest-energy channel also detects CX neutrals from the
$\sim$
0.5 kV difference in the acceleration voltage of NBIs. The lowest-energy channel also detects CX neutrals from the $E_0 / 2$
beam fraction.
$E_0 / 2$
beam fraction.

(a) Dynamics of the fraction of the trapped beam power that is transferred by drag to plasma electrons in the experiments NB8598 before the titanium gettering and NB10594 with it. (b) Calculated dependence of the same fraction on $n_{e}/n_{H_2}$
ratio with the same two experiments shown.
$n_{e}/n_{H_2}$
ratio with the same two experiments shown.

The ion temperature is the key factor for the physics of multiple-mirror confinement. With large recycling, the ions do not have time to heat up in collisions with electrons due to the charge-exchange cooling. Reducing the neutrals density improved the conditions for ion heating. Figure 15 shows the $H_{\alpha }$
line profiles for three different cases. The contour of the line in the cold plasma experiment is close to the instrumental function. After the start of titanium gettering, the ion temperature almost doubled, from 6 to 12 eV. Such an ion temperature is still significantly lower than the value required for the optimal multiple-mirror confinement in GOL-NB. A further increase in the ion temperature is possible with an increase in plasma density at the confinement stage, for which a hydrogen supply system is currently being manufactured.
$H_{\alpha }$
line profiles for three different cases. The contour of the line in the cold plasma experiment is close to the instrumental function. After the start of titanium gettering, the ion temperature almost doubled, from 6 to 12 eV. Such an ion temperature is still significantly lower than the value required for the optimal multiple-mirror confinement in GOL-NB. A further increase in the ion temperature is possible with an increase in plasma density at the confinement stage, for which a hydrogen supply system is currently being manufactured.
Normalised spectral profiles of the H $_{\alpha }$
line from the central trap measured in
$_{\alpha }$
line from the central trap measured in $\delta t = 1{-}2$
ms in the cases of cold starting plasma with
$\delta t = 1{-}2$
ms in the cases of cold starting plasma with $T_{i}$
= 2.0 eV (blue line), NBI-heated plasma before the titanum gettering with
$T_{i}$
= 2.0 eV (blue line), NBI-heated plasma before the titanum gettering with $T_{i}$
= 5.7 eV (red line), and NBI-heated plasma with the titanum gettering with
$T_{i}$
= 5.7 eV (red line), and NBI-heated plasma with the titanum gettering with $T_{i}$
= 11.7 eV. Dashed lines are fitted gaussians.
$T_{i}$
= 11.7 eV. Dashed lines are fitted gaussians.

8. Low-energy electron beam
The physics of electron beam–plasma interactions has been studied for nearly a century, beginning with the pioneering work of Langmuir’s group. One of the goals of such research is the rapid plasma heating in open traps to high temperatures through collective effects. Traditionally, this problem has been solved using electron beams with energies of the order of 1 MeV, which have a sufficiently high current density $n_{b} / n_{e} \sim 10^{-3}{-}10^{-4}$
(where
$n_{b} / n_{e} \sim 10^{-3}{-}10^{-4}$
(where $n_{b}$
is the beam electron density) and a small angular spread
$n_{b}$
is the beam electron density) and a small angular spread $\Delta \theta \ll 1$
(Arzhannikov et al. Reference Arzhannikov, Burdakov, Koidan and Vyacheslavov1982, Reference Arzhannikov1988; Agafonov et al. Reference Agafonov1996). The beam-heated plasma in our previous GOL-3 facility (Burdakov et al. Reference Burdakov2007) achieved a highest
$\Delta \theta \ll 1$
(Arzhannikov et al. Reference Arzhannikov, Burdakov, Koidan and Vyacheslavov1982, Reference Arzhannikov1988; Agafonov et al. Reference Agafonov1996). The beam-heated plasma in our previous GOL-3 facility (Burdakov et al. Reference Burdakov2007) achieved a highest $n \tau _{E}$
product for open traps (see Wurzel & Hsu Reference Wurzel and Hsu2022). The two major problems of the experiments with high-current relativistic electron beams were the following. The first was the excessively high power of tens of gigawatts, which did not allow increasing the beam generation duration beyond 10
$n \tau _{E}$
product for open traps (see Wurzel & Hsu Reference Wurzel and Hsu2022). The two major problems of the experiments with high-current relativistic electron beams were the following. The first was the excessively high power of tens of gigawatts, which did not allow increasing the beam generation duration beyond 10 $\unicode{x03BC}$
s. The second problem is a gradual decay of the return plasma current due to anomalous plasma resistivity, which leads to a loss of MHD stability (Postupaev et al. Reference Postupaev2005). Later, the experiments of Burdakov et al. (Reference Burdakov2013) and Soldatkina et al. (Reference Soldatkina2022) were conducted with electron beams with energies of tens of keV and powers of up to 10 MW, which could be generated with durations in the millisecond range.
$\unicode{x03BC}$
s. The second problem is a gradual decay of the return plasma current due to anomalous plasma resistivity, which leads to a loss of MHD stability (Postupaev et al. Reference Postupaev2005). Later, the experiments of Burdakov et al. (Reference Burdakov2013) and Soldatkina et al. (Reference Soldatkina2022) were conducted with electron beams with energies of tens of keV and powers of up to 10 MW, which could be generated with durations in the millisecond range.
An analysis of the potential of using electron beams as an additional tool in the GOL-NB experiments demonstrated the feasibility of creating an electron beam emitter with an energy of several hundred electronvolts and a current of ${\sim}100$
A. Such an electron beam can be generated in pulses of sufficient duration. The main physical feature, compared with relativistic beams, is the relatively low electron velocity. This means that the same density of beam electrons can be achieved at a much lower current density. Such a beam allows us to solve the following physical problems: modification of the plasma potential near the axis (the second transport barrier); gas ionisation at the cross-section maximum; an additional electron heating by binary collisions; (possibly) an additional collective heating at
${\sim}100$
A. Such an electron beam can be generated in pulses of sufficient duration. The main physical feature, compared with relativistic beams, is the relatively low electron velocity. This means that the same density of beam electrons can be achieved at a much lower current density. Such a beam allows us to solve the following physical problems: modification of the plasma potential near the axis (the second transport barrier); gas ionisation at the cross-section maximum; an additional electron heating by binary collisions; (possibly) an additional collective heating at $n_{b} / n_{e} \sim 10^{-2}$
; (possibly) seed fast electrons for a possible
$n_{b} / n_{e} \sim 10^{-2}$
; (possibly) seed fast electrons for a possible $2 \omega _{\textit{ce}}$
heating system.
$2 \omega _{\textit{ce}}$
heating system.
The emitter of the electron beam is mounted at the axis of the exit plasma receiver in an 80 mT magnetic field, see figure 16. It uses the hot LaB $_6$
cathode of 50 mm diameter. The anode is the plasma flow from the trap. The beam current is defined by the sub-mm thickness of the Langmuir layer and the ‘3/2 law’. The cathode is biased relative to the vacuum vessel at
$_6$
cathode of 50 mm diameter. The anode is the plasma flow from the trap. The beam current is defined by the sub-mm thickness of the Langmuir layer and the ‘3/2 law’. The cathode is biased relative to the vacuum vessel at $U_b\lt 400$
V. This means that the accelerating voltage in the diode varies through the discharge due to changes in the plasma potential. No electron beam exists without the plasma flow to the emitter. The beam size follows the shape of the magnetic surface, see figure 16.
$U_b\lt 400$
V. This means that the accelerating voltage in the diode varies through the discharge due to changes in the plasma potential. No electron beam exists without the plasma flow to the emitter. The beam size follows the shape of the magnetic surface, see figure 16.
Layout of the electron beam emitter (left) and plasma images in the right strong-field section at $z = 2.02$
m in
$z = 2.02$
m in $t = 2.15$
ms taken without (centre) and with the electron beam (right).
$t = 2.15$
ms taken without (centre) and with the electron beam (right).

Figure 17 shows typical waveforms in the electron beam experiment. The peak beam current reaches ${\sim}100$
A. An interesting feature is that the beam current still exists at the late stage of plasma decay at
${\sim}100$
A. An interesting feature is that the beam current still exists at the late stage of plasma decay at $t$
= 4–6 ms. The beam significantly modifies the net current to the exit plasma receiver. It decays significantly longer and its time integral is significantly larger. This most likely indicates better plasma confinement and lower radial losses in the central trap.
$t$
= 4–6 ms. The beam significantly modifies the net current to the exit plasma receiver. It decays significantly longer and its time integral is significantly larger. This most likely indicates better plasma confinement and lower radial losses in the central trap.
Typical waveforms in the experiment with the electron beam injection.

Radial profiles of the plasma potential with (blue and green symbols) and without the electron beam injection (orange symbols) in $t$
= 2.5 ms. The grey rectangle shows the magnetic flux tubes connected to the limiter.
$t$
= 2.5 ms. The grey rectangle shows the magnetic flux tubes connected to the limiter.

Dynamics of plasma parameters at the axis by Thomson scattering with and without the electron beam. Colour strips at the top show the scenario of the experiments.

Figure 18 shows the radial profiles of the electric potential in the central trap near the limiter at $z$
= 0.86 m without and with the electron beam. Note that the limiter has +110 V bias relative to the wall. In the standard case, a single edge zone with a strong radial electric field forms near the limiter. The beam modifies the potential near the axis; thus, creating a second zone of
$z$
= 0.86 m without and with the electron beam. Note that the limiter has +110 V bias relative to the wall. In the standard case, a single edge zone with a strong radial electric field forms near the limiter. The beam modifies the potential near the axis; thus, creating a second zone of $E \times B$
differential rotation, which can break convection cells and consequently reduce transverse transport in the central part of the plasma.
$E \times B$
differential rotation, which can break convection cells and consequently reduce transverse transport in the central part of the plasma.
Figure 19 shows the net action of the electron beam on plasma at the axis. The density decays at later time when the beam is on. The electron temperature is the same during the plasma gun operation when the trapped plasma is connected to the gun via electron thermal conductivity. Later, the temperature reaches 45 eV during beam operation, which is almost twice the temperature in the NBI-only experiments. It should be noted that the increase in $T_{e}$
begins at
$T_{e}$
begins at $t\gt3$
ms when
$t\gt3$
ms when $n_{e}\lt 10^{19}$
m
$n_{e}\lt 10^{19}$
m $^{-3}$
. This may indicate that the
$^{-3}$
. This may indicate that the $n_{b} / n_{e}$
ratio becomes large enough to trigger collective relaxation effects. Strong Langmuir turbulence was reported by Karfidov et al. (Reference Karfidov, Rubenchik, Sergeichev and Sychev1990) for similar dimensionless parameters.
$n_{b} / n_{e}$
ratio becomes large enough to trigger collective relaxation effects. Strong Langmuir turbulence was reported by Karfidov et al. (Reference Karfidov, Rubenchik, Sergeichev and Sychev1990) for similar dimensionless parameters.
A brief summary of this part of the experiments is that the electron beam changes the potential near the axis and creates an internal zone with differential $E \times B$
drift rotation; the confinement is better with the beam; the increase in temperature during the plasma decay stage may be a sign of the onset of collective interaction at this time.
$E \times B$
drift rotation; the confinement is better with the beam; the increase in temperature during the plasma decay stage may be a sign of the onset of collective interaction at this time.
Dependence of the longitudinal wavenumber on the plasma density in which the eigenmodes are localised. Different symbols correspond to different densities at the axis. Every symbol belongs to a specific mode.

9. Development of ICRH system
As noted, the ion free path length is a critical parameter that determines the effectiveness of multiple-mirror confinement. Controlling the collisionality of ions is important, especially at low densities, when ion heating by collisions with electrons is inefficient. Therefore, an auxiliary ion cyclotron resonance heating system is planned for the central trap of GOL-NB. The wave energy will be delivered to the resonance region according to the ‘magnetic beach’ scheme (Stix & Palladino Reference Stix and Palladino1958; Zvonkov & Timofeev Reference Zvonkov and Timofeev1987), in which the Alfvén wave is excited in a stronger field and then this wave propagates to the resonance region, where it is absorbed.
We chose the industrial frequency of 13.56 MHz (0.89 T resonant field) and double-half-turn antenna located in the field of 1.3 T in the right part of the central trap. Empirical experience from the TMX-U and GAMMA-10 experiments shows that sufficient heating requires power levels of the order of hundreds of kilowatts. The first trials were done with a CW industrial generator at the power levels of up to 12 kW. In addition to the collisionality control, the ICRH system will expand the possibilities of experimenting with hybrid scenarios.
Figure 20 shows the longitudinal wavenumbers for three plasma densities at the axis for various eigenmodes in a 1.3 T magnetic field, calculated in cylindrical geometry for a typical radial density profile (Melnikov et al. Reference Melnikov, Skovorodin, Kalinin, Polosatkin, Kholopov, Postupaev, Ivanov, Maslakov, Kondakov and Shikhovtsev2023). The dotted lines bound the transparency region for the Alfvén wave in a homogeneous plasma. The $x$
-coordinates of points correspond to local plasma densities in which the maximum wave field is localised. Within each family of points, the modes localised in the central part have a slightly higher longitudinal wavenumber than those localised in the periphery.
$x$
-coordinates of points correspond to local plasma densities in which the maximum wave field is localised. Within each family of points, the modes localised in the central part have a slightly higher longitudinal wavenumber than those localised in the periphery.
Double–half-turn antennae are widely used for exciting electromagnetic waves in plasma. The best coupling was observed for wavelengths of 1.5–2 antenna diameters (Dimonte et al. Reference Dimonte, Molvik, Barter, Cummins, Falabella, Poulsen and Romesser1987). For GOL-NB plasma diameter of 20 cm in the antenna area, the optimal wavelength will be ${\sim}35$
cm (the green line in figure 20). Then, at a density of
${\sim}35$
cm (the green line in figure 20). Then, at a density of $1 \times 10^{19}$
m
$1 \times 10^{19}$
m $^{-3}$
, waves with a maximum field should be efficiently excited in the plasma centre. In the reference scenario with
$^{-3}$
, waves with a maximum field should be efficiently excited in the plasma centre. In the reference scenario with $n_{i} = 3 \times 10^{19}$
m
$n_{i} = 3 \times 10^{19}$
m $^{-3}$
, the wave will propagate only in the plasma periphery.
$^{-3}$
, the wave will propagate only in the plasma periphery.
Figure 21 shows the layout of the ICRH system. The challenging point of the design is a compact size of the central trap of GOL-NB. The axial distance between the antenna and the resonance is approximately 7 cm only. Therefore, the trial experiments were done at low RF power with the main task of measuring the wave propagation features.
Magnetic field in the ICRH region (left) and hardware layout (right). C2–C4, coils; A, antenna; R, resonance.

The antenna has shown reliable operation without breakdowns at a power of up to 12 kW. Photos of the antenna and typical signals are shown in figure 22. The fraction of RF power output from the generator to the antenna depended on the radial plasma density profile represented by the triple probe signals. The radial profiles are different with and without NBI heating, and the antenna efficiency and distribution of the RF field in the plasma change accordingly. An interesting macroscopic effect of the RF wave on plasma, even at low power, is an increase in the time during which a negative radial electric field is maintained near the limiter (signals in the bottom part of the figure).
Images of the antenna during the assembly (top left) and in the experiment (bottom left). The waveforms are for $P_{\textit{ICRH}}$
= 7 kW (top to bottom): plasma gun current
$P_{\textit{ICRH}}$
= 7 kW (top to bottom): plasma gun current $I_{gun}$
, electron densities
$I_{gun}$
, electron densities $n_{e}$
at different radii by triple probe (colour coded), antenna efficiency
$n_{e}$
at different radii by triple probe (colour coded), antenna efficiency $1-s_{11}^2$
, wave intensities
$1-s_{11}^2$
, wave intensities $B_{r}$
at different radii (colour coded) with and without NBI heating, and radial electric field at the separatrix
$B_{r}$
at different radii (colour coded) with and without NBI heating, and radial electric field at the separatrix $E_{r}$
with and without ICRH power (several experiments are overlaid).
$E_{r}$
with and without ICRH power (several experiments are overlaid).

The trial experiments at low RF power confirmed our expectations and the hardware design in general. A full-scale RF generator that will provide 200 kW, 5 ms pulses at 13.56 MHz is under development now.
10. Summary
The GOL-3 experiment was created to directly demonstrate the multiple-mirror confinement efficiency with hydrogen plasma. The magnetic system allows the comparison of plasma parameters in the solenoidal and multiple-mirror configurations of strong-field sections, at all other things being equal. The physical concept is to create a relatively dense plasma with a relatively low temperature for rapid thermalisation of neutral beam ions. Large longitudinal losses are the design feature that should dominate all other processes.
Currently, the device works in the design configuration. The processes of plasma accumulation in the trap and its heating by neutral beams, and the parameters of the fast ion population have been studied. Our understanding of the mechanisms of plasma stabilisation in the trap has been confirmed. Some deceleration of the plasma flow during the transition from the solenoidal to the multiple-mirror configuration of strong field sections is demonstrated in the experiment at high collisionality. The improvement of vacuum conditions resulted in the growth of $T_{e}$
from 15 to 25 eV and
$T_{e}$
from 15 to 25 eV and $T_{i}$
from 6 to 12 eV. This shifts the collisionality closer to the optimal range for the multiple-mirror confinement. The electron temperature of 45 eV has been achieved with the low-energy electron beam. The first run with an ICRH power of up to 12 kW has been completed.
$T_{i}$
from 6 to 12 eV. This shifts the collisionality closer to the optimal range for the multiple-mirror confinement. The electron temperature of 45 eV has been achieved with the low-energy electron beam. The first run with an ICRH power of up to 12 kW has been completed.
A further increase in ion temperature is required for the optimal multiple-mirror confinement regime. This will require both an additional density control system, which will provide a particle feed during the confinement stage, and an additional power for plasma heating. A more capable generator for ICRH is currently being developed. A preliminary theoretical consideration of a possible electron cyclotron heating system shows that such a system is feasible with the existing design of the magnetic and vacuum systems of GOL-NB, but it is not easy to find a working solution (Gospodchikov et al. Reference Gospodchikov, Smolyakova, Shalashov and Postupaev2025). Further detailed theoretical analysis of ECRH wave propagation and absorption is required.
Acknowledgements
The authors thank Dr Vitaly Astrelin, Professor Peter Bagryansky, Dr Aleksey Beklemishev, Dr Sergey Murakhtin and Dr Igor Shikhovtsev for valuable discussions and technical help.
Editor Cary Forest thanks the referees for their advice in evaluating this article.
Funding
This work was supported by the Ministry of Science and Higher Education of the Russian Federation, project FWGM-2025-0043.
Declaration of interests
The authors report no conflict of interest.

 ν∗≈1
ν∗≈1 Rmm−1≈1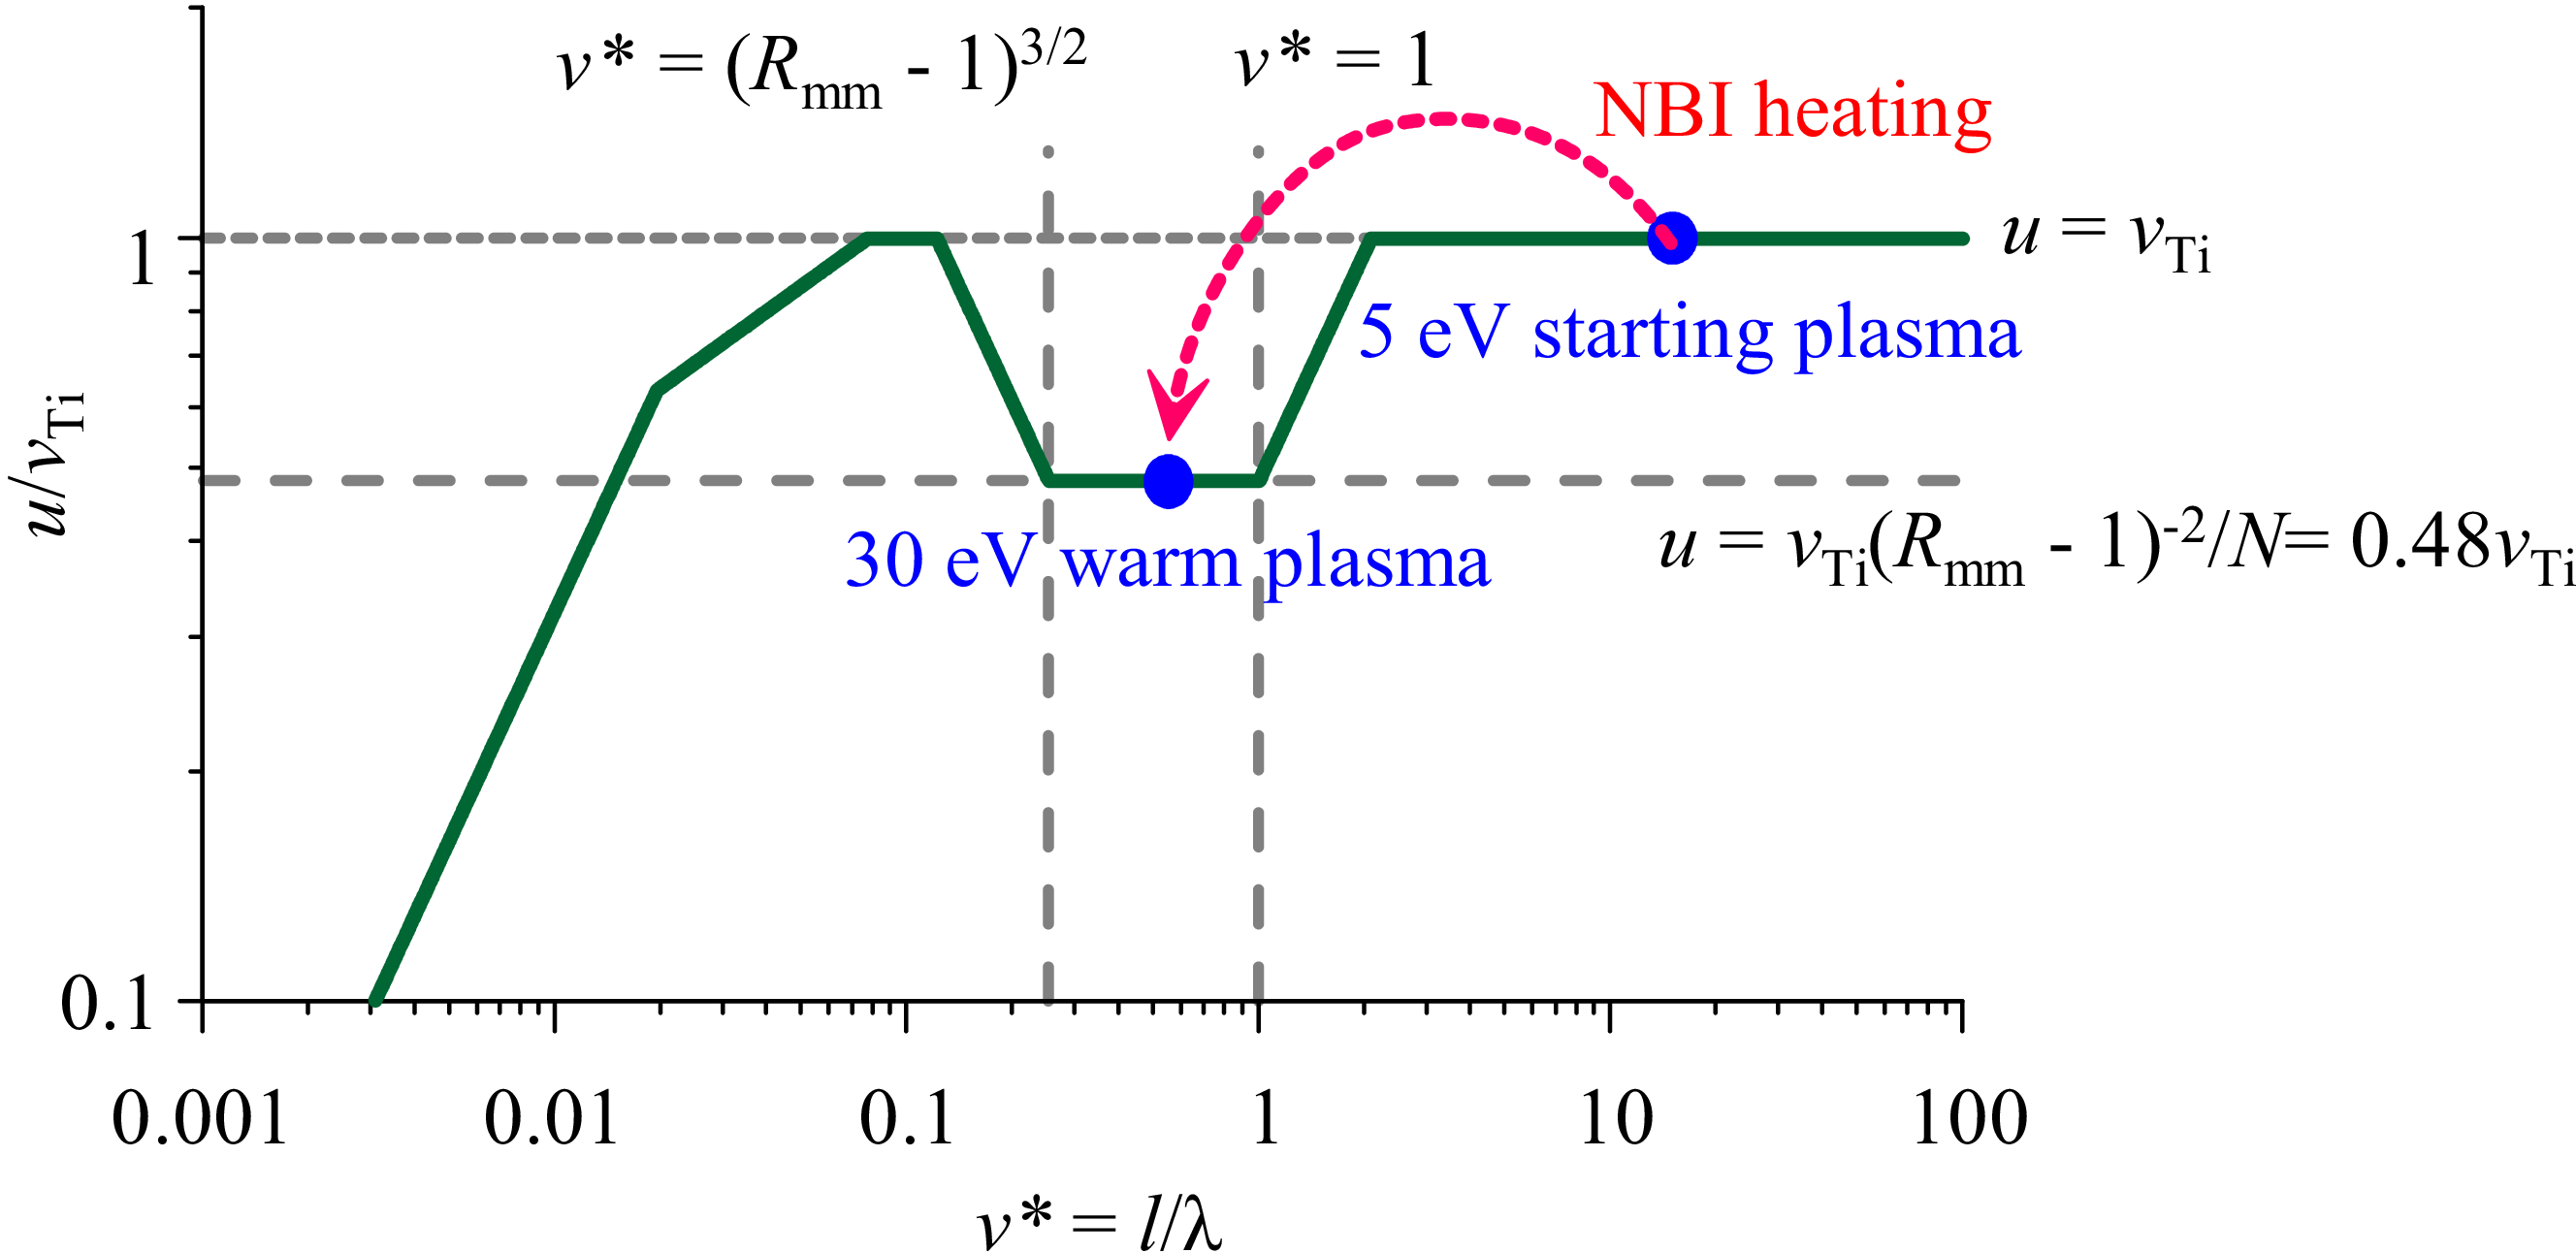
 ν∗
ν∗ (Rmm−1)3/2<ν∗<1
 u/vTi=(Rmm−1)−2/N=0.48
 n≈3×10¹⁹
 −3
−3 T≈5
T≈5 T≈30
T≈30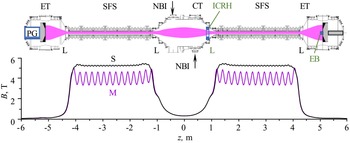
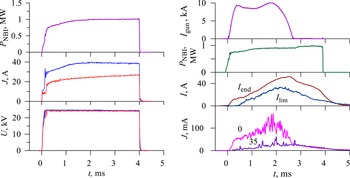
 PNBI
PNBI J
J U
U Igun
Igun PNBI
PNBI Ilim
Ilim Iend
Iend z=0.86
 r
r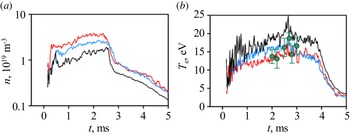
 z
z z
z z
z z
z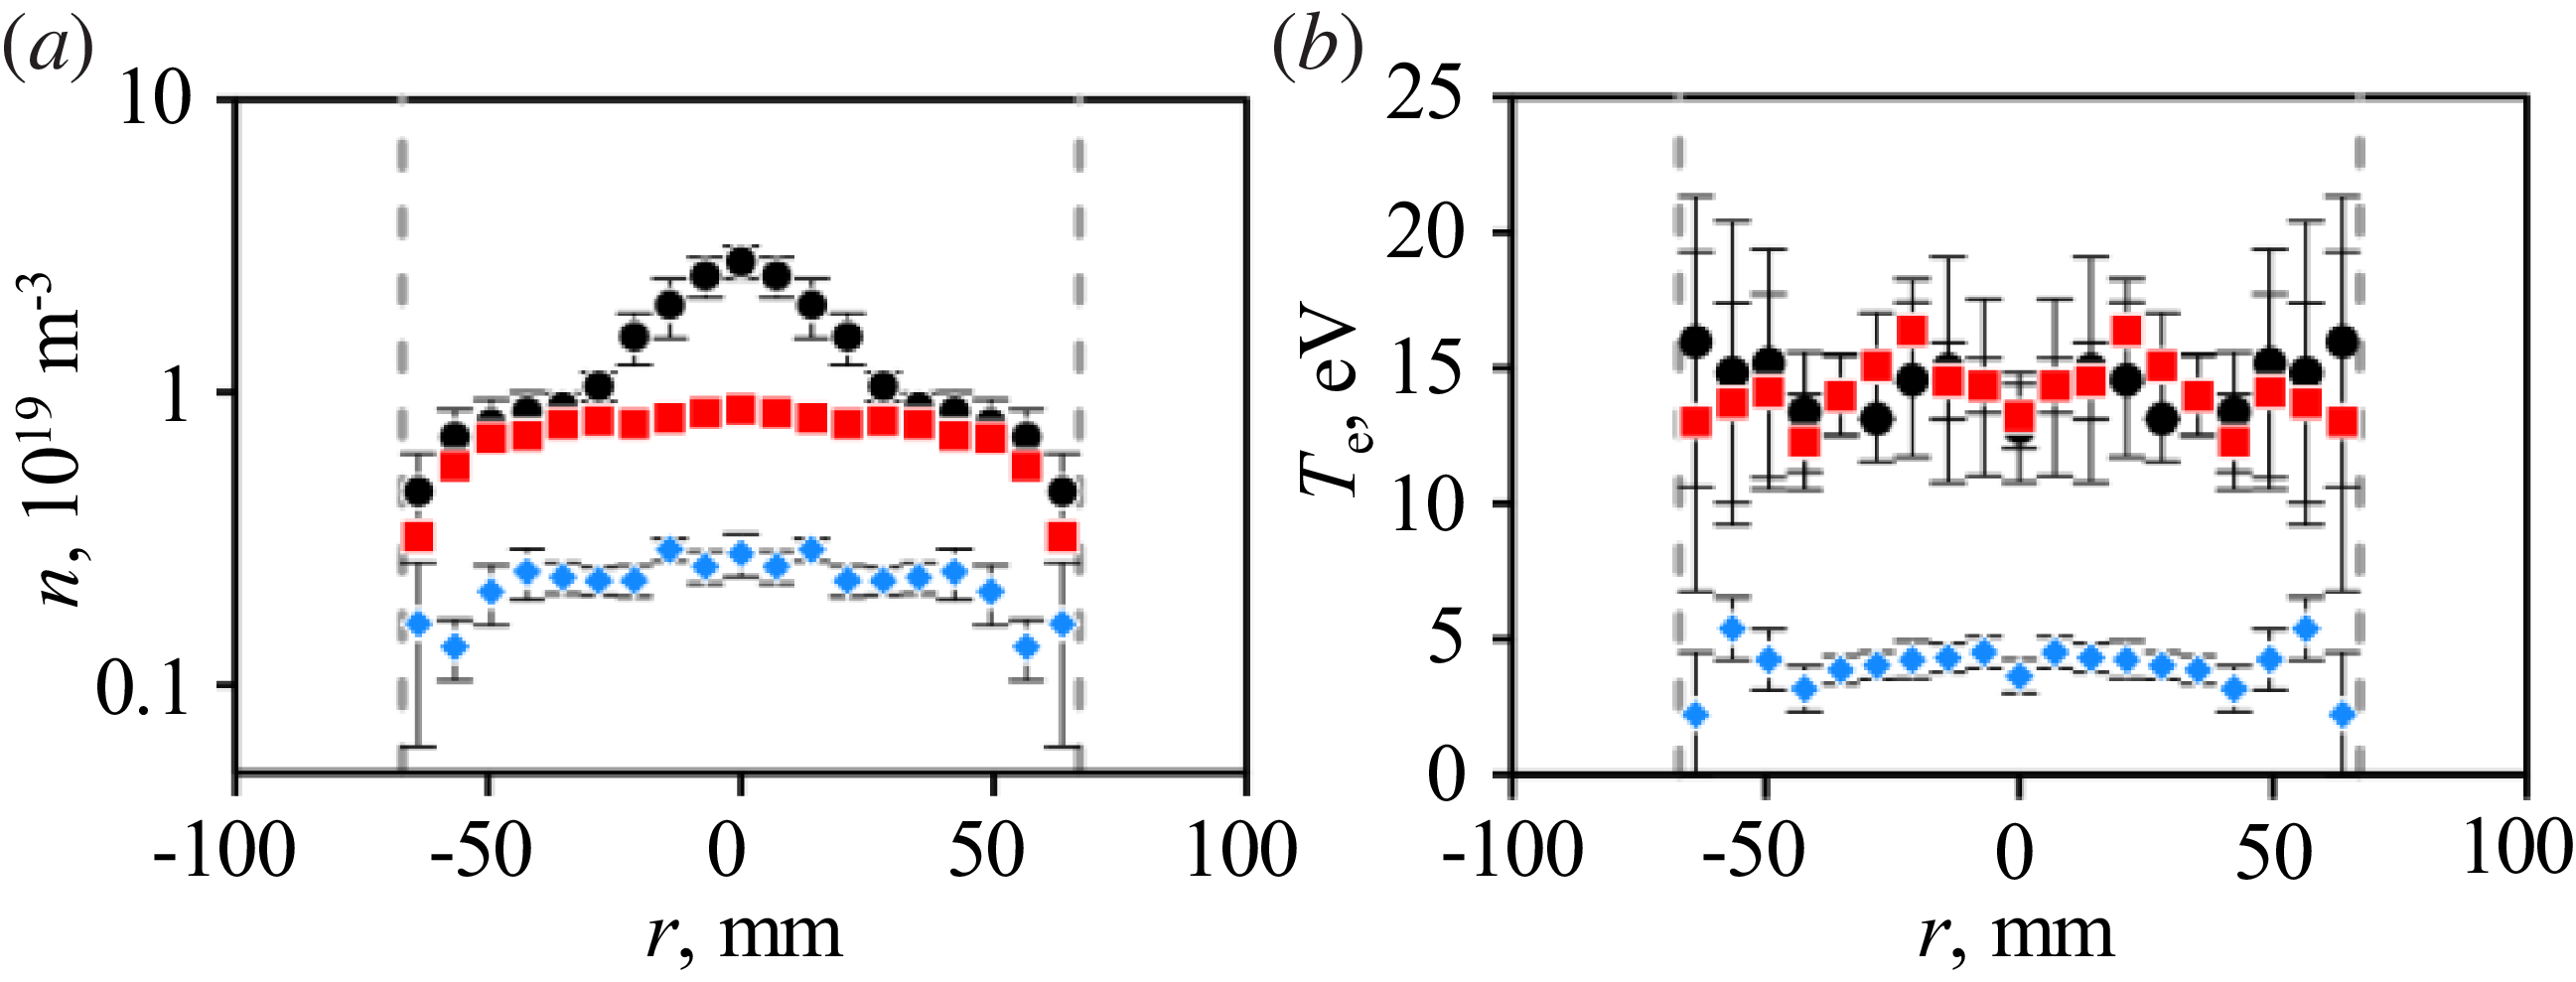
 z
z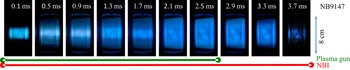
 z
z μ
μ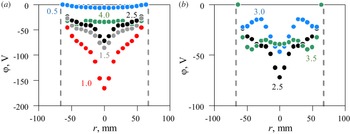
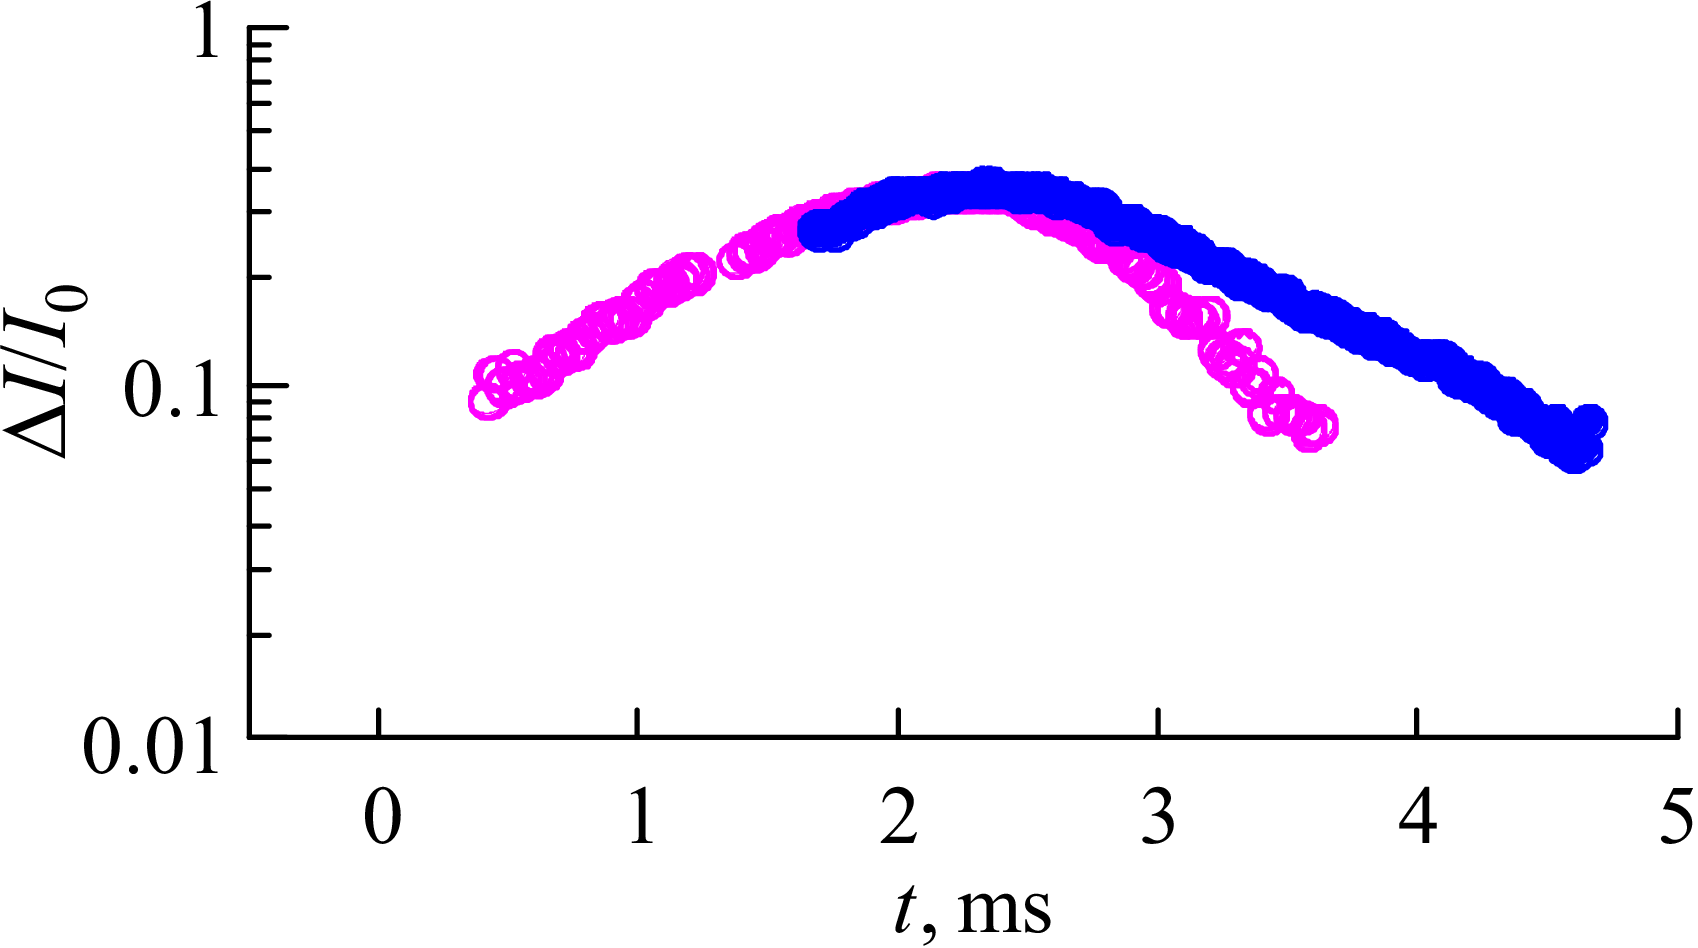
 t
t t
t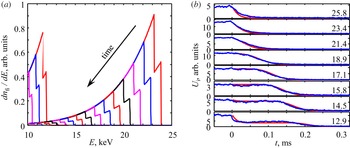
 E0
E0 E0/2
E0/2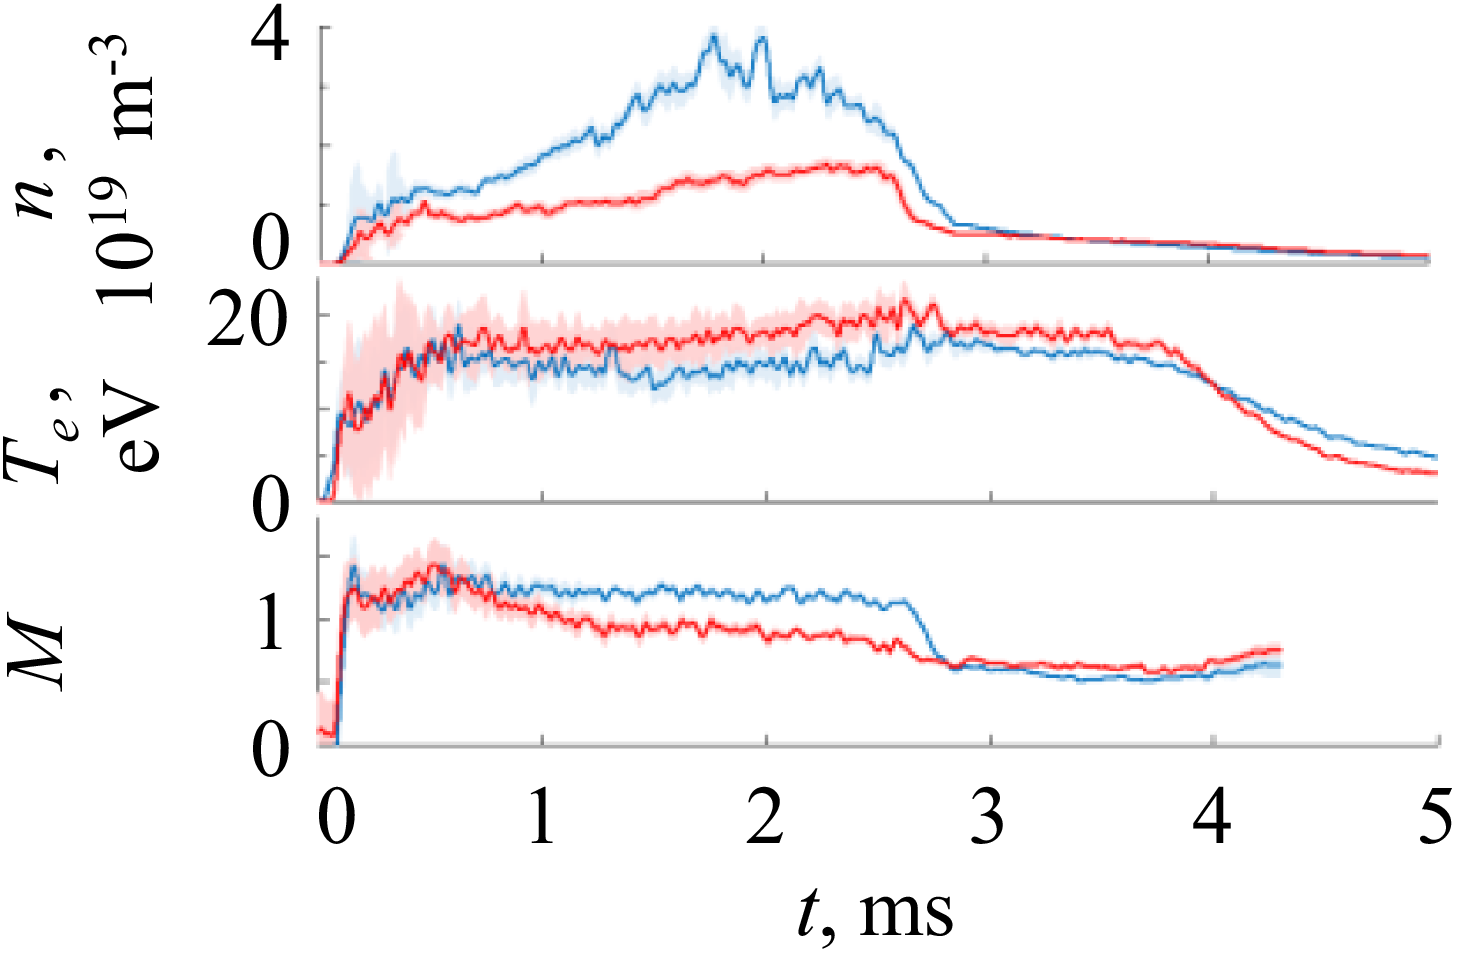
 n
n Te
Te M
M z
z t
t μ
μ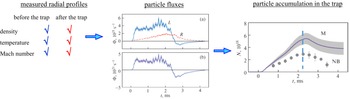
 L
L R
R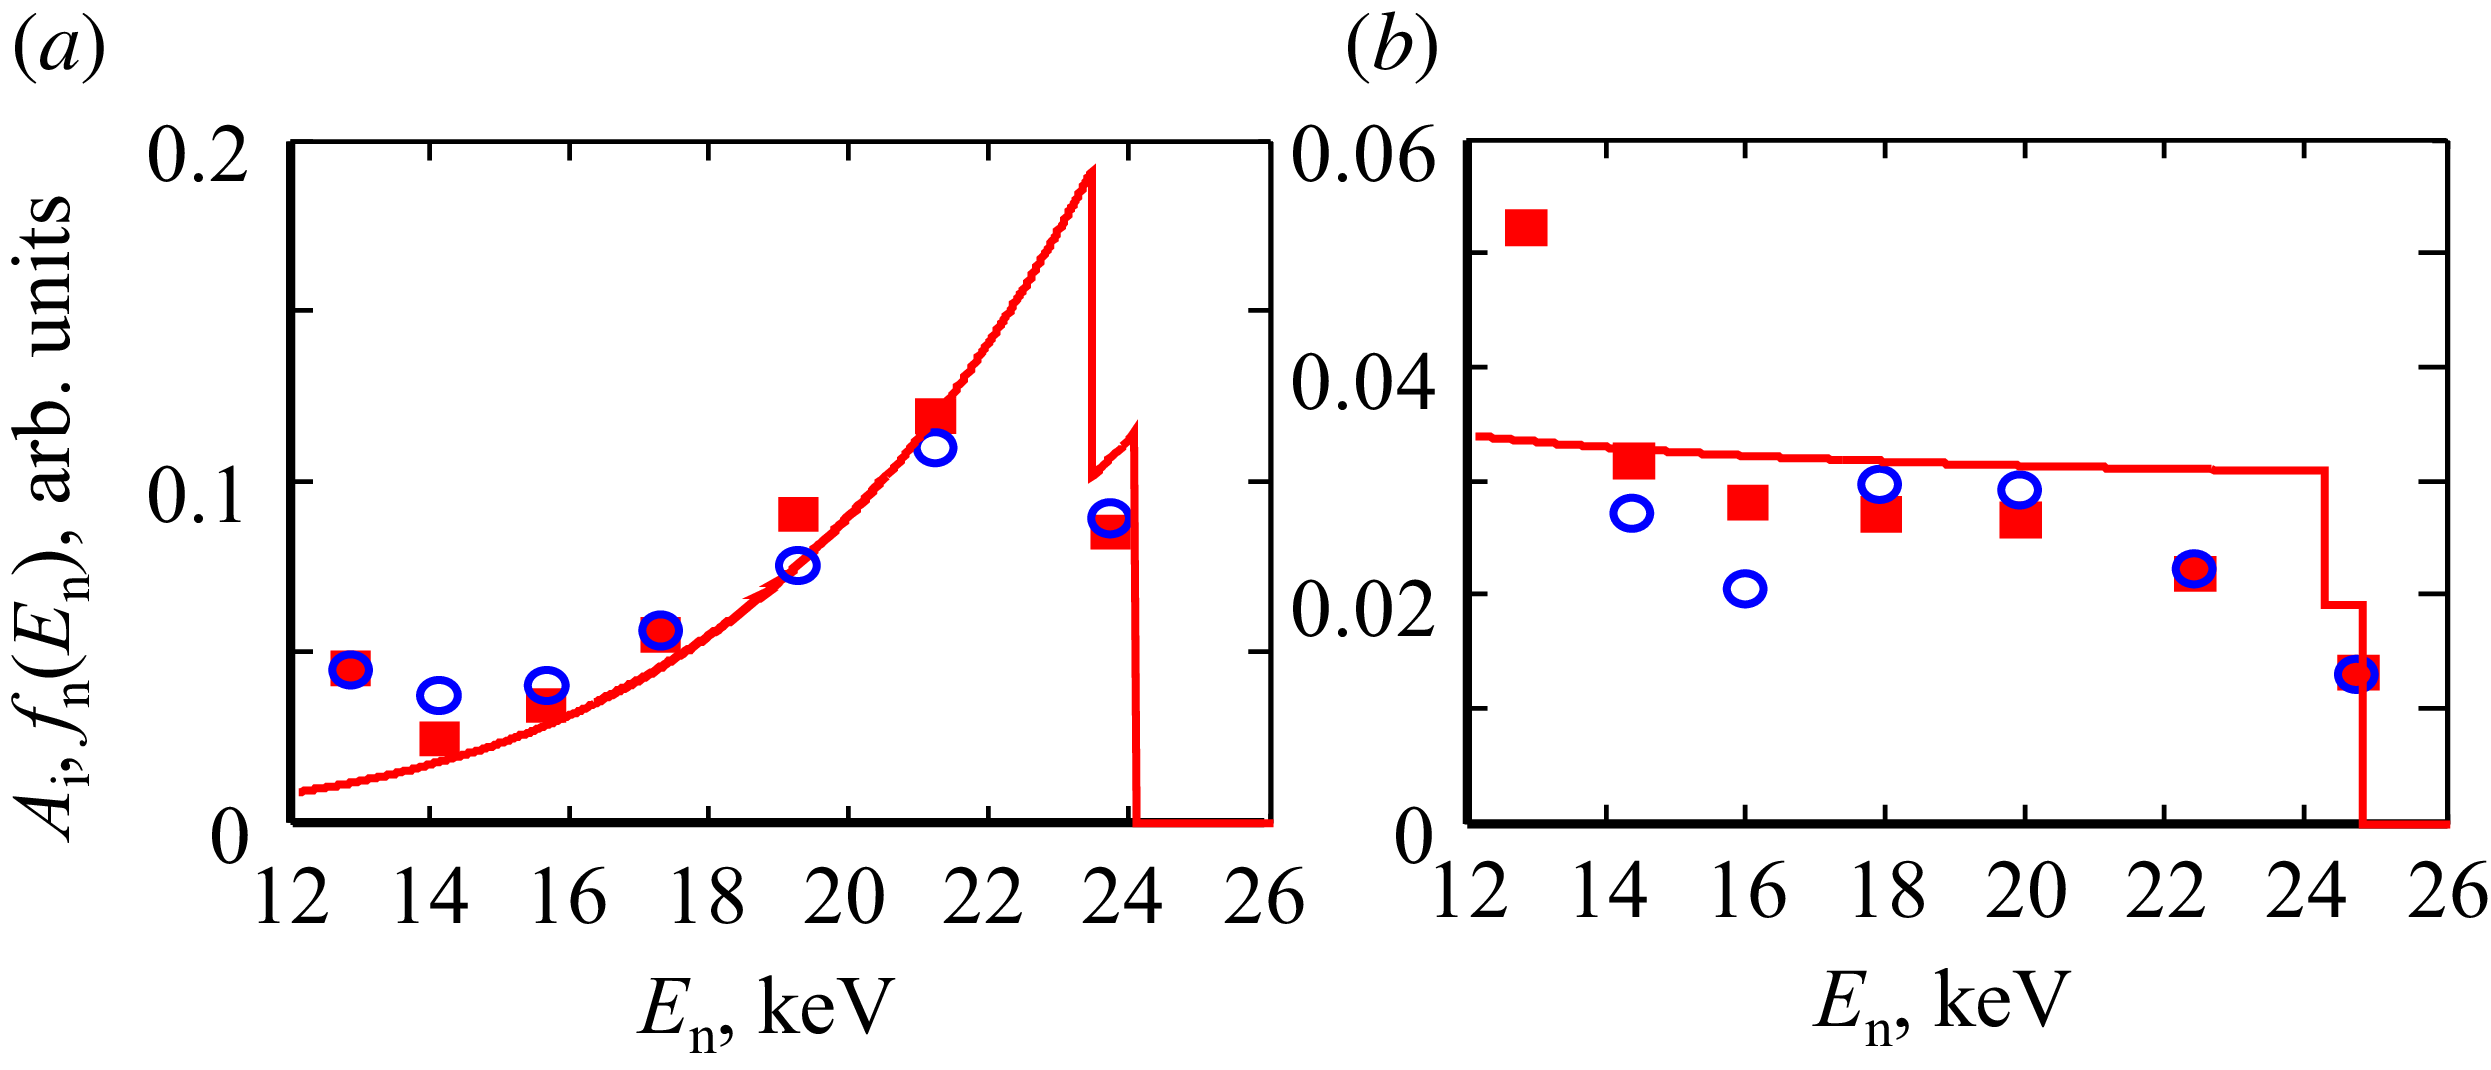
 ∼
∼ E0/2
E0/2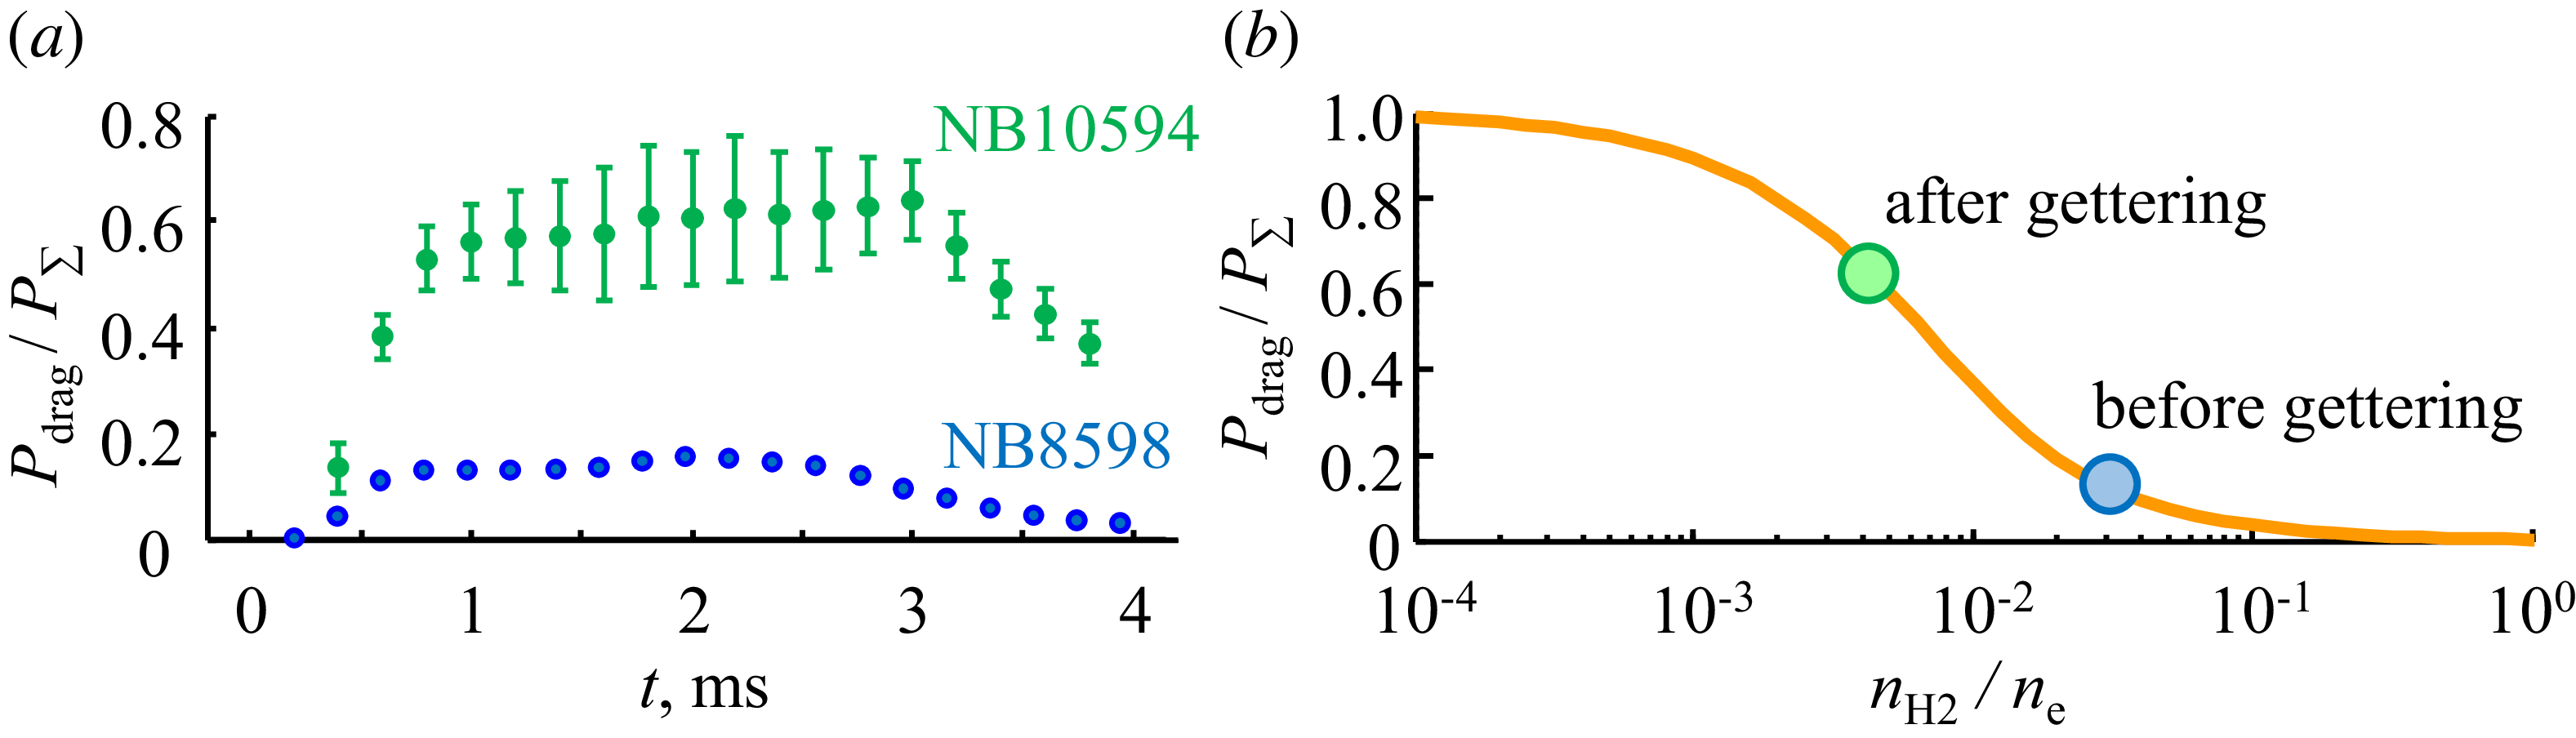
 ne/nH2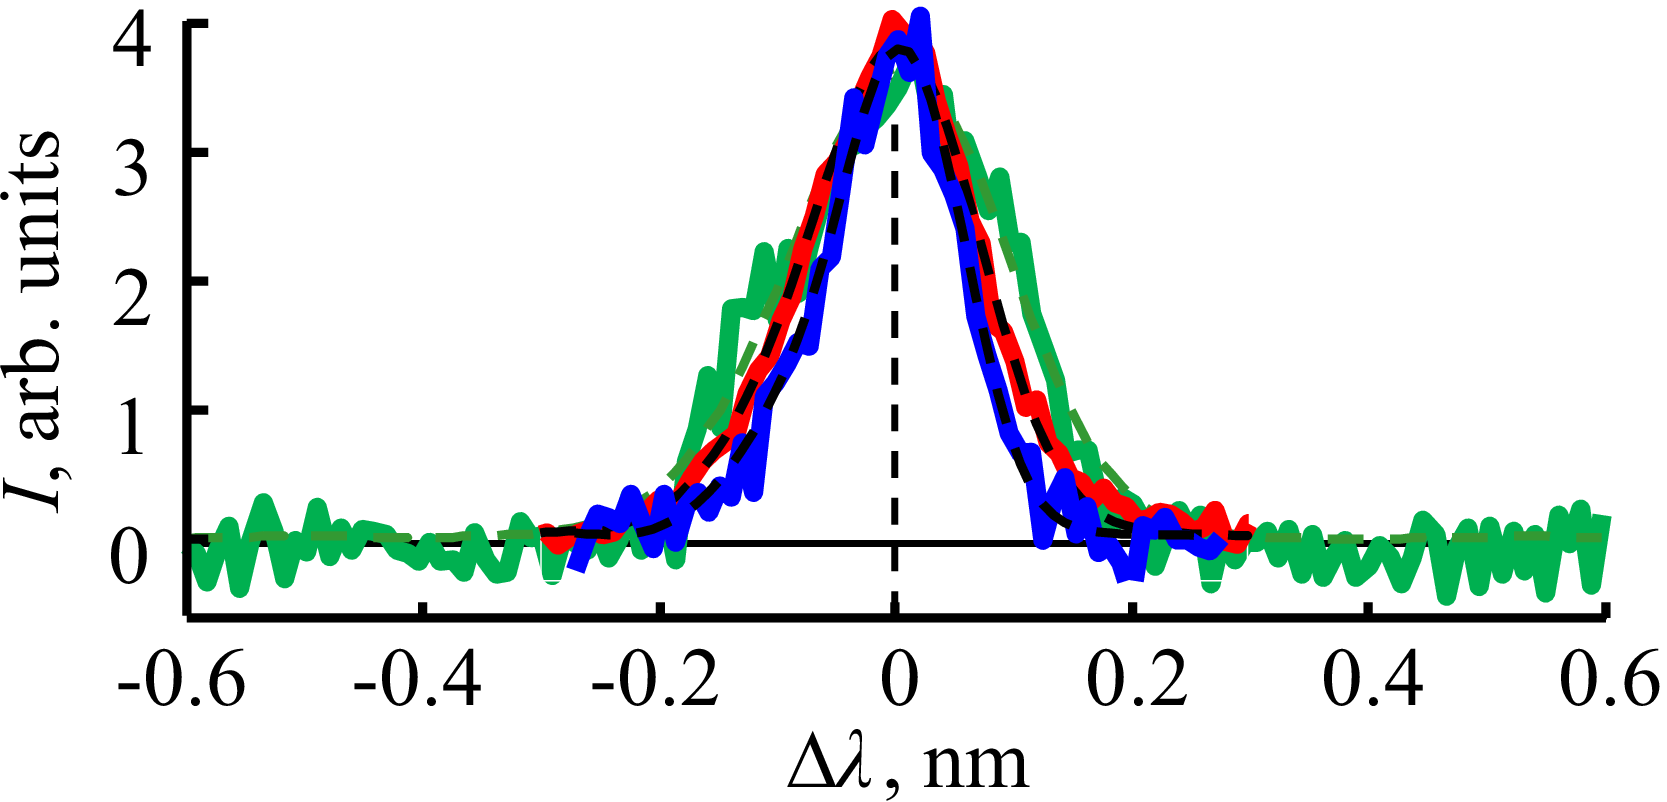
 α
α δt=1−2
 Ti
Ti Ti
Ti Ti
Ti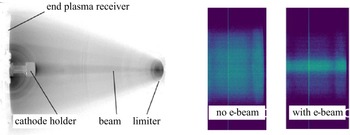
 z=2.02
 t=2.15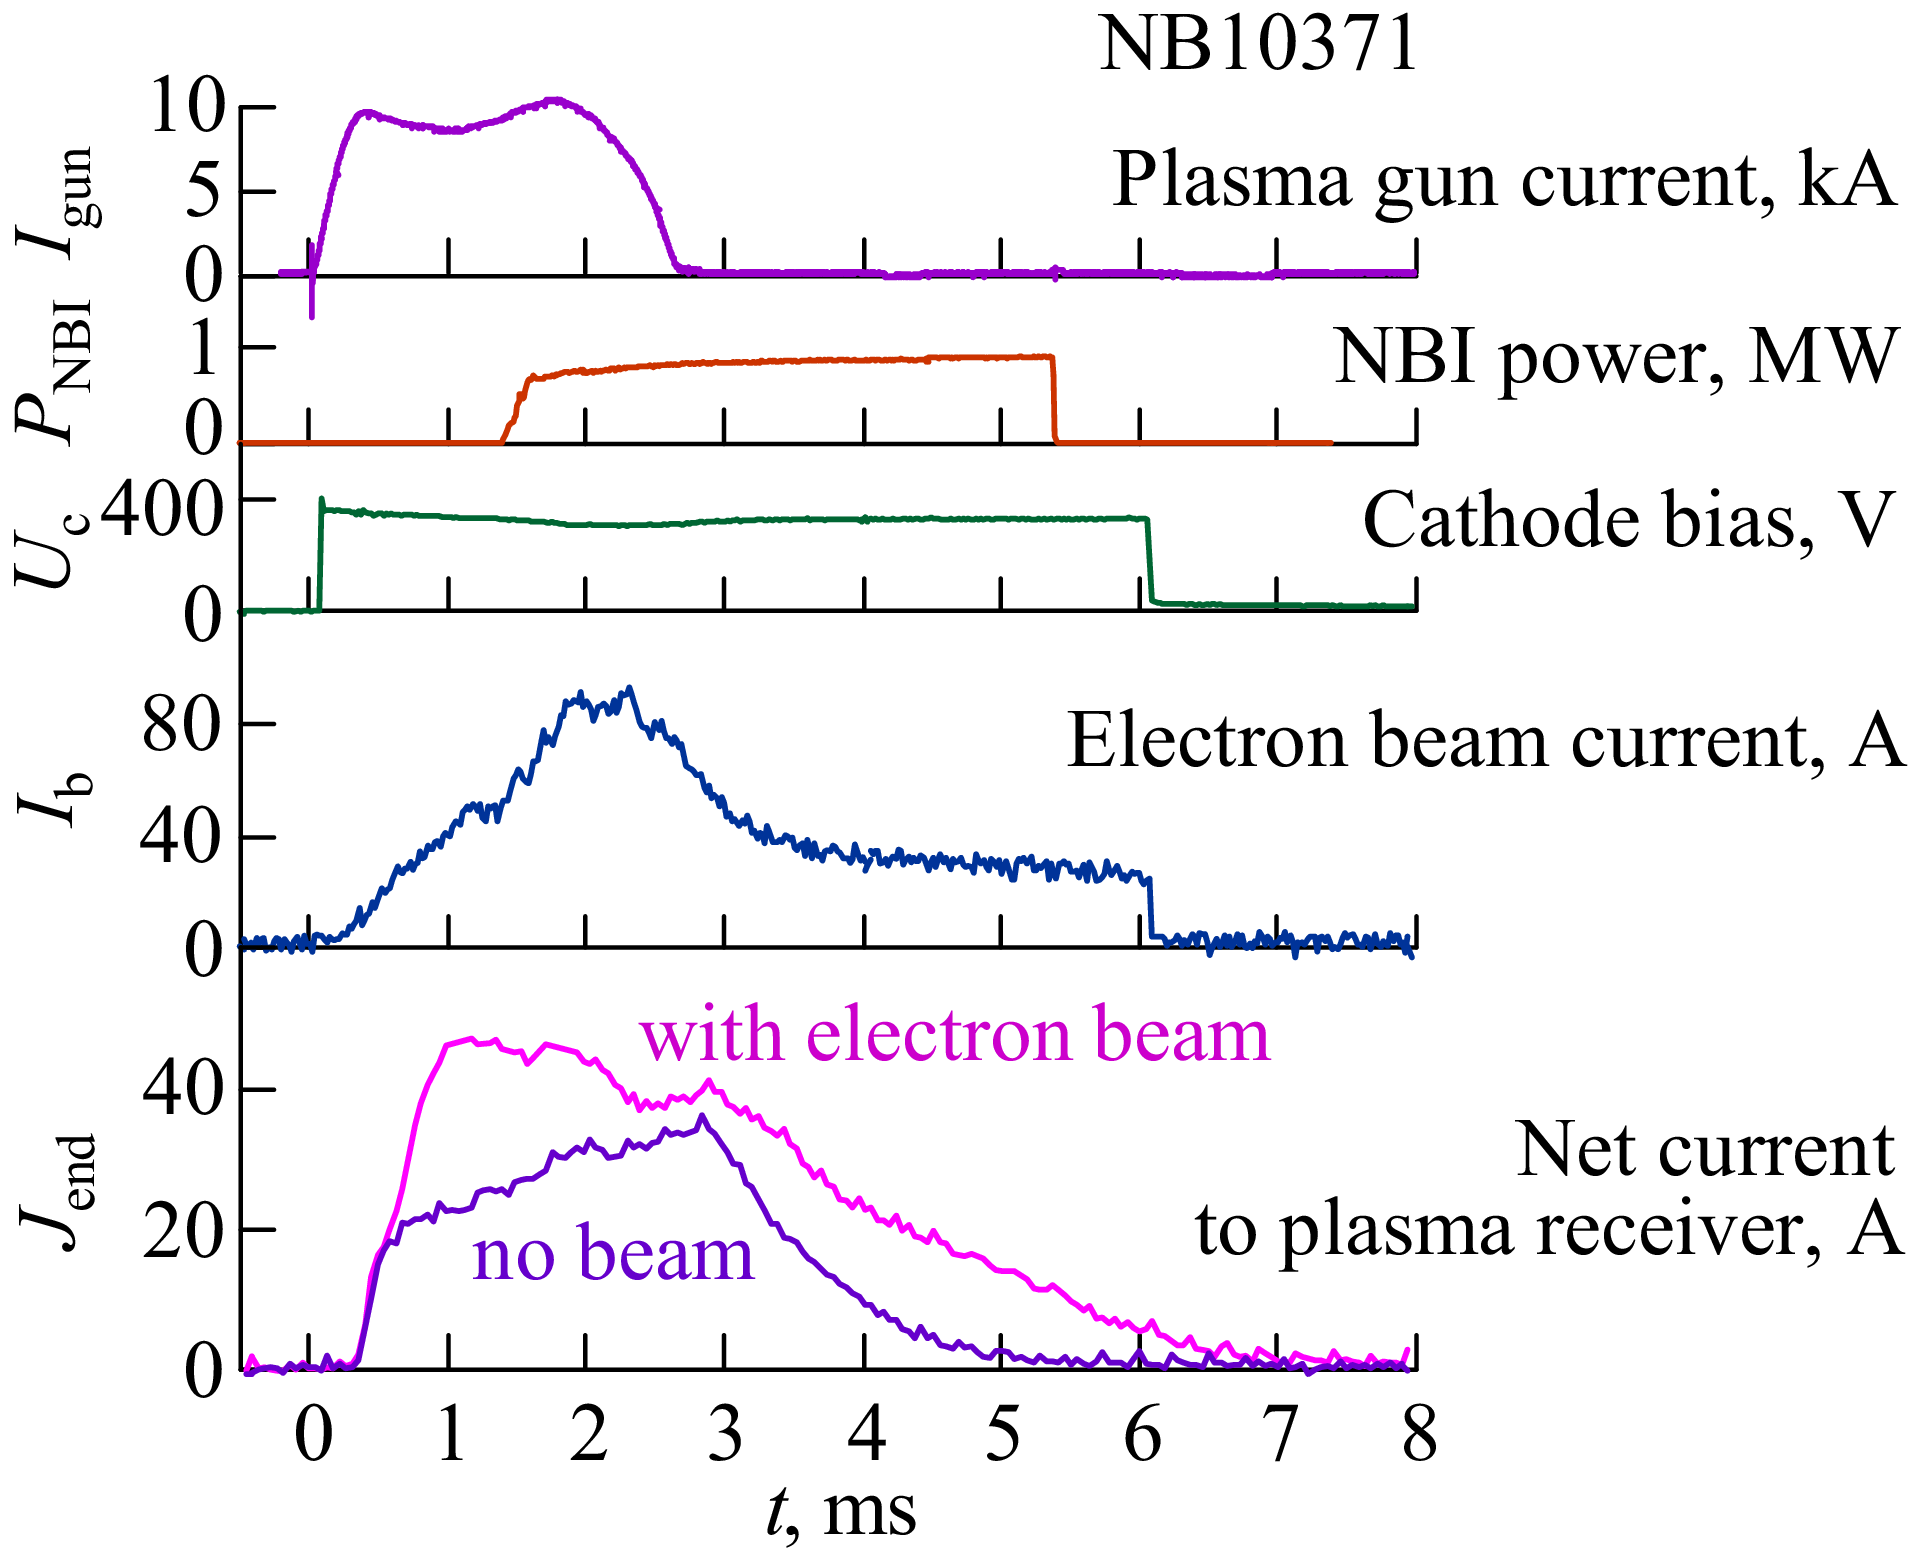
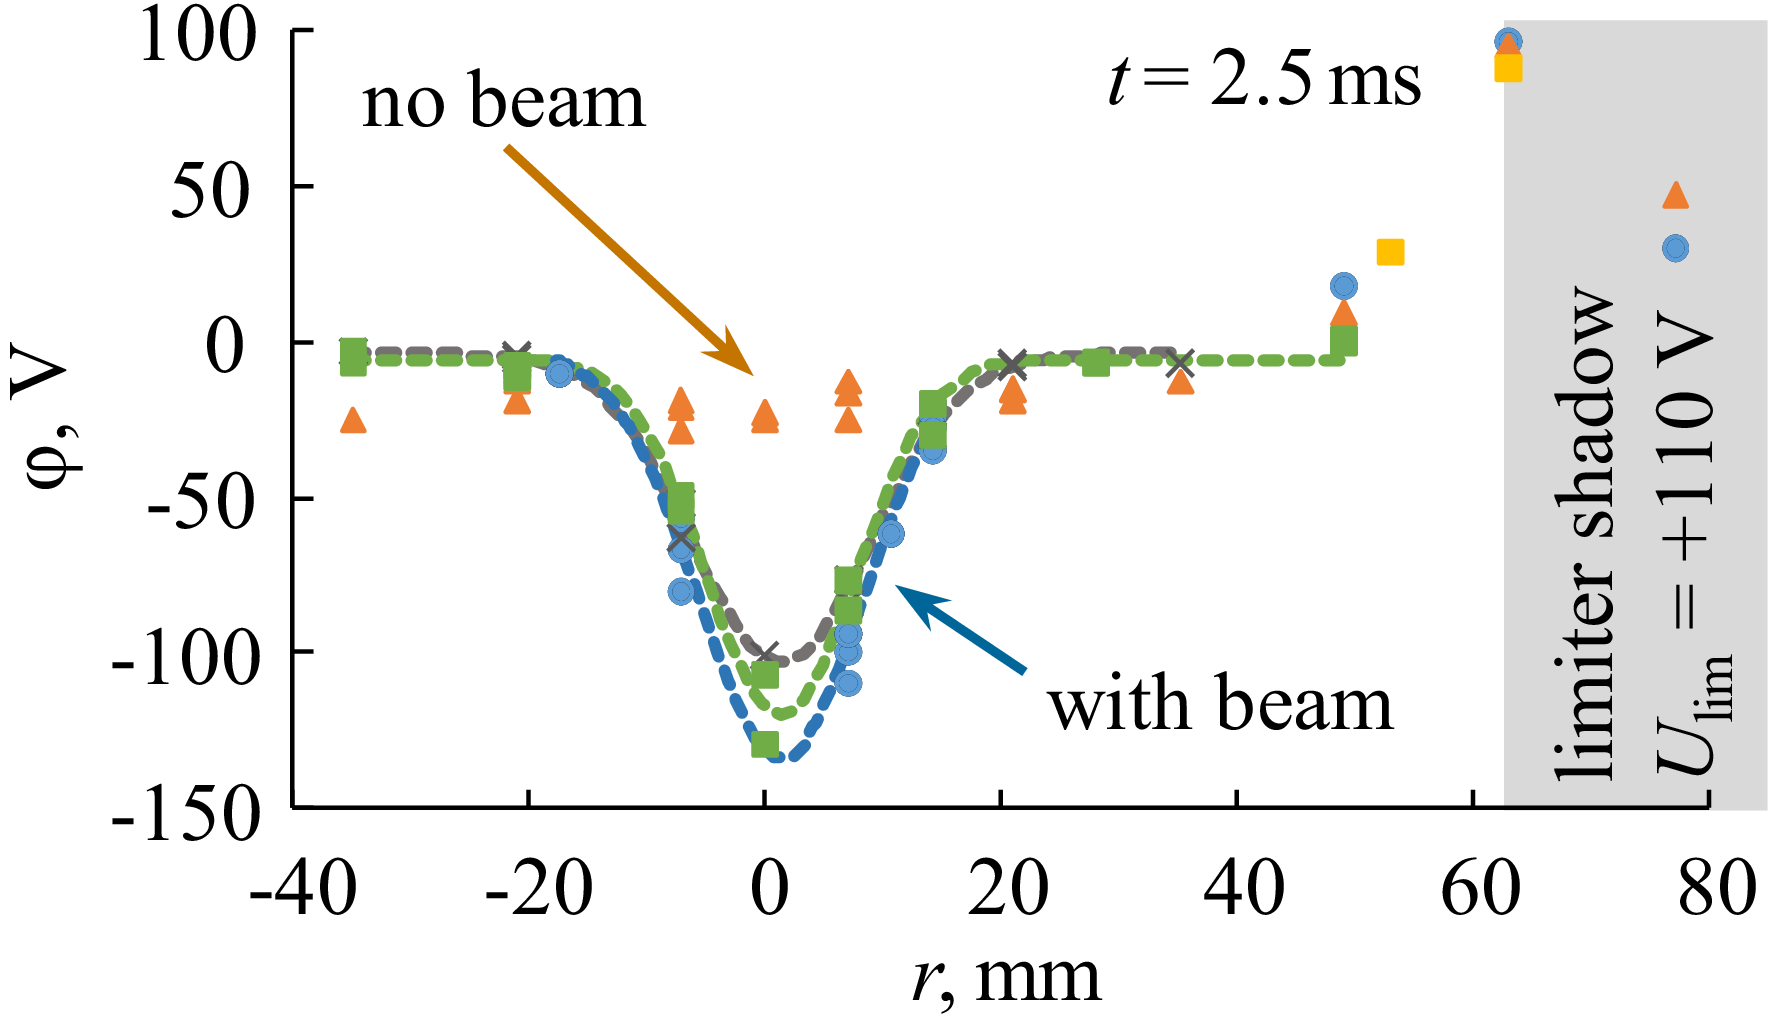
 t
t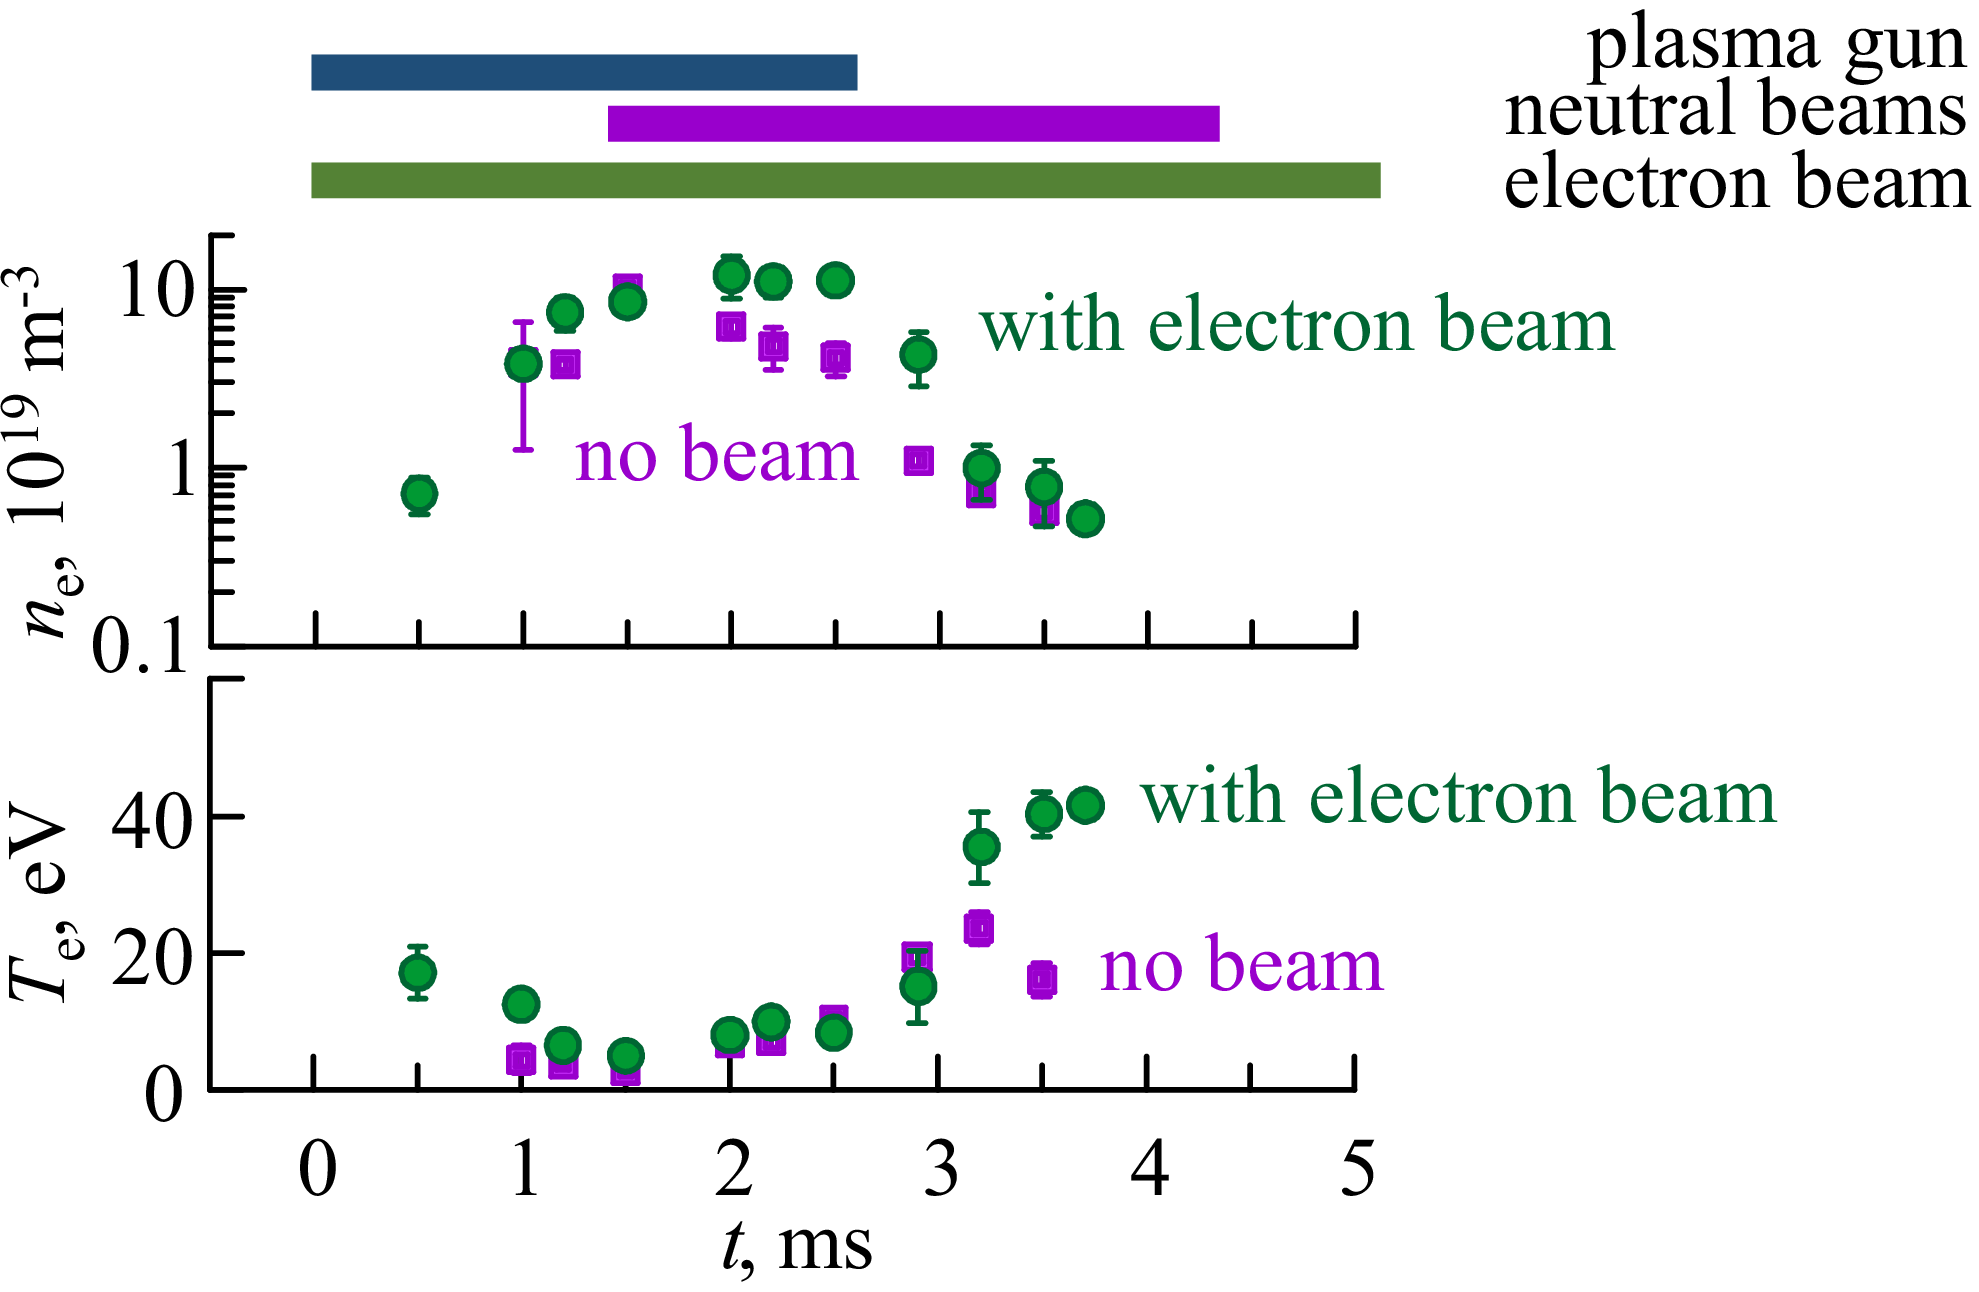
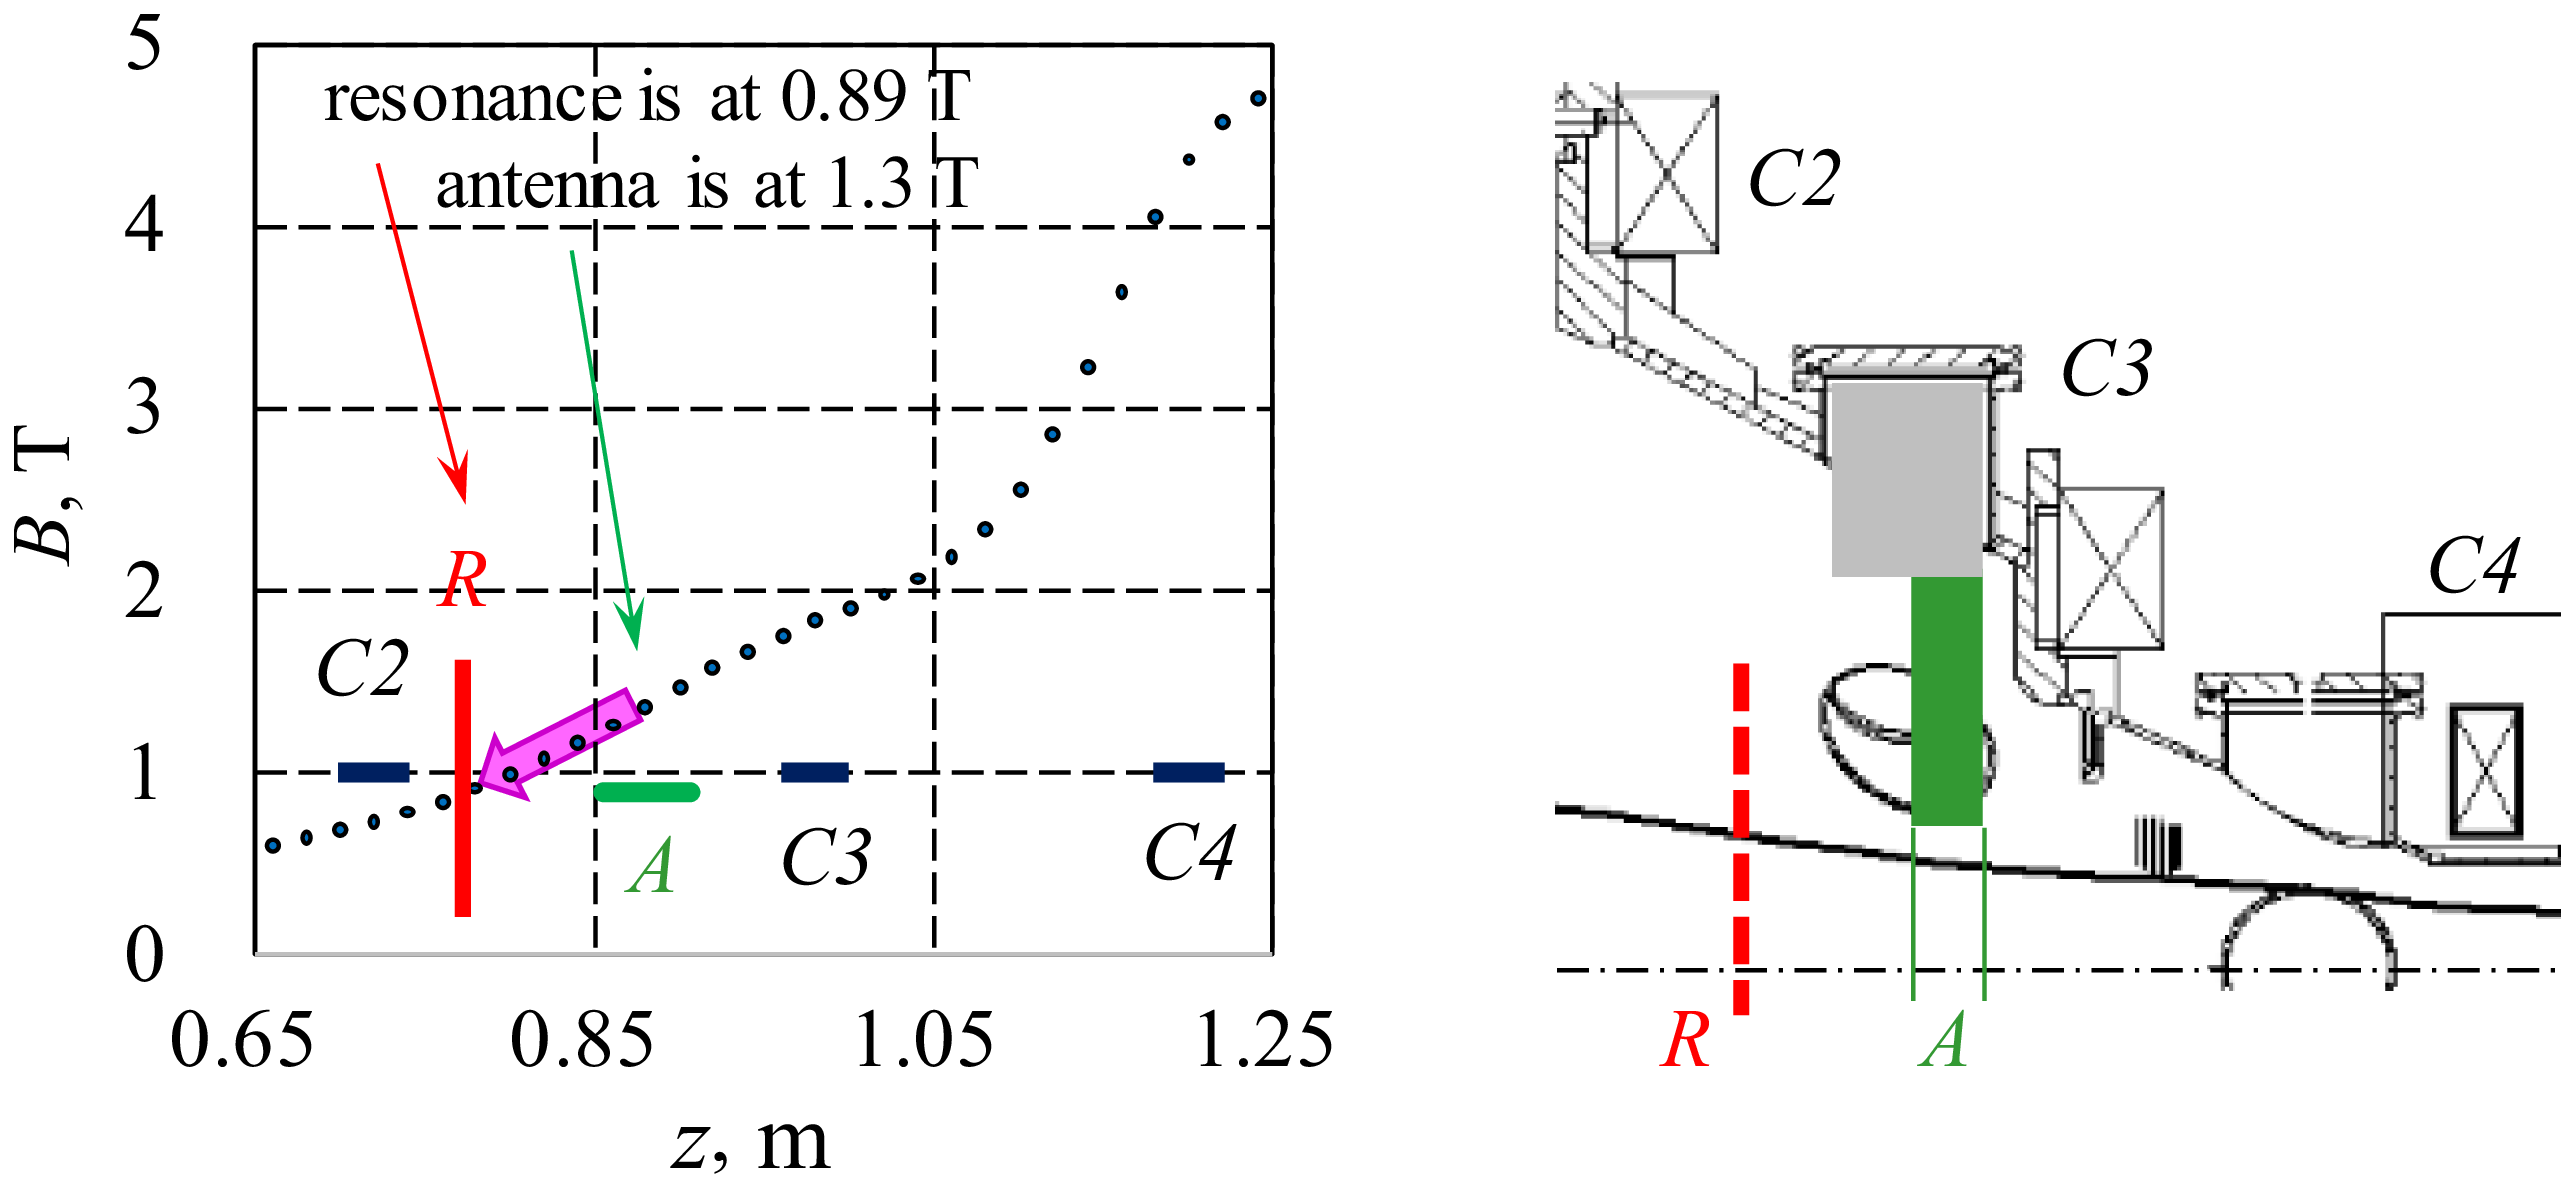
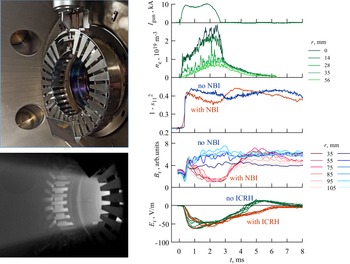
 PICRH
PICRH Igun
Igun ne
ne 1−s112
 Br
Br Er
Er
 Open access

