


1. Introduction
Much of the effort devoted to the study of adiabatic and hydrodynamically smooth-wall turbulence has focused on the characterization of velocity statistics within the so-called logarithmic or inertial sublayer (ISL). The attached eddy model (AEM), which is probably the most cited model for ISL turbulence, predicts that first- and second-order velocity statistics can be described as (Townsend Reference Townsend1976; Smits, McKeon & Marusic Reference Smits, McKeon and Marusic2011; Marusic & Monty Reference Marusic and Monty2019):
 \begin{equation} \bar{u}^+ = \frac{1}{\kappa}\log({z^+})+A;\quad \sigma_u^{2+} = A_u-B_u \log\left(\frac{z}{\delta}\right); \end{equation}
and, a less studied outcome,  $\sigma _w^{2+} = A_w^2$, where $u$ and $w$ are the longitudinal and wall-normal velocity components, respectively; $z$ is the wall-normal coordinate; $\sigma _u=\sqrt {\overline {u'^2}}$ and $\sigma _w=\sqrt {\overline {w'^2}}$ are the standard deviation of $u$ and $w$, respectively; primes identify fluctuations due to turbulence around the mean; the overline represents averaging over coordinates of statistical homogeneity; the plus index indicates classical inner scaling whereby velocities and lengths are normalized with the friction velocity $u_*$ and viscous length scale $\nu /u_*$, respectively, with $\nu$ being the kinematic viscosity of the fluid; $\delta$ is the outer length scale of the flow; $\kappa$, $A$,
$A$,  $A_u$, $A_w$, $B_u$ are coefficients that are thought to attain asymptotic constant values at very large Reynolds numbers $Re_{\tau }=u_*\delta /\nu$ (Smits et al. Reference Smits, McKeon and Marusic2011; Marusic et al. Reference Marusic, Monty, Hultmark and Smits2013; Stevens, Wilczek & Meneveau Reference Stevens, Wilczek and Meneveau2014).
The AEM has been extended to velocity moments of any order as well as cross-correlations between different velocity components thereby providing an expanded picture of ISL flow statistics (Woodcock & Marusic Reference Woodcock and Marusic2015). However, convincing empirical support for the aforementioned theoretical predictions is limited to the statistics of  $u$ (Smits et al. Reference Smits, McKeon and Marusic2011; Banerjee & Katul Reference Banerjee and Katul2013; Marusic et al. Reference Marusic, Monty, Hultmark and Smits2013; Meneveau & Marusic Reference Meneveau and Marusic2013; Huang & Katul Reference Huang and Katul2022). In contrast, the statistics of $w$ have been much less reported and investigated, partly because of the technical difficulties associated with accurately measuring $w$ in the near-wall region of laboratory flows at high $Re_{\tau }$. As a result, theoretical predictions of $w$-statistics have received mixed support from the literature (Zhao & Smits Reference Zhao and Smits2007; Morrill-Winter et al. Reference Morrill-Winter, Klewicki, Baidya and Marusic2015; Örlü et al. Reference Örlü, Fiorini, Segalini, Bellani, Talamelli and Alfredsson2017) and higher-order moments of $w'$ are rarely reported but with few notable exceptions (Flack, Schultz & Connelly Reference Flack, Schultz and Connelly2007; Schultz & Flack Reference Schultz and Flack2007; Manes, Poggi & Ridolfi Reference Manes, Poggi and Ridolfi2011; Heisel et al. Reference Heisel, Katul, Chamecki and Guala2020; Peruzzi et al. Reference Peruzzi, Poggi, Ridolfi and Manes2020). We argue that this overlook contributed to hiding a universal property of ISL turbulence, which is herein reported and discussed.
The aim of this paper is to demonstrate that the skewness of  $w'$,
$w'$,  $S_w=\overline {w'^3} /\sigma _w^3$, is a positive $z$-independent constant and robust to variations in $Re_\tau$ within the ISL. Moreover, a theoretical model that explains this observed behaviour and links $S_w$ to established turbulence constants is proposed, leading to satisfactory predictions. Finally, this paper demonstrates that the asymmetry in the probability density function of $w'$, as quantified by $S_w$, cannot be accounted for with gradient-diffusion representations routinely employed in meteorological and climate models (Mellor & Yamada Reference Mellor and Yamada1982). Rectifying this limitation is of significance because $S_w$ is recognized as a key feature of climate and meteorological modelling (Wyngaard Reference Wyngaard2010) impacting various atmospheric phenomena such as cloud formation (Bogenschutz et al. Reference Bogenschutz, Gettelman, Morrison, Larson, Schanen, Meyer and Craig2012; Huang et al. Reference Huang, Xiao, Wang and Fast2020; Li et al. Reference Li, Wang, Guo, Yang, Xu, Han and Sun2022) and dispersion processes (Bærentsen & Berkowicz Reference Bærentsen and Berkowicz1984; Luhar & Britter Reference Luhar and Britter1989; Wyngaard & Weil Reference Wyngaard and Weil1991; Maurizi & Tampieri Reference Maurizi and Tampieri1999). Neglecting $S_w$ affects models by underestimating the impact of the asymmetry between ejective eddy motion ( $w' > 0$, $u'< 0$) and sweeping eddy motion ( $w'<0$, $u'>0$), which is a widely accepted feature of the ISL.
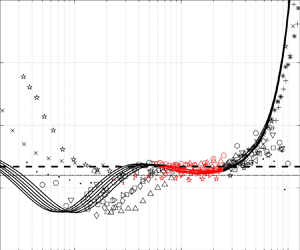
Figure 1 reports the variations of  $S_w$ with normalized wall-normal distance ( $z/\delta$) using data from direct numerical simulations (DNS) (Sillero, Jiménez & Moser Reference Sillero, Jiménez and Moser2013), laboratory experiments pertaining to flat plate turbulent boundary layers (TBLs) (Zimmerman Reference Zimmerman2019; Heisel et al. Reference Heisel, Katul, Chamecki and Guala2020), uniform (Poggi, Porporato & Ridolfi Reference Poggi, Porporato and Ridolfi2002) and weakly non-uniform open channel flows (Manes et al. Reference Manes, Poggi and Ridolfi2011; Peruzzi et al. Reference Peruzzi, Poggi, Ridolfi and Manes2020), pipe flows (Zimmerman Reference Zimmerman2019) and the atmospheric surface layer (ASL) (Priyadarshana & Klewicki Reference Priyadarshana and Klewicki2004), whereby accurate measurements of $w$ are available. This set of data covers an extensive range of $Re_{\tau }$ spanning from $8\times 10^2$ to approx $10^6$ (table 1). A reference value of $S_w=0.1$ is added to the figure as often reported for ASLs in adiabatic conditions across multiple heights and for various surface covers (Chiba Reference Chiba1978). A region of constant $S_w$ weakly varying between 0.1 and 0.16 (here weakly means that variations are much smaller than those displayed by $S_w$ over the entire flow domain) is evident in all profiles within the range $2.6\sqrt {Re_\tau }\nu /u_*$ up to $0.15\unicode{x2013}0.25\delta$, which is often associated with the ISL (Zhou & Klewicki Reference Zhou and Klewicki2015; Örlü et al. Reference Örlü, Segalini, Klewicki and Alfredsson2016, Reference Örlü, Fiorini, Segalini, Bellani, Talamelli and Alfredsson2017). This finding is rather remarkable given the large differences in $Re_{\tau }$, measurement techniques and experimental facilities used. In what follows, a theoretical model that predicts and explains such a behaviour is provided.
Variation of the vertical-velocity skewness  $S_w$ with normalized wall-normal distance $z/\delta$ from open channel flow (a), wind tunnel, ASL and pipe flow (b) and DNS (c). The dashed line is $S_w=0.16$ and the dotted line is $S_w=0.10$. Data are summarized in table 1. Red symbols and lines identify the ISL range. For HL1 and HL2, near-wall measurements are not reported due to spatial resolution limitations of the x-probe employed in the experiments (Heisel et al. Reference Heisel, Katul, Chamecki and Guala2020).

Overview of smooth-wall boundary-layer experiments (OC, open channel/flumes; WT, wind tunnel; PF, pipe flows; ASL, atmospheric surface layer) and DNS (six cases ranging between  $Re_\tau =1307$ and $Re_\tau =2000$) in figure 1(c). The $Re_{\tau }=\delta u_*/\nu$ is the friction Reynolds number, $B_u$ and $A_w$ were computed from data using AEM. For the DNS, the highest and lowest $Re_{\tau }$ are shown given the small variability in $B_u$ (0.85–0.86) and $A_w$ (1.15–1.17). The computed $S_w$ using (2.11) is also presented.

2. Theory
To explain the observed behaviour of  $S_w$, a stationary and planar homogeneous incompressible flow in the absence of subsidence is considered for $\overline {w'^3}$. For these conditions, the model can be derived from the Reynolds-averaged Navier–Stokes equations and is given as (Canuto et al. Reference Canuto, Minotti, Ronchi, Ypma and Zeman1994; Zeman & Lumley Reference Zeman and Lumley1976)
 \begin{equation} \frac{\partial
\overline{w'^3}}{\partial t}=0=\overbrace{3
\sigma_w^2\frac{\partial \sigma_w^2}{\partial
z}}^{\textit{Source/sink}}\overbrace{-\frac{\partial
\overline{w'w'^3}}{\partial z}}^{\textit{Turbulent
transport}}\underbrace{-3\left( \overline{w'w'
\frac{\partial p'}{\partial
z}}\right)}_{\textit{Pressure-velocity destruction}}
\underbrace{-2\nu \left( 3 \overline{w' \frac{\partial
w'}{\partial x_i} \frac{\partial w'}{\partial
x_i}}\right)}_{\textit{Viscous destruction}},
\end{equation}
\begin{equation} \frac{\partial
\overline{w'^3}}{\partial t}=0=\overbrace{3
\sigma_w^2\frac{\partial \sigma_w^2}{\partial
z}}^{\textit{Source/sink}}\overbrace{-\frac{\partial
\overline{w'w'^3}}{\partial z}}^{\textit{Turbulent
transport}}\underbrace{-3\left( \overline{w'w'
\frac{\partial p'}{\partial
z}}\right)}_{\textit{Pressure-velocity destruction}}
\underbrace{-2\nu \left( 3 \overline{w' \frac{\partial
w'}{\partial x_i} \frac{\partial w'}{\partial
x_i}}\right)}_{\textit{Viscous destruction}},
\end{equation}
where  $t$ is time, $p'$ is the pressure deviation from the mean or hydrostatic state normalized by a constant fluid density $\rho$ and the repeated index $i$ in the viscous term denotes summation over the spatial coordinates ( $[x_1,x_2,x_3]=[x,y,z]$). The first two terms on the right-hand side of (2.1) (i.e. those highlighted by overbraces) arise from inertial effects or convective acceleration, the third and fourth terms (i.e. those highlighted by underbraces) arise due to interactions between $w'w'$ and the forces acting on a fluid element ( $p'$ and viscous stresses). A quasi-normal approximation for the fourth moment is used (André et al. Reference André, De Moor, Lacarrere and Du Vachat1976) so that the flatness factor $F_w=\overline {w'^4}/(\sigma _w)^4=3+a$ and the overall inertial term simplifies to
 \begin{equation} {-}\frac{\partial \overline{w'^4}}{\partial z}+3 \sigma_w^2\frac{\partial \sigma_w^2}{\partial z}={-}(3+2 a) \sigma_w^2 \frac{\partial\sigma_w^2}{\partial z}, \end{equation}
where  $a\neq 0$ allows for deviations from Gaussian tails ( $a=0$ recovers a Gaussian flatness factor). Usage of a quasi-Gaussian approximation to close a fourth (and even) moment budget makes no statement on the asymmetry (or odd moments) of the $w'$ probability density function, only that large-scale intermittency is near-Gaussian, a finding well supported in the literature (Meneveau Reference Meneveau1991) and many phenomenological approaches (Woodcock & Marusic Reference Woodcock and Marusic2015). Models for the pressure-velocity and viscous destruction terms are now needed to integrate equation (2.1). A return-to-isotropy (or Rotta) model (Rotta Reference Rotta1951) given by
 \begin{equation} {-}2\overline{w'\frac{\partial p'}{\partial z}}=\frac{C_R}{\tau}\left(\frac{\bar{q}}{3} -\sigma_w^2 \right), \end{equation}
may be used as the basis to derive an expression for the pressure-velocity destruction term in (2.1) where  $q=u'u'+v'v'+w'w'$ is twice the instantaneous turbulent kinetic energy (TKE), $\bar {q}=2K$, $K$ is the averaged TKE, $v'$ is the lateral turbulent velocity, and $C_R=1.8$ is a well-established constant, the Rotta constant (Bou-Zeid et al. Reference Bou-Zeid, Gao, Ansorge and Katul2018). The constant $C_R$ relates the so-called relaxation time $\tau =\bar {q}/\bar {\epsilon }$ to the time it takes for isotropy to be attained at the finest scales, where $\bar {\epsilon }$ is the mean TKE dissipation rate. Inspired by the Rotta model we propose that the pressure-velocity interaction term appearing in (2.1) can be expressed as
 \begin{equation} {-}3\left( \overline{w'w' \frac{\partial p'}{\partial z}}\right)=\frac{3}{2}\frac{C_R}{\tau_s}\left(\frac{\overline{w'q}}{3} -\overline{w'w'^2} \right), \end{equation}
where  $\tau _s$ is another decorrelation time that differs from $\tau$. While expected to be small relative to the pressure-velocity interaction term, the viscous destruction contribution is herein retained and represented as (Zeman & Lumley Reference Zeman and Lumley1976)
 \begin{equation} {-}2 \nu \left( 3 \overline{w' \frac{\partial w'}{\partial x_i} \frac{\partial w'}{\partial x_i}}\right)={-}2 \overline{\epsilon' w'}={-}c_2 \frac{\overline{w'q}}{\tau_s}, \end{equation}
where  $c_2$ is a similarity constant, and $\epsilon '\sim q/\tau _s$ is the fluctuating dissipation rate around $\bar {\epsilon }$. Inserting these approximations into (2.1) yields
 \begin{equation} \overline{w'^3}={-}\frac{2}{3}\frac{(3+2 a)\tau_s \sigma_w^2}{C_R}\frac{\partial \sigma_w^2}{\partial z}+\overline{w'q} \left( \frac{1}{3} - \frac{2 c_2}{3 C_R}\right). \end{equation}
A model for  $\overline {w'q}$ is further needed to infer $S_w$. To arrive at this model, the $K$ budget for the same flow conditions leading to (2.1) are employed. When mechanical production is balanced by $\bar {\epsilon }$ as common in the ISL, the $K$ budget leads to two outcomes (Lopez & García Reference Lopez and García1999):
 \begin{equation} u_*^2\frac{\partial \bar{u}}{\partial z}-\bar{\epsilon}=0; \quad -\frac{1}{2}\frac{\partial \overline{w'q}}{\partial z}=0. \end{equation}
The height-independence of  $\overline {w'q}$ is suggestive that it must be controlled by local conditions and a down-gradient approximation is justified given by (Lopez & García Reference Lopez and García1999)
 \begin{equation} {-}\frac{1}{2}\overline{w'q}=\kappa z u_* \frac{\partial K}{\partial z}. \end{equation}
The model in (2.8) has received experimental support even for rough-wall TBLs and across a wide range of Reynolds numbers and surface roughness values (Lopez & García Reference Lopez and García1999). Noting that  $K \approx \sigma _u^2$ yields
 \begin{align} \overline{w'^3} ={-}\frac{2}{3}\left[K_{t,w}\frac{\partial \sigma_w^2}{\partial z}+ K_{t,u}\frac{\partial \sigma_u^2}{\partial z}\right];\quad K_{t,w}=\frac{(3+2 a)\tau_s \sigma_w^2}{C_R}; \quad K_{t,u}=\kappa z u_* \left( 1 - \frac{2 c_2}{C_R}\right), \end{align}
where  $K_{t,w}$ and $K_{t,u}$ are eddy viscosity terms. These two eddy viscosity values become comparable in magnitude when setting $\tau _s=\kappa z/u_*$ (i.e. following classical ISL scaling) and $C_R=1.8$ – its accepted value (Bou-Zeid et al. Reference Bou-Zeid, Gao, Ansorge and Katul2018) as expected in the ISL. To determine $\partial {\sigma _w^2}/{\partial z}$, the mean vertical-velocity equation is considered for the same idealized flow conditions as (2.1). This consideration results in
 \begin{equation} \frac{\partial \sigma_w^2}{\partial z}={-}\left(\frac{1}{\rho}\right)\left(\frac{\partial \bar{P}}{\partial z}\right)-g, \end{equation}
where  $g$ is the gravitational acceleration. When $\bar {P}=-\rho g z$ (i.e. hydrostatic), $\partial \sigma _w^2/\partial z=0$ or $A_w$ is constant in $z$ within the ISL. That is, the AEM requires $\bar {P}$ to be hydrostatic. However, the AEM precludes $\partial \sigma _u^2/\partial z=0$ in the ISL. In fact, the AEM predicts $\partial \sigma _u^2/\partial z=-u_*^2 B_u/z$ when $Re_{\tau }$ is very large as expected in the ISL of an adiabatic atmosphere. Inserting this estimate into (2.9a–c), setting $u_*=\sigma _w/A_w$ and momentarily ignoring $\partial {\sigma _w^2}/{\partial z}$ relative to $\partial \sigma _u^2/\partial z$ as a simplification consistent with the AEM, leads to
 \begin{equation} S_w=\frac{\overline{w'^3}}{\sigma_w^3}=\frac{2}{3} \left( 1 - \frac{2 c_2}{C_R}\right) \frac{\kappa B_u}{A_w^3}. \end{equation}
This equation is the sought outcome. The term  $2 c_2/C_R$ reflects the relative importance of the pressure-velocity to viscous destruction terms. Pressure-velocity destruction effects are far more efficient than viscous effects supporting the argument that $2 c_2/C_R\ll 1$ at very high $Re_{\tau }$ (Katul et al. Reference Katul, Porporato, Manes and Meneveau2013) such as the atmosphere. This implies that the numerical value of $S_w$, as obtained from (2.11), depends on three well-established phenomenological constants, namely $\kappa$, $A_w$ and $B_u$ (Banerjee & Katul Reference Banerjee and Katul2013; Marusic & Monty Reference Marusic and Monty2019; Huang & Katul Reference Huang and Katul2022), which, in turn, may depend weakly on $Re_{\tau }$ and the flow type. Equation (2.11) is also insensitive to the choices made for $\tau _s$, because the AEM requires $\partial \sigma _w^2/\partial z=0$.
3. Discussion and conclusion
From the  $\overline {w'^3}$ local budget for a planar homogeneous and incompressible flow without subsidence, and upon assuming a (i) quasi-normal approximation for the fourth moment, (ii) return-to-isotropy (or Rotta) model for pressure-velocity and viscous destruction, (iii) down-gradient approximation for the vertical TKE fluxes, and (iv) adopting the AEM for the second moments, a model (2.11) for $S_w$ in the ISL was recovered. Equation (2.11) demonstrates two inter-related aspects about $S_w$ in the ISL: (i) why $S_w$ is positive and constant with $z$, and (ii) why conventional gradient-diffusion approximations fail to predict $\overline {w'^3}$ from $\partial \sigma _w^2/\partial z$.
Regarding the first, (2.11) predicts that  $S_w>0$ consistent with the paradigm that ejective eddy motions ( $w'>0, u'<0$) are more significant in momentum transfer than sweeping motions ( $w'<0, u'>0$) within the ISL. This assertion is supported by numerous experiments and simulations (Nakagawa & Nezu Reference Nakagawa and Nezu1977; Raupach Reference Raupach1981; Heisel et al. Reference Heisel, Katul, Chamecki and Guala2020) and adds further confidence in the physics associated with the derivation of (2.11). Moreover, values of the constants in (2.11) for flat plate TBLs at $Re_{\tau }\to \infty$ correspond to $\kappa =0.39$, $A_w=1.33$ and $B_u=1.26$ (Smits et al. Reference Smits, McKeon and Marusic2011; Huang & Katul Reference Huang and Katul2022). Upon further setting $c_2=0.1$ and $C_R=1.8$ (conventional values) leads to $S_w=0.12$. This estimate compares well with $S_w=0.1$ reported for the ISL in the adiabatic atmosphere (Chiba Reference Chiba1978; Barskov et al. Reference Barskov, Chechin, Drozd, Artamonov, Pashkin, Gavrikov, Varentsov, Stepanenko and Repina2023) and, in general, with all the $S_w$ data pertaining to very high $Re_{\tau }$ reported in figure 1 (i.e. ZM1–3 and PK). Note that for datasets pertaining to the low to moderate $Re_{\tau }$ (i.e. MN, DNS, HL1–2, PG1–3 and PR1–3), (2.11) cannot be used to estimate $S_w$ using the AEM and the associated asymptotic values of $A_w$ and $B_u$. However, figure 1 shows that these flows attain similar (i.e. slightly higher) and reasonably $z$-independent values of $S_w$. To explain this behaviour, it is necessary to step back to (2.9a–c). This formulation does not contain assumptions about the second moments (i.e. the AEM) and, once scaled with $\sigma _w^3$, represents a more general model for $S_w$. The only limitation is the need to provide reliable estimates of $\partial \sigma _w / \partial z$ and $\partial \sigma _u / \partial z$, which are here obtained from DNS data. Figure 2 indicates that, for most of the ISL, the first term on the right-hand side of (2.9a) is an order of magnitude smaller than the second and can be discarded as predicted by the AEM and advocated in the proposed theory. Predictions of $S_w$ obtained from the second term are excellent in the ISL and resemble the observed $z$-independent behaviour. Besides providing further confidence on the proposed theory, this result indicates that, since $K_{t,u}$ is directly proportional to $z$,
$z$,  $\partial \sigma _u^2/\partial z$ must overall scale as $\sim 1/z$, as predicted by the AEM. Hence, we argue that the AEM represents a reasonable approximation provided $B_u$ and $A_w$ are adjusted to accommodate for low $Re_{\tau }$ effects. As shown in figure 3, this is the case for DNS and all laboratory data.
(a) Variation of the vertical-velocity skewness  $S_w$ with normalized wall-normal distance $z/\delta$ from DNS Sillero et al. (Reference Sillero, Jiménez and Moser2013); (b) $S_{w,m}$ is the modelled skewness using the first term (blue line) and second term (black line) on the right-hand side of (2.9a–c) both scaled with $\sigma _w^3$. In both panels, red lines identify the ISL range. The dashed line is $S_w=0.16$ and the dotted line is $S_w=0.10$.

(a) Difference between  $\sigma _u^{2+}$ and estimations obtained from the AEM, $\sigma _{u,m}^{2+}=A_u-B_u \log (z/\delta )$ using values of $A_u$ and $B_u$ obtained from regression of data within the ISL range (identified by red symbols and lines) vs wall-normal distance $z/\delta$; (b) non-dimensional vertical-velocity variance $\sigma _w^2$ normalized with $A_w$ obtained from data fitting within the ISL (identified by red symbols and lines) vs wall-normal distance $z/\delta$. Data sources and references are summarized in table 1.

For the DNS, appropriate values of  $A_w(=1.15\unicode{x2013}1.17)$ and $B_u(=0.85\unicode{x2013}0.86)$ were estimated by fitting the AEM to the available data for all available $Re_{\tau }$. The constant $\kappa =0.39$ was assumed as reported in the literature (Marusic et al. Reference Marusic, Monty, Hultmark and Smits2013; Peruzzi et al. Reference Peruzzi, Poggi, Ridolfi and Manes2020). When inserting these choices of $A_w$ and $B_u$ from the DNS into (2.11), the computed $S_w=0.13$, which is close to reported values in figure 1(c). The same approach was used for all laboratory studies. When combining all the runs together (wind tunnel, pipe flow and open channel flow), ensemble-averaged $A_w=1.04\pm 0.12$ and the ensemble-averaged $B_u=0.78\pm 0.23$ were obtained across runs within an experiment and across experiments. These values result in an ensemble-averaged $S_w=0.17\pm 0.07$ and agree with the measurements reported in figure 1.
This analysis and figure 1 suggest that  $S_w$ for DNS and experiments is higher than $0.12$ estimated for $Re_{\tau }\to \infty$. This is probably because of deviations of $B_u$ and $A_w$ from their asymptotic values. The effects of such deviations on $S_w$ are, however, modest because, although values of $A_w$ and $B_u$ are significantly lower than their counterparts at $Re_{\tau }\to \infty$ (i.e. $A_w=1.33$ and $B_u=1.26$, see table 1), (2.11) indicates that $S_w$ is dictated by $B_u/A_w^3$, meaning the effect of such deviations are in good part compensated.
Additionally, a separate investigation into the vertical extent of the constant  $S_w$ region was conducted using laboratory data. This was achieved by selecting data points varying within a 5 % range around the $S_w$ mode. The analysis revealed that the constant $S_w$ region extends from $1.13\unicode{x2013}2.51 \sqrt {Re_{\tau }}\nu /u_*$ to $0.16\unicode{x2013}0.32\delta$, which is very similar to the range that is commonly employed to identify the ISL using other velocity statistics (i.e. from $2.6\sqrt {Re_{\tau }} \nu /u_*$ to $0.15-0.25\delta$) (Zhou & Klewicki Reference Zhou and Klewicki2015; Örlü et al. Reference Örlü, Segalini, Klewicki and Alfredsson2016, Reference Örlü, Fiorini, Segalini, Bellani, Talamelli and Alfredsson2017). This analysis provides further evidence of the operational interlink between the constant $S_w$ region and the ISL.
Regarding the second feature of (2.11), (2.9a–c) offers an explanation as to why conventional down-gradient closure models with eddy viscosity  $K_{t}\propto \bar {q} l_m$ ( $l_m$ is a ‘master’ mixing length) expressed in general index notation ( $[u'_1, u'_2, u'_3]=[u',v',w']$) as (Launder, Reece & Rodi Reference Launder, Reece and Rodi1975)
 \begin{equation} \overline{u_i'u_j'u_k'}={-}K_{t} \left[\frac{\partial\overline{u_i'u_j'}}{\partial x_k}+\frac{\partial\overline{u_i'u_k'}}{\partial x_j}+\frac{\partial\overline{u_j'u_k'}}{\partial x_i}\right] \end{equation}
spectacularly fail when  $i=j=k=3$ and when $A_w$ is approximately constant in the ISL as in the AEM. Yet, the derived equation here also offers a rectification based on the AEM. This rectification accommodates the role of finite $\partial \sigma _u^2/\partial z$ on $\overline {w'^3}$ that cannot arise from (3.1). In conclusion, this paper demonstrates that, within the ISL of turbulent and adiabatic smooth-wall flows, $S_w$ attains $z$-independent values that are predictable from well-known turbulence constants relating to the AEM. This behaviour is reported for a variety of different wall flows and is fairly independent of variations in $Re_{\tau }$, hence universal and robust.
Supplementary material
The data that support the findings of this study are available from the corresponding author upon reasonable request.
Acknowledgements
The authors thank J.C. Klewicki for providing the ZM and PK datasets.
Funding
E.B. acknowledges the support from Politecnico di Torino for visiting Duke University. G.K. acknowledges support from the U.S. National Science Foundation (NSF-AGS-2028633) and the U.S. Department of Energy (DE-SC0022072). D.V. and C.M. acknowledge the European Union's Horizon 2020 research and innovation programme under the Marie Sklodowska-Curie grant agreement no. 101022685 (SHIEELD). D.P. acknowledges support from Fondo europeo di sviluppo regionale (FESR) for project Bacini Ecologicamente sostenibili e sicuri, concepiti per l'adattamento ai Cambiamenti ClimAtici (BECCA) in the context of Alpi Latine COoperazione TRAnsfrontaliera (ALCOTRA) and project Nord Ovest Digitale e Sostenibile – Digital innovation toward sustainable mountain (Nodes – 4).
Declaration of interests
The authors report no conflict of interest.


 Open access