Hypertension (HTN) is a common chronic condition that refers to a condition in which blood pressure (BP) in the arteries rises abnormally(Reference Liu, Bu and Wei1). In terms of morbidity and the leading cause of cardiovascular adverse events risk, HTN is a major global public health challenge(Reference Hou, Lv and Li2). The results of a recent study looking at the prevalence of high BP worldwide show that from 1990 to 2019, the number of people aged 30–79 with high BP doubled, from 648 million to 1·278 billion(Reference Zhou, Carrillo-Larco and Danaei3). Elevated BP remains the leading cause of death globally, with 10·8 million patients dying from high systolic blood pressure (SBP) in 2019, accounting for 19·2 % of all deaths in 2019(Reference Mills, Stefanescu and He4,Reference Murray, Aravkin and Zheng5) . Worldwide, one in five adults has HTN, according to the WHO(Reference Whelton, Carey and Mancia6). HTN is one of the major risk factors for CVD, which also is especially harmful to the kidney, blood vessels and brain.
Triglyceride–glucose (TyG) index is a reliable indicator of insulin resistance (IR) based on the logarithmic product of fasting Triglyceride and fasting glucose(Reference Guerrero-Romero, Simental-Mendía and González-Ortiz7). As compared with plasma insulin in the homeostasis model assessment of IR, the TyG index is more convenient and accessible in clinical practice(Reference Simental-Mendía, Rodríguez-Morán and Guerrero-Romero8,Reference Khan, Sobia and Niazi9) . The prevalence of IR in the USA is quite high, especially among adults. IR is often closely linked to factors such as obesity, lack of exercise, poor eating habits and genetic factors. According to the Centers for Disease Control and Prevention (CDC), about one-third of American adults are considered IR. The condition is also increasing in children and adolescents, partly due to the increasing prevalence of obesity in this age group(Reference Hill, Yang and Zhang10). Additionally, Vitamin D deficiency or deficiency is common in the USA, especially in the winter or in areas with less sunlight. According to past studies and surveys, about 40–60 % of the US population has varying levels of vitamin D deficiency or deficiency. The condition is more prevalent among certain populations, such as blacks, Latinos and the elderly(Reference Han, Forno and Celedón11). Previous research has shown that the TyG index elevation has been associated with a variety of diseases, such as arterial stiffness, heart failure, coronary artery stenosis, cardiovascular and all-cause mortality(Reference Zhou, Liu and Kenneth12–Reference Thai, Tien and Van Minh15). Vitamin D is a kind of fat-soluble vitamin that is acquired by sunlight exposure or ingestion and primarily regulates Ca and phosphate metabolism. 25-hydroxyvitamin D (25(OH)D) is the primary storage in the body(Reference Holick16,Reference Li, Yi and Han17) . Previous studies have shown that low serum vitamin D levels have been associated with elevated risk of micro-and macrovascular complications, poor outcomes in patients with heart failure and increased all-cause and cardiovascular mortality(Reference Dobnig, Pilz and Scharnagl18–Reference Wan, Guo and Pan20). Research indicated that HTN and IR interact to increase the risk of diabetes(Reference Wang, Yang and Li21). In addition, other studies have shown that drinking orange juice rich in vitamin D3 and probiotics can improve insulin sensitivity and reduce cardiometabolic risk(Reference Papakonstantinou, Zacharodimos and Georgiopoulos22). Therefore, there may be a link between vitamin D3, IR and high BP. However, the association between the TyG index and vitamin D levels and the prevalence of HTN has not been clearly explained. According to our hypothesis, serum 25(OH)D regulates the TyG index, thereby reducing the influence of the TyG index on the prevalence of HTN. Therefore, in this study, we used the National Health and Nutrition Examination Survey (NHANES) database to explore for the first time the relationship between TyG index, serum 25(OH)D and prevalence of HTN. Additionally, the mediation effect of serum 25(OH)D on the TyG index in the prevalence of HTN was further explored for the first time.
Material and methods
Study population
The National Health and Nutrition Examination Survey (NHANES) is a population-based cross-sectional survey designed to collect information on the health and nutrition status of adults and children in the USA(Reference Xiao, Wang and Zuo23). The people evaluated in this study were the general population in the American. All NHANES protocols are approved by the NCHS Ethics Review Committee prior to data collection(Reference Xiao, Wang and Zhang24). The NHANES website provides detailed information about the survey design, methodology and data (https://www.cdc.gov/nchs/nhanes/).
Covariates
The following covariates were taken into account in the analysis: demographic data (sex (man/women), age, marital status (have a partner/no partner/unmarried), race/ethnicity (Mexican American, other Hispanic American, non-Hispanic black, non-Hispanic white and other races), family poverty–income ratio, smoking status (never/former/now), education level (less than high school/high school/more than high school) and alcohol consumption (never/former/mild/moderate/heavy)), physical activities (work and recreational activity), comorbidity data (the history of CHD, diabetes mellitus (DM), congestive heart failure, angina pectoris, coronary kidney disease, heart attack and hyperlipidaemia), anthropometric data (BMI and waist circumference), dietary data (mean energy intake, mean Na intake and mean potassium intake) and laboratory data (fast blood glucose (FBG), potassium, uric acid (UA), HDL-cholesterol, blood urea nitrogen, Na, glycosylated Hb (HbA1c), total cholesterol, Hb, potassium, triglyceride, Na, serum creatinine and estimated glomerular filtration rate(Reference Ye, Li and Liu25–Reference Zhang, Wang and Tang28). Family poverty–income ratio refers to the ratio of family income to poverty. You can find more information about the NHANES procedures here https://wwwn.cdc.gov/nchs/nhanes/Default.aspx.
Serum 25(OH)D measurements and calculation of Triglyceride–glucose index
Expert operators at the Centers for Disease Control and Prevention lab performed the collection and analysis of serum 25(OH)D. Participants were asked to fast for more than 8 hours while blood was drawn by a professional. In NHANES 2001–2006, serum 25(OH)D concentrations were measured using the DiaSorin radioimmunoassay kit. Serum 25(OH)D concentrations from 2001 to 2006 were converted to equivalent values using a regression method based on the liquid chromatography-tandem mass spectrometry (LC-MS/MS) measurements. From 2007 to 2018, LC-MS/MS was used to measure serum 25(OH)D levels(Reference Schleicher, Sternberg and Lacher29,Reference Liu, Zuo and Wang30) . According to the recommendations of the CDC, we used the LC-MS/MS–equivalent data for all analyses(Reference Liu, Lu and Wang31). Details about the procedures can be found on the NHANES website: https://wwwn.cdc.gov/nchs/nhanes/analyticguidelines.aspx. Additionally, TyG index was calculated by using the following formulas(Reference Simental-Mendía, Rodríguez-Morán and Guerrero-Romero8): TyG index = Ln [Triglyceride (mg/dl) × FBG (mg/dl)/2].
Hypertension ascertainment
In this study, HTN was diagnosed if one of the following criteria was met: (1) self-reported HTN, (2) currently taking antihypertensive medication, (3) SBP ≥ 140 mmHg or/and diastolic blood pressure (DBP) ≥ 90 mmHg (At least two or more measurements are required at different times and conditions). After resting quietly in a seated position for 5 min and after the participant’s maximum inflation level has been determined, three consecutive BP readings are obtained. If a BP measurement is interrupted or incomplete, a fourth attempt may be made. All BP determinations (systolic and diastolic) are taken in the mobile examination centre. In individual interviews about various health issues, professionals used standardised medical condition questionnaires. Participants were asked the following questions: ‘Because of {SP’s} high BP [hypertension], is {he/she} currently taking medicine?’. Additionally, participants were asked the following questions: ‘Has a doctor or other professional ever told you that you have high BP/hypertension?’. Those who replied ‘Yes’ were considered to have HTN, and those who replied ‘No’ were not. Subjects without self-reported HTN were also considered hypertensive if their SBP or DBP averaged 140 mm high or 90 mm high(Reference Lu and Ni32).
Statistical analysis
We calculated all data based on the NHANES sample weights. For continuous variables, we used the mean (standard deviation), and for categorical variables, we used number (percentage, %). Weighted student t tests were used to calculate continuous variables and weighted chi-square tests to calculate categorical variables in different groups. With the help of restricted cubic spline and multivariable logistic regression models, the association of TyG index and serum 25(OH)D with HTN was investigated. In the multivariable logistic regression model 1, adjustments were made for age and sex. Model 2 incorporated additional adjustments for race/ethnicity, education level, smoking, alcohol consumption, marital status, family poverty–income ratio and DM. Model 3 built upon Model 2 by including further adjustments for the history of CHD, congestive heart failure, angina pectoris, heart attack, stroke, hyperlipidaemia and coronary kidney disease, BMI, waist circumference, mean energy intake, mean Na intake, mean potassium intake, Na, potassium, Hb, FBG, HbA1c, total cholesterol, triglyceride, HDL, blood urea nitrogen, uric acid, serum creatinine and estimated glomerular filtration rate(Reference Xi, Wu and Wang33). The generalised additive models were applied in order to evaluate the association of serum 25(OH)D with TyG index, serum 25(OH)D with SBP and DBP as well as TyG index with SBP and DBP. Mediating analysis quantifies the degree to which a variable participates in the transmission of change from cause to its effect. In mediation analysis, the association between independent variables (X) and dependent variables (Y) is mediated by mediating variable (M)(Reference Vanderweele and Vansteelandt34). In the study, the TyG index (X) was the independent variable, HTN (Y) was the outcome variable, and serum 25(OH)D was the mediating variable. Total effect (TE), indirect effect (IE) and direct effect (DE) were used to analyse whether serum 25(OH)D mediated the link between TyG index and HTN. TyG index has the TE on HTN that can be divided into DE and IE, respectively. The TE refers to the effect that the TyG index had on HTN. The IE refers to the effect of the TyG index on HTN through serum 25(OH)D. The DE represents the effect of the TyG index on HTN when controlling for serum 25(OH)D. Based on serum 25(OH)D mediation, we calculated the proportion of IE in TE. Our study used the R version 3.6.4 and SPSS version 22.0 for all statistical analysis. P-value < 0·05 was statistically significant.
Results
Baseline characteristics
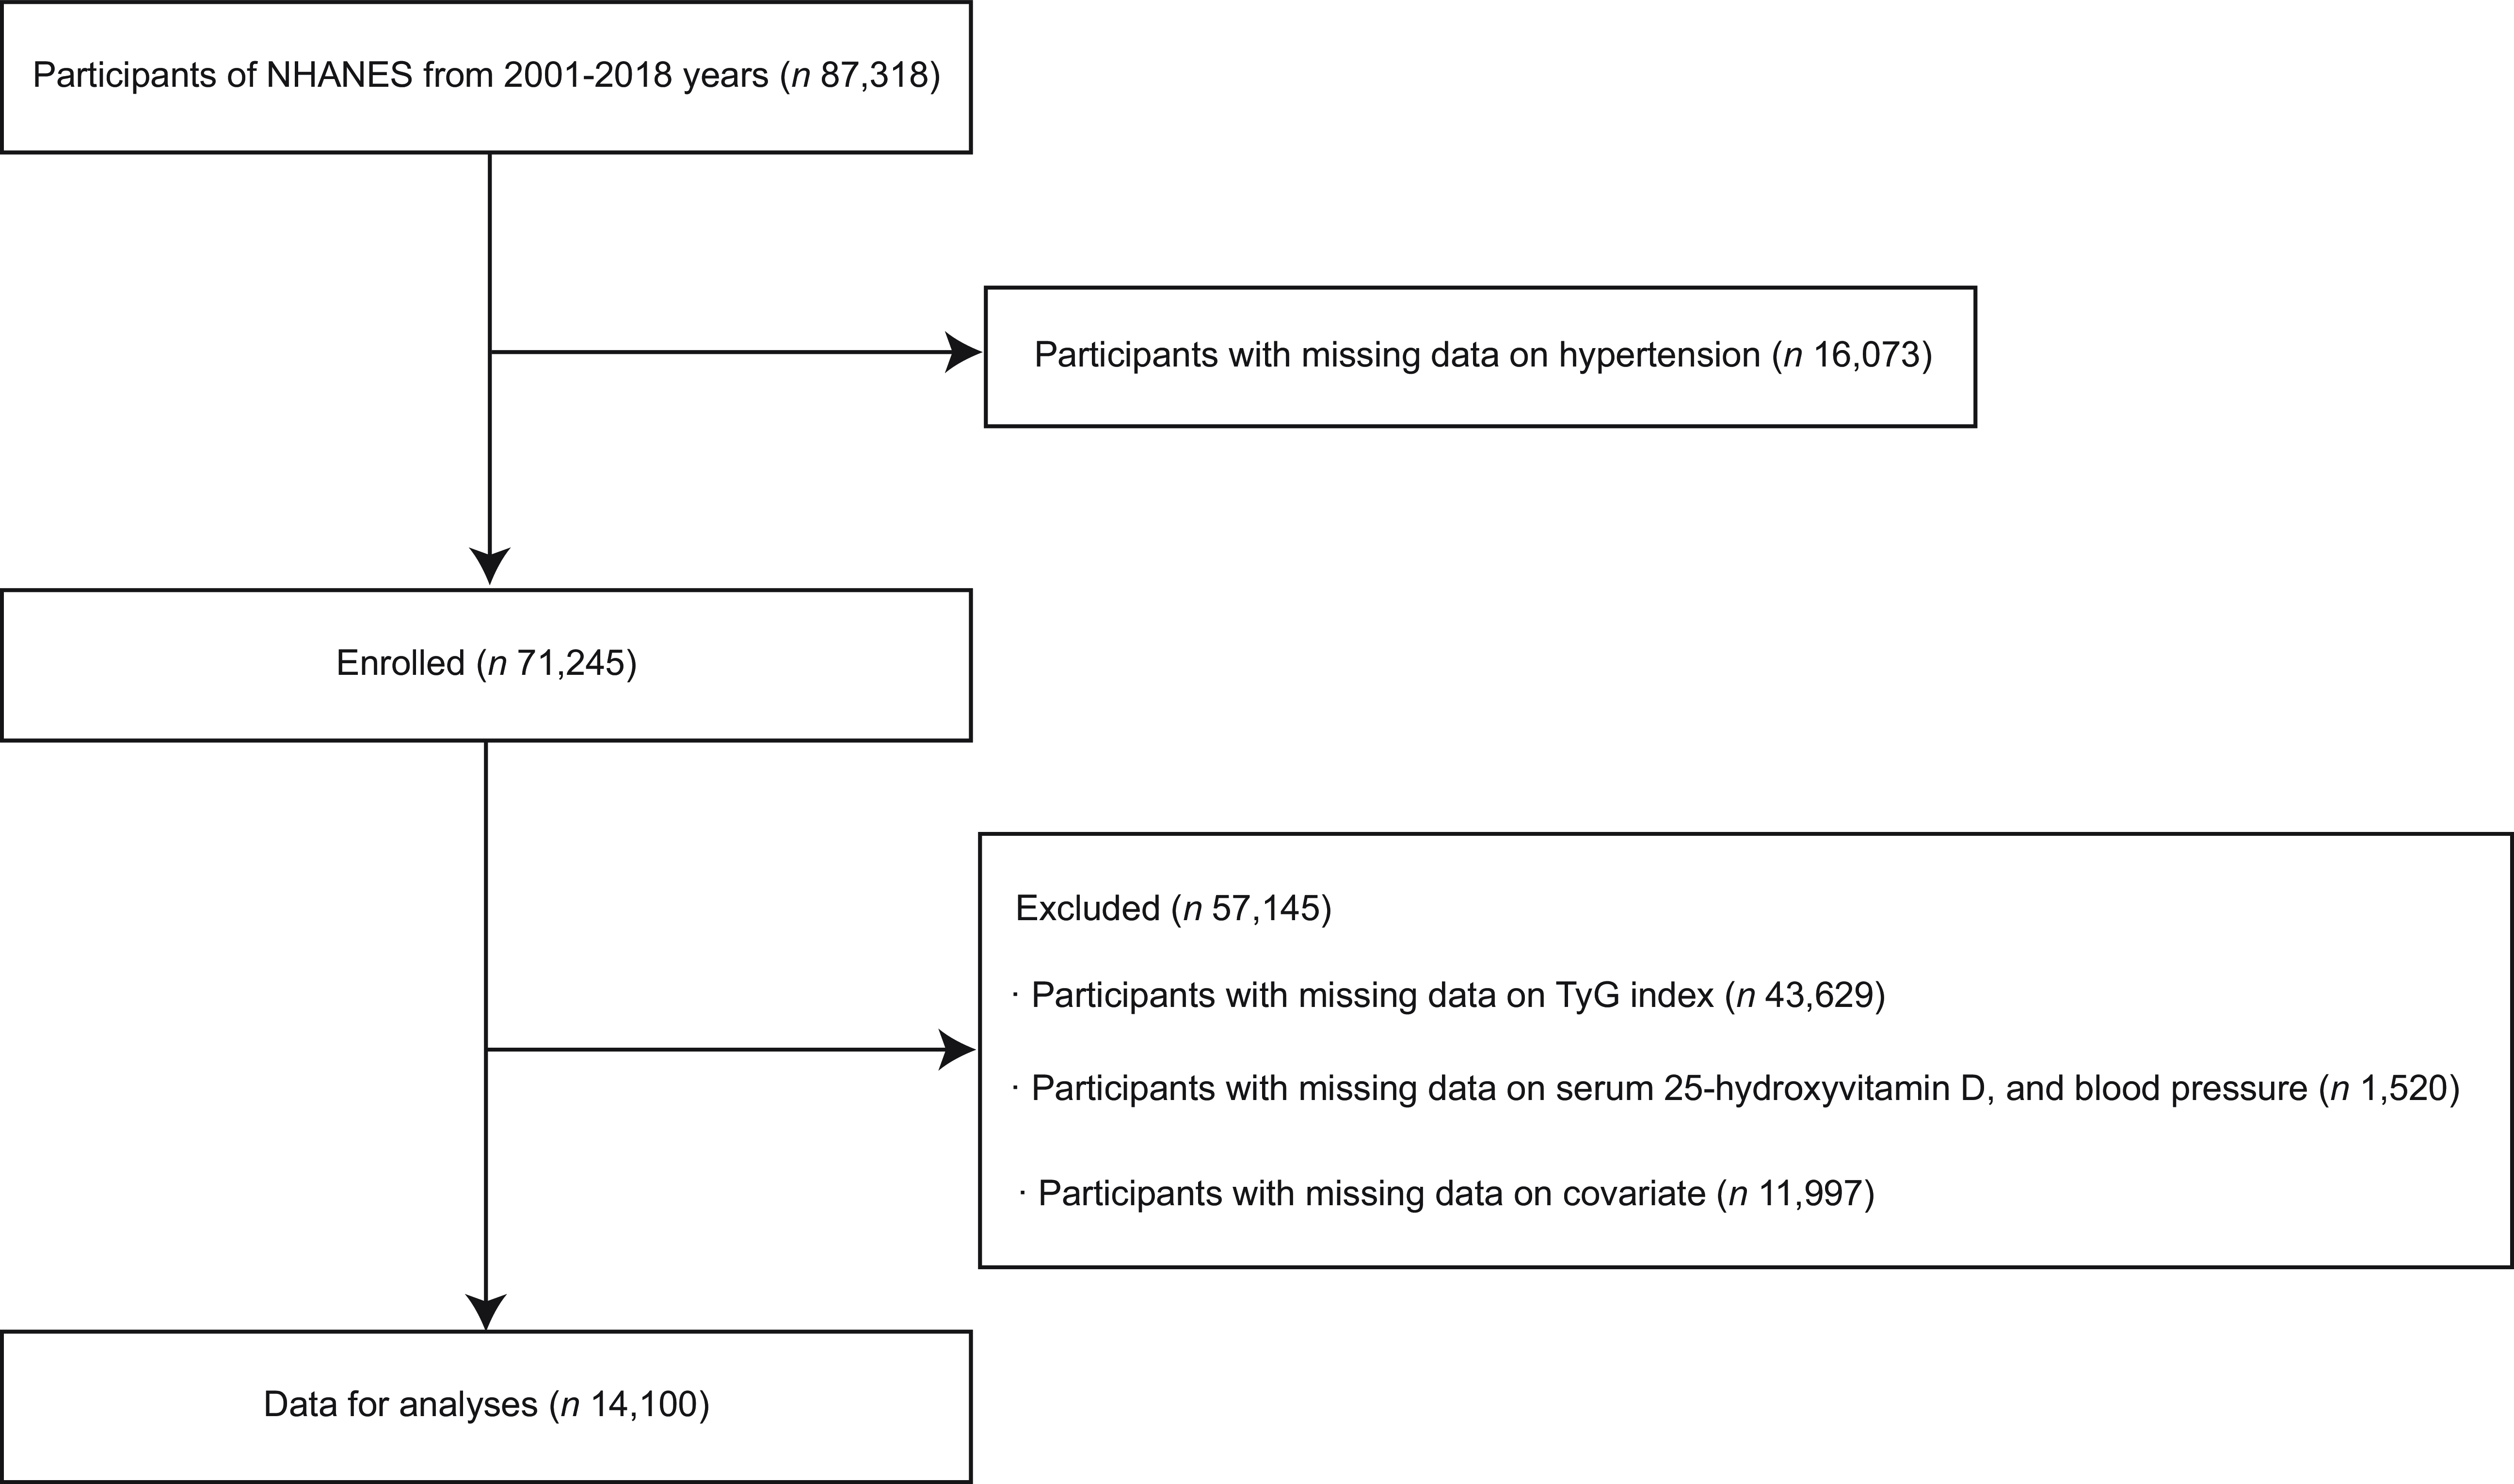
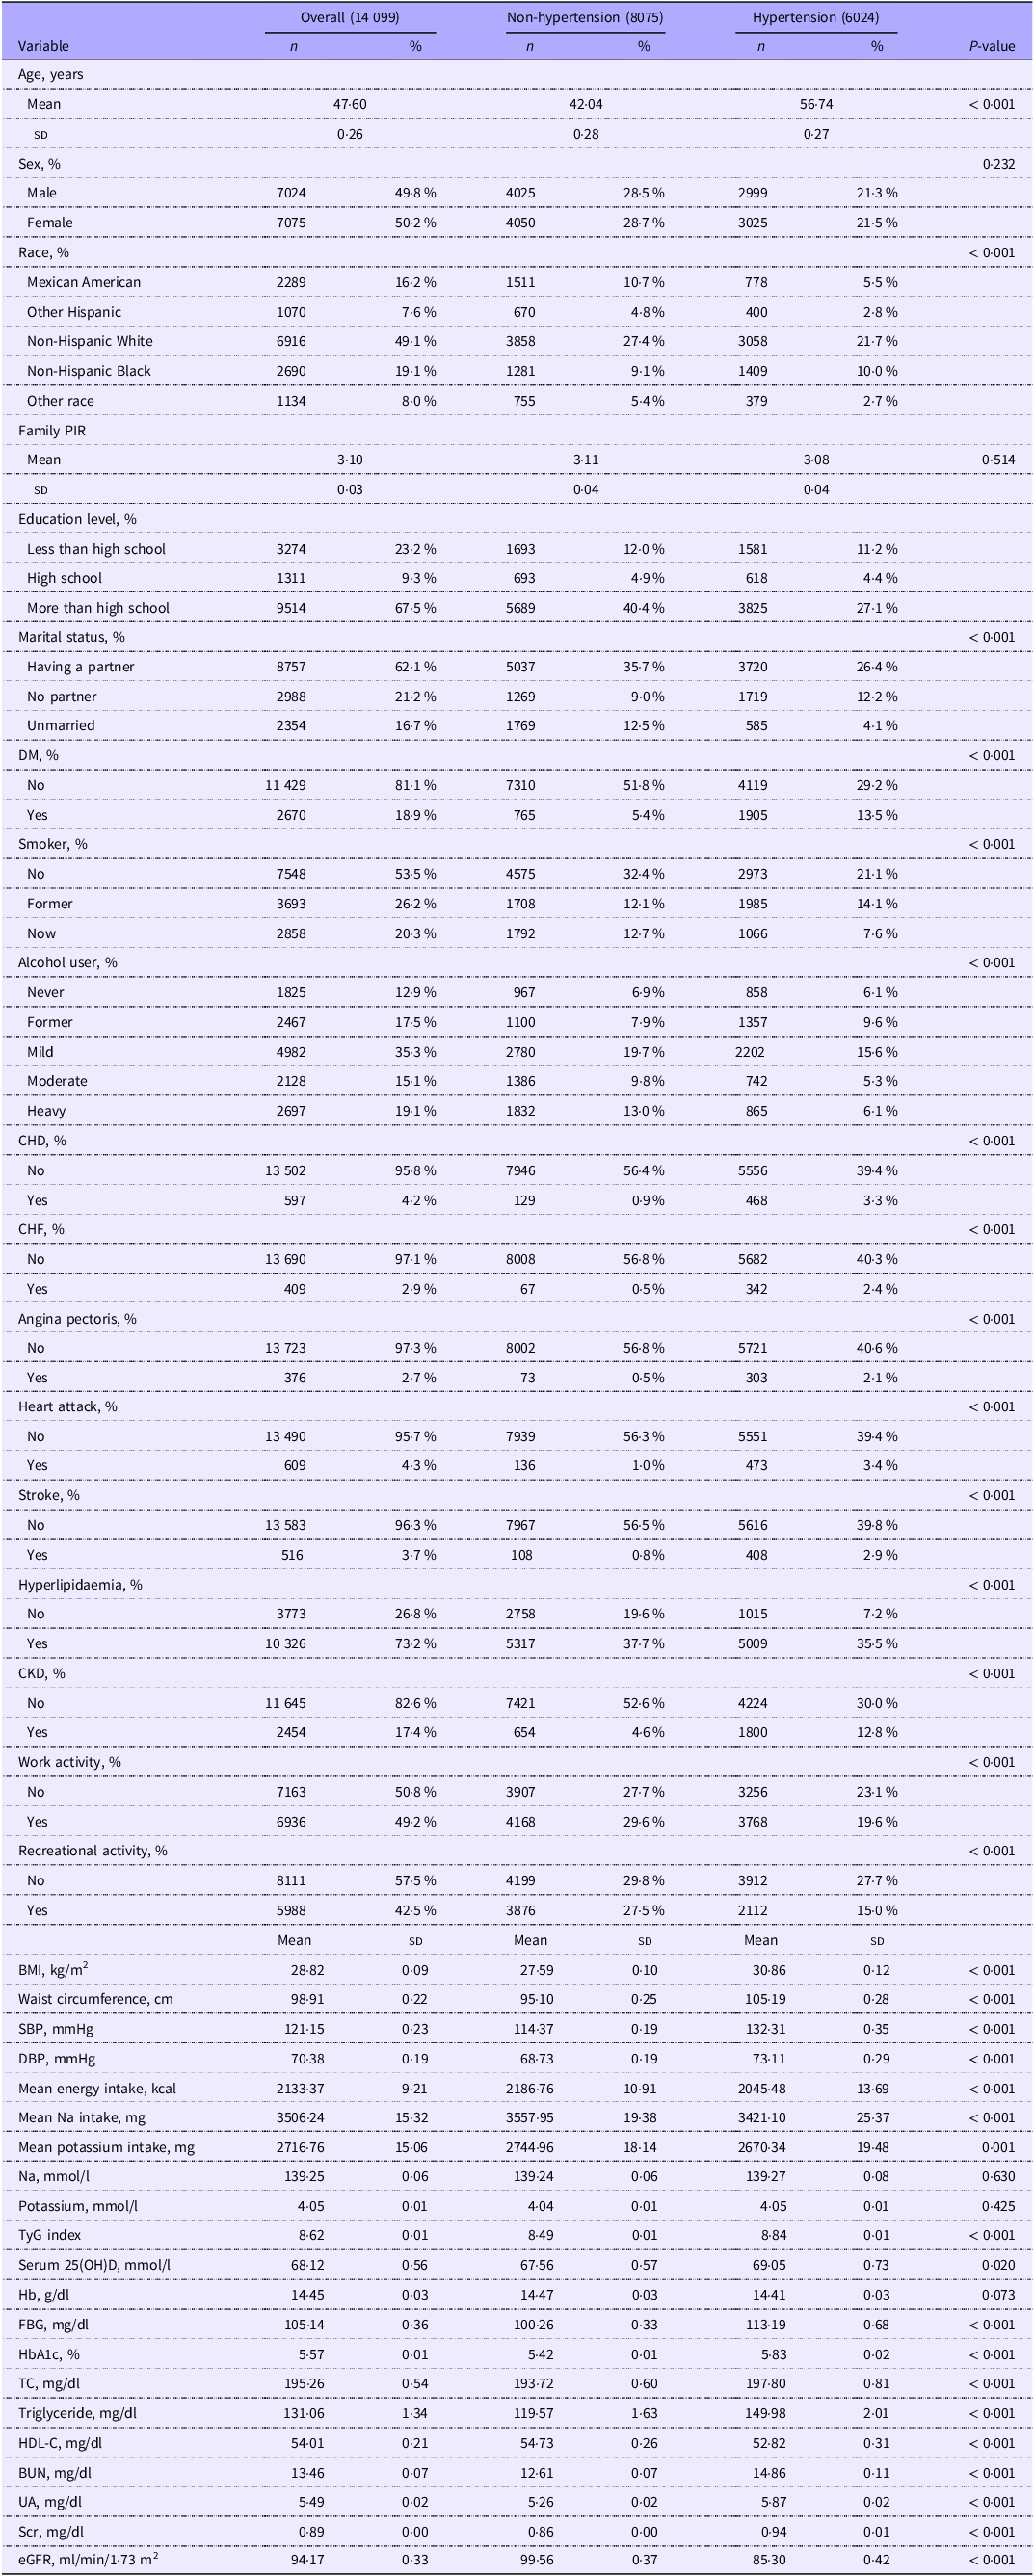
A total of 87 318 participants were initially enrolled in the NHANES from 2001 to 2018. Among them, individuals without HTN data (n 16 073) were excluded from the study. We further excluded 45 149 individuals due to the absence of TyG index (n 43 629) and serum 25(OH)D (n 1520). Additionally, 11 997 participants without demographic and biochemical data were excluded. Ultimately, a total of 14 099 individuals were included for data analysis (Figure 1). Of these, 5065 participants self-reported having HTN or taking medications. In Table 1, we listed the weighted demographic and medical characteristics of the participants. The prevalence of HTN was found to be present in 42·7 % (6024/14 099) of the population. Subjects in the HTN group were older and had a higher level of BMI, waist circumference, TyG index, serum 25(OH)D, Hb, FBG, HbA1c, total cholesterol, triglyceride, blood urea nitrogen, uric acid and serum creatinine than those in the non-hypertensive group (P < 0·05). Finally, we also compared the characteristics of the populations between the HTN group and non-hypertensive group after multiple imputations in online Supplementary Table 1.
Study flow chart. NHANES, National Health and Nutrition Examination Surveys; 25(OH)D, 25-hydroxyvitamin D; HTN, hypertension.

Characteristics of the study population (Mean values and standard deviations; numbers and percentages)

PIR, poverty–income ratio; DM, diabetes mellitus; CHF, congestive heart failure; CKD, coronary kidney disease; SBP, systolic blood pressure; DBP, diastolic blood pressure; TyG index, Triglyceride–glucose index; serum 25(OH)D, serum 25-hydroxyvitamin D; FBG, fast blood glucose; HbA1c, glycosylated Hb; TC, total cholesterol; HDL-C, HDL-cholesterol; BUN, blood urea nitrogen; UA, uric acid; Scr, serum creatinine; eGFR, estimated glomerular filtration rate.
Associations of TyG index and serum 25(OH)D with hypertension
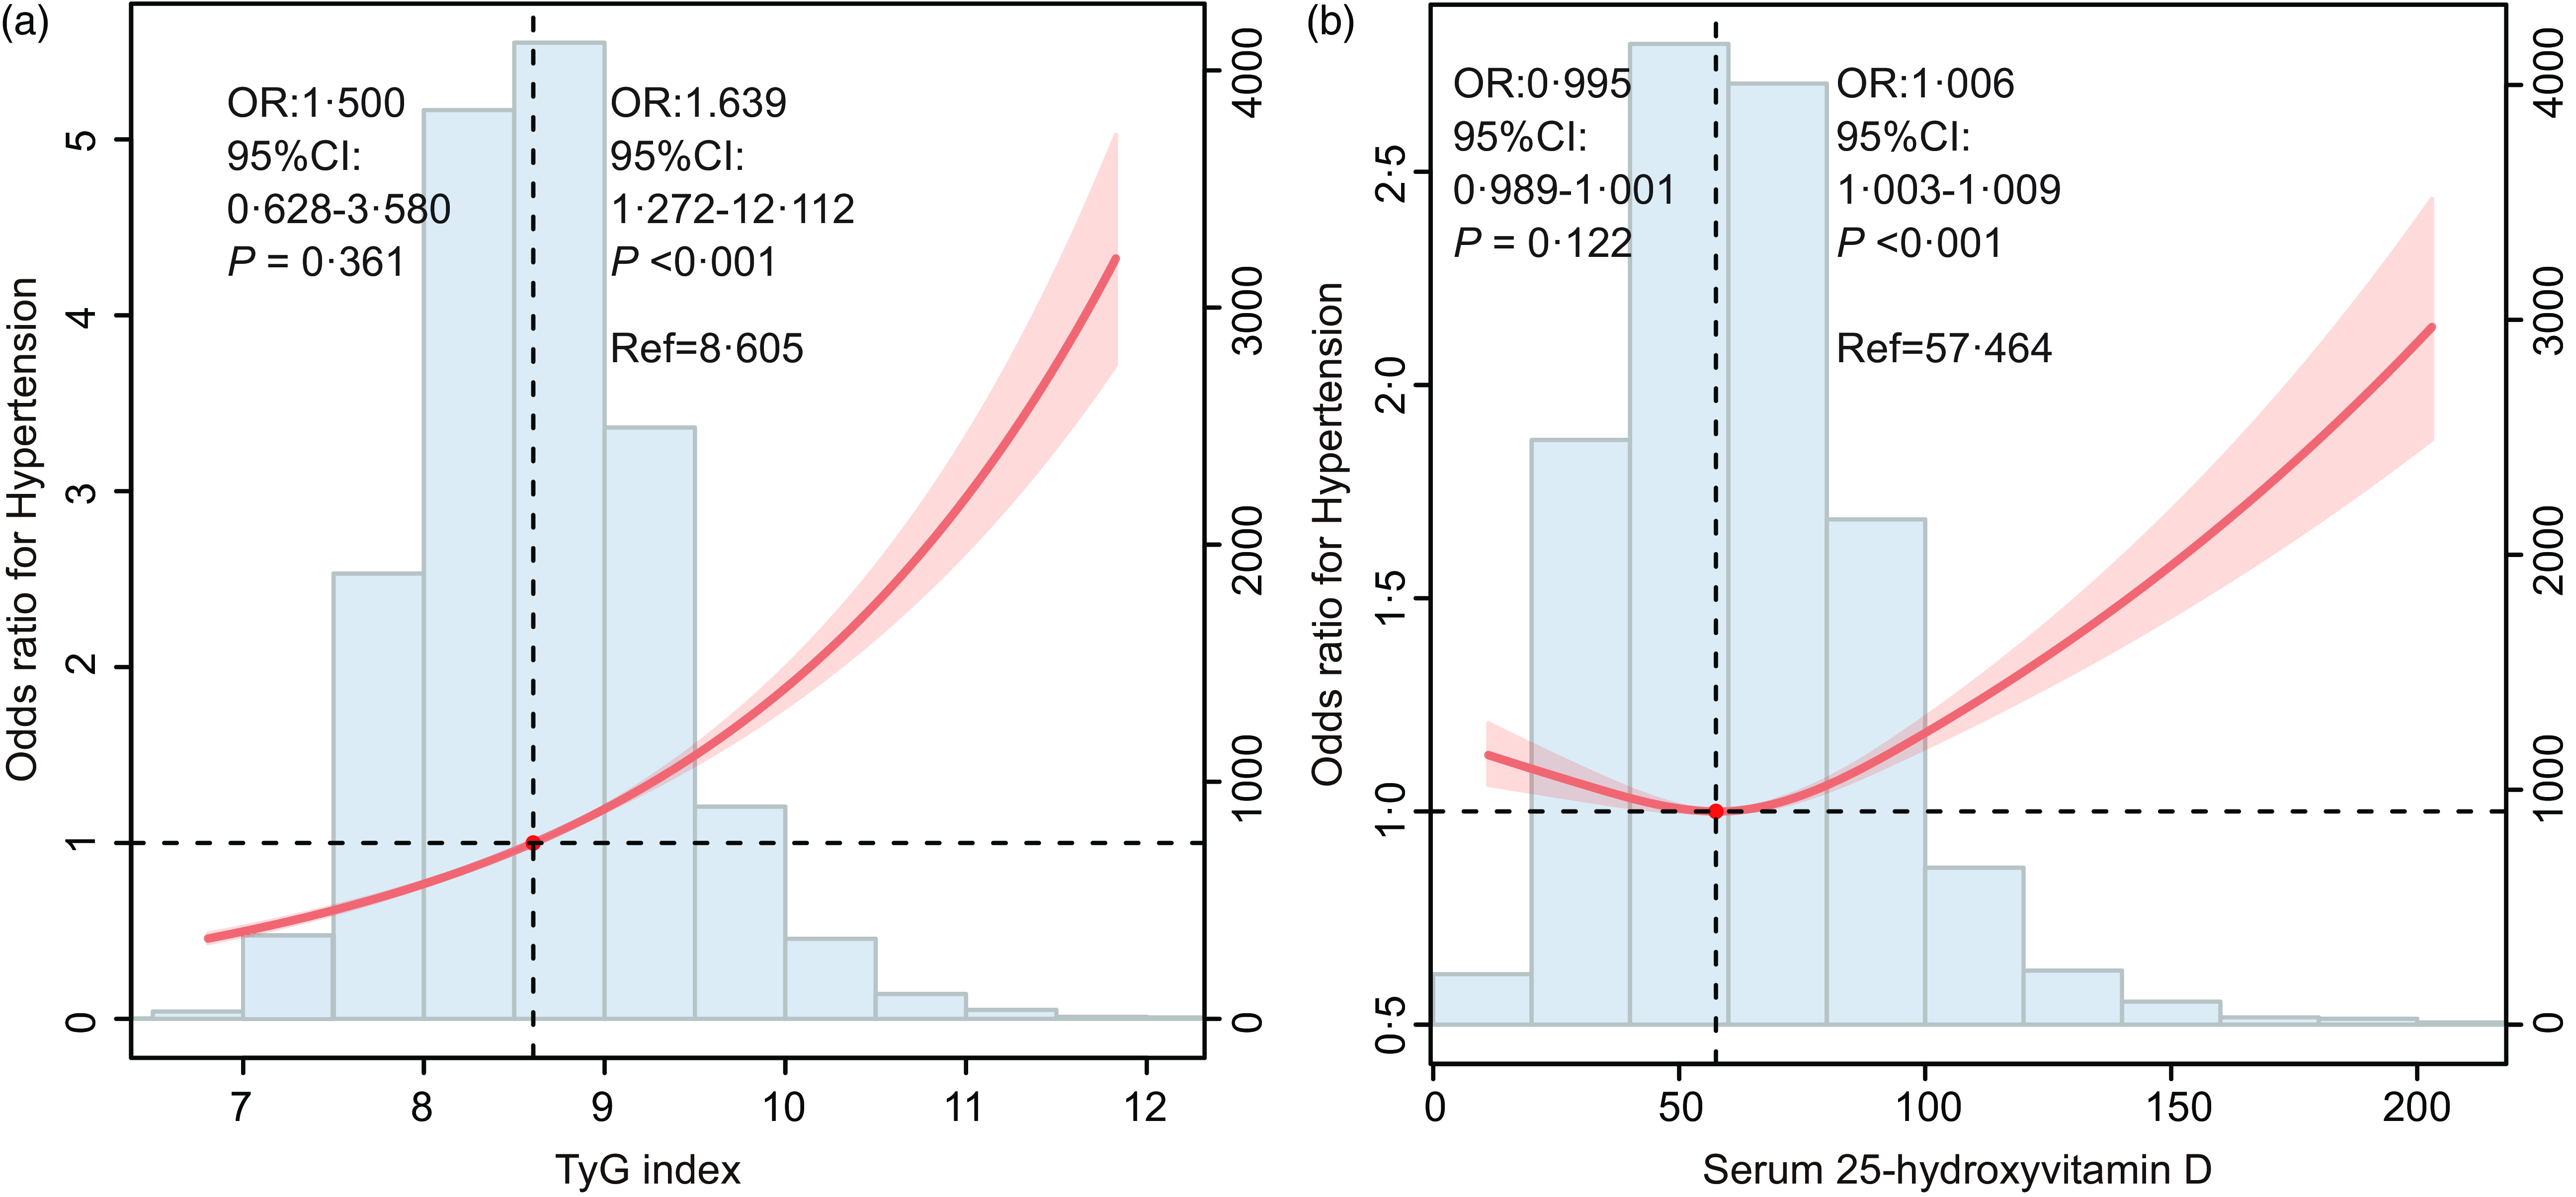
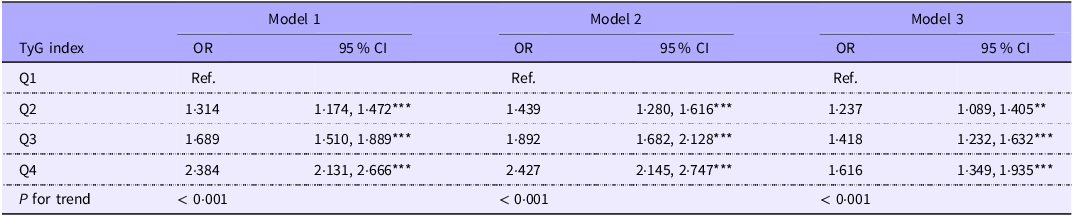
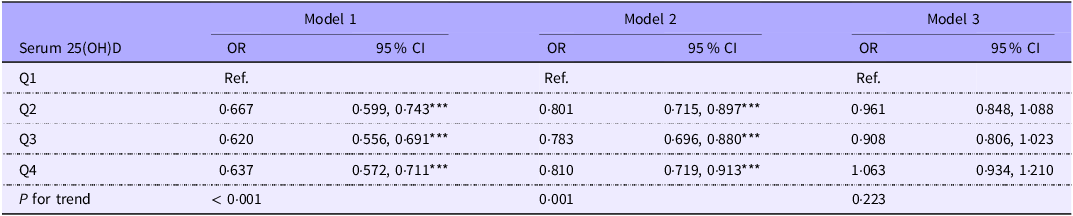
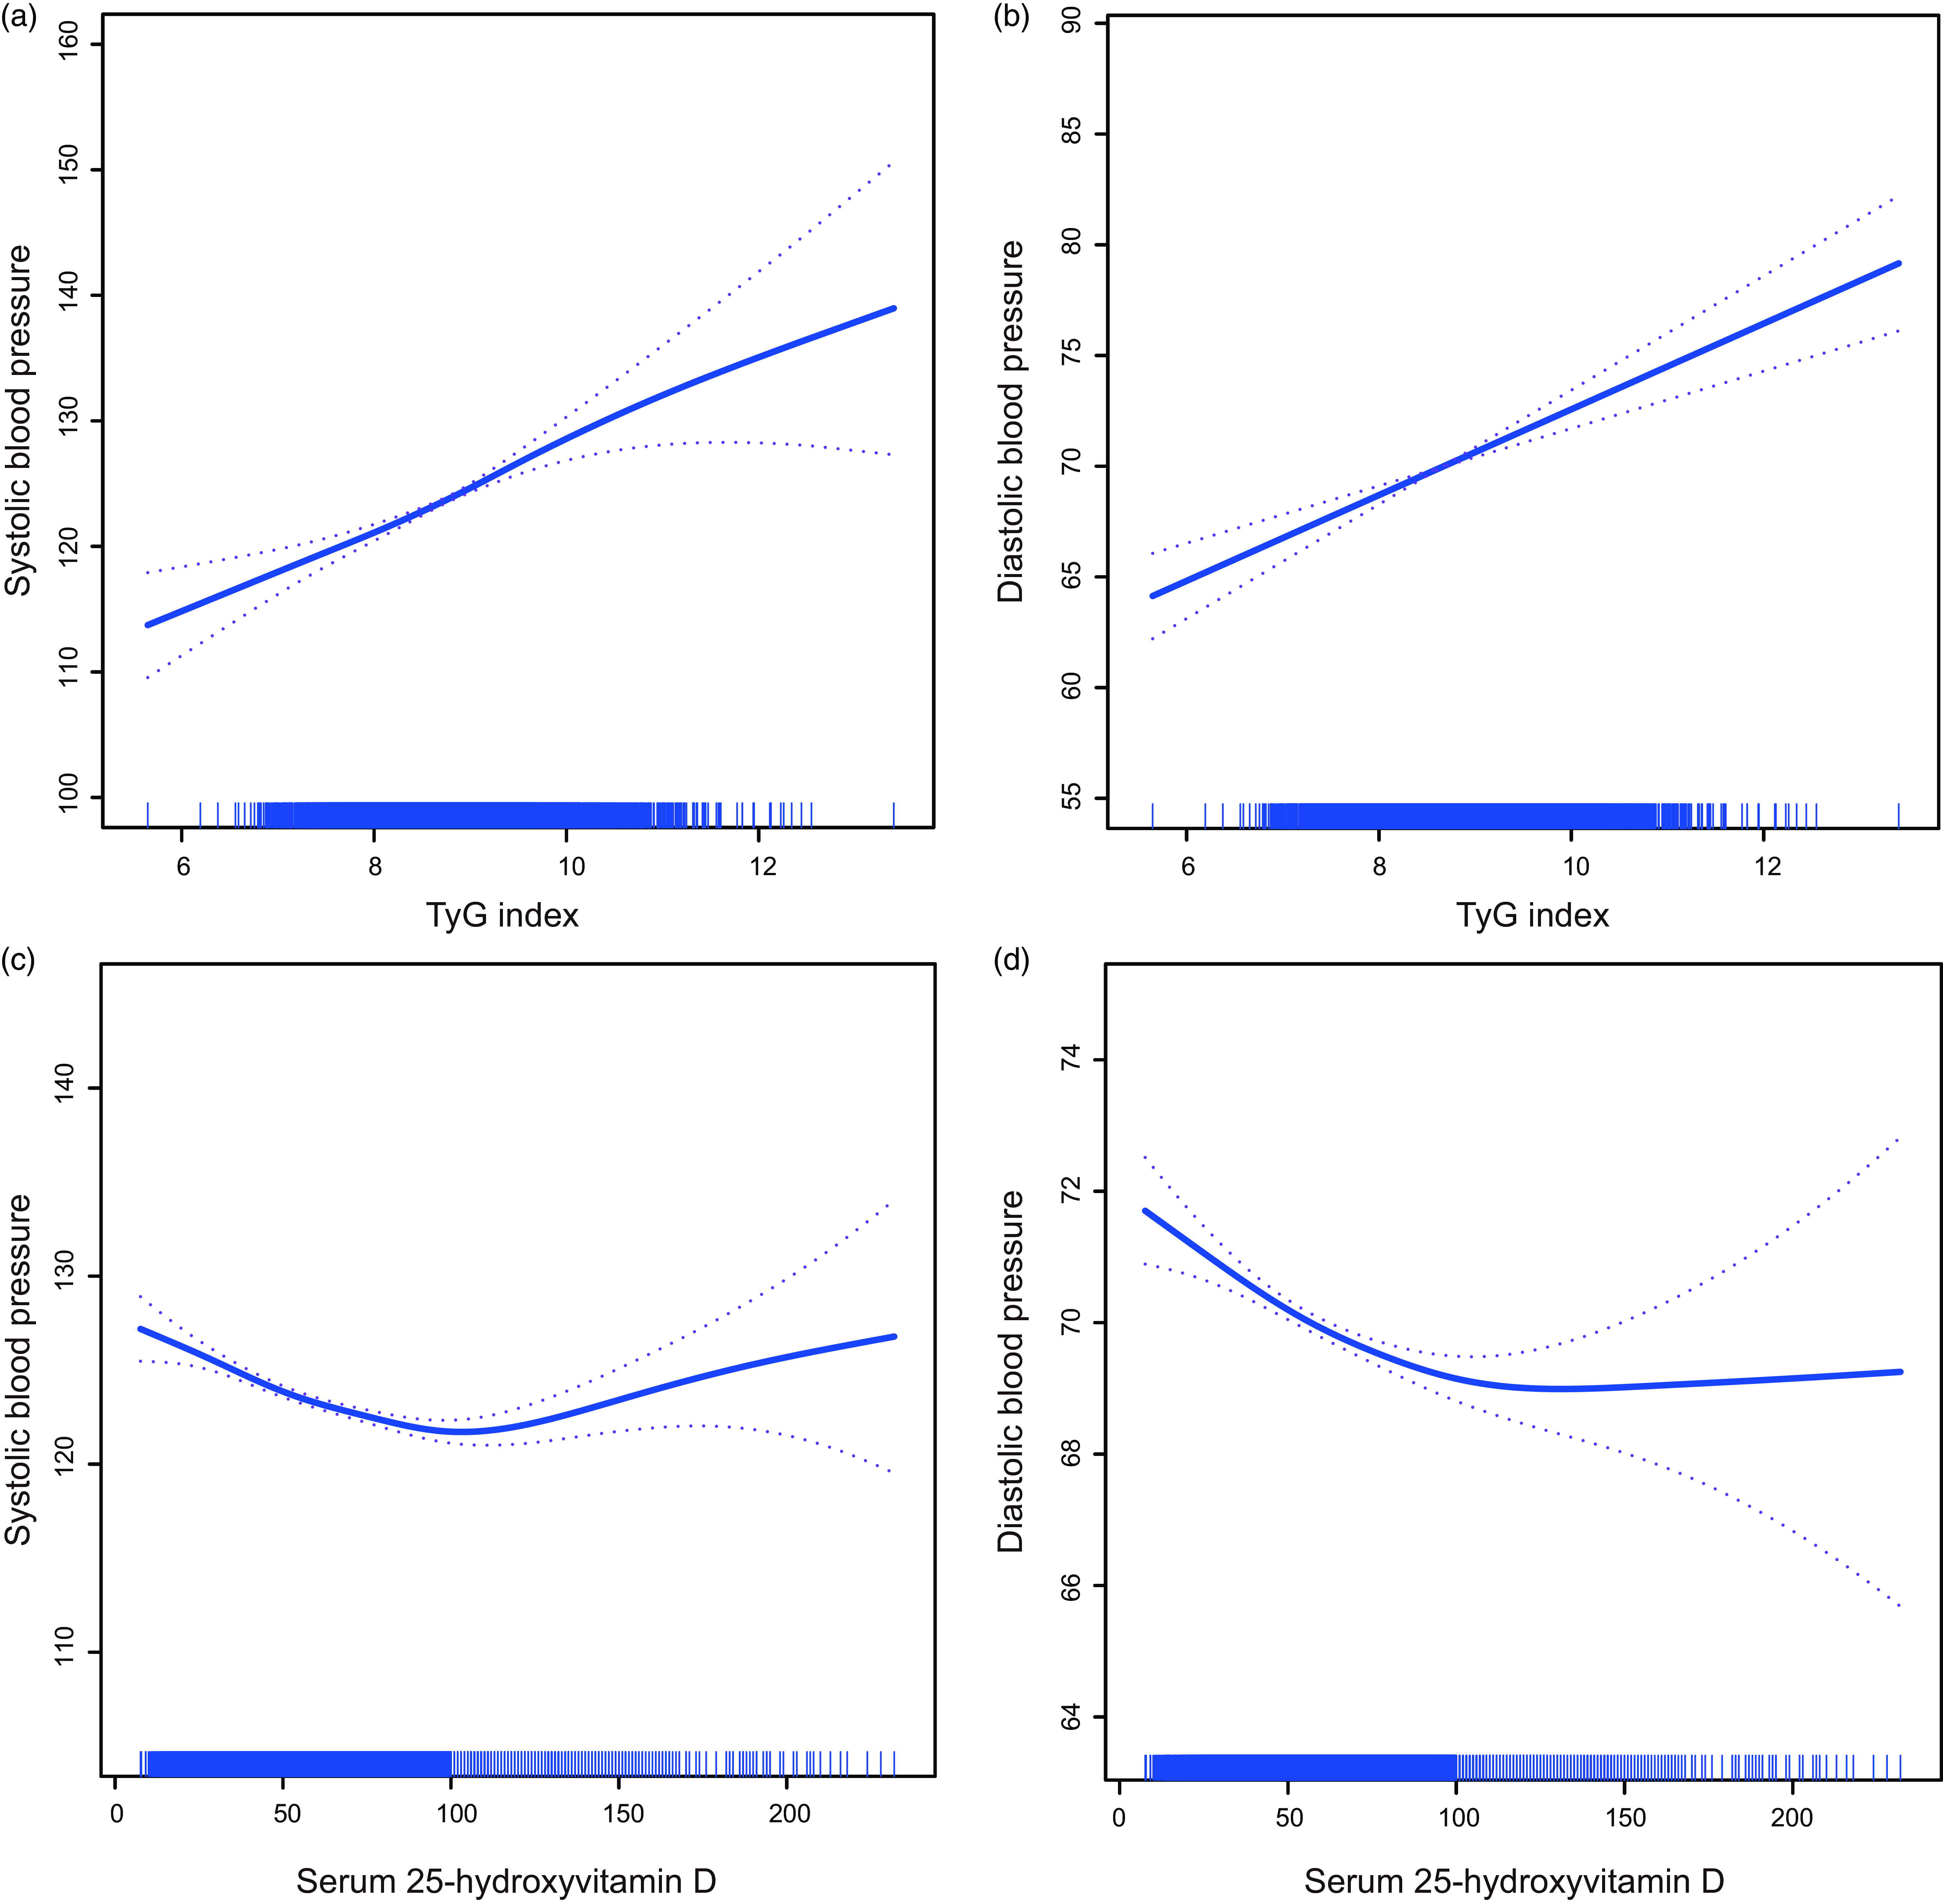
The restricted cubic spline curve shows the positive and linear correlation between TyG index and the prevalence of HTN (P for nonlinearity = 0·890; Figure 2(a)). Additionally, a U-shaped curve association existed between serum 25(OH)D and HTN risk (P for nonlinearity = 0·005; Figure 2(b)). When the serum 25(OH)D levels were less than 57·464 mmol/l, the prevalence of HTN decreased with the increase of serum 25(OH)D level. When serum 25(OH)D levels rise above 57·464 mmol/l, the risk of HTN increases rapidly. Moderate serum 25(OH)D levels reduce the risk of HTN, but too much or too little can adversely affect the prevalence of HTN. Compared with the lowest quartiles (Q1) of TyG index and serum 25(OH)D level, the OR with 95 % CI for HTN across the quartiles were 1·237 (1·089, 1·405), 1·418 (1·232, 1·632) and 1·616 (1·349, 1·935) for TyG index and 0·961 (0·848, 1·088), 0·908 (0·806, 1·023) and 1·063 (0·934, 1·210) for serum 25(OH)D in model 3 (Tables 2 and 3). There were positive and linear connections between the TyG index and SBP and DBP (Figure 3(a) and (b)). Additionally, serum 25(OH)D level, SBP and DBP also showed a U-shaped association (Figure 3(c) and (d)).
The RCS plots of associations of (a) TyG index and (b) serum 25(OH)D with prevalence of HTN. RCS, restricted cubic spline; TyG index,Triglyceride–glucose index; HTN, hypertension; 25(OH)D, 25-hydroxyvitamin D.

Adjusted OR for associations between TyG index and prevalence of hypertension (OR and 95 % CI)

Q1, 5·646–8·183; Q2, 8·184–8·605; Q3, 8·606–9·052; Q4, 9·053–13·405; TyG, Triglyceride–glucose index; **P < 0·01; ***P < 0·001. Model 1: age and sex. Model 2: model 1 variables plus race/ethnicity, education level, marital status, family poverty–income ratio, diabetes mellitus, smoke status and drink status. Model 3 was adjusted for model 2 variableables plus work activity, recreational activity, the history of CHD, congestive heart failure, angina pectoris, heart attack, stroke, hyperlipidaemia and chronic kidney diseases, BMI, waist circumference, mean energy intake, mean Na intake, mean potassium intake, Na, potassium, Hb, fast blood glucose, glycosylated Hb, total cholesterol, triglyceride, HDL-cholesterol, blood urea nitrogen, uric acid, serum creatinine and estimated glomerular filtration rate.
Adjusted OR for associations between serum 25(OH)D and prevalence of hypertension (OR and 95 % CI)

Q1, 7·57–44·7 nmol/l; Q2, 44·8–60·8 nmol/l; Q3, 60·9–77·8 nmol/l; Q4, 77·9–232 nmol/l; serum 25(OH)D, serum 25-hydroxyvitamin D; ***P < 0·001. Model 1: age and sex. Model 2: model 1 variables plus race/ethnicity, education level, marital status, family poverty–income ratio, diabetes mellitus, smoke status and drink status. Model 3 was adjusted for model 2 variables plus work activity, recreational activity, the history of CHD, congestive heart failure, angina pectoris, heart attack, stroke, hyperlipidaemia and chronic kidney diseases, BMI, waist circumference, mean energy intake, mean Na intake, mean potassium intake, Na, potassium, Hb, fast blood glucose, glycosylated Hb, total cholesterol, triglyceride, HDL-cholesterol, blood urea nitrogen, uric acid, serum creatinine and estimated glomerular filtration rate.
The association of TyG index and serum 25(OH)D with SBP and DBP. (a) The association between TyG index and SBP; (b) The association between TyG index and DBP; (c) The association between serum 25(OH)D and SBP; (d) The association between serum 25(OH)D and DBP. SBP, systolic blood pressure; TyG index, Triglyceride–glucose index; DBP, diastolic blood pressure; 25(OH)D, 25-hydroxyvitamin D.

25(OH)D mediates the association between TyG index and hypertension
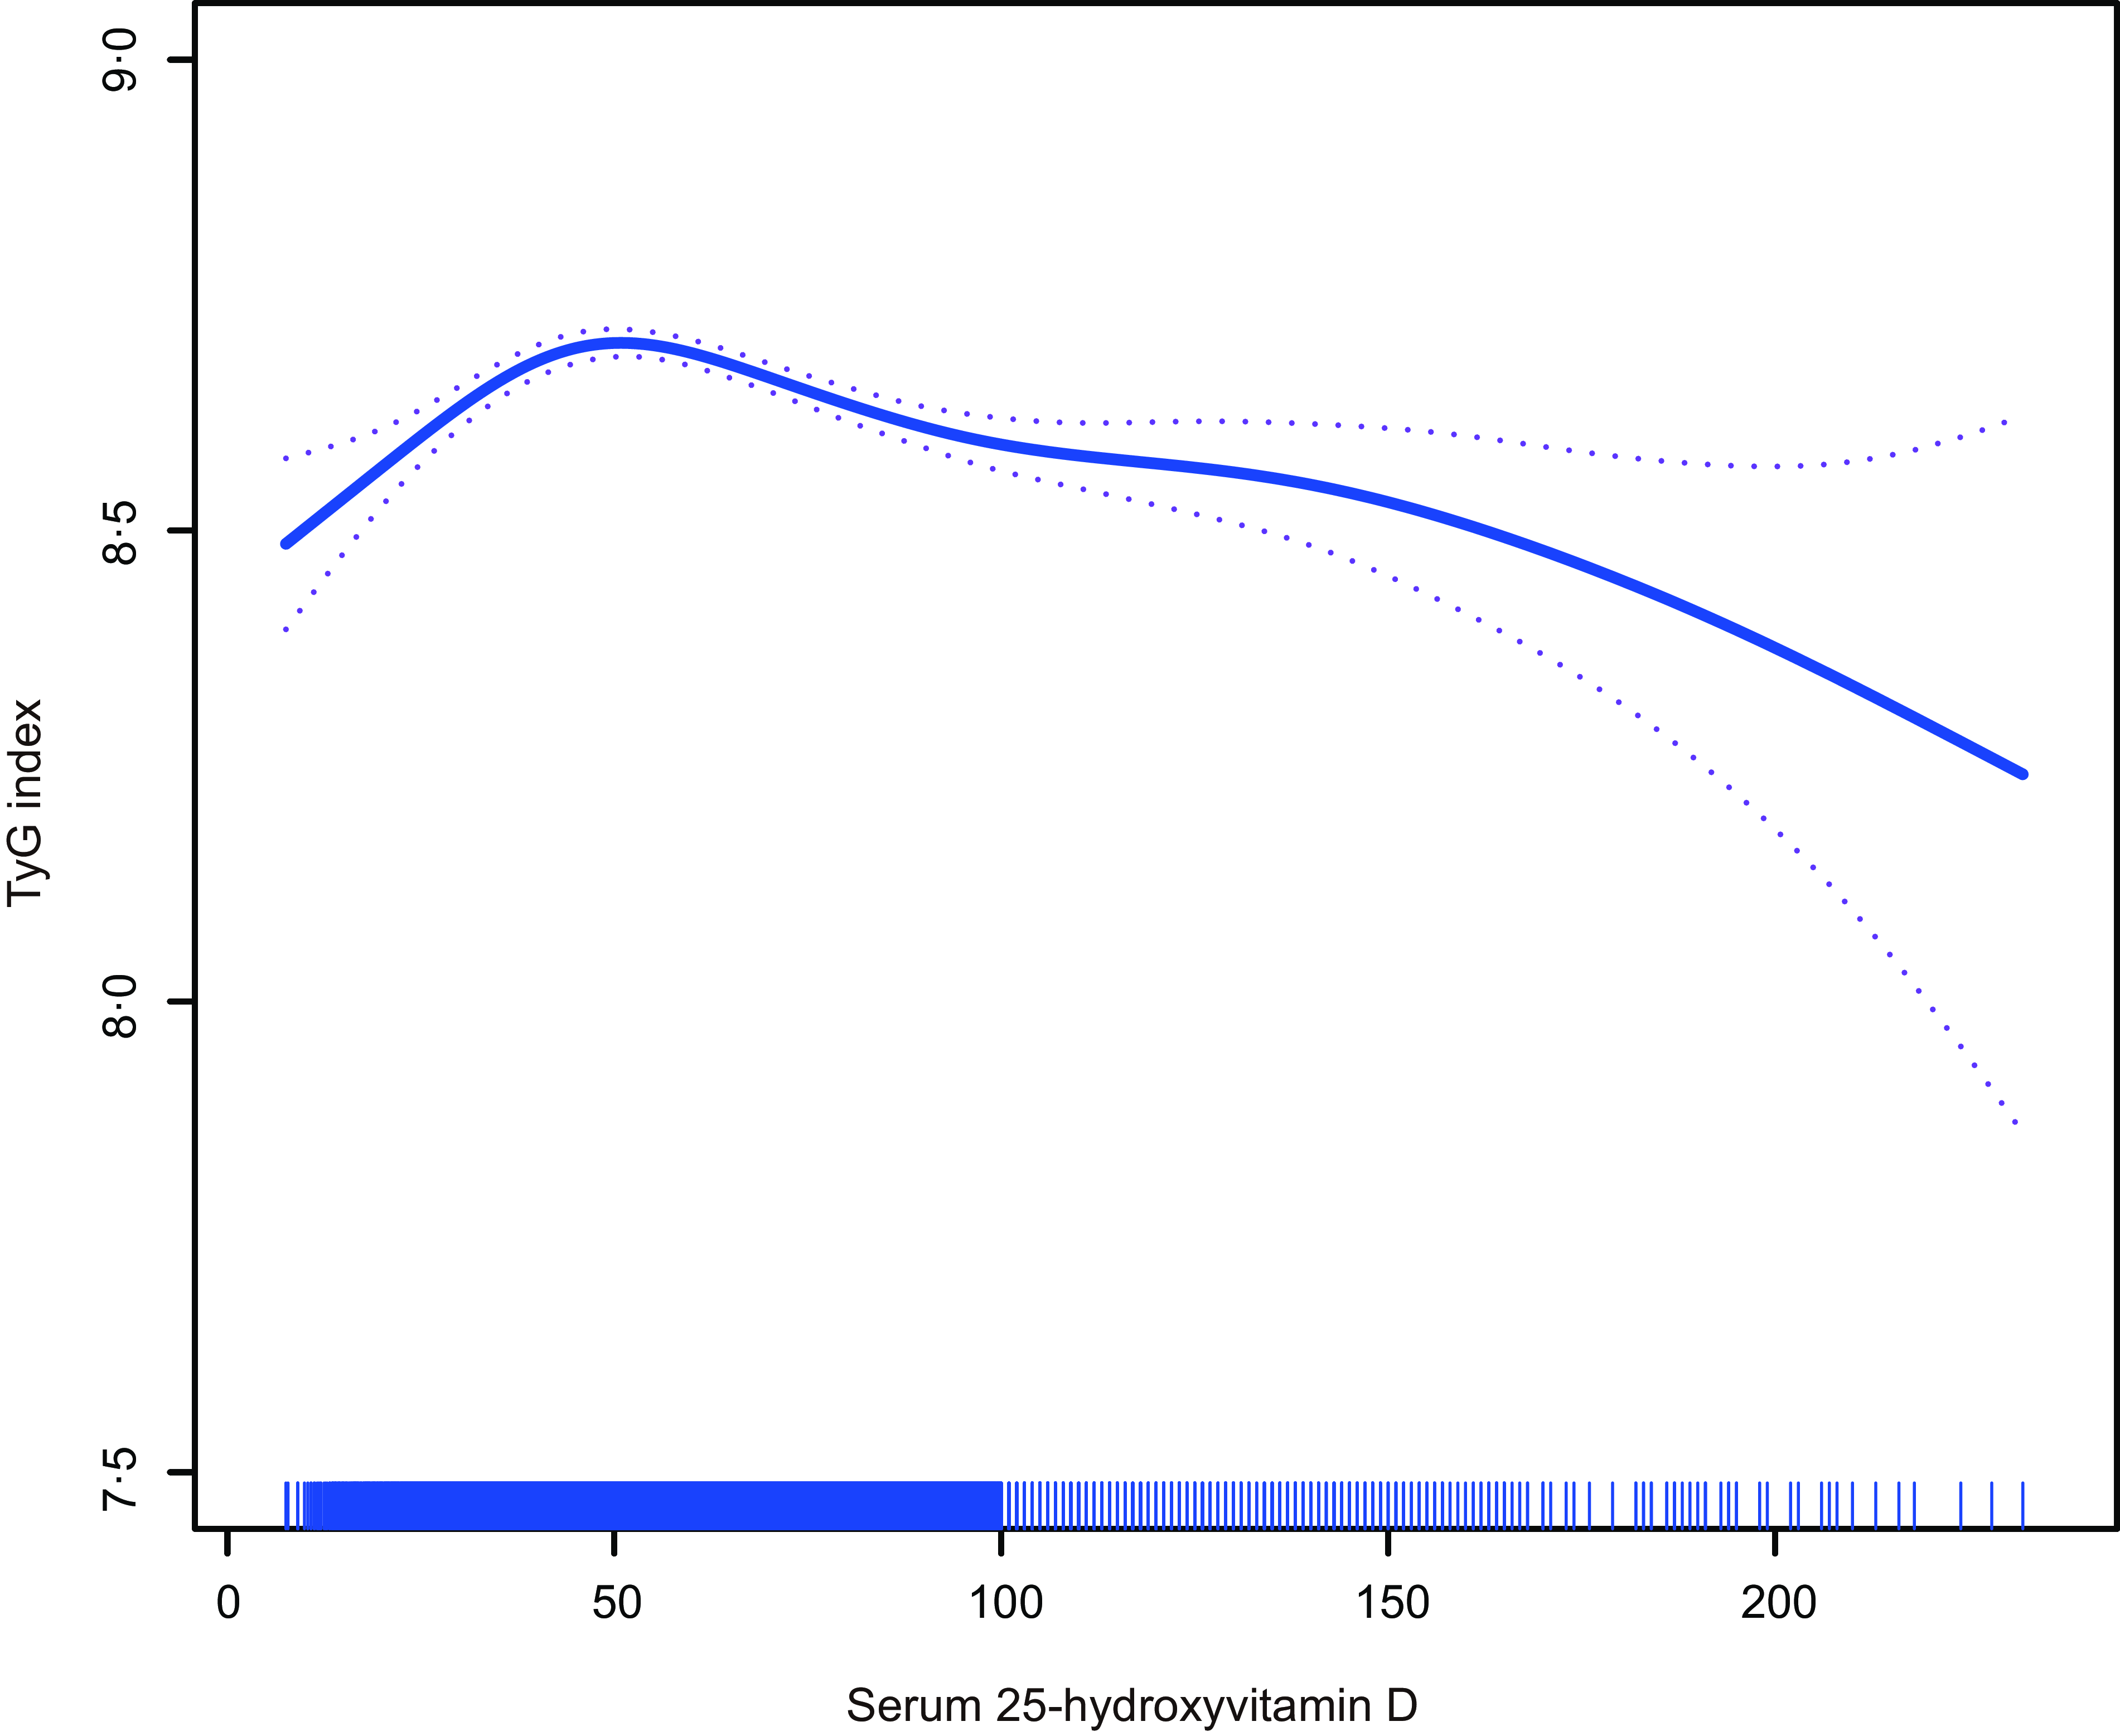
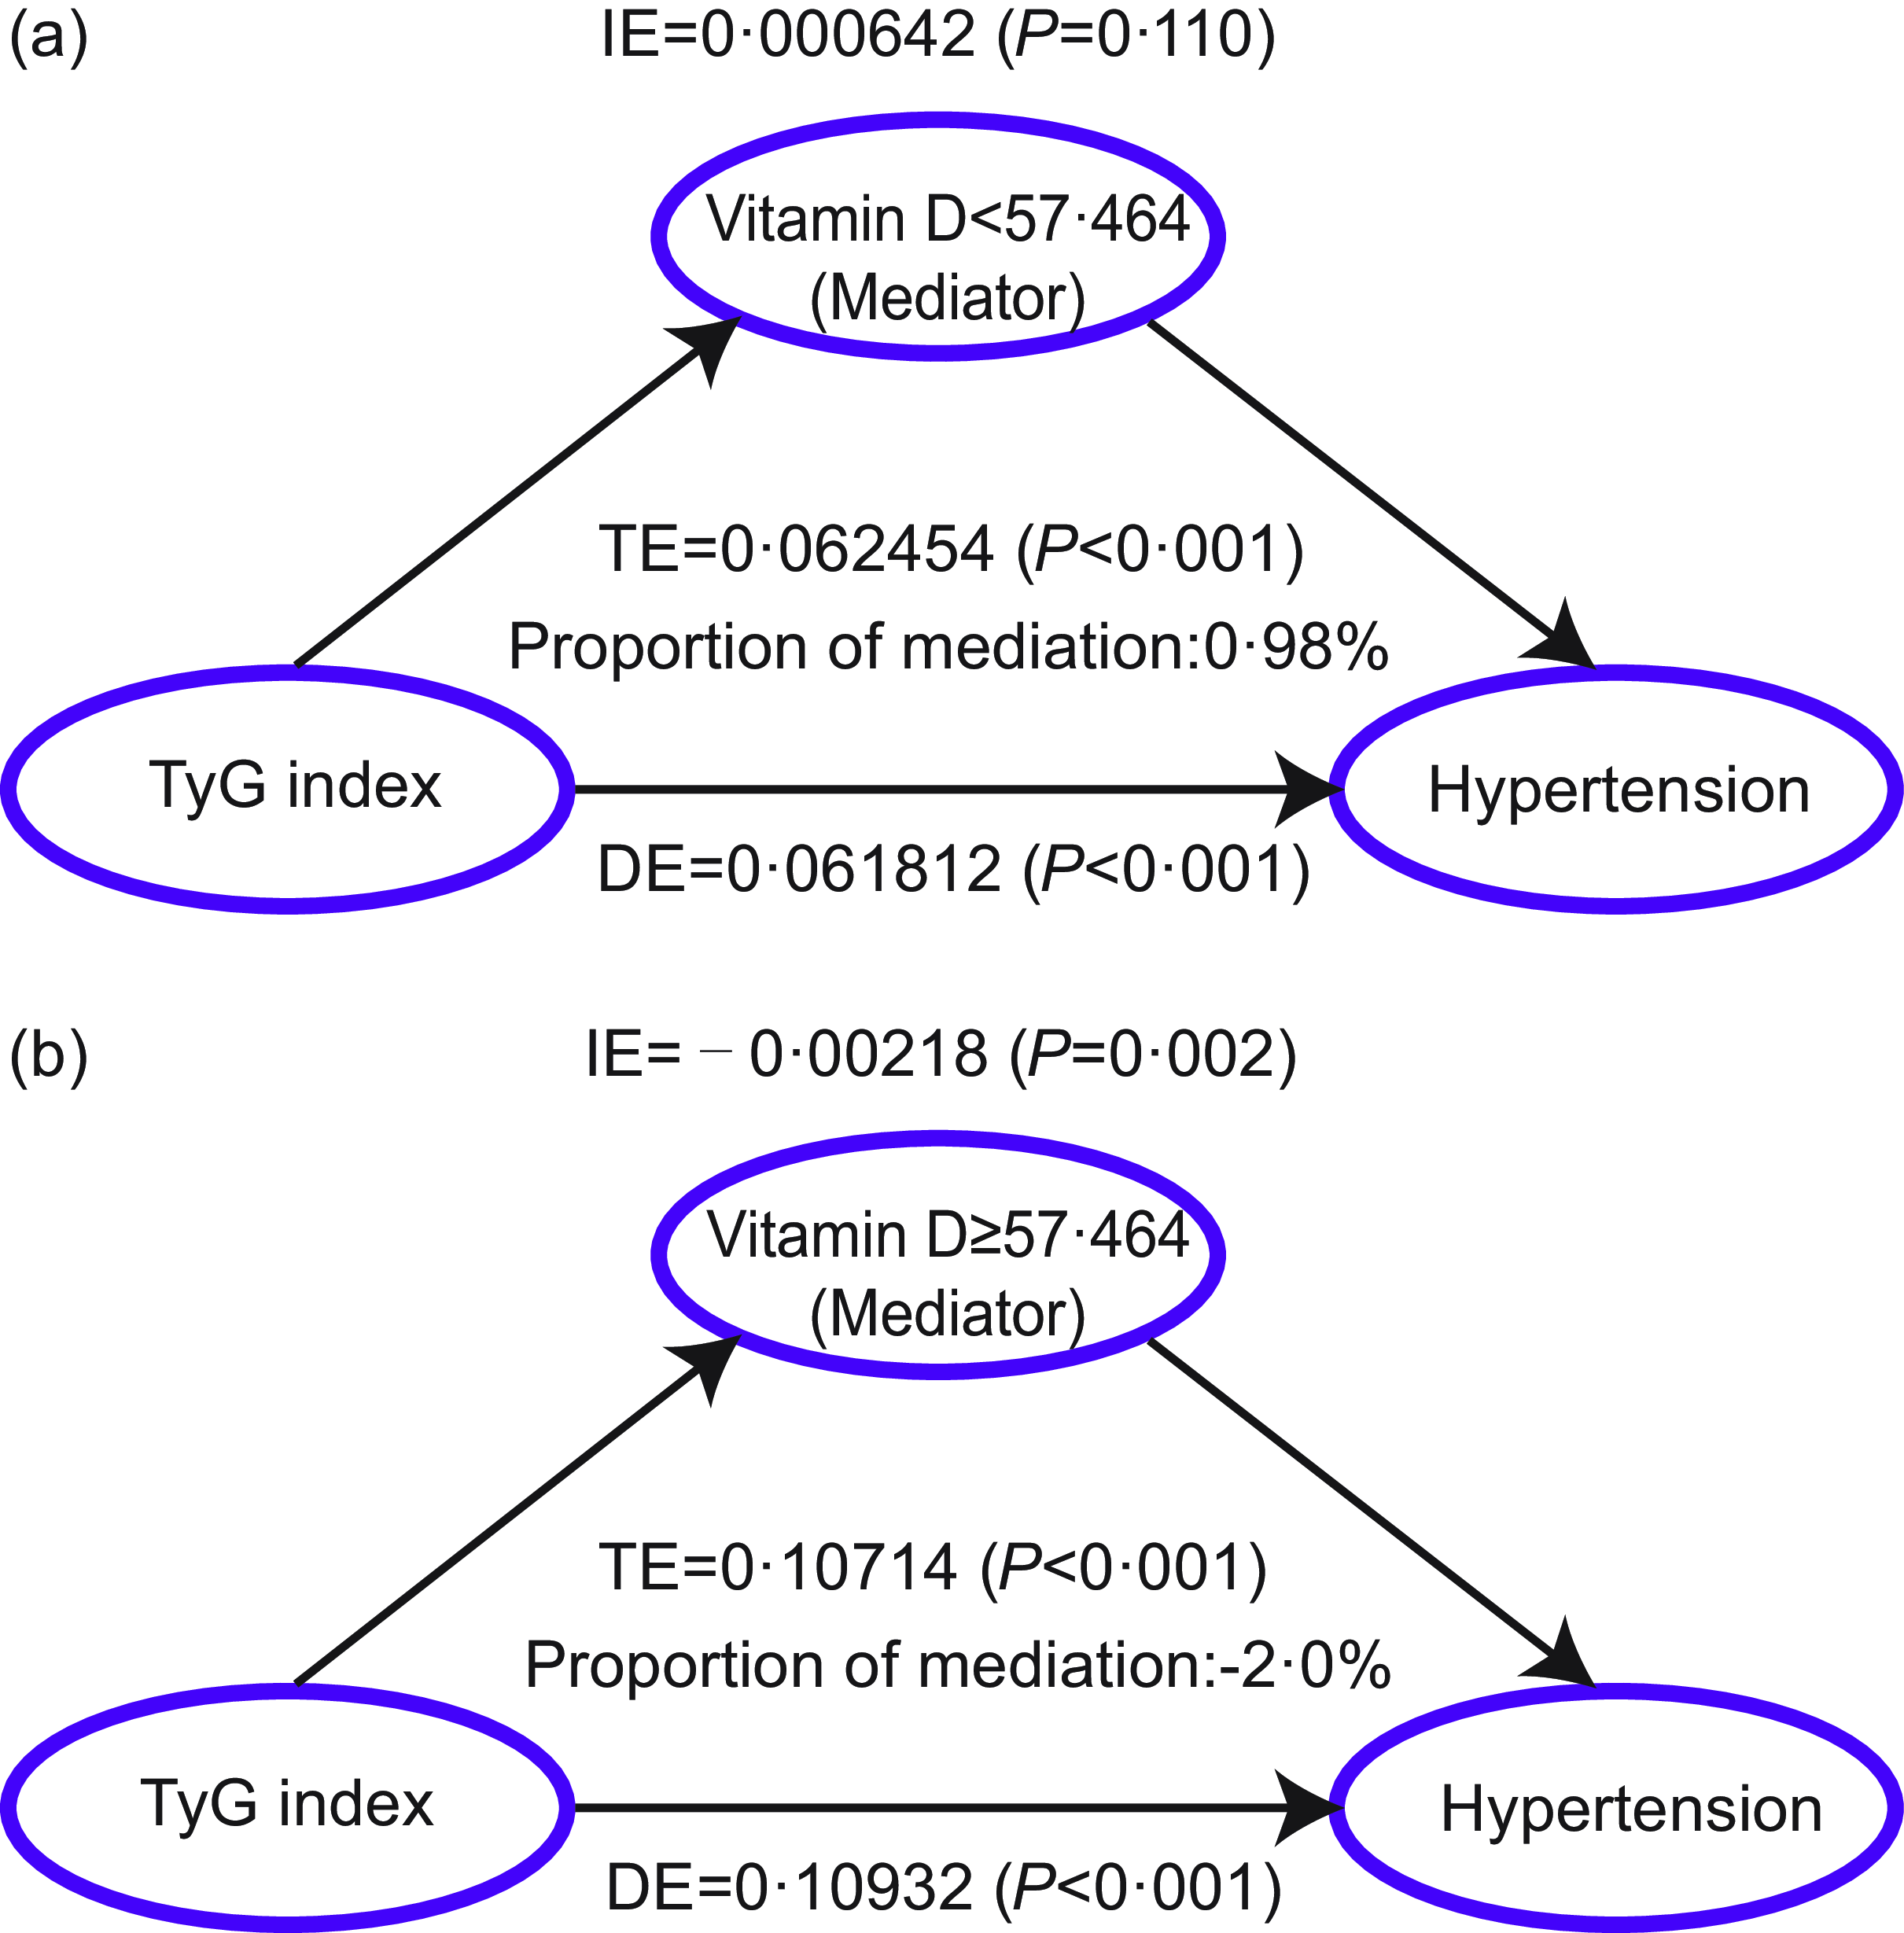
Smooth curve fitting shows the roughly n-type correlation between serum 25(OH)D and the TyG index. During serum 25(OH)D levels increase, the TyG index increases and then decreases (Figure 4). TyG index and HTN were analysed using mediation analysis to determine whether serum 25(OH)D was a mediator. Based on the U-shaped curve serum 25(OH)D and HTN, we divided serum 25(OH)D concentrations into two groups: (< 57·464 and ≥ 57·464 mmol/l). According to the mediation analysis, when serum 25(OH)D levels are < 57·646 mmol/l, the positive association between TyG index and incident HTN was increased by serum 25(OH)D. The serum 25(OH)D level was estimated to explain 0·98 % of the association between TyG index and HTN (IE: β = 0·000642; P = 0·110; TE: β = 0·062 454; P < 0·001; DE: β = 0·061 812; P < 0·001) (Figure 5(a)). When serum 25(OH)D levels are ≥ 57·646 mmol/l, the negative association between TyG index and HTN was increased by serum 25(OH)D. The serum 25(OH)D level was estimated to explain –2·0 % of the association between TyG index and HTN (IE: β = –0·00218; P = 0·002; TE: β = 0·10 714; P < 0·001; DE: β = 0·10 932; P < 0·001) (Figure 5(b)).
The association between serum 25(OH) D and TyG index. TyG index, Triglyceride–glucose index; 25(OH)D, 25-hydroxyvitamin D.

Mediation analysis of serum 25(OH)D on the interaction between TyG index and hypertension. (a) Mediation models of serum 25(OH)D (< 57·464), TyG index and hypertension: DE (TE = 0·062 454; P < 0·001) of TyG index (exposure) toward hypertension (outcome), and 25(OH)D medication proportion is 0·98 %; IE (IE = 0·000642; P = 0·110) of TyG index (exposure) toward 25(OH)D (mediator) and effect hypertension (DE = 0·061 812; P < 0·001), from 25(OH)D (mediator) toward hypertension (outcome). (b) Mediation models of serum 25(OH)D (≥ 57·464), TyG index and hypertension: DE (TE = 0·10 714; P < 0·001) of TyG index (exposure) toward hypertension (outcome), and 25(OH)D medication proportion is −2·0 %; IE (IE = –0·00218; P = 0·002) of TyG index (exposure) toward 25(OH)D (mediator) and effect hypertension (DE = 0·10 932; P < 0·001), from 25(OH)D (mediator) toward hypertension (outcome). 25(OH)D, 25-hydroxyvitamin D; HTN, hypertension; TyG index, Triglyceride–glucose index.

Subgroup analysis
Subgroup analyses for the associations of TyG index and serum 25(OH)D with HTN were conducted based on different age (< 60/≥ 60), sex (male/female), DM (no/yes) and BMI (< 30/≥ 30) (online Supplementary Figure 1 and 2; Supplementary Table 2 and 3). A significant positive and linear association between TyG index and HTN was found among subjects who were age < 60 years, male or female, with or without DM and BMI < 30 or ≥ 30 kg/m2. Additionally, the U-shaped curve associations of serum 25(OH)D with HTN were found among participants who were age < 60 or ≥ 60 years, male or female, with or without DM and BMI < 30 or ≥ 30 kg/m2. Additionally, we also demonstrated the effect of serum 25(OH)D-mediated TyG index on HTN based on different age (< 60/≥ 60), sex (male/female), DM (no/yes) and BMI (< 30/≥ 30) (online Supplementary Figure 3 and 4).
Sensitivity analysis
In order to avoid bias caused by missing covariate data resulting in potential bias. Therefore, we performed a sensitivity analysis for individuals who were excluded due to missing covariates. Our analysis found that a positive and linear correlation between the TyG index and prevalence of HTN (P for nonlinearity = 0·548; online Supplementary Figure 5(a)). Additionally, a U-shaped curve association existed between serum 25(OH)D and HTN risk (P for nonlinearity = 0·009; online Supplementary Figure 5(b)). Compared with the lowest quartiles (Q1) of TyG index and serum 25(OH)D level, the OR with 95 % CI for HTN across the quartiles were 1·129 (1·003, 1·271), 1·282 (1·131, 1·454) and 1·461 (1·253, 1·705) for TyG index and 0·851 (0·770, 0·940), 0·790 (0·713, 0·874) and 0·850 (0·766, 0·942) for serum 25(OH)D in model 3 (online Supplementary Tables 4 and 5). When serum 25(OH)D levels < 55·208 mmol/l, the positive association between TyG index and incident HTN was increased by serum 25(OH)D. The serum 25(OH)D level was estimated to explain 0·10 % of the association between TyG index and HTN (IE: β = 0·0004846; P = 0·010; TE: β = 0·04 538 272; P < 0·001; DE: β = 0·04 533 426; P < 0·001) (online Supplementary Figure 6(a)). When serum 25(OH)D levels reached ≥ 55·208 mmol/l, the negative association between TyG index and HTN was increased by serum 25(OH)D. The serum 25(OH)D level was estimated to explain –2·0 % of the association between TyG index and HTN (IE: β = –0·00128; P = 0·002; TE: β = 0·07687; P < 0·001; DE: β = 0·07815; P < 0·001) (online Supplementary Figure 6(b)).
Discussion
In this study, the NHANES data was integrated and assessed comprehensively. Firstly, we showed that the TyG index was significantly positively correlated with the odds of HTN. Meanwhile, TyG index increases were correlated with increases in SBP and DBP. As found by Wang D et al., the TyG index may be used to predict the risk of HTN as it has a positive dose–response relationship with SBP, DBP and prevalence of HTN from the Dongfeng–Tongji cohort(Reference Wang, Li and Zhou35). In Mexican adults, Argoty-Pantoja AD et al. also revealed that the TyG index was positively correlated with SBP and DBP and predicted the incidence of HTN(Reference Argoty-Pantoja, Velázquez-Cruz and Meneses-León36). Additionally, among Chinese middle-aged and older adults, Niu ZJ et al. also demonstrated that the TyG index was independently and significantly associated with the incidence of HTN(Reference Niu, Cui and Wei37). This is consistent with our findings. There is still no clear understanding of the mechanism behind the association between the TyG index and change in BP or HTN. HTN and high BP are caused by systematic inflammation, oxidative stress and endothelial dysfunction associated with IR(Reference Sabir, Irfan and Alamgeer, Ullah38,Reference Kumar, Liu and Hsu39) . Moreover, studies have shown that IR is capable of altering Na metabolism, activating the sympathetic nervous system and increasing the secretion of vasoactive substances. As a result, BP will rise and HTN will progress(Reference Horita, Seki and Yamada40–Reference Shimosawa, Ogihara and Matsui42). Additionally, IR is also reported to be associated with obesity and arterial stiffness(Reference Lin, Bai and Wang43,Reference Wu, Xu and Wu44) . As a result of these factors, BP may also be affected. Secondly, serum 25(OH)D and the risk of HTN were associated in a U-shaped pattern. Additionally, serum 25(OH)D levels were also associated with a U-shaped curve in SBP and DBP. Shen et al. suggested that vitamin D deficiency was associated with a higher risk of HTN in non-smoking women of childbearing age(Reference Shen, Xu and Li45). Additionally, Ye et al. also found that adults with HTN who took vitamin D supplements had a lower risk of all-cause mortality, whereas adults with HTN with lower serum 25 (OH)D concentration had higher all-cause mortality(Reference Ye, Li and Liu25). There was a non-linear association between serum 25(OH)D concentration and BP discovered by Che et al. Serum 25(OH)D levels had inversely associated with SBP when concentrations of serum 25(OH)D are < 84 nmol/l. Higher serum 25(OH)D concentrations were associated with higher DBP when concentrations of serum 25(OH)D > 84 nmol/l(Reference Che, Tong and Kuang46). This is also consistent with our findings. There are a number of factors that can contribute to hypotension caused by serum 25(OH)D, but the exact mechanism is unknown. By suppressing the production of renin, serum 25(OH)D reduces BP by downregulating renin–angiotensin–aldosterone system activity(Reference Li, Qiao and Uskokovic47). By stimulating parathyroid hormone 2 receptors on vascular smooth muscle cells, serum 25(OH)D inhibits the production of parathyroid hormone, which can increase BP. Additionally, calcium deposition in arterial walls increases collagen deposition and vessel stiffness by increasing the expression of both receptors of advanced glycation end products and monocyte–macrophage cytokines and IL-6(Reference Simeoni, Perna and Fuiano48). This means that vitamin D deficiency may be an important risk factor for high BP. Therefore, further study of the BP lowering mechanism of vitamin D is now necessary. In this study, for the first time, we demonstrated the potential protective effect of appropriate serum 25(OH)D levels on the TyG index and the prevalence of hypertension in the general US adult population through mediation analysis. Mustafa A et al. found that when serum 25(OH)D had a negative association with TyG index. When serum 25(OH)D reached 23–24 ng/ml, the TyG index remained unchanged(Reference Mustafa and Shekhar49). Liu et al. suggested that in patients with metabolic-associated fatty liver disease, the TyG index is negatively associated with vitamin D status. Vitamin D deficiency may be associated with a high TyG index(Reference Liu, Zhang and Zhao50). Jia et al. also found that a high TyG index is a risk factor for vitamin D deficiency in T2DM. Therefore, proper supplementation of vitamin D in these patients may improve IR(Reference Jia, Song and Li51). Additionally, Vitamin D deficiency increases the risk for T2DM, which might be related to IR(Reference Xiang, Xu and Zhan52). This explains why when serum 25(OH)D levels are < 57·464 mmol/l, the positive association between TyG index and incident HTN was mediated by serum 25(OH)D. As mentioned above, TyG index has been regarded as a reliable and novel indicator of IR. Dhas et al. revealed that sufficient serum 25(OH)D concentration may lower the risk of development of IR(Reference Dhas, Banerjee and Damle53). This is consistent with our results. Mechanistically, low serum 25(OH)D levels may promote the occurrence of HTN through multiple pathways. Firstly, the important role of serum 25(OH)D in Ca homeostasis and vasodilation has been widely studied, and its deficiency may lead to vascular dysfunction and HTN. In addition, the effect of serum 25(OH)D on insulin sensitivity is also one of the potential mechanisms. IR is closely related to the TyG index, which may further aggravate metabolic disorders through serum 25(OH)D deficiency, thereby leading to HTN. Finally, based on the findings of this study, the potential benefits of serum 25(OH)D intervention are especially significant for patients with high IR, as indicated by an elevated TyG index. The association between serum 25(OH)D levels and TyG index may influence the prevalence of HTN. When serum 25(OH)D levels ≥ 57·464 mmol/l, serum 25(OH)D level showed a positive correlation with HTN risk and mediated a negative connection between TyG index and HTN risk. In our study, observations suggested that increased serum 25(OH)D levels appeared to attenuate the relationship between the TyG index and HTN risk. Consequently, for individuals with a notably elevated TyG index, a more proactive approach to vitamin D supplementation might be beneficial.
NHANES employs a complex, multistage sampling design to represent the diversity of the US population. However, our study had several major limitations. Firstly, NHANES data relies primarily on participants’ self-reported information, including health conditions, dietary habits and behaviours. This can introduce biases such as recall bias, social desirability and subjective interpretation, affecting the accuracy and reliability of the data. Secondly, NHANES is a cross-sectional study, meaning data collection is conducted at a specific point in time. Therefore, the study was a cross-sectional assessment of the levels of TyG index and serum 25(OH)D, and monitoring the continuous state of levels of TyG index and serum 25(OH)D is difficult. Therefore, NHANES cannot establish a causal association of TyG index and serum 25(OH)D with the prevalence of HTN. Thirdly, we studied the effect of serum 25(OH)D levels mediating the relationship between TyG index and HTN and were unable to assess the effect of vitamin D intake on the relationship between TyG index and HTN. Fourthly, mediation analysis also could not clarify the causality between serum 25(OH)D concentrations and the TyG index. Finally, the diversity of geographic regions, diet and lifestyle determines the ‘mediation variable’ in mediation analysis that might synergistically affect multiple factors.
Conclusions
In summary, TyG index was positively and linearly associated with HTN, and serum 25(OH)D was U-shaped related to HTN. When vitamin D levels ≥ 57·464 mmol/l, serum 25(OH)D level showed a positive correlation with HTN risk and mediated a negative connection between TyG index and HTN risk. Therefore, increased serum 25(OH)D levels appeared to attenuate the relationship between the TyG index and HTN risk. These observations indicated a potential interaction between serum 25(OH)D levels and the TyG index in relation to HTN risk.
Acknowledgements
We would like to express our gratitude to all of the volunteers who participated in the NHANES.
This study was not supported by any project. Thanks to Zhang Jing (Shanghai Tongren Hospital) for his work on the NHANES database. His outstanding work, nhanesR package and webpage, makes it easier for us to explore the NHANES database.
This work was supported by the National Natural Science Foundation of China (No.82230009) and the National Natural Science Foundation of China (No.82170279).
J. L. and M. C. contributed to hypothesis development and manuscript preparation. J. L. and X. Z. contributed to the study design. M. C. and W. Z. undertook data analyses. J. Y. and Y. Z. drafted and revised the manuscript. All authors approved the final draft of the manuscript for publication.
The authors declare that they have no known competing financial interests or personal relationships.
This study was conducted according to the guidelines laid down in the Declaration of Helsinki, and all procedures involving human subjects/patients were approved by the National Center for Health Statistics obtained institutional review board. Written informed consent was obtained from all subjects/patients.
Supplementary material
For supplementary materials referred to in this article, please visit https://doi.org/10.1017/S0007114525000571