





1. Introduction
Drops impacting a liquid layer frequently occurs in nature as well as in many industrial and technological applications. Common examples are raindrops hitting the surface of a pond, spray coating on a wet substrate, or inkjet printing on a primer layer. These collisions can generate complex scenarios such as floating, bouncing, splashing or jetting, which have been studied extensively (Worthington Reference Worthington1908; Rein Reference Rein1993; Weiss & Yarin Reference Weiss and Yarin1999; Thoroddsen, Etoh & Takehara Reference Thoroddsen, Etoh and Takehara2008; Ajaev & Kabov Reference Ajaev and Kabov2021). Impact velocity, impact angle, droplet size, liquid-layer thickness and the material properties of the liquids are the parameters which determine the impact dynamics. Among the many different impact scenarios, a particularly intriguing phenomenon is reported to occur at sufficiently low impact velocities, in which drops float or bounce on a liquid surface without any direct contact. The earliest reported observation of a drop floating over a liquid surface was made by Reynolds (Reference Reynolds1881) who noticed that under certain circumstances, drops spraying from the bow of a boat or droplets from a shower of raindrops float on liquid surfaces for some seconds before they disappear. Later, Rayleigh (Reference Rayleigh1882) reported the bouncing of drops when collision of two distinct streams of liquids resulted in, under certain circumstances, drops bouncing off each other without merging. The reason for the presence of repulsion forces on impacting droplets even without direct contact with the (liquid) substrate is a build up of lubrication pressure in the draining thin air layer between the droplet and substrate which was first detailed in the theoretical work by Smith, Li & Wu (Reference Smith, Li and Wu2003). The importance of such thin air layers sparks interest in numerous recent investigations of, for example, skating drops (Mandre, Mani & Brenner Reference Mandre, Mani and Brenner2009; Hicks & Purvis Reference Hicks and Purvis2010, Reference Hicks and Purvis2011; Kolinski et al. Reference Kolinski, Rubinstein, Mandre, Brenner, Weitz and Mahadevan2012; Kolinski, Mahadevan & Rubinstein Reference Kolinski, Mahadevan and Rubinstein2014), entrapment of bubbles (Thoroddsen, Etoh & Takehara Reference Thoroddsen, Etoh and Takehara2003; Thoroddsen et al. Reference Thoroddsen, Etoh, Takehara, Ootsuka and Hatsuki2005; Tran et al. Reference Tran, de Maleprade, Sun and Lohse2013; Hendrix et al. Reference Hendrix, Bouwhuis, van der Meer, Lohse and Snoeijer2016), dimple formation under a falling drop (Duchemin & Josserand Reference Duchemin and Josserand2012; van der Veen et al. Reference van der Veen, Tran, Lohse and Sun2012; Li & Thoroddsen Reference Li and Thoroddsen2015) and suppressing of splash (Xu, Zhang & Nagel Reference Xu, Zhang and Nagel2005). Floating/bouncing drops can be observed not only on liquid surfaces, but also on dry surfaces. Such scenarios include drops bouncing on a dry surface (Kolinski et al. Reference Kolinski, Rubinstein, Mandre, Brenner, Weitz and Mahadevan2012, Reference Kolinski, Mahadevan and Rubinstein2014), drops floating on a very hot surface (Leidenfrost effect) (Chandra & Avedisian Reference Chandra and Avedisian1991; Quéré Reference Quéré2013), drops bouncing on a pool of liquid (Rodriguez & Mesler Reference Rodriguez and Mesler1985; Klyuzhin et al. Reference Klyuzhin, Ienna, Roeder, Wexler and Pollack2010), drops floating/bouncing on a vibrating pool of liquid (Couder et al. Reference Couder, Fort, Gautier and Boudaoud2005a,Reference Couder, Protiere, Fort and Boudaoudb) and drops floating on a very cold pool of liquid (inverse Leidenfrost effect) (Adda-Bedia et al. Reference Adda-Bedia, Kumar, Lechenault, Moulinet, Schillaci and Vella2016; Gauthier et al. Reference Gauthier, Diddens, Proville, Lohse and van der Meer2019a,Reference Gauthier, van der Meer, Snoeijer and Lajoinieb).
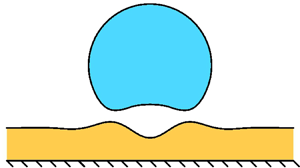
In the present study, we investigate a drop bouncing on a thin liquid film. A schematic diagram is shown in figure 1 highlighting three important stages of a drop bouncing scenario: (a) initial stage (cf. figure 1a), where the drop falls towards a flat film surface in a surrounding gas medium. (b) deformation stage (cf. figure 1b), where the drop's centre of mass velocity changes direction owing to the lubrication force provided by the narrow gas layer separating the two liquids which exceeds the droplet's weight, and large spatial variations of the gas pressure cause large drop and significant thin-film deformations. (c) relaxation stage (cf. figure 1c), where the drop is far from the film surface after the bounce, the gas pressure separating the two liquids is reduced to ambient pressure and the thin-film deformations gradually decay via an intricate relaxation process.
Schematic diagram (not to scale) of a drop bouncing on a thin film in a surrounding gas environment. Three stages in the bounce process are shown: (a) prior to impact, (b) during the bounce, where both the droplet and the oil film deform, and (c) after the bounce, where the oil deformations slowly relax.

Important parameters for the study of drops bouncing on thin liquid layers are the initial depth or height  $h_{f}$ of the liquid layer above an underlying solid substrate and the drop radius $R_{w}$. Experiments by Pan & Law (Reference Pan and Law2007) reveal drop bouncing to be favoured on deep pools which have $h_{f} > R_{w}$, as compared with thick liquid layers which have $h_{f} \approx R_{w}$ and with thin films which have $h_{f} < R_{w}$. It was argued that the solid substrate (wall) restricts the penetration of the falling drop in the thin films, thereby suppressing bouncing. For thin films, the bouncing phenomenon is only observed for drops having moderately low kinetic energy as compared with their surface energy, i.e. $We = \rho _{w} R_{w} v_{w}^{2} \gamma _{w}^{-1} \lesssim 10$, where $We$ denotes the Weber number of the drop, $\rho _{w}$ is the density of the drop, $v_{w}$ the drop impact speed and $\gamma _{w}$ the surface tension of the drop. At sufficiently high impact velocities, the drop contacts the underlying liquid owing to the Van der Waals attraction force between the two liquids. This effect becomes important when the liquid–liquid separation is smaller than around 100 nm (Charles & Mason Reference Charles and Mason1960). The critical Weber number which marks the transition from drop bouncing to merging has been studied by Tang et al. (Reference Tang, Saha, Law and Sun2018), using liquids of different viscosities. They found that the critical Weber number, below which the drop bounces, increases as the liquid viscosity (drop and the thin film) and the thin film thickness are increased. This finding indicates that higher viscosity liquids promote drop bouncing. Similar observations are made in the work of Langley & Thoroddsen (Reference Langley and Thoroddsen2019), where delayed coalescence is observed for drops and thin films with large viscosities. Li, Vakarelski & Thoroddsen (Reference Li, Vakarelski and Thoroddsen2015) found that water drops impacting a thin and extremely viscous film ( ${\sim }1$ mm and ${\sim }10^{4}\ \textrm {Pa}\ \textrm {s}$) did not entrap many microbubbles as compared with regular glass (roughness ${\sim }50$ nm). It was speculated that the film deformations were extremely small, which inhibits the localised contacts before full wetting is established.
Gilet & Bush (Reference Gilet and Bush2012) and Hao et al. (Reference Hao2015) found drop bouncing on a thin film to be similar to bouncing on a super-hydrophobic substrate. One such similarity was the apparent contact time of the drop, which agreed well with the Hertz contact time (Richard, Clanet & Quéré Reference Richard, Clanet and Quéré2002). However, the droplet–film collision resembled an almost elastic collision between the two liquids with the coefficient of restitution close to unity. Pack et al. (Reference Pack, Hu, Kim, Zheng, Stone and Sun2017), Lo, Liu & Xu (Reference Lo, Liu and Xu2017) and Tang et al. (Reference Tang, Saha, Law and Sun2019) used interferometry measurements to obtain the time-resolved evolution of nanometric profiles of the air gap between impacting drops and thin viscous layers. They found a bell-shaped annular air profile with maximum thickness at the centre and minimum thickness at a radially outwards location which varied with time. Small variations in air profiles were observed when the direction of the motion of the impacting drop was slightly oblique relative to the underlying film surface, and when the film thickness was increased from a thin-film to a deep-pool limit. Significant asymmetries were also observed in the evolution of air profiles when comparing the drop spreading stage to the receding stage for a typical bounce process. Lo et al. (Reference Lo, Liu and Xu2017) successfully measured both the drop and the thin-film deformations during the approach process. The thin-film and the air-film deformations were measured using the high-speed confocal profilometry technique and the dual-wavelength interferometry technique respectively. The drop deformation was inferred from the thin-film and the air-film deformations at approximately the same time instance by performing two separate experiments under identical impact conditions. The limitation in their measurement is that the thin-film deformations had a  $1.8\ \mathrm {\mu }\textrm {m}$ vertical resolution and that they could only be obtained for a few time instances before the rupture of the air film.
Previous experimental and numerical studies of drop bouncing on thin films mainly focused either on the macroscopic drop bouncing behaviour or on the evolution of the nanometric gas thickness between the two liquids without providing a distinction between drop and thin-film deformations. All experimental studies except Lo et al. (Reference Lo, Liu and Xu2017) ignore the thin-film deformations owing to the small film thickness and large film viscosity used in the experiments (Gilet & Bush Reference Gilet and Bush2012; Pack et al. Reference Pack, Hu, Kim, Zheng, Stone and Sun2017). They rather assume that the thin liquid film mimics a perfectly smooth solid surface. The numerical studies of thin-film deformations prove challenging because of the large difference in length scales (millimetric to nanometric deformations) when computing the lubrication-gas flow and the thin-film flow simultaneously to drop deformations (Josserand & Zaleski Reference Josserand and Zaleski2003). Although viscous thin-film deformations are typically small, they cannot be neglected since they play a crucial role in modulating the gas-layer thickness, thereby affecting the drop bouncing process and possibly the coalescence of the drop with the thin film at higher impact velocities.
Finally, the thin-film deformations can also give insight into the size and velocity of the impacting drop, much like impact craters are used to determine the size and velocity of impacted bodies. Understanding the size and dynamics of thin-film deformations will allow for the design of liquid-infused surfaces (Quéré Reference Quéré2008), which can reduce lubricant depletion through shearing, cloaking and in the wetting ridge (Smith et al. Reference Smith, Dhiman, Anand, Reza-Garduno, Cohen, McKinley and Varanasi2013; Schellenberger et al. Reference Schellenberger, Xie, Encinas, Hardy, Klapper, Papadopoulos, Butt and Vollmer2015; Kreder et al. Reference Kreder, Daniel, Tetreault, Cao, Lemaire, Timonen and Aizenberg2018).
The objective of this paper is to measure oil-film deformations that arise owing to impacting and rebouncing water drops in an ambient air environment. The impacting water drops have  $We \sim 1$ when inertial and capillary forces roughly balance, thus ensuring that bouncing actually occurs. Thanks to digital holographic microscopy (DHM) we achieve the unprecedented precision down to 20 nm in the vertical resolution at $0.5$ kHz recording speed. To the best of the authors’ knowledge, the sub-micrometre thin-film deformations reported in this experimental work are the first deformation measurements that explicitly document the effect of the air pressure build up under impacting and rebouncing drops.
We describe the structure of the paper. First, in § 2, the experimental set-up and the control parameters are described, and some typical orders of magnitude of the relevant non-dimensional numbers are given, the subsequently presented results are twofold. In § 3, we discuss the film surface deformations immediately after the bouncing event. We quantify how the surface deformations depend on the film thickness, film viscosity and drop impact speed. This part of the paper describes the deformations of the thin film after the end of the deformation stage (cf. figure 1b). The second part of our study is presented in § 4 and focuses on the relaxation stage described previously (cf. figure 1c). We first illustrate a typical relaxation process of film deformations which occur after drop bouncing. Starting from experimentally obtained deformations as initial conditions, we then compare the evolution of the experimental profiles in the relaxation process to a numerical calculation using lubrication theory. Next, we use a general theoretical result of Benzaquen et al. (Reference Benzaquen, Ilton, Massa, Salez, Fowler, Raphaël and Dalnoki-Veress2015) for the relaxation of thin-film deformations. From this we obtain scaling laws for the width broadening  $\lambda (t)$ and amplitude decay $\delta (t)$ during the relaxation process and compare with our experiments over a large range of parameters. Finally, the paper closes with a discussion in § 5.
2. Experimental details
A schematic drawing of the experimental set-up is shown in figure 2. Using a syringe pump, Milli-Q water is slowly dispensed out of a needle tip. As soon as the droplet's weight overcomes the surface tension force, the drop detaches. The detached water droplet of radius  $R_{w} = 1.08$ mm is made to fall on a thin and viscous silicone oil film. The three-dimensional surface topography of the deformed oil film is measured using a digital holography technique, as described later. This information is complemented by simultaneous side-view visualisations of the drop dynamics. The silicone oil films are prepared by the method of spin coating on cleaned glass slides. The thin-film thickness is measured using a reflectometry technique (cf. Reizman Reference Reizman1965). A HR2000 $+$ spectrometer and a HL-2000-FHSA halogen light source by Ocean Optics is used for the reflectometry measurements. The uncertainty in the film-thickness measurement was less than $3.5\,\%$. Table 1 lists the density, dynamic viscosity and surface tension of different liquids used in the present study. The density and dynamic viscosity of air at standard temperature and pressure are $\rho _{a} \approx 1.225\ \textrm {kg}\ \textrm {m}^{-3}$ and $\eta _{a} \approx 1.85\ \mathrm {\mu }\textrm {Pa}\ \textrm {s}$, respectively. The film deformations are measured by varying three important control parameters, namely the oil-film thickness $h_{f}$ which is $5\ \mathrm {\mu }\textrm {m}$, $10\ \mathrm {\mu }\textrm {m}$ or $15\ \mathrm {\mu }\textrm {m}$, the oil-film viscosity $\eta _{f}$ which is 52 mPa s, 98 mPa s or 186 mPa s and the impacting water droplet speed $v_{w}$, for which we choose $0.16\ \textrm {m}\ \textrm {s}^{-1}$ or $0.37\ \textrm {m}\ \textrm {s}^{-1}$. We use the parameters $\eta ^{*} = \eta _{f} \eta _{w}^{-1}$ and $h^{*} = h_{f} R_{w}^{-1}$ to denote the dimensionless viscosity and the dimensionless thickness of the film respectively.
Schematic diagram (not to scale) of the experimental set-up. Bottom view: holographic set-up, positioned underneath the glass substrate, it is used to measure free surface oil-film deformations. Side view: the dynamics of the impacting water drop is characterised with a high-speed camera.

Properties of liquids used in the experiments. Subscripts  $w$ and $f$ represent water and oil film respectively, $\gamma$ is the liquid–air surface tension.

For the measurement of film deformations, a holographic technique is used (Gabor Reference Gabor1949; Schnars et al. Reference Schnars, Falldorf, Watson and Jüptner2016). It is a technique that records a light field (generally transmitted/reflected from objects) to be reconstructed later. Digital holography refers to the acquisition and processing of holograms typically using a CCD camera. The DHM technique (DHM -R1000 by Lyncée Tec) is a reflection-configured holographic device which provides real-time measurements of (at least) 20 nm vertical resolution within the $200\ \mathrm {\mu }\textrm {m}$ measuring window (cf. appendix A). The working principle of the DHM is briefly explained here using the schematic in figure 2. The laser light is split into two beams, a reference and an object beam. The object beam is directed from underneath the glass substrate towards the thin film. A part of the object beam reflects off the thin-film surface and is called the reflected object beam. The reflected object beam (which is slightly oblique) interferes with the undisturbed reference beam to produce a hologram which is recorded by a CCD camera. The thin-film deformations arising from the impacting and rebounding drops are recorded as a sequence of hologram images that are reconstructed later using numerical schemes to obtain the three-dimensional topography of the film surface. A $2.5\times$ objective is used along with the DHM set-up, which provides an approximately $4.90\ \mathrm {\mu }\textrm {m}$ lateral resolution and allows for measurements of a maximum deformation slope up to $2^{\circ }$. A pulse generator connects and approximately synchronises the recordings of the side-view camera and the DHM camera at a temporal resolution of around $0.5$ kHz.
Given the experimental parameters stated in this section, the orders of magnitude of the relevant dimensionless numbers are summarised in table 2. The dimensionless numbers are useful in identifying some qualitative flow features for the deformation stage (cf. figure 1b) and the relaxation stage (cf. figure 1c) pertaining to drop bouncing. For the deformation stage, the low value of the Weber number  $(We \sim 1)$ causes drops to bounce on viscous thin films (Hao et al. Reference Hao2015; Lo et al. Reference Lo, Liu and Xu2017; Pack et al. Reference Pack, Hu, Kim, Zheng, Stone and Sun2017; Tang et al. Reference Tang, Saha, Law and Sun2019). The Reynolds number $Re_{w} \sim 10^{2} \gg 1$ of the flow in the drop and the absence of no-slip boundary conditions allow for the applicability of potential flow theory inside the bouncing drop independent of the substrate underneath (Moláček & Bush Reference Moláček and Bush2012; Hendrix et al. Reference Hendrix, Bouwhuis, van der Meer, Lohse and Snoeijer2016). The low Reynolds number $Re_{a} = \rho _{a} L_{a} v_{a} \eta _{a}^{-1} \sim 10^{-1}$ of the air flow indicates a viscous squeeze flow in thin air gaps during impact. Here $L_{a} \sim R_{w}^{1/2} h_{a}^{1/2}$ is the length scale, $v_{a} \sim v_{w}$ the velocity scale (Mandre et al. Reference Mandre, Mani and Brenner2009) and $h_{a} \sim 1\ \mathrm {\mu }\textrm {m}$ (van der Veen et al. Reference van der Veen, Tran, Lohse and Sun2012).
Relevant dimensionless numbers and their orders of magnitude for both the deformation and the relaxation stage. Subscripts  $w$,
$w$,  $a$ and $f$ represent water, air and oil film, respectively.

For the relaxation stage, the low Reynolds number in the viscous thin film  $Re_{f} = \rho _{f} L_{f} v_{f} \eta _{f}^{-1} \sim 10^{-2}$ indicates applicability of Stokes flow theory, using $L_{f} \sim h_{f}$ and $v_{f} \sim \gamma _{f} \eta _{f}^{-1}$ (Salez et al. Reference Salez, McGraw, Bäumchen, Dalnoki-Veress and Raphaël2012a). Here, $\eta ^{*} \sim 10^{2}$ and $h^{*} \sim 10^{-2}$ suggest small amplitude thin-film perturbations owing to small film thickness in comparison with the lateral length scales ( $h_{f} \ll R_{w}$). Drop size and film thickness are much below the capillary length, so that gravity effects can be neglected.
3. Deformation of viscous thin films
3.1. Typical bouncing experiment
Before turning to a detailed quantitative analysis, we first describe the oil-film deformations observed in a typical experiment. The synchronised recordings of drop bouncing using a high-speed camera and the oil-surface deformation measured using DHM are shown in the respective top and bottom rows in figure 3. The impact and bouncing time instances in figures 3(a)–3(d) are given relative to  $t^{+}$, where $t^{+}$ is the time instance corresponding to the maximum drop spreading during first impact (cf. figure 3b).
Snapshots of a water drop bouncing on an oil film. Drop bouncing behaviour shown in the first row (a–d). Evolution of the oil–air deformation shown in the second row (e–h). Location of impact centre is  $[x,y] = [0,0]$ mm. The time instance $t^{+}$ corresponds to the maximum drop spreading during first impact. The difference between the maximum drop spreading time $t^{+}$ and the reference time $t = 0$ is always around 6 ms in our experiments. The snapshots times in the top row approximately correspond to the surface deformation times in the bottom row, with an uncertainty of 2 ms. The control parameters are $We = 0.38$, $h^{*} = 0.01$ and $\eta ^{*} = 98$.

When the falling water drop is still far from the oil–air interface, the droplet takes on a spherical shape while there is no deformation in the oil surface (cf. figures 3(a) and 3(e)). As the bottom of the falling water drop approaches the oil–air interface, the air pressure builds up in the narrow air gap, deforming both the water–air and oil–air interface. The lubrication air pressure in the narrow air gaps can become sufficiently large to decelerate the falling drop, bringing it to rest (or in apparent contact with the oil–air interface) and cause a reversal in the droplet's momentum, leading to a contactless drop bouncing. The maximum drop spreading and the corresponding oil–air deformation obtained during the apparent contact is shown in figures 3(b) and 3(f). It should be noted that during this phase the holography measurement cannot be trusted quantitatively. This is owing to the fact that when the drop is too close to the oil–air interface (small air gaps,  $h_{a} \lesssim 100\ \mathrm {\mu }\textrm {m}$), additional light reflections from the water–air interface interfere with the measurements of the oil–air interface (cf. appendix A). In particular, the concentric ring structure seen in figure 3(f) is such an artefact. However, as soon as the drop has bounced back and is sufficiently far away from the oil–air interface (large air gaps, $h_{a} \gtrsim 100\ \mathrm {\mu }\textrm {m}$), light reflections from the water–air interface are no longer present, and the measurements of the oil–air interface are quantitatively accurate. Snapshots of the bounced drop, far away from the oil–air interface and the corresponding oil–air deformation are shown in figures 3(c) and 3(g). Subsequent to this, the oil film gradually relaxes under the influence of surface tension, until it is again perturbed by a second impact of the drop (cf. figures 3(d) and 3(h)).
We remark that the drop bouncing is observed for at least seven cycles. The drop gradually jumps away from the first impact location owing to small horizontal impact speeds and by the end of the eighth cycle the drop is completely out of the side-view imaging window. We did not observe the drop to wet the surface within our experimental time limits.
Figure 4(a) presents a typical surface topography of the oil–air interface after the bounce. The corresponding azimuthally averaged deformation profile is shown in figure 4(b), where, in this case, the average is performed over the full annulus within  $0 \leqslant \theta < 2 {\rm \pi}$. In the remainder, we choose $t = 0$ as the earliest time when clean DHM measurements are obtained after the drop bounce-off process (cf. appendix A). We remark that the difference between the maximum drop spreading time $t^{+}$ and the reference time $t = 0$ is always around 6 ms in our experiments. This value is in very good agreement with half the apparent contact time of water on viscous thin films under similar impacting velocities (Hao et al. Reference Hao2015). Therefore, the choice of $t=0$, which is determined through the experimental set-up, can be thought to serve as a transitional time instance between the deformation and the relaxation stages (cf. figure 1b,c). Figure 4(a) shows that deformations are highly localised, within a narrow annulus $r_{an} \approx 0.6 \text {--}0.8$ mm. Given that flow inside the viscous film requires pressure gradients, such localised deformations suggest that spatial variations of air pressure during the bounce are highly localised during impact (cf. figure 1b). The appearance of such an annulus is reminiscent of dimple formation underneath an impacting drop: an annular local minimum of the air gap is seen for drops impacting a dry substrate (Mandre et al. Reference Mandre, Mani and Brenner2009; Hicks & Purvis Reference Hicks and Purvis2010; Bouwhuis et al. Reference Bouwhuis, van der Veen, Tran, Keij, Winkels, Peters, van der Meer, Sun, Snoeijer and Lohse2012; Kolinski et al. Reference Kolinski, Rubinstein, Mandre, Brenner, Weitz and Mahadevan2012; van der Veen et al. Reference van der Veen, Tran, Lohse and Sun2012), drops impacting a thin liquid film (Hicks & Purvis Reference Hicks and Purvis2011) and drops impacting a liquid pool (Hendrix et al. Reference Hendrix, Bouwhuis, van der Meer, Lohse and Snoeijer2016). We therefore hypothesise that the radial location of the deformation correlates to the minimum of the air gap during drop impact. The correlation cannot be proven directly in our experiments because we do not measure the evolution of the air-gap thickness. The minimum air gap is at least two orders of magnitude smaller than the resolution of the side-view camera, preventing a direct measurement (cf. figure 3b). However, Kolinski et al. (Reference Kolinski, Rubinstein, Mandre, Brenner, Weitz and Mahadevan2012, Reference Kolinski, Mahadevan and Rubinstein2014), van der Veen et al. (Reference van der Veen, Tran, Lohse and Sun2012), de Ruiter et al. (Reference de Ruiter, Oh, van den Ende and Mugele2012) and de Ruiter, Mugele & van den Ende (Reference de Ruiter, Mugele and van den Ende2015) have shown that the minimum air gap ( ${\sim }100$ nm) moves at some radial location away from the impact location. Lo et al. (Reference Lo, Liu and Xu2017) reports that the minimum air gap occurs at a slightly larger radius than the minimum in oil-film thickness. However, the time resolution of the measurements was insufficient to quantify the general result. We expect a similar motion of the minimum air gap in our experiments which will form the deformation in a radial position.
(a) Surface topography of the oil–air interface at  $t = 0$. The radial locations of the apparent drop contact and the maximum drop spread are about $0.74$ mm and $1.18$ mm, respectively, which are plotted as blue and orange circular arcs. (b) Azimuthally averaged deformation profile over the full annulus at $t = 0$. We define the wave characteristics $\delta$ (amplitude) and $\lambda$ (wavelength). The control parameters are $We = 0.38$, $h^{*} = 0.01$ and $\eta ^{*} = 98$.

In the present experiments, the oil-surface deformations at  $t = 0$ are not perfectly axisymmetric (cf. figure 4a). This small asymmetry is attributed to a small horizontal impact speed, which is difficult to eliminate experimentally. This small horizontal speed affects the air-layer thickness during the bounce process (Lo et al. Reference Lo, Liu and Xu2017), leaving an asymmetric imprint on the oil layer. We remark that figure 4(b) defines two quantities that will be used later to characterise the wave: the amplitude $\delta$, and the wavelength $\lambda$, respectively defined as the vertical and horizontal distance from the minimum to the maximum of the film. In the remainder we will average the profiles only over one quadrant centred around $\theta = {\rm \pi}/4$. We choose this window in particular to be consistent with the averaging procedure for lower and higher impact speeds. At higher impact speeds, the deformations are spread out farther from the impact centre resulting in the restrictive usage of the quadrant. Although the averaging is more appropriate around the principal direction of asymmetry (line joining the first and the second impact centre) which is along $\theta = 3{\rm \pi} /8$, we find no significant variations in the deformation parameters. For the deformation in figure 4(a), the differences in $\lambda$ and $\delta$ between the averaging windows centred around $\theta = {\rm \pi}/4$ and $3{\rm \pi} /8$ are found to be around $4.2\ \mathrm {\mu }\textrm {m}$ and 17 nm which are well within the order of the experimental resolution.
3.2. Influence of film properties and drop impact velocity
We now study the influence of the film thickness and the film viscosity on the surface deformations left behind after impact. Figures 5(a)–5(d) show the surface topographies at  $t = 0$ in one quadrant. Figures 5(e) and 5(f) show the corresponding azimuthally averaged deformation profiles at $t = 0$, averaged over the quadrant. Clearly, a decrease in deformation amplitude $\delta$ is seen with a decrease in initial film thickness (cf.rows in figures 5(a)–5(d) and 5(e)). On the other hand, a decrease in deformation amplitude is seen with an increase in film viscosity (cf.columns in figures 5(a)–5(d) and 5(f)).
(a–d) Surface topographies of the oil–air interface at  $t = 0$ in a quadrant $0 \leqslant \theta < {\rm \pi}/ 2$. (e,f) Azimuthally averaged deformation profile over the quadrant at $t = 0$. The control parameters are $We = 0.38$, $h^{*} = 0.005\text {--}0.015$ and $\eta ^{*} = 52\text {--}186$.

To further quantify this, we plot the initial amplitude  $\delta _{0} = \delta (t = 0)$ as functions of film thickness, film viscosity and initial amplitude in figures 6(a), 6(b) and 6(c). From these plots we empirically deduce that the scaling of the initial amplitude is consistent with $\delta _{0} \sim h_{f}^{2} \eta _{f}^{-1}$ and $\delta _{0} \sim \lambda _{0}^{7/2}$, though the data only cover less than one decade in $h_{f}$ and $\eta _{f}$. The $\delta _{0} \sim h_{f}^{2} \eta _{f}^{-1}$ scaling is not immediately obvious, because the ‘mobility’ of a thin layer flow is known to scale as $h_{f}^{3} \eta _{f}^{-1}$ (Oron, Davis & Bankoff Reference Oron, Davis and Bankoff1997).
Scaling of the initial amplitude with film thickness, film viscosity and initial wavelength. The  $\delta _{0}$ and $\lambda _{0}$ values are obtained from averaging in a quadrant $0 \leqslant \theta < {\rm \pi}/2$. The mean and error-bar values of $\delta _{0}$ and $\lambda _{0}$ are based on three experimental repeats. The control parameters are $We = 0.38$, $h^{*} = 0.005\text {--}0.015$ and $\eta ^{*} = 52\text {--}186$.

Next, we study the influence of the impact velocity on the surface deformations left behind after impact. Figures 7(a) and 7(b) show the surface topographies at  $t = 0$ for two different impact velocities. Figure 7(c) shows the corresponding azimuthally-averaged deformation profiles. For the higher impact velocity (cf. figure 7b), two distinct peaks in deformation are observed, we emphasise that the profile corresponds to a single impact. This is in contrast with the single peak that appears at lower velocity (cf. figure 7a). Moreover, the deformations are more radially spread out for the higher impact speed as compared with lower impact speed. The transition from one peak to two peaks and the increased radial spread is reminiscent of the transition from single-dimple to double-dimple formation under a falling drop, as previously observed on dry surfaces (de Ruiter et al. Reference de Ruiter, Oh, van den Ende and Mugele2012, Reference de Ruiter, Mugele and van den Ende2015). This again suggests that the film deformation directly reflects the structure of the dimple below the impacting drop.
(a,b) Surface topographies of the oil–air interface at  $t = 0$ in a quadrant $0 \leqslant \theta < {\rm \pi}/ 2$. (c) Azimuthally averaged deformation profile over the quadrant at $t = 0$. The control parameters are $We = 0.38\text {--}2.0$, $h^{*} = 0.01$ and $\eta ^{*} = 98$.

4. Relaxation of viscous thin-film deformations
4.1. Space–time plot of a typical relaxation process
We now reveal the relaxation of viscous thin-film deformations after the impact process. When the drop is far away from the film surface after the bounce, the air pressure is again homogeneous and no longer provides any forcing to the film. As a consequence the film deformations gradually decay via an intricate relaxation process, under the influence of surface tension. Figure 8 provides a space–time plot of a typical relaxation process, over two decades in time ( $t \sim 0.01 \text {--}1\ \textrm {s}$). The figure corresponds to an azimuthal average of surface deformation within a quarter annulus ( $0 \leqslant \theta < {\rm \pi}/2$). The lines indicate the loci of deformation maxima (orange), minima (blue) and zero crossing (green). These lines highlight that the deformation involves a decay in amplitude as well as a broadening of the lateral width of the deformation profile. Note that during this process, the position of the zero crossing (green line) remains approximately constant.
Space–time plot of the relaxation process. Initial and final deformations are plotted as black lines. Loci of deformation maxima, minima and zero crossings are plotted as orange, blue and green lines, respectively. A secondary deformation occurs at  $t\approx 25$ ms near the impact centre owing to the next impact process. The control parameters are $We = 0.38$, $h^{*} = 0.01$ and $\eta ^{*} = 98$.

4.2. Numerical simulation
We perform numerical simulations in order to study the relaxation process of the viscous thin films. The relaxation process is modelled using lubrication theory (Reynolds Reference Reynolds1886; Oron et al. Reference Oron, Davis and Bankoff1997). Lubrication theory relies on the following conditions, which are indeed satisfied in the experiment, namely, (i) viscous forces in the film dominate over inertial forces ( $Re_{f} \sim 10^{-2} \ll 1$) and (ii) deformation amplitudes in vertical direction are much lower than the characteristic lateral length scale ( $\delta /\lambda \sim 10^{-2} \ll 1$). As a boundary condition, we consider the free surface to be in contact with a homogenous gas pressure, as is the case after rebound, whereas there is a no-slip boundary condition at the substrate. The corresponding lubrication (thin-film) equation reads (Oron et al. Reference Oron, Davis and Bankoff1997):
 \begin{equation} \partial_{t} h + \frac{\gamma_{f}}{3 \eta_{f}} {\boldsymbol{\nabla}} \boldsymbol{\cdot} \left\{ h^{3} {\boldsymbol{\nabla}} \left( {\boldsymbol{\nabla}}^{2}h\right) \right\} = 0, \end{equation}
where  $h(x,y,t)$ is the vertical distance between the solid substrate and the free surface and ${\boldsymbol {\nabla }}$ is the two-dimensional gradient operator in the $x$–
$x$– $y$ plane. We perform a non-dimensionalisation of (4.1) by $h = h_{f} H$, $r = h_{f} R$ and $t = (3 \eta _{f} h_{f} \gamma _{f}^{-1}) T$, where $h_{f}$ is the initial film thickness. In the following, we study the relaxation process in an axisymmetric geometry, i.e. $H=H(R,T)$ such that (4.1) becomes
 \begin{equation} \partial_{T} H + \frac{1}{R} \partial_{R} \left[ R H^{3} \left( \partial_{R}^{3} H + \frac{1}{R} \partial_{R}^{2} H - \frac{1}{R^{2}} \partial_{R} H \right) \right] = 0. \end{equation}
 The asymptotics of (4.2) has also been studied by Salez et al. (Reference Salez, McGraw, Cormier, Bäumchen, Dalnoki-Veress and Raphaël2012b). Importantly, (4.2) is devoid of any free parameters. To compare with experiment, we perform a numerical simulation of film relaxation using a finite-element method and a second-order implicit Runge–Kutta time-stepping scheme (implemented using the framework dune-pdelab by Bastian et al. (Reference Bastian, Blatt, Dedner, Engwer, Klöfkorn, Kornhuber, Ohlberger and Sander2008a,Reference Bastian, Blatt, Dedner, Engwer, Klöfkorn, Ohlberger and Sanderb); Bastian, Heimann & Marnach (Reference Bastian, Heimann and Marnach2010)). The deformation profile at  $t = 0$ is taken from the experiment and used as an initial condition, and subsequently the film profile is evolved via numerical integration of (4.2). A direct comparison between the experiments and the lubrication theory is given in figure 9 without any adjustable parameters. Figure 9(a) shows the amplitude $\delta$ (defined as the difference between maximum and minimum of $\Delta h$) as a function of time, whereas figure 9(b) shows the deformation profiles $\Delta h = h(r,t) - h_{f}$ at different times. The comparison shows very good agreement between the experiment and the numerical calculations, demonstrating the success of the lubrication approximation to describe the experimentally observed relaxation.
(a) Comparison of amplitude decay between experiment and numerics. The mean and error-bar values of  $\delta$ are obtained by discarding every 25 data points. (b–d) Comparison of film deformation between experiment and numerics at $t_{1} = 14$ ms, $t_{2} = 252$ ms and $t_{3} = 966$ ms. The control parameters are $We = 0.38$, $h^{*} = 0.01$ and $\eta ^{*} = 52$.

4.3. Theoretical analysis
Now we turn to a detailed theoretical analysis of the relaxation process, from which we will establish the general scaling laws of the relaxation. To do this, we reduce the lubrication equation to a one-dimensional geometry  $h = h(x,t)$. Here, we use $X = x/h_{f}$ analogous to $R = r/h_{f}$. The rationale behind choosing a one-dimensional lubrication equation is that the initial deformations are far from the impact centre (cf. figure 5). This is further quantified in figure 8, where the ‘width’ of the profile is initially an order of magnitude smaller than the location of the zero crossing. Therefore, the axisymmetric relaxation and a one-dimensional relaxation will yield very similar results, at least until the deformations approach the impact centre and the azimuthal contributions become important.
The one-dimensional lubrication equation reads
 \begin{equation} \partial_{T} H + \partial_{X} \left( H^{3} \partial_{X}^{3} H \right) = 0. \end{equation}
To further simplify the analysis, we use the fact seen in the experiments, that the deformation amplitudes are small in comparison with the initial film thicknesses ( $\delta /h_{f} \sim 0.05 \ll 1$). This allows us to linearise (4.3) employing the variable transformation $Z = h/h_{f} - 1 = H - 1$ where $|Z| \ll 1$. The linearised one-dimensional lubrication equation then reads
 \begin{equation} \partial_{T} Z + \partial_{X}^{4} Z = 0. \end{equation}
The relaxation of localised thin-film perturbations described by (4.4) was analysed in great detail by Salez et al. (Reference Salez, McGraw, Bäumchen, Dalnoki-Veress and Raphaël2012a), McGraw et al. (Reference McGraw, Salez, Bäumchen, Raphaël and Dalnoki-Veress2012), Bäumchen et al. (Reference Bäumchen, Benzaquen, Salez, McGraw, Backholm, Fowler, Raphaël and Dalnoki-Veress2013), Backholm et al. (Reference Backholm, Benzaquen, Salez, Raphaël and Dalnoki-Veress2014), Benzaquen, Salez & Raphaël (Reference Benzaquen, Salez and Raphaël2013), Benzaquen et al. (Reference Benzaquen, Fowler, Jubin, Salez, Dalnoki-Veress and Raphaël2014, Reference Benzaquen, Ilton, Massa, Salez, Fowler, Raphaël and Dalnoki-Veress2015) and Bertin et al. (Reference Bertin, Niven, Stone, Salez, Raphael and Dalnoki-Veress2020). They obtained the long-time asymptotic solution in terms of a moment expansion,
 \begin{equation} Z (X,T) = \frac{\mathcal{M}_{0} \phi_{0} (U)}{T^{1/4}} + \frac{\mathcal{M}_{1} \phi_{1} (U)}{T^{2/4}} + \frac{1}{2} \frac{\mathcal{M}_{2} \phi_{2} (U)}{T^{3/4}} + \dots, \end{equation}
which involves the similarity variable
 \begin{equation} U = X T^{{-}1/4}, \end{equation}
and similarity functions  $\phi _{n} (U)$ that can be determined analytically (Benzaquen et al. Reference Benzaquen, Salez and Raphaël2013, Reference Benzaquen, Fowler, Jubin, Salez, Dalnoki-Veress and Raphaël2014, Reference Benzaquen, Ilton, Massa, Salez, Fowler, Raphaël and Dalnoki-Veress2015). The amplitudes $\mathcal {M}_{n}$ appearing in (4.5) can be determined from the initial condition $Z_0(X)=Z(X,0)$, by computing the moments
 \begin{equation} \mathcal{M}_{n} = \int \xi^{n} \, Z_{0}(\xi) \, \textrm{d} \xi, \quad n=0,1,2,\ldots \end{equation}
 It is clear from (4.5) and the similarity variable (4.6) that the width  $\lambda$ of the profile follows a universal scaling of the form $\lambda \sim T^{1/4}$. The decay of the amplitude $\delta$ is more subtle, because each term in (4.5) decays differently, as $\delta \sim T^{-(n+1)/4}$ for the $n$th moment. At late times, the solution $Z (X,T)$ thus converges towards the lowest-order term with a non-zero moment. Generically, for $\mathcal {M}_0\neq 0$, the amplitude will therefore decay as $T^{-1/4}$. In our case, however, the perturbation originates from an initially flat film, and by incompressibility of the layer, the perturbation is thus expected to have a vanishing volume, i.e. $\mathcal {M}_{0} = 0$. In the present context, the lowest-order moment is therefore expected to be $\mathcal {M}_{1} \neq 0$. In this scenario, the scaling law will be $\delta \sim T^{-1/2}$, whereas the solution $Z (X,T)$ should converge to $\phi _{1}(U)$ for a zero-volume perturbation. A schematic depiction of the approach to the $\phi _{1}(U)$ attractor is shown in figure 10.
Schematic illustrating of the approach to the attractor function  $\phi _{1}(U)$. The initial deformations are zero-volume perturbations having moments $\mathcal {M}_{0} = 0$ and $\mathcal {M}_{1} \neq 0$. Adapted from Benzaquen et al. (Reference Benzaquen, Fowler, Jubin, Salez, Dalnoki-Veress and Raphaël2014, Reference Benzaquen, Ilton, Massa, Salez, Fowler, Raphaël and Dalnoki-Veress2015).

To verify this scenario, we turn to an exemplary initial deformation profile of a 98 mPa s,  $10 \ \mathrm {\mu } \textrm {m}$ film, and probe the subsequent relaxation. For the specific example, the two lowest-order moments are determined as $\mathcal {M}_{0} \approx 6.4 \times 10^{-2}$ and $\mathcal {M}_{1} \approx 3.2$. The very small value of $\mathcal {M}_{0}$ is of the order of the experimental resolution (i.e. it corresponds to typical variations of $\Delta h \sim \pm 10$ nm), so that the perturbation has a negligible volume. Figure 11 reveals that the relaxation is indeed governed by $\mathcal {M}_1$, and approaches the $\phi _{1}(U)$ self-similar attractor function (cf. appendix B). The figure reports the scaled deformation profiles centred around the zero-crossing location $X_{0} \approx 65$. The first row shows the deformation profile scaled with the initial film thickness. The second row shows the rescaled deformation profiles (vertical scale ${\sim } T^{-1/2}$ and horizontal scale ${\sim }T^{1/4}$). During late times, the rescaled deformation profiles clearly approach the attractor function $\phi _{1}(U)$, which is superimposed on the data. This excellent match confirms that, within the experimental times, the axisymmetric effects have not yet started to contribute and the theoretical analysis of the film-relaxation process over a one-dimensional geometry is sufficient to understand the relaxation process in the experiments.
(a) Time evolution of the normalised deformation profiles  $Z$ versus $X$. A secondary deformation occurs at $T \approx 160$ near the impact centre owing to the next impact process (cf. figure 8). (b) Time evolution of the scaled normalised deformation profiles $\hat {Z}$ versus $\hat {U}$. The self-similar attractor function $\phi _{1}(U)$ is plotted as a black line. Here, $X_{0} \approx 65$ and $\mathcal {M}_{1} \approx 3.2$. The scaled and rescaled deformations are colour coded with time: yellow to red as time increases. The control parameters are $We = 0.38$, $h^{*} = 0.01$ and $\eta ^{*} = 98$.

4.4. Width broadening and amplitude decay
Finally, we compare theoretical asymptotic scaling laws for the width broadening and amplitude decay with a large number of experiments, all attained for a drop impact velocity of  $v_{w} \approx 0.16\ \textrm {m}\ \textrm {s}^{-1}$. We predict the scaling law for the width $\lambda$ quantitatively, based on the approach to the attractor function $\phi _{1}$. We formally define the half-width of the similarity function as $U_{1}^{*} = \text {arg max}|\phi _{1}(U)| \approx 1.924$, which is half the absolute distance between global maxima and global minima (cf. figure 11). From (4.6), we then find
 \begin{equation} \frac{\lambda}{2h_f } \simeq U_{1}^{*} T^{1/4}, \end{equation}
expressing the dimensionless (half) width of the decaying profiles. A practical problem arises when comparing with experiment, at  $t=0$, the width takes on a finite value $\lambda _0$, so that it is initially incompatible with the form (4.8). To resolve this, we follow Benzaquen et al. (Reference Benzaquen, Ilton, Massa, Salez, Fowler, Raphaël and Dalnoki-Veress2015) and define for each experiment a convergence time $T_{\lambda }$ through $\lambda _{0} / 2h_{f} = U_{1}^{*} T_{\lambda }^{1/4}$ (cf. appendix C). The physical meaning of $T_{\lambda }$ is that it provides a time at which the experiment should approach the asymptotic power law (4.8). Using this definition of $T_\lambda$, the scaling (4.8) then gives
 \begin{equation} \lambda/\lambda_{0} \simeq \left( T/T_{\lambda}\right)^{1/4}, \end{equation}
which can be compared with experiments without adjustable parameters.
In figure 12, we show the temporal dependence  $\lambda /\lambda _{0}$ versus $T/T_{\lambda }$ for different initial film thicknesses and viscosities. The black dashed line in the figure represents (4.9). Clearly, all experimental data points seem to collapse on to a single master curve which is independent of the film properties used. Moreover, the master curve has a very good agreement with (4.9). We remark that such a scaling $\lambda \sim t^{1/4}$ is also seen in previous studies with viscous thin film configurations (McGraw et al. Reference McGraw, Salez, Bäumchen, Raphaël and Dalnoki-Veress2012; Salez et al. Reference Salez, McGraw, Bäumchen, Dalnoki-Veress and Raphaël2012a; Benzaquen et al. Reference Benzaquen, Ilton, Massa, Salez, Fowler, Raphaël and Dalnoki-Veress2015; Hack et al. Reference Hack, Costalonga, Segers, Karpitschka, Wijshoff and Snoeijer2018). Please note that during late times, some experiments show the width broadening to slowly deviate from the 1/4 scaling as seen in figure 12. We suppose the deviations to come from one-dimensional to radial symmetry geometry transition and from the wave interactions coming from the second-drop rebound which can contribute during late times.
Double logarithmic plot of  $\lambda / \lambda _{0}$ versus $T / T_{\lambda }$. The mean and error-bar values of $\lambda /\lambda _{0}$ are obtained by binning every 25 data points. The black dashed line represents $\lambda /\lambda _{0} = ( T / T_{\lambda } )^{1/4}$. The control parameters are $We = 0.38$, $h^{*} = 0.005\text {--}0.015$ and $\eta ^{*} = 52\text {--}186$.

A similar analysis is performed for the amplitude decay. We once again make use of the self-similar attractor  $\phi _{1} (U)$ for the relaxation process. Like the procedure outlined for the study of the width broadening, we employ (4.5), which implies
 \begin{equation} \frac{\delta}{2 h_{f}} \simeq \mathcal{M}_{1} \frac{ | \phi_{1}(U^{*}) | } {T^{1/2}}, \end{equation}
where  $| \phi _{1}(U^{*}) |\approx 0.1164$ is the maximum of the similarity function (cf. figure 11). To avoid the experimental problem that $\delta _0$, the amplitude at $t=0$, is finite, we once again determine for each experiment a convergence time $T_{\delta }$, using $\delta _{0}/(2h_{f}) = \mathcal {M}_{1} | \phi _{1}(U^{*}) | /{T_{\delta }^{1/2}}$ (cf. appendix C). Note that both $\delta _{0}$ and $\mathcal {M}_{1}$ will be different for each specific experiment, but both parameters can be determined independently. This finally gives that (4.10) can be written as
 \begin{equation} \delta/\delta_{0} \simeq (T/T_{\delta})^{{-}1/2}. \end{equation}
 The result for  $\delta /\delta _{0}$ versus $T/T_{\delta }$ for different film thicknesses and different viscosities are shown in figure 13. The black dashed line in the figure represents (4.11). While experiments exhibit a very good agreement with the numerical lubrication solution (cf. figure 9), it is difficult to infer the scaling behaviour from individual realisations. However, it is clear that the rescaled amplitude plot of figure 13 is consistent with the predicted asymptotic decay. Indeed, the data seem to approach the 1/2 scaling law, as indicated by the dashed line.
Double logarithmic plot of  $\delta / \delta _{0}$ versus $T / T_{\delta }$. The mean and error-bar values of $\delta /\delta _{0}$ are obtained by binning every 25 data points. The black dashed line represents $\delta / \delta _{0} = ( T / T_{\delta } )^{-1/2}$. The control parameters are $We = 0.38$, $h^{*} = 0.005\text {--}0.015$ and $\eta ^{*} = 52\text {--}186$.

5. Conclusions and outlook
In this work, we have performed experiments of a water drop impacting a viscous thin oil film in an ambient air environment. The considered drop impact velocities are restricted to moderately low values  $We \sim 1$ at which drops bounce on thin films, owing to the air cushioning effect. DHM was employed to measure the deformations of the free oil-film surfaces that occur owing to the bouncing of drops with an unprecedented precision, allowing for the one-to-one comparison with lubrication theory.
We first investigated the deformations of the thin film immediately after rebound ( $t = 0$), while varying the oil-film thickness $h_{f}$, oil viscosity $\eta _{f}$ and the impact velocity $v_{w}$ of the drop. We found that the deformation amplitude after the bounce $\delta _{0}$ varies quadratically with oil-film thickness $\delta _{0} \sim h_{f}^{2}$ and inversely with the oil viscosity $\delta _{0} \sim \eta _{f}^{-1}$. When increasing the impact speed from $v_{w}\approx 0.16\ \textrm {m}\ \textrm {s}^{-1}$ to $v_{w}\approx 0.37\ \textrm {m}\ \textrm {s}^{-1}$, the deformations in the thin film change even qualitatively. While at lower speeds, a single annular wavy deformation is found, at higher speeds the radial profiles exhibit two such depressions and peaks at two different radii.
In the second part of the paper, we have detailed the relaxation process of the viscous thin films when the drop is far away from the free oil surface, after the bounce. Numerical calculations based on lubrication theory using the experimental deformations at  $t = 0$ as initial condition show an excellent match with the experimentally measured evolution of the deformation profiles. Furthermore, we have successfully used a theoretical analysis developed by Benzaquen et al. (Reference Benzaquen, Salez and Raphaël2013, Reference Benzaquen, Fowler, Jubin, Salez, Dalnoki-Veress and Raphaël2014, Reference Benzaquen, Ilton, Massa, Salez, Fowler, Raphaël and Dalnoki-Veress2015) to obtain analytical results describing the relaxation process. Thus, taking advantage of the fact that the deformations approach a universal self-similar attractor, at late times of the relaxation process the decay of the amplitude and the growth of the width of the deformations can be described without any free parameters. This allows us to collapse the corresponding experimental curves for all different thin-film properties investigated.
Measuring the deformations of the falling drop and the viscous thin film simultaneously has proven challenging in the previous literature (Lo et al. Reference Lo, Liu and Xu2017) and in the present experiments. However, it is worthwhile to investigate the dynamics of the coupled system as this might provide valuable insight in the deformation mechanism. To resolve both the drop–air and the oil–air interface, we therefore plan to combine the colour interferometry technique by van der Veen et al. (Reference van der Veen, Tran, Lohse and Sun2012), which can be used to extract the narrow air profiles, with the DHM technique described in the present manuscript. In order to understand the film deformations theoretically and to quantify possible influences on the macroscopic drop dynamics, the macroscopic impact dynamics have to be coupled to a two-layer lubrication model for the air layer and for the oil-film layer. Very recently, such a lubrication approach has been pursued Duchemin & Josserand (Reference Duchemin and Josserand2020) for the coalescence of a drop with an underlying thin film. Also, when combining colour interferometry with DHM, it can be tested against controlled experiments.
Funding
This project has received funding from the European Union's Horizon 2020 research and innovation programme under the Marie Sklodowska-Curie grant agreement No. 722497 and by the Max Planck Center Twente for Complex Fluid Dynamics. K.H. acknowledges funding from the German Science Foundation DFG within grants HA8467/1 and HA8467/2-1. We thank G.-W. Bruggert for constructing the impact set-up, G. Lajoinie for the insightful comments on the DHM results, M. Hack for aiding with the three-dimensional image graphics and M. Zhakharova for fabricating the PDMS gels.
Declaration of interests
The authors report no conflict of interest.
Appendix A. Measuring thin-film deformations using DHM
Figure 14(a) shows a schematic diagram where the drop has just moved out of the DHM measuring window, after the bounce. The height of the measuring window is roughly  $200\ \mathrm {\mu }\textrm {m}$. Here, we define $t = 0$ as the first instance when the DHM measuring window is devoid of the water–air interface allowing for a clean measurement of the oil–air deformation. The object beam (consisting of reflection wavefronts from the measuring window) and the reference beam in the DHM interfere to form the holographic pattern recorded by the DHM camera.
(a) Schematic diagram at  $t = 0$ when the drop has just left the DHM measuring window after the bounce. (b) Phase image of the oil–air deformation at $t=0$. The control parameters are $We = 0.38$, $h^{*} = 0.01$ and $\eta ^{*} = 98$.

The recorded holograms are converted into their constituent intensity and phase information, wherein the phase information is used to reconstruct the height information. Figure 14(b) shows an exemplary phase image at time  $t = 0$. The reconstructed height profile of this phase image is shown in figure 4(a).
To check whether the weak reflection of the glass–oil interface affects the measurements of the oil–air deformation in the bounce experiments, we perform a simple calibration experiment. The calibration experiment is performed to measure the (known) PDMS gel–air profile through glass. Figure 15 shows the comparison of the real and the measured PDMS gel–air deformation. We confirm that the flat glass–PDMS gel interface (and similarly the flat glass–oil film interface) does not affect the measurements of the thin-film deformations. A vertical resolution of around 20 nm is obtained from the calibration plot. It is important to note that the vertical resolution can be well below 20 nm. This is only a conservative estimate because the real PDMS gel profile can suffer from small tilt issues and from surface roughness during its fabrication, which are not accounted for here.
Comparison of thin PDMS gel profiles of a known curvature.

Appendix B. Similarity function  $\phi _{1}(U)$

In principle, the similarity functions  $\phi _{n} (U)$ are completely covered in the works of Benzaquen et al. (Reference Benzaquen, Salez and Raphaël2013, Reference Benzaquen, Fowler, Jubin, Salez, Dalnoki-Veress and Raphaël2014, Reference Benzaquen, Ilton, Massa, Salez, Fowler, Raphaël and Dalnoki-Veress2015), but here we provide the expression for the similarity function $\phi _{1} (U)$ as a reference. The expression for $\phi _{1} (U)$ reads
 \begin{align} \phi_{1} (U) &={+} \frac{U}{4 {\rm \pi}} \varGamma \left( \frac{3}{4} \right) {}_{0}H_{2} \left[ ; \left\{ \frac{5}{4}, \frac{3}{2}\right\}; \frac{U^{4}}{256} \right] \nonumber\\ &\quad - \frac{U^{3}}{24 {\rm \pi}} \varGamma \left( \frac{5}{4} \right) {}_{0}H_{2} \left[ ; \left\{ \frac{3}{2}, \frac{7}{4}\right\}; \frac{U^{4}}{256} \right] \nonumber\\ &\quad + \frac{U^{5}}{960 {\rm \pi}} \varGamma \left( \frac{3}{4} \right) {}_{0}H_{2} \left[ ; \left\{ \frac{9}{4}, \frac{5}{2}\right\}; \frac{U^{4}}{256} \right], \end{align}
where  $\varGamma$ and ${}_{0}H_{2}$ are the gamma function and the $(0,2)$-hypergeometric functions, respectively. The $(0,2)$-hypergeometric function is defined as
 \begin{equation} {}_{0}H_{2} \left[ ; \left\{ a, b \right\}; w \right] = \sum_{n=0}^{\infty} \frac{1}{(a)_{n}\,(b)_{n}} \frac{w^{n}}{n!}, \end{equation}
where  $(.)_{n}$ is the Pochhammer notation for the rising factorial.
Appendix C. Convergence times $T_{\lambda }$ and $T_{\delta }$


The expressions for the convergence times  $T_{\lambda }$ and $T_{\delta }$ are given by
 \begin{equation} T_{\lambda} = \left( \frac{\lambda_{0}}{2 h_{f} U_{1}^{*} } \right)^{4} \quad \textrm{and} \quad T_{\delta} = \left( \frac{2 h_{f} \mathcal{M}_{1} |\phi_{1} (U^{*})|} {\delta_{0}} \right)^{2}, \end{equation}
where,  $U_{1}^{*} \approx 1.924$ and $|\phi _{1} (U^{*})| \approx 0.1164$ are constants. Table 3 lists the typical convergence time values obtained from the experiments.
Convergence times  $T_{\lambda }$ and $T_{\delta }$ values for varying film thickness and film viscosity. The control parameters are $We = 0.38$, $h^{*} = 0.005\text {--}0.015$ and $\eta ^{*} = 52\text {--}186$.


 Open access

