



Worldwide more than 300 million children aged less than 5 years are chronically undernourished( Reference Stevens, Finucane and Paciorek 1 ) and one-fifth of all children in developing countries are undernourished( Reference Black, Allen and Bhutta 2 ). Undernutrition accounts for 3·4 % of the total global burden of disease( Reference Murray, Vos and Lozano 3 ) and contributes to about half of the child deaths occurring worldwide( Reference Caulfield, de Onis and Blossner 4 ). Therefore, improvement of nutritional status by implementing appropriate policies and interventions is a priority for the achievement of Millennium Development Goal 4( Reference Bhutta, Ahmed and Black 5 ). Household food insecurity (HFI), proposed to be one of the causes for childhood undernutrition, is prevalent worldwide, particularly in developing countries( Reference Stevens, Finucane and Paciorek 1 , Reference Godfray, Beddington and Crute 6 ). Food insecurity is defined as ‘limited or uncertain availability of nutritionally adequate and safe foods or limited or uncertain ability to acquire acceptable foods in socially acceptable ways’( Reference Anderson 7 ). According to the World Food Summit 1996, food security occurs ‘when all people at all times have access to sufficient, safe, nutritious food to maintain a healthy and active life’( Reference Maxwell 8 ).
Studies from a few developing countries have reported that HFI is associated with childhood undernutrition indicators such as stunting and underweight( Reference Ali, Saha and Nguyen 9 – Reference Saha, Frongillo and Alam 15 ), but a study from Brazil has reported that HFI was not associated with Z-score for BMI-for-age or weight-for-height( Reference Kac, Schlussel and Perez-Escamilla 16 ). These studies were done among schoolchildren and pre-school children in Columbia( Reference Hackett, Melgar-Quinonez and Alvarez 11 , Reference Isanaka, Mora-Plazas and Lopez-Arana 12 ), tribal children aged 6–59 months in West Bengal, India( Reference Mukhopadhyay and Biswas 13 ), children aged 6–18 months living in urban squatter settlements of Karachi, Pakistan( Reference Baig-Ansari, Rahbar and Bhutta 10 ) and a nationally representative sample of children aged 0–60 months in Brazil( Reference Kac, Schlussel and Perez-Escamilla 16 ). A multinational study from eight countries was done on a sample of 100 children aged 24–60 months in each country( Reference Psaki, Bhutta and Ahmed 14 ) and another study included samples ranging from 2356 to 3422 children aged 6–60 months in three countries( Reference Ali, Saha and Nguyen 9 ), but none covered a nationally representative sample of children aged <5 years. In most of the studies, the association of HFI with stunting and underweight was consistent despite different instruments being applied to measure HFI( Reference Ali, Saha and Nguyen 9 – Reference Saha, Frongillo and Alam 15 ). However, using level of HFI and/or stunting, wasting, etc. in multivariate analyses in most studies( Reference Ali, Saha and Nguyen 9 – Reference Isanaka, Mora-Plazas and Lopez-Arana 12 , Reference Kac, Schlussel and Perez-Escamilla 16 ) may have led to loss of power and/or residual confounding for the association between HFI and undernutrition.
Childhood undernutrition is an important public health problem in South Asian countries( Reference Pasricha and Biggs 17 ). Among them Nepal too has a high prevalence of childhood undernutrition alongside widespread poverty( Reference Pasricha and Biggs 17 ). Prevalence rates of stunting, underweight and wasting are still high at 41 %, 29 % and 11 %, respectively, despite a reduction over the last two decades( 18 ). HFI is also prevalent in Nepal( Reference Joshi, Maharjan and Piya 19 ), where forty-two of the seventy-five districts are considered as food deficient( 20 ) and about 40 % of the Nepalese population lives on less than $US 1 per day( 21 ). A study from Kailali District has reported that two-thirds of the surveyed households reported some degree of food insecurity but HFI was not associated with stunting and wasting among children aged 6–23 months( Reference Osei, Pandey and Spiro 22 ). However, a national-level report on the association of HFI with childhood undernutrition has not been published. The Nepal Demographic and Health Survey 2011 (NDHS 2011) collected information about child anthropometry and the HFI situation over a 12-month period. We did a secondary data analysis of NDHS 2011 to further examine the association between HFI score and Z-scores of four child anthropometric indicators.
Methods
Ethics statement
The standard survey protocols, questionnaires and procedures of anthropometry for NDHS 2011 were reviewed and approved by the Independent Review Boards of New ERA (a non-governmental organization) and ORC (Opinion Research Corporation) Macro International Inc. (Calverton, MD, USA). Eligible persons of the households were informed that participation was voluntary and were assured about confidentiality of the information they would provide during the interview. Participants were told that they could refrain from responding to any of the questions. Prior to the interview, informed consent was obtained from each participant. Written consent was not necessary since participants were not subjected to any type of intervention. However, interviewers recorded consent in the questionnaire and signed the consent form. The Independent Review Board of both ORC Macro International Inc. and New ERA had approved this consent procedure.
Data source
Data for the present analysis were obtained with written permission from ORC Macro International Inc. for the fourth round of NDHS 2011 done under the administrative supervision of the Ministry of Health and Population and implemented by New ERA, a local research organization (http://www.newera.com.np/). NDHS 2011 was technically supported by ORC Macro International Inc. and funded by the US Agency for International Development.
Study design, sampling and sample size
NDHS 2011 was a population-based, cross-sectional study on a nationally representative sample of households. The survey sampling design was based on an updated sampling frame of the 2001 Census where enumeration areas were listed for sampling. A two-stage, stratified cluster sampling design was followed after stratification of enumeration areas as urban and rural. At the first stage, enumeration areas were selected by the probability-proportional-to-size technique and in the second stage, a minimum of 600 households was selected in each selected enumeration area. To obtain an acceptable level of precision for important population characteristics such as infant mortality, fertility, prevalence of contraceptives use, etc., a sample of 11 085 households was selected to completely interview a total of 13 485 women. Overall, a total of 12 674 women and 4121 men were interviewed; the response rates for women and men were 97·6 % and 94·7 %, respectively.
Anthropometric indicators
Height and weight were measured for all children born during the five years preceding the survey date in a sub-sample of households selected for interviewing male respondents. For all eligible children (aged 0–60 months) weight and height or length were measured by methods recommended by the WHO( 23 ). Weight was measured using a lightweight SECA scale having a digital monitor designed and monitored by UNICEF (SECA Medical Scales and Measuring Systems, Birmingham, UK). Weight was measured to a precision of 100 g and the scale was calibrated at the beginning and the end of each working day. Height or length was measured using specially designed measuring boards (stadiometers; Shorr Productions LLC, Olney, MD, USA). Height or length was measured to a precision of 1 mm and stadiometers were also calibrated at the beginning and the end of each working day. Children aged less than 2 years or shorter than 85 cm were measured in a lying down position (length). Two readings of weight and height/length were taken and the average reading was recorded. Height-for-age Z-scores (HAZ), weight-for-age Z-scores (WAZ), weight-for-height Z-scores (WHZ) and BMI-for-age Z-scores (BMIZ) were computed as per new 2006 WHO child growth standards based on the Multicentre Growth Reference Study( 24 ).
Household food insecurity
In NDHS 2011, HFI was measured using the Household Food Insecurity Access Scale (HFIAS) developed for the Food and Nutrition Technical Assistance project of the US Agency for International Development. The HFIAS measures household access to food, which is one of the three components of food insecurity: i.e. availability, access and utilization( Reference Coates, Swindale and Bilinsky 25 ). HFIAS has been shown to be a low-cost, valid tool that can be applied to estimate the prevalence of household food insecurity( Reference Coates, Frongillo and Rogers 26 ) and be used in different settings( Reference Psaki, Bhutta and Ahmed 14 ). To suit the Nepalese context, NDHS 2011 used a modified HFIAS that included seven of the nine generic questions with a recall period of 12 months instead of 30 d in the original HFIAS. In NDHS 2011, HFIAS was administered to the head of the household to assess the ‘food security’ situation in the house. Response options for each question were on a Likert scale of ‘never’, ‘rarely’, ‘sometimes’ and ‘often’, coded as 0, 1, 2 and 3, respectively. The food insecurity score, generated by summing up the responses to the seven questions, had a range from 0 (most food access secure) to 21 (most food access insecure). Further, each household was categorized as food secure, mild, moderate or severe food insecurity based on the responses provided to increasingly severe conditions and the frequency of experiencing such conditions during the previous 12 months as described by the HFIAS manual( Reference Coates, Swindale and Bilinsky 25 ).
Covariates
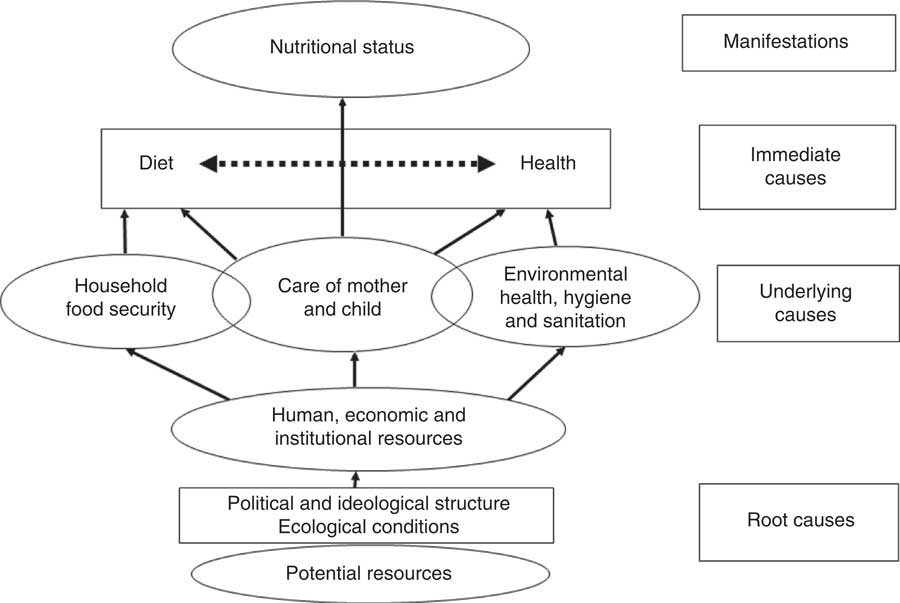
During NDHS 2011, demographic, socio-economic and health information was collected by interviewing all eligible men and women during the household survey. To assess the potential confounding effect of various determinants of undernutrition, we used UNICEF’s conceptual framework for childhood undernutrition (Fig. 1)( 27 ). The independent variables included in the analyses were age (in months), sex and birth order of the child, history of childhood illness during the previous two weeks, mother’s highest education, having a bank account, household sanitation characteristics (type of toilet, source of drinking water, and if anything was done to make the water safe for drinking), total number of household members, indoor air pollution indicators (namely, indoor smoking; any household members smoke inside the house) and the type of fuel used for cooking.
UNICEF’s conceptual framework of malnutrition
Statistical analysis
We performed descriptive analyses for HFIAS questions, level of HFI, HFIAS score, HAZ, WAZ, WHZ and BMIZ. Weighted prevalence rates for stunting, wasting and underweight were calculated for each category level of HFI. Level of HFI was compared according to household wealth index, total number of household members, age, sex and birth order of the child, and spatial variables. HAZ, WAZ, WHZ and BMIZ were compared by the level of HFI. The χ 2 test and ANOVA were done to test the statistical significance of differences in proportions and means, respectively. Instead of categorical variables such as level of HFI, stunting, wasting and underweight, we used HFIAS score, HAZ, WAZ, WHZ and BMIZ as continuous variables to test the association between HFI and nutritional status indicators. Univariate analyses followed by multiple linear regression analyses were done. Regression models for each of the four nutritional status indicators (Z-scores) were adjusted for all hypothesized confounding factors such as child’s age, sex and birth order, mother’s education, smoking indoors, having a bank account, type of drinking water source, type of toilet, type of cooking fuel used and total number of household members as per UNICEF’s conceptual framework for childhood undernutrition. The associations were considered significant if the P value was <0·05. After the full model, only factors that were significant (P<0·05) were included in the final model. All of the regression analysis models were adjusted for the complex sampling design of NDHS 2011 by including a household weighting factor using the ‘svyset’ command in the statistical software package Stata/IC 10·1.
Results
A total of 10 826 household heads were interviewed with the HFIAS questionnaire. The most common conditions of HFI reported as occurring ‘often’ during the previous 12 months were ‘worry about not having enough food’ (18·9 %), ‘not able to eat preferred foods’ (13·7 %) and ‘eating a limited variety’ (12·0 %). For 2591 children aged <5 years included in the final analysis, the mean and median HFIAS scores were 3·79 and 1, respectively (Table 1). Nearly half of the households were food secure, but 23·2 % of them had moderate HFI and 19·0 % had severe HFI.
Conditions related to household food access during the 12 months prior to the interview date, Nepal Demographic and Health Survey 2011 (10 826 households)

Overall HFIAS (Household Food Insecurity Access Scale) score: mean=3·79 (sd 4·83); median=1 (interquartile range 1–7).
Anthropometric measurements, height and weight were done for 2591 children. Significantly higher proportions of children from mid-western and far-western regions (P<0·001), mountains and hilly zones (P<0·001) and rural areas (P<0·001) lived in households with moderate to severe HFI, compared with mild HFI. Similarly, significantly higher proportions of children from poorest and poorer households (P<0·001) and born of higher birth order (P<0·001) were in the households having moderate to severe HFI, compared with mild HFI (Table 2).
Distribution of HFI level according to sociodemographic and child factors, Nepal Demographic and Health Survey 2011 (10 826 households)

HFI, household food insecurity.
Weighted prevalence rates for stunting (HAZ<−2), wasting (WHZ<−2) and underweight (WAZ<−2) were 41·63 %, 11·51 % and 30·12 %, respectively; while weighted prevalence rates for severe stunting (HAZ<−3), severe wasting (WHZ<−3) and severe underweight (WAZ<−3) were 16·35 %, 2·76 % and 8·07 %, respectively. The differences in prevalence of stunting and severe stunting, etc. according to HFI level were statistically significant for stunting (P<0·001), severe stunting (P=0·001) and underweight (P<0·001) only (Table 3), whereas the differences in mean values of HAZ, WAZ, WHZ and BMIZ according to HFI level were all statistically significant (P<0·01; Table 4).
Distribution of weighted prevalence rates for stunting, underweight and wasting among children (n 2591) aged 0–60 months according to HFI level, Nepal Demographic and Health Survey 2011 (10 826 households)

HFI, household food insecurity; HAZ, height-for-age Z-score; WHZ, weight-for-height Z-score; WAZ, weight-for-age Z-score.
Stunting, HAZ<−2; severe stunting, HAZ<−3; wasting, WHZ<−2; severe wasting, WHZ<−3; underweight, WAZ<−2; severe underweight, WAZ<−3.
* Total number of included cases was 2473 since data on HAZ and WAZ were missing in 118 cases.
† Total number of included cases was 2591.
Distribution of Z-scores of nutritional status indicators among children (n 2591) aged 0–60 months according to HFI level, Nepal Demographic and Health Survey 2011 (10 826 households)

HFI, household food insecurity; HAZ, height-for-age Z-score; WAZ, weight-for-age Z-score; WHZ, weight-for-height Z-score; BMIZ, BMI-for-age Z-score.
In multiple linear regression analyses, HFIAS score was associated with HAZ (P=0·04) and WAZ (P=0·04) in the full models and also in the final models after adjusting for covariates, but HFIAS score was not associated with WHZ or BMIZ in either model (Table 5). A 10-point increase in HFIAS score was associated with a decrease in HAZ of 0·2 (95 % CI 0·05, 0·39) and a decrease in WAZ of 0·1 (95 % CI 0·03, 0·27). Mother’s education and child’s age were associated with HAZ, WAZ and WHZ. Other covariates associated with nutritional indicators were child’s birth order and having a bank account (with HAZ and WAZ); and type of toilet, making drinking water safe and source of drinking water (with WHZ and BMIZ; Table 5).
Linear regression analyses for the association between HFI score and Z-scores of nutritional status indicators among children (n 2591) aged 0–60 months after adjustment for various sociodemographic and child factors, Nepal Demographic and Health Survey 2011 (10 826 households)
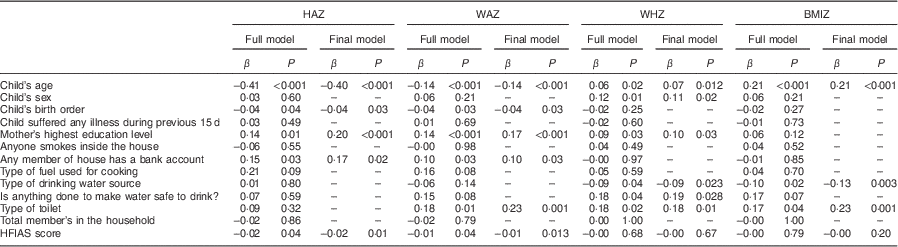
HFI, household food insecurity; HAZ, height-for-age Z-score; WAZ, weight-for-age Z-score; WHZ, weight-for-height Z-score; BMIZ, BMI-for-age Z-score; HFIAS, Household Food Insecurity Access Scale.
Type of toilet was classified as no toilet/bush/field and any type of toilet; source of drinking water was classified as piped water to the house or yard, public tap and others such as well, river, spring, etc.; type of fuel used for cooking was classified as clean fuels (liquid petroleum gas, biogas and electricity) or polluting fuels (wood, animal dung, etc.).
Discussion
Nearly half of the households in Nepal experienced some degree of HFI and the prevalence of stunting and underweight among children aged <5 years living in food-insecure households was higher than among children in food-secure households. After adjusting for child, mother and household factors, HFIAS score was associated with stunting and underweight but not with wasting and BMI. An increase in HFIAS score was significantly associated with decreased HAZ and WAZ, which correspond to an increased risk of stunting and underweight, respectively.
Prevalence of HFI in Nepal was similar to that in Antioquia, Columbia( Reference Hackett, Melgar-Quinonez and Alvarez 11 ) and Brazil( Reference Kac, Schlussel and Perez-Escamilla 16 ) but lower than in Bogota, Columbia( Reference Isanaka, Mora-Plazas and Lopez-Arana 12 ). However, the scales used to measure HFI were diverse in these studies and also in others from Bangladesh( Reference Saha, Frongillo and Alam 15 ), Pakistan( Reference Baig-Ansari, Rahbar and Bhutta 10 ) and India( Reference Mukhopadhyay and Biswas 13 ), rendering HFI data non-comparable. HFI prevalence in NDHS 2011 was less than in the study (69 %) from Kailali District, far-western Nepal, which used a five-item scale similar to HFIAS( Reference Osei, Pandey and Spiro 22 ). When comparing the studies that used the HFIAS, prevalence in Nepal was higher than in Bangladesh and Vietnam but lower than in Ethiopia( Reference Ali, Saha and Nguyen 9 ). However, these comparisons should be interpreted cautiously because NDHS 2011 used a modified HFIAS, while Ali et al. used the original HFIAS on samples of children aged 6–60 months who were not nationally representative. Prevalence of stunting, underweight and wasting in Nepal had reduced compared with previous surveys( 18 ) but stunting was higher than wasting in accordance with a report from a multi-county study in Nigeria( Reference Olusanya, Wirz and Renner 28 ).
Our study found that HFIAS score was associated with HAZ and WAZ, consistent with results of studies among children aged <5 years in Bangladesh( Reference Saha, Frongillo and Alam 15 ), Antioquia, Columbia( Reference Hackett, Melgar-Quinonez and Alvarez 11 ), Pakistan( Reference Baig-Ansari, Rahbar and Bhutta 10 ), India( Reference Mukhopadhyay and Biswas 13 ) and multinational studies done in three( Reference Ali, Saha and Nguyen 9 ) and eight low- and middle-income countries( Reference Psaki, Bhutta and Ahmed 14 ), and also among schoolchildren (aged 5–12 years) in Bogota, Columbia( Reference Isanaka, Mora-Plazas and Lopez-Arana 12 ). However, our findings are contrary to the results of a study from Kailali District, Nepal( Reference Osei, Pandey and Spiro 22 ). The reason for the lack of association in the study from Kailali District could be the use of a different HFI scale among children aged 6–24 months, while stunting is a chronic condition common among children aged 3–5 years and caused by prolonged (chronic) hunger or food deprivation. Our study found no association between HFI and WHZ as in previous studies( Reference Ali, Saha and Nguyen 9 , Reference Hackett, Melgar-Quinonez and Alvarez 11 , Reference Psaki, Bhutta and Ahmed 14 , Reference Kac, Schlussel and Perez-Escamilla 16 , Reference Osei, Pandey and Spiro 22 ). There was no association between HFI and BMI in our study similar to a study from Brazil which did not test the association of HFI with HAZ and WAZ( Reference Kac, Schlussel and Perez-Escamilla 16 ). Contrary to our findings, HFI has been shown to be associated with overweight (based on BMI) among adolescents and adults in both developed( Reference Adams, Grummer-Strawn and Chavez 29 , Reference Townsend, Peerson and Love 30 ) and developing countries( Reference Kac, Velasquez-Melendez and Schlussel 31 – Reference Velasquez-Melendez, SchlUssel and Brito 33 ).
Strengths and limitations
One strength of our study was that we tested the hypothesis using data from a nationally representative sample of children aged <5 years and did robust statistical analyses using HFI, HAZ, WAZ and other variables as continuous data by linear regression and controlling for potential confounders according to UNICEF’s conceptual framework. However, we did not use dietary intake in terms of quantity and quality since these questions in NDHS 2011 were asked for the 24 h prior to the survey whereas questions in the HFIAS were asked for the previous 12-month period. A previous study that tested children’s dietary diversity did not find any association between dietary diversity and child undernutrition indicators( Reference Ali, Saha and Nguyen 9 ). The same study also reported that HFI was associated with stunting and wasting, but the effect size decreased after the inclusion of wealth index( Reference Ali, Saha and Nguyen 9 ). The wealth index in NDHS 2011 was calculated based on various items related to environmental sanitation and hygiene that were also included in our regression models. Therefore to avoid possible collinearity of wealth index with factors such as type of fuel, source of water supply, etc., having a bank account was included as a proxy for wealth index in our regression models.
One potential limitation of our study was bias from a recall period of 12 months prior to the date of survey, whereas the original HFIAS recommends a 30 d recall period. As nearly 80 % of the Nepalese population depends on subsistence farming, they usually face inadequate food supplies during the dry period between October and May. Therefore, a recall period of 12 months may have adjusted for the seasonal variations in the food supply while measuring HFI, as reported in previous studies( Reference Ali, Saha and Nguyen 9 , Reference Psaki, Bhutta and Ahmed 14 ). Reporting bias due to cultural stigma against food insecurity and use of a non-validated modified seven-item version of HFIAS in NDHS 2011 may have resulted in lower estimates of HFI. Nevertheless, the HFIAS has good internal consistency (Cronbach’s α=0·83–0·90)( Reference Knueppel, Demment and Kaiser 34 ), is known to distinguish households that are food secure from those that are food insecure across different cultural settings and has been used in several countries( 24 ). The association between HFIAS score and child undernutrition was assessed based on cross-sectional survey data in which HFI and child anthropometry were measured at the same time. Therefore, careful interpretations should be made about the association of HFI with stunting (WHZ) because stunting may have existed even before the household started experiencing food insecurity. Despite adopting UNICEF’s conceptual framework, broader political and ecological conditions/contexts prevailing in Nepal could not be adjusted for in our analyses due to non-availability of their proxy measures.
Conclusion
Our study confirms the previously reported association of HFI with stunting and underweight among children aged <5 years. However, the association between HFI and child undernutrition needs further verification in longitudinal studies to better understand the complex relationships between HFI, wealth index, and the quality and quantity of children’s dietary intake. Notwithstanding, the HFIAS has potential use as a tool for detection of those households where children may be at risk of growth faltering and may be applicable in community-based nutritional interventions.
Acknowledgements
Acknowledgements: The authors thank ORC Macro International Inc. for providing access to the original data sets of the Nepal Demographic and Health Survey 2011 for conducting this analyses and preparing this manuscript. Financial support: This research received no specific grant from any funding agency in the public, commercial or not-for-profit sectors. Conflict of interest: None. Authorship: C.T.S. conceived and designed the study, analysed and interpreted the data and drafted the initial manuscript; N.R. helped in data analysis, interpretation of the data and corrected the initial drafts; M.S. helped in the data analysis, wrote the tables and results, and assisted in drafting the manuscript; all the authors were responsible for final editing and approval of the manuscript. Ethics of human subject participation: NDHS 2011 protocols, questionnaires and procedures were reviewed and approved by the Independent Review Boards of New ERA and ORC Macro International Inc.



