


1 Introduction
High-average-power and high-energy femtosecond lasers are urgently required in both fundamental science and industrial applications[ Reference Penilla, Devia-Cruz, Wieg, Martinez-Torres, Cuando-Espitia, Sellappan, Kodera, Aguilar and Garay1– Reference Malinauskas, Zukauskas, Hasegawa, Hayasaki, Mizeikis, Buividas and Juodkazis4]. The exceptional combination of these parameters allows the exploration of extreme nonlinearities of matter[ Reference Liu, Yin, Wang, Leng, Li, Xu and Chin5] and the extension of ultrashort pulse generation to both short wavelengths (nanometer to sub-nanometer)[ Reference Kanda, Imahoko, Yoshida, Tanabashi, Eilanlou, Nabekawa, Sumiyoshi, Kuwata-Gonokami and Midorikawa6] and long wavelengths (multimicrometer or millimeter)[ Reference Sanchez, Hemmer, Baudisch, Cousin, Zawilski, Schunemann, Chalus, Simon-Boisson and Biegert7, Reference Koulouklidis, Gollner, Shumakova, Fedorov, Pugzlys, Baltuska and Tzortzakis8] at unprecedented flux levels, heralding a new revolution in ultrafast science. For an extended period, Ti:sapphire lasers, which produce sub-10 fs pulses with millijoule energy, have served as the workhorse in this field. However, thermal limitations restrict Ti:sapphire lasers to an average power of approximately 10 W[ Reference Matsushima, Yashiro and Tomie9]. Owing to small quantum defects and the availability of high-power laser diodes (LDs) as a pump source, ultrafast lasers based on Yb-doped materials, including fiber[ Reference Muller, Aleshire, Klenke, Haddad, Legare, Tunnermann and Limpert10], thin-disk[ Reference Ueffing, Lange, Pleyer, Pervak, Metzger, Sutter, Major, Nubbemeyer and Krausz11], Innoslab[ Reference Gao, Guo, Huang, Gao, Gan, Tu, Liang and Li12] and bulk crystal[ Reference Caracciolo, Pirzio, Kemnitzer, Gorjan, Guandalini, Kienle, Agnesi and Aus der Au13], are now demonstrating significant competitiveness due to their superior power scaling capabilities. Currently, advanced applications impose increasingly stringent demands on both pulse energy (i.e., peak power) and average power to achieve the strong-field cutoff and adequate photon fluxes necessary for subsequent measurements[ Reference Li, Lu, Chew, Han, Li, Wu, Wang, Ghimire and Chang14]. To meet these demands, researchers have integrated the chirped-pulse amplification (CPA) technique with Yb-doped laser amplifiers to mitigate damage and prevent adverse nonlinear phase accumulation[ Reference Strickland and Mourou15]. These architectures routinely provide millijoule-level pulse energy at repetition rates ranging from a few kilohertz to several tens of kilohertz. The achievable pulse duration is theoretically constrained by the narrower gain bandwidth of Yb-doped materials[ Reference Koerner, Vorholt, Liebetrau, Kahle, Kloepfel, Seifert, Hein and Kaluza16] and the deteriorating dynamics of gain-narrowing[ Reference Raybaut, Balembois, Druon and Georges17], particularly in Yb-doped yttrium aluminum garnet (Yb:YAG)-based thin-disk[ Reference Herkommer, Krotz, Jung, Klingebiel, Wandt, Bessing, Walch, Produit, Michel, Bauer, Kienberger and Metzger18] and Innoslab lasers[ Reference Schmidt, Hage, Mans, Legare and Worner19]. Yb-doped fiber lasers hold promise for achieving high average power, but the small mode-field diameter limits the pulse energy to approximately 0.1 mJ with a single channel[ Reference Zhao and Kobayashi20] and to the millijoule level through complex coherent beam combination technology[ Reference Stark, Benner, Buldt, Klenke and Limpert21].
Bulk Yb-doped crystals demonstrate significant competitiveness in high-average-power and high-energy pulse amplification. Among them, Yb-doped CaGdAlO4 (Yb:CALGO) is distinguished by its broad emission bandwidth (Δλe ~ 80 nm)[ Reference Zaouter, Didierjean, Balembois, Leclin, Druon, Georges, Petit, Goldner and Viana22], excellent thermal conductivity (6.9 W·m−1·K−1 along the a-axis and 6.3 W·m−1·K−1 along the c-axis)[ Reference Loiko, Druon, Georges, Viana and Yumashev23] and remarkable conversion efficiency[ Reference Caracciolo, Kemnitzer, Guandalini, Pirzio, Agnesi and der Au24]. Consequently, it has emerged as a promising candidate for high-power and high-energy femtosecond lasers. In 2013, Calendron[ Reference Calendron25] demonstrated a dual-crystal Yb:CALGO regenerative amplifier (RA) delivering an average power of 23 W in continuous-wave (CW) mode and 3 W of high-energy pulses at a repetition rate of 1 kHz in seed mode. In the same year, Caracciolo et al. [ Reference Caracciolo, Kemnitzer, Guandalini, Pirzio, Aus der Au and Agnesi26] reported a direct Yb:CALGO RA that delivered an average power of 36 W with 217 fs pulses at a repetition rate of 500 kHz. Subsequently, they introduced the CPA strategy and improved the RA output energy to 1.13 mJ with a pulse duration of 380 fs, which corresponds to a pulse peak power of 3 GW[ Reference Caracciolo, Kemnitzer, Guandalini, Pirzio, Agnesi and der Au24]. In addition to pulse energy and average power, achieving ultrashort pulses is another crucial parameter. In 2013, Pouysegur et al. [ Reference Pouysegur, Delaigue, Zaouter, Honninger, Mottay, Jaffres, Loiseau, Viana, Georges and Druon27] proposed and implemented a nonlinear regenerative amplification method to mitigate the gain-narrowing effect encountered during the multi-pass amplification process. Their method achieved sub-100 fs pulses but the pulse energy was limited to approximately 20 μJ due to optical damage induced by high peak power. More recently, Wang et al. [ Reference Wang, Wu, Liu, Sun and Liang28] reported a Yb:CALGO RA delivering 95 fs pulses with an average power of 12.5 W and a peak power of 2.45 GW. Furthermore, they improved the average power to 36 W and the pulse energy up to 4.3 mJ, corresponding to a peak power of over 20 GW. Despite the rapid advancements of Yb:CALGO-based amplifiers, the pursuit of higher peak power from the RA, characterized by multi-mJ pulse energy and tens of watts of average power, remains critical for unlocking various nonlinear processes and ensuring sufficient photon fluxes.
To this end, several technical challenges also need to be meticulously addressed, including the management of the thermal lens effect under high-power pumping and achievement of a larger mode size to facilitate higher energy amplification. For a larger signal mode, cavity mirrors with a larger radius of curvature are essential. However, this inevitably leads to an elongated and complex regenerative cavity, which can potentially exacerbate the thermal lens effect and destabilize the cavity. In this work, we present a Yb:CALGO-based RA cavity that exhibits a high thermal tolerance of over 400 W pump power and supports a larger signal mode for enhanced energy output. This laser system achieves pulse energy exceeding 7 mJ and high average power of 50 W. The RA cavity is specially designed to facilitate a broad tuning range for the thermal lens effect and ensure power scalability. In CW mode, the output average power reaches 73 W, with an absorbed pump power of 380 W. In seed mode, average power exceeding 50 W can be extracted at repetition rates ranging from 10 to 200 kHz. At a repetition rate of 5 kHz, the maximum attainable average power exceeds 35 W, corresponding to a pulse energy greater than 7 mJ. After pulse compression, 6.6-mJ pulses with a duration of 130 fs are achieved. To the best of our knowledge, this represents the highest average power, pulse energy and peak power obtained from a Yb:CALGO-based RA.
2 Experimental setup
The RA system relies on the CPA technique and consists of four blocks (see Figure 1), namely, a broadband fiber seeder, stretcher, RA and compressor. For characterization, we employed a fiber spectrometer (FX4000, Ideaoptics), a power meter (F150A-BB-26, Ophir), a beam profiler (WinCamD-LCM, DATARAY) and a frequency-resolved optical gating (FROG) device (MP-002.X, MesaPhotonics).
Layout of the Yb:CALGO regenerative amplifier. TFP1, TFP2, thin film polarizers; HWP, half-wave plate; FR, Faraday rotator; QWP, quarter-wave plate; PC, dual BBO Pockels cell; M1, M4, flat cavity mirrors; M2, M3, curved cavity mirrors. Closeup, schematic of the double-pass pumping system. LD, laser diode; Cyl. lenses, a pair of cylindrical lenses to expand, shape and collimate the pump beam; CM, concave mirror with a radius of curvature of 400 mm.

The linear resonator of the RA is schematically depicted in Figure 1. An a-cut 3 mm × 3 mm × 7 mm Yb:CALGO crystal with a doping concentration of 2% is employed as the active medium. The end faces of the crystal are coated to achieve high transmittance across the spectral range of 970–1070 nm. In the crystal, the pump polarization is aligned along the c-axis to maximize absorption, which is approximately 82%. The pump source comprises two free-space-coupled LDs with multiple emitters, stabilized at an emission wavelength of 976 nm and delivering linearly polarized output power exceeding 220 W. Since the pump LD has a rectangular afocal output beam with different divergence angles in two orthogonal directions, we employ a pair of cylindrical lenses with 1:3 expanding ratio to expand, shape and collimate the beam. Then, a concave mirror (CM) with a radius of curvature of 400 mm focuses the pump beam to approximately 750 μm × 700 μm. Note that the unabsorbed pump is collected and reflected by another CM to be incident on the gain crystal a second time for a higher pump usage efficiency of 86%. The overall pump scheme is sketched in the closeup of Figure 1. A high-power water chiller (CWUP-40, TEYU and S&A) with around 2 kW cooling capacity and a maximum flow rate of 75 L/min is employed to protect the pump LDs and remove the accumulated heat on the crystal. This focused pump mode is optimized to overlap with the signal mode in the crystal. The RA cavity exhibits a symmetrical confocal structure, comprising two flat mirrors (M1 and M4), two CMs (M2, M3, with radii of curvature of 1200 mm), two thin-film polarizers, a quarter-wave plate (QWP) and a half-wave plate. The total length of the RA cavity is approximately 2.9 m, which corresponds to a round-trip time of 19.3 ns. A dual beta-barium borate (BBO) crystal Pockels cell (PC) is employed in conjunction with the QWP to perform a Q-switch that captures the seed pulse and extracts the amplified pulse.
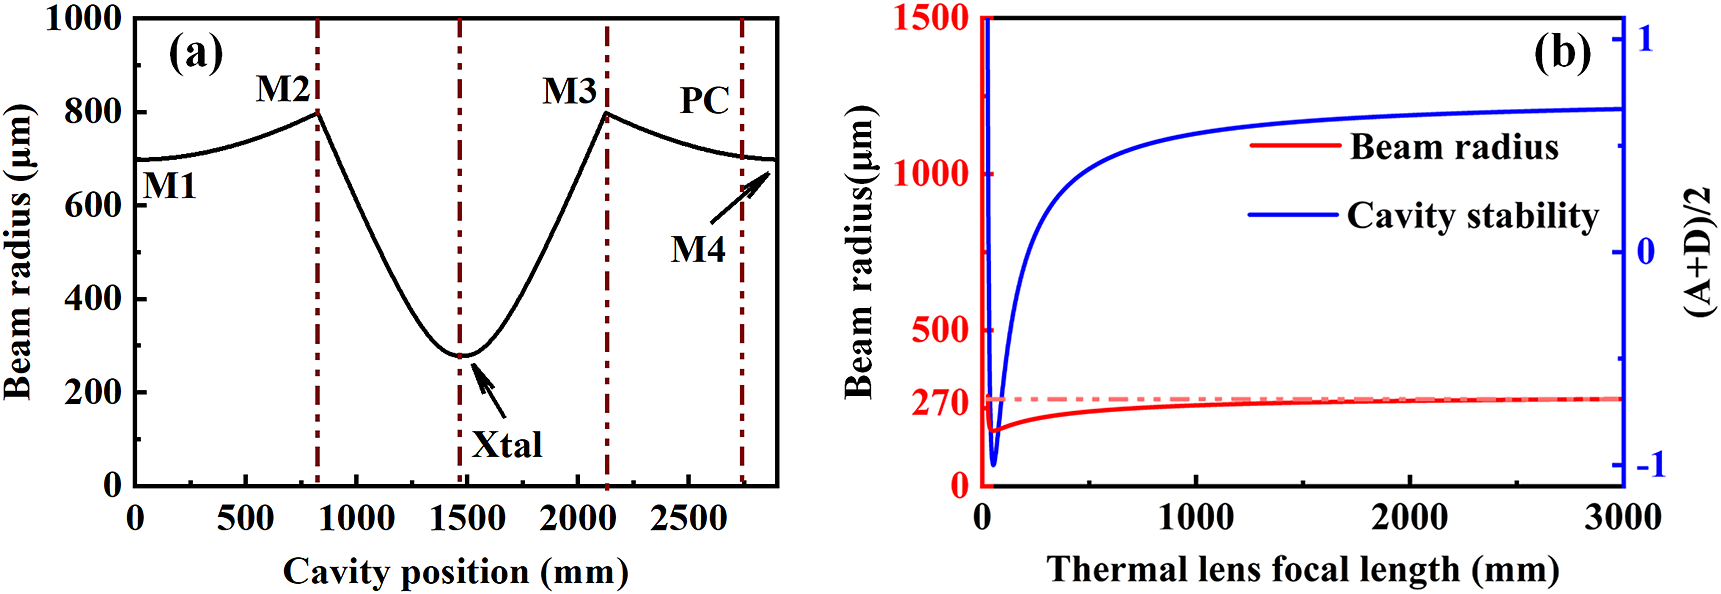
We employ the ABCD matrix formalism to design and numerically analyze the RA cavity. In the static scenario, the designed eigenmode radius of the RA cavity is illustrated in Figure 2(a). The beam diameter of the laser mode within the cavity reaches a minimum of 540 μm at the crystal location. Once the pump laser irradiates the crystal, the thermo-optic effect will influence the cavity mode. The beam radius at the crystal and the stability parameter of the cavity as a function of the focal length of the thermal lens are presented as red and blue curves in Figure 2(b). The RA cavity becomes unstable only when the focal length of the thermal lens is reduced to less than 30 mm (see the blue curve). Furthermore, only at focal lengths shorter than 50 mm, the beam radius at the crystal expands significantly, thereby degrading the mode-match between the signal and pump lasers. When the thermal-effect-induced focal length is larger than 2500 mm, the evolution of intracavity beam radius converges at 270 μm (indicated by the red dashed line). Therefore, the cavity mode at the crystal exhibits insensitive behavior to variations in the thermal lens, indicating that the pump and signal remain well matched across a broad range of pump powers. This insensitivity is crucial for achieving high-average-power output under intense pumping conditions.
(a) Cavity mode distribution and arrangement of the optics. (b) Beam radius variation at 1/e2 level with different focal lengths of the thermal lens (red solid curve), and stability parameter as a function of the thermal lens (blue curve). The red dashed line indicates that the evolution of intracavity beam radius converges at 270 μm when the thermal-effect-induced focal length is larger than 2500 mm.
3 Regenerative amplification
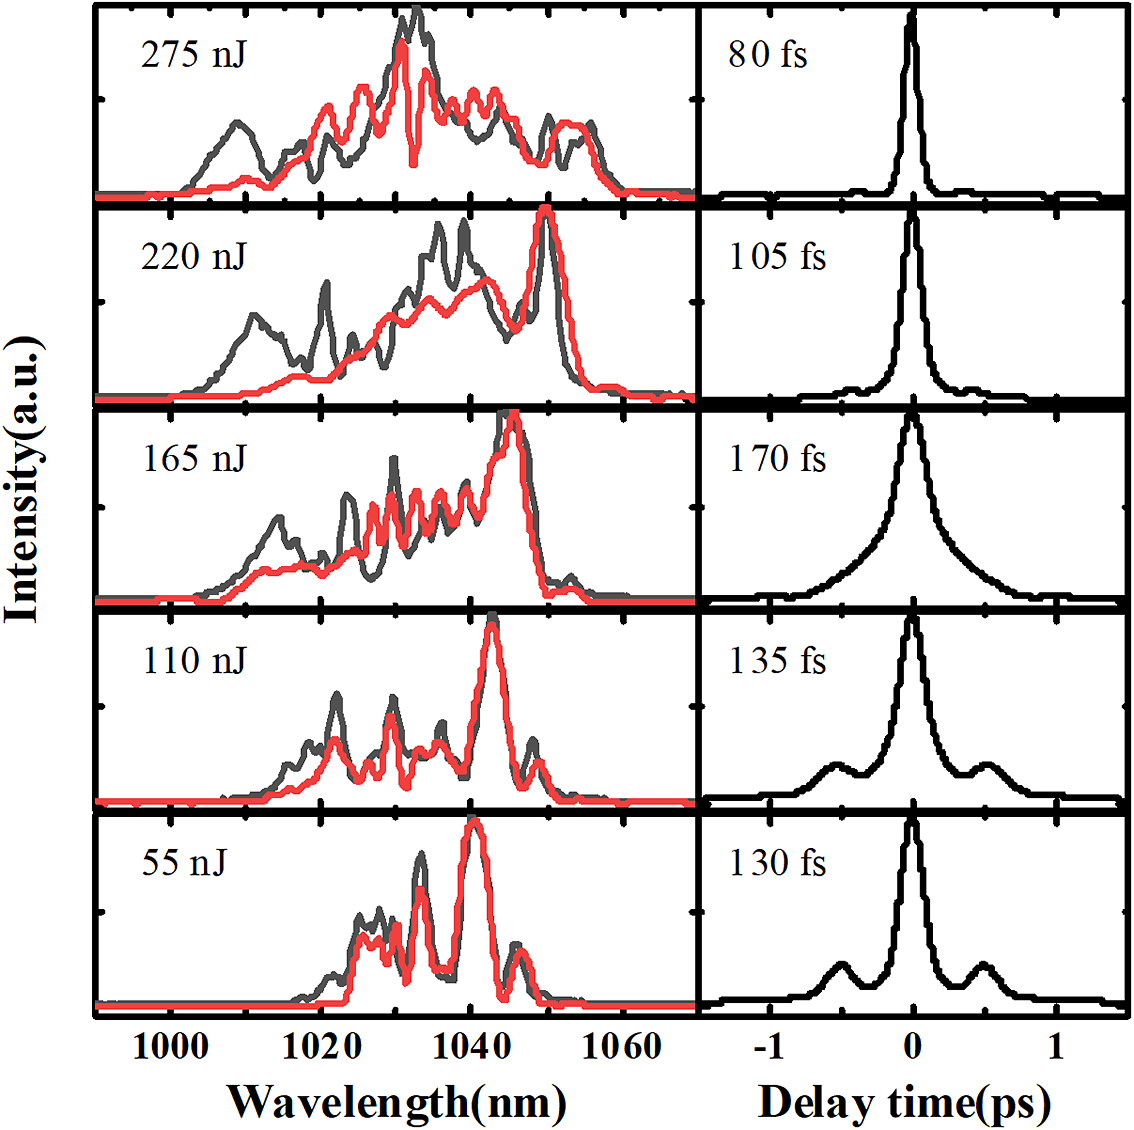
For pulse amplification, we employed a broadband fiber seeder that delivers pulses with a repetition rate of 27.3 MHz and an average power of 100 mW (YbPicoCHI Elite, Langyan). The seed pulses were then pre-amplified and spectral-extended through a nonlinear amplification process for high-peak-power pulse generation[ Reference Liu, Schimpf, Eidam, Limpert, Tunnermann, Kartner and Chang29, Reference Guo, Liu, Liu, Shao, Li and Hao30]. A 1-m long photonics crystal gain fiber (DC-200/40-PZ-Yb, NKT Photonics) was employed to boost the seed pulse energy to nearly 400 nJ and, in the meantime, guarantee an excellent output beam quality of M 2 = 1.22. As illustrated in Figure 3, the output spectrum of the amplified seed pulses broadens with the increased energy. As the intense pulse propagates through the active fiber and gains energy, it acquires increased bandwidth and a quadratic phase shift due to the self-phase modulation effect, as indicated by the broadened spectral coverage and modulated profile shown by the black curves in the left-hand column of Figure 3. The spectrally broadened pulses can be effectively dechirped by gratings to achieve even shorter pulses. In the time domain, the nonlinear amplification process improves the quality of the dechirped pulse. For instance, the auto-correlation trace of the dechirped pulse at low energy exhibits notable pedestals due to uncompensated third-order dispersion. In the fiber amplifier, the accumulated nonlinear phase shifts and third-order dispersion can compensate each other, thereby minimizing the output pulse duration and eliminating the pedestals[ Reference Zhou, Kuznetsova, Chong and Wise31]. Consequently, as the pulse energy increases, the compressed pulse becomes significantly shorter and cleaner. At an energy of 275 nJ, the seed pulses are optimized to 80 fs in the Gaussian profile with negligible pedestals, and spectrally cover the range from 1000 to 1060 nm, as shown in the top row of Figure 3. When the seed pulse energy is increased over 220 nJ, some amplitude mismatch can be observed between the retrieved FROG spectra and the measured spectra. In our FROG, a 100-μm-thick, type-I phase matching β-BBO crystal is employed for the second-harmonic generation. Because of the relative broadband seed spectrum, the optimized angle of the BBO crystal can affect the retrieved spectrum, but the spectral coverage and the corresponding spectral peaks and dips match well, which makes our results persuasive. Then, the seeder is well prepared for the subsequent chirped-pulse RA.
Spectra (left-hand column) and auto-correlation traces (right-hand column) of the broadband seed pulses with different energy. The seed pulse is measured by a fiber spectrometer and an SHG-FROG. The red curves are the retrieved spectra of the pulses, while the grey curves are the measured spectra by the fiber spectrometer.
The CPA strategy is implemented by stretching and compressing the pulse using gratings with uniform groove density (1739 lines/mm, Gitterwerk). Utilizing an Öffner stretcher, the seed pulse is elongated to approximately 600 ps. Due to the aperture limitations of the components in the stretcher, the seed spectrum is truncated to cover the range from 1012 to 1043 nm. The optical efficiency of the stretcher is about 50%, which ensures sufficient seed energy to prevent bistability during amplification.
Subsequently, the seed pulse is injected into the RA cavity. The total absorbed pump power for the crystal is approximately 380 W. The maximum CW output from the RA cavity, without the use of the PC, is 73.3 W, corresponding to a pump-to-signal efficiency of approximately 19.3%, which can be attributed to the noncolinear pump scheme, degraded beam shape and imperfect mode-matching. As illustrated in Figure 4(a), the increased rate of CW output power starts to slow when the absorbed pump power exceeds 350 W. This could result from the thermal lens effect-induced cavity degradation. When the PC is added with an opening time of 1050 ns (equivalent to 54 round trips), the amplified pulse extracted from the RA reaches an average power of approximately 53 W at a repetition rate of 50 kHz, corresponding to a pulse energy exceeding 1 mJ. Figure 4(b) illustrates the relationship between the output power and the number of round trips, between the intracavity pulse amplification process and the output pulse. The output power increases exponentially with the number of round trips, indicating that the seed pulse experiences unsaturated amplification.
(a) CW output power versus absorbed pump power. (b) Amplified signal power at 50 kHz versus round trips. Inset: blue line, seed pulse amplification process inside the RA cavity; red line, output single-pulse of the RA. (c) Pulse energy (red line) and output power (blue line) at different repetition rates. (d) Beam quality at 50 kHz.
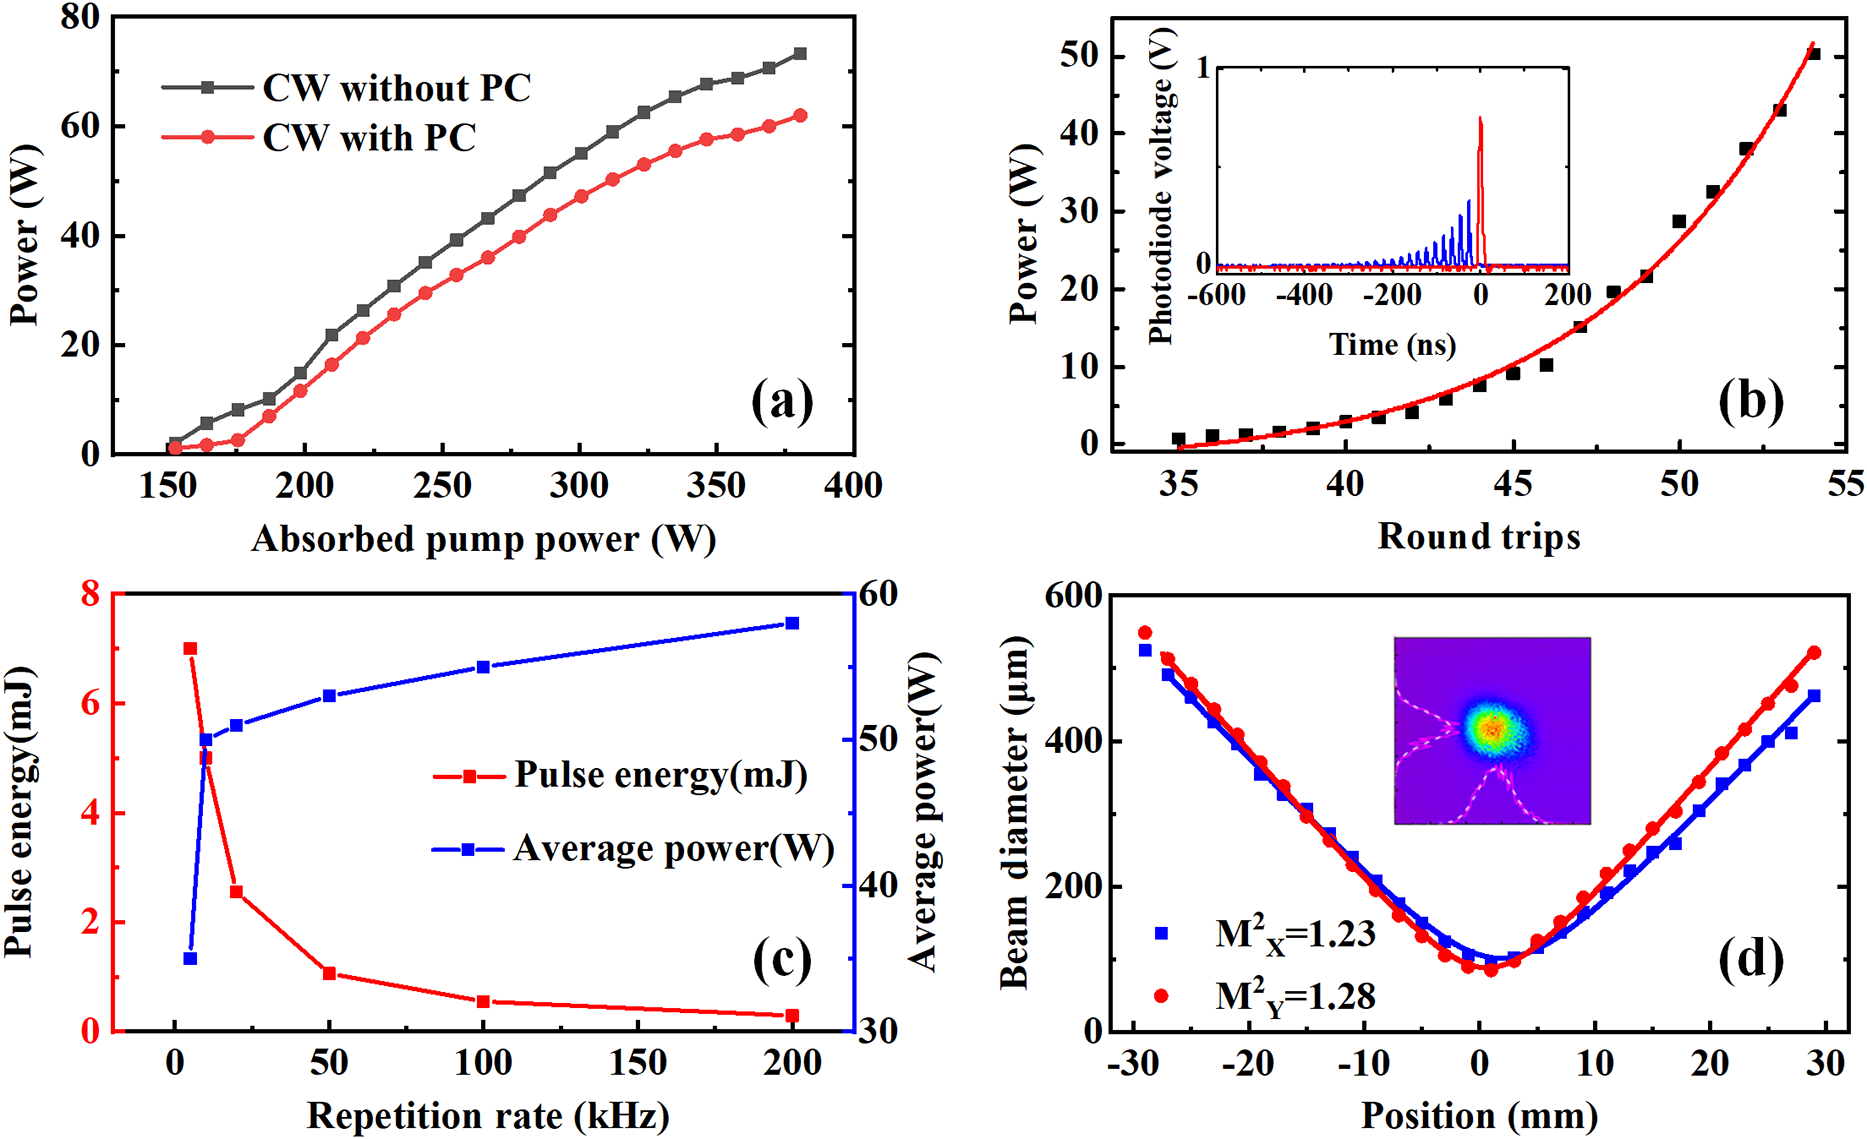
Figure 4(c) illustrates the pulse energy and the average power as a function of the repetition rate when the opening time of the PC is fixed at 1050 ns. The output average power exceeds 50 W at repetition rates higher than 10 kHz under full pump power conditions. As the repetition rate increases to 200 kHz, the output average power approaches the maximum value of 58 W. At lower repetition rates, although the average output power decreases, the pulse energy can be significantly increased. For instance, at a repetition rate of 5 kHz, the obtained pulse energy exceeds 7 mJ, corresponding to an average power greater than 35 W. During the experiment, coating damage could be frequently observed within 5–10 minutes at such high energy levels. Therefore, improving the laser-induced damage threshold of the crystal coatings or utilizing Brewster-angle cleaved crystal may enable the extraction of 10-mJ pulses. The thermally stable design of the RA cavity, combined with the exceptional thermomechanical properties of the Yb:CALGO crystal, results in an amplified laser beam that approaches the diffraction limit, exhibiting an M 2 value of approximately 1.2 in both spatial directions under high-power pump conditions, as presented in Figure 4(d).
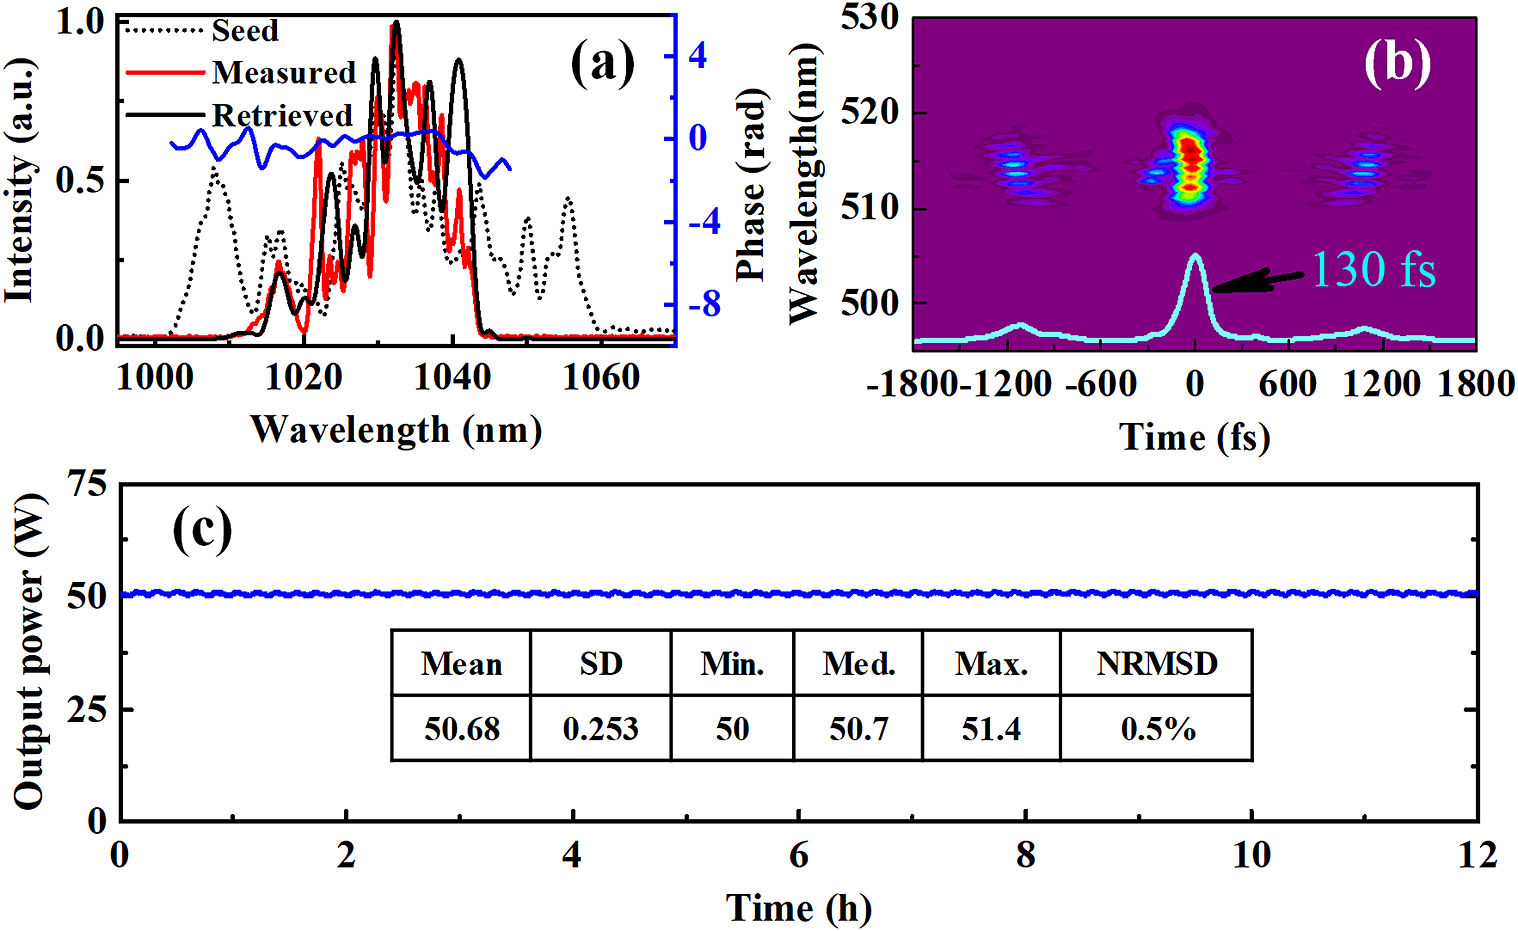
The amplified pulses are subsequently sent to the compressor, which comprises two reflection gratings with an identical groove density of 1739 lines/mm. The optical efficiency of the compressor exceeds 94%, attributable to the high diffraction efficiency (>99%) of each grating. After compression, the maximum average power and pulse energy are 55.0 W at 200-kHz repetition rate and 6.6 mJ at 5-kHz repetition rate, respectively. The output spectrum after the compressor is slightly clipped by the grating, resulting in a spectral full width at half maximum (FWHM) of 13 nm (comparing the black dotted curve and red solid curve in Figure 5(a)). The retrieved spectrum from the second-harmonic frequency-resolved optical gating (SHG-FROG) measurement closely matches the measured spectrum (comparing the black and red solid curves), indicating a good reconstruction of the electric field. The relatively flat phase (the blue solid curve in Figure 5(a)) and characterization of the electric field (see Figure 5(b)) demonstrate that the compressor almost perfectly removes the chirp carried by the output pulses. The resulting pulse duration of 130 fs (FWHM) is close to the Fourier limit of 120 fs (FWHM) and exhibits only minor satellites at around 1-ps intervals. The satellites could result from the imperfect anti-reflective coating of the waveplate, which has a thickness of approximately 0.3 mm, corresponding to the time-delay interval between the satellite and the main pulse. Due to the finite grating size-induced spectral clipping and the spectral narrowing during amplification, the compressed pulse is moderately longer than the 80-fs seed pulse. By utilizing larger gratings and, in the meantime, spectral shaping the seed pulse to counteract gain-narrowing, sub-100 fs pulses can be expected with our RA system. The main pulse contains 88% of the energy, leading to a peak power of 44.7 GW. Figure 5(c) presents the long-term power stability of the RA operating at a repetition rate of 50 kHz and an average power of 50 W. The normalized root mean square deviation (NRMSD) values of the average power and pulse-to-pulse energy are both calculated around 0.5% over 12 hours. Periodic fluctuations in the measured average power result from temperature variations of the chilled water (±0.1°C) and can be optimized by replacing the chiller with a higher-performance unit to improve the output power stability.
(a) Measured spectra of the seed (black dotted curve) and compressed pulses (red solid curve) by the fiber spectrometer FX4000, and retrieved spectrum (black solid curve) and phase (blue solid curve) by the FROG (FROG error: 0.0077). (b) FROG trace and auto-correlation trace (cyan curve). (c) Measured long-term stability of the system. The system was started in a cold state. After several minutes of warming-up phase, the system stayed at 50.7 W with a noise value of 0.46% (NRMSD).
4 Conclusion
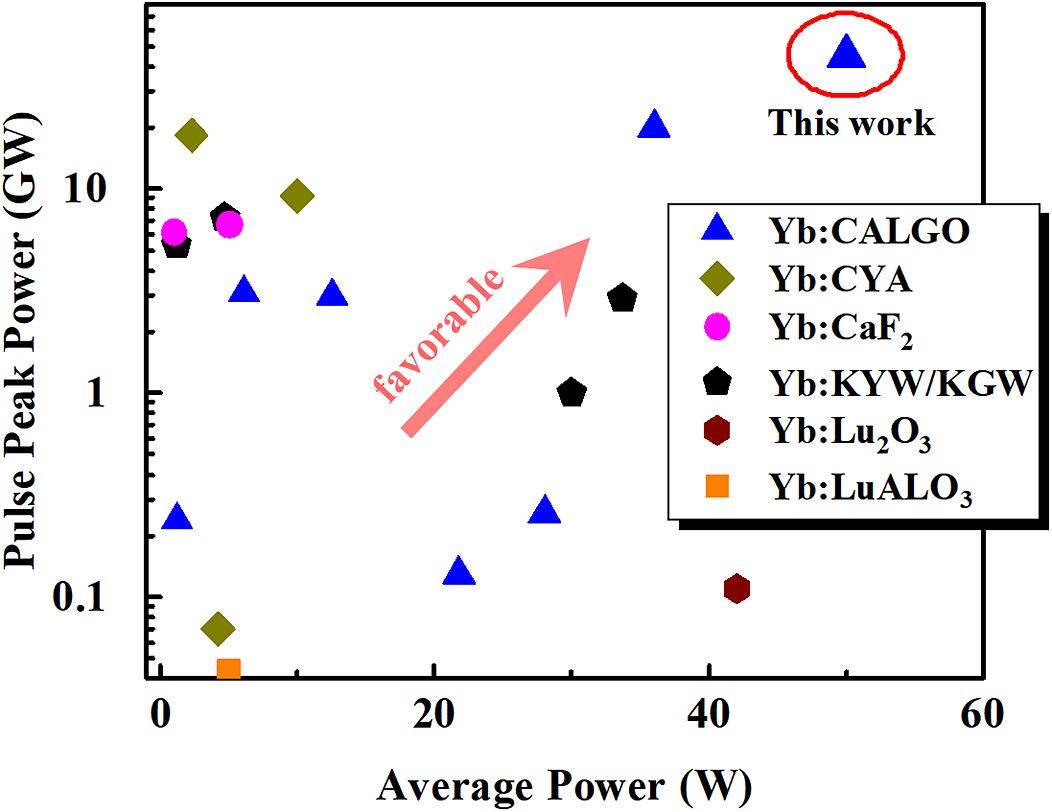
In Figure 6, we compare the results of Yb-doped bulk crystal-based RA schemes operated at room temperature[ Reference Song, Peng, Shen, Sun, Luo, Xu, Xu and Leng32– Reference Wang, Pu, Wu, Li, Wang, Sun and Liang40]. As can be seen, Yb-doped CaYAlO4 (Yb:CYA)[ Reference Song, Peng, Shen, Sun, Luo, Xu, Xu and Leng32, Reference Petrov, Georgiev, Velkov, Trifonov, Xu, Popmintchev and Buchvarov33] and Yb:CaF2-based[ Reference Guo, Liu, Liu, Shao, Li and Hao30, Reference Loeser, Bernert, Albach, Zeil, Schramm and Siebold34] RAs are competent in delivering pulses with approximately 10 GW peak power, but moderate average power. Thanks to the better optical-thermal characteristics, the average powers of the Yb-doped potassium gadolinium tungstate/potassium yttrium tungstate (Yb:KGW/KYW)[ Reference Kim, Yang, Chizhov, Sall, Kulik, Yashin and Kang35– Reference Stučinskas, Antipenkov and Varanavičius37] and Yb:CALGO[ Reference Caracciolo, Kemnitzer, Guandalini, Pirzio, Aus der Au and Agnesi26, Reference Wang, Wu, Liu, Sun and Liang28, Reference Wang, Pu, Wu, Li, Wang, Sun and Liang40] based RAs are brought to over 30 W. Among them, our results push the output average power to exceed 50 W with nearly 50 GW pulse peak power. For a further increase in the average power, a special cavity design consisting of two or more crystals can be adopted. On the other hand, orthogonally placed crystals are favored to combine the emission cross-sections for broader spectral coverage to resist gain-narrowing and realize even shorter pulses.
Yb-doped bulk crystal-based RA parameter statistics.
In conclusion, we have demonstrated a high-energy, high-average-power Yb:CALGO RA that produces pulses with a duration of 130 fs and a peak power of approximately 45 GW. With a maximum absorbed power of over 380 W, the RA cavity is stable enough to output more than 70 W in CW mode. In the seeded mode, the RA cavity maintains stable output across a broad range of repetition rates from 10 to 200 kHz, delivering an average power exceeding 50 W. At a lower repetition rate of 5 kHz, the amplified pulse energy reaches around 7 mJ, which corresponds to a compressed pulse energy of 6.6 mJ with a duration of 130 fs. Looking forward, by improving the RA design, such as incorporating Brewster-angle cleaved crystal, utilizing stronger pumping, implementing longer seed pulse stretching and employing post-compression techniques, we anticipate to achieve 10-mJ level, over 100 W and sub-terawatt level output pulses.
Acknowledgements
This work was supported by the National Key R&D Program of China (2022YFF0706001); the Innovation Program for Quantum Science and Technology (2023ZD0301000); the National Natural Science Foundation of China (62205206, 62375173); and the China Postdoctoral Science Foundation (2023M732320).


 Open access