

Restricted access to food is a circadian synchroniser that modifies liver metabolism( Reference Aguilar-Roblero and Díaz-Muñoz 1 – Reference Arellanes-Licea, Báez-Ruiz and Carranza 3 ). When food availability is limited (30 % less energy content) to 2 h during the daytime restricted feeding (DRF) protocol for a prolonged period of time, a change occurs in the coordination between the suprachiasmatic nucleus (SCN) and the rhythmicities of peripheral circadian oscillators( Reference Damiola, Le Minh and Preitner 4 ). This new state in the circadian timing system allows the expression of an alternative circadian clock known as the food-entrained oscillator (FEO)( Reference Damiola, Le Minh and Preitner 4 , Reference Mistlberger 5 ). The activity of the FEO involves a dynamic mutual interaction between the circadian molecular clock and the metabolic energy networks within a variety of tissues and organs( Reference Luna-Moreno, Aguilar-Roblero and Díaz-Muñoz 2 – Reference Damiola, Le Minh and Preitner 4 , Reference Mistlberger 6 ).
Using the DRF protocol, we have reported that some parameters in the handling of lipids by the liver and adipose tissue are modified before food access: (1) peaks of serum NEFA and ketone bodies (KB) are observed, suggesting increased lipolytic activity and fatty acid oxidation (FAO) in the liver( Reference Díaz-Muñoz, Vázquez-Martínez and Aguilar-Roblero 7 – Reference Rivera-Zavala, Báez-Ruiz and Díaz-Muñoz 9 ); (2) the arrival of NEFA to the liver is associated with activation of PPARα ( Reference Rivera-Zavala, Báez-Ruiz and Díaz-Muñoz 9 ); (3) TAG within the liver are reduced before food access( Reference Díaz-Muñoz, Vázquez-Martínez and Báez-Ruiz 10 ); (4) there is an increase in hepatic mitochondrial proton-motive potential, an oxidised redox state and elevated levels of ATP( Reference Báez-Ruiz, Escobar and Aguilar-Roblero 11 ); (5) 2-h food pulses mainly affect lipid metabolites with discreet action on blood levels of glucose and proteins( Reference Escobar, Díaz-Muñoz and Encinas 8 ); and (6) liver TAG and NEFA showed persistent oscillations under fasting conditions, suggesting that daily fluctuations of lipid metabolites are driven by a circadian clock( Reference Escobar, Díaz-Muñoz and Encinas 8 ).
The liver metabolic activity is compartmentalised following an oxygenation gradient, high O2 levels in the periportal (PP) zone, and lower O2 levels in the perivenous (PV) zone. Hepatic lipid metabolism is zonated: lipogenesis occurs mainly in PV hepatocytes, whereas fatty acid-degradation takes place in PP hepatocytes( Reference Jungermann 12 ). The steps involved in hepatic lipid handling are strictly regulated by the fasting–feeding cycle and the energetic status of the liver( Reference Rui 13 ). As the DRF protocol involves a period of 22 h without food access, we have explored this fasting response by characterising the biochemical, hormonal and transcriptional regulation of gluconeogenesis( Reference Pérez-Mendoza, Rivera-Zavala and Díaz-Muñoz 14 ) as well as the daily variations of ureagenesis( Reference Luna-Moreno, García-Ayala and Díaz-Muñoz 15 ). In this context, it has been reported that the 24-h profiles of the next metabolic regulatory factors, the silent mating type information regulation homolog 1 (SIRT1) and the PPARγ-1α coactivator (PGC-1α), are modified in response to the DRF protocol. SIRT1 showed higher levels before (11.00 hours) and after food intake (14.00 hours), whereas PGC-1α showed an increased level during the entire 24-h cycle( Reference Pérez-Mendoza, Rivera-Zavala and Díaz-Muñoz 14 ).
Some of the most important parameters in the molecular machinery that coordinate the function of the circadian molecular clock and the cellular energy status are the NAD+:NADH and AMP:ATP ratios. For example, the AMP-activated protein kinase (AMPK) and SIRT1 enzymes are activated by the increase of AMP:ATP and NAD+:NADH ratios, respectively( Reference Hardie 16 – Reference Murwarid, Assifi and Constant 18 ). During fasting response in the liver; AMPK, SIRT1 and PGC-1α act through the nuclear receptor PPARα ( Reference Ruderman, Park and Kaushik 19 , Reference Hayashida, Arimoto and Kuramoto 20 ). PPARα regulates the transcription of key gluconeogenic genes (glucose 6 phosphatase and phosphoenolpyruvate carboxykinase (PEPCK)), and the expression of the FAO limiting-enzyme carnitine palmitoyltransferase 1α (CPT-1α)( Reference Zammit 21 ). CPT-1α is inhibited by malonyl-CoA in the postprandial state( Reference McGarry, Mannaerts and Foster 22 ).
During the postprandial state, the complex mobilisation of TAG and cholesterol in the liver and among a variety of tissues is carried out by a family of macromolecules known as lipoproteins (LP). LP are classified according to their proportion of TAG and cholesterol, and the nature of their protein moiety: HDL, LDL and VLDL( Reference Beisiegel 23 ). The hepatic TAG lipase (LIPC) is a lipolytic enzyme that contributes to the regulation of plasma TAG levels and the formation of LDL( Reference Chatterjee and Sparks 24 ).
It is hypothesised, on the basis of these antecedents, that the DRF protocol in the liver involves the appearance of an emergent relationship between the circadian timing system and the energy metabolic pathways. In this context, the present project is aimed at strengthening the notion that lipid metabolism, especially the part related to the fasting response, will be one of the important adaptive processes in the expression of the FEO.
Specifically, we characterised the 24-h profiles of: (1) the production of 14CO2 from 14C-palmitic acid; (2) the differential presence in cytosol and nucleus of the following metabolic effectors: AMPKα, phosphorylated AMP-activated protein kinase α (pAMPKα), SIRT1 and PGC-1α; (3) hepatic zonation of pAMPKα in PP and PV hepatocytes; and (4) the concentrations of circulating KB, cholesterol, TAG and lipoproteins.
Methods
Animals and housing
To ensure homogeneity in the different experimental groups, male albino Wistar rats were obtained exclusively from Instituto de Neurobiología, Campus UNAM-Juriquilla in Querétaro, México. Circadian rhythm protocols involve cycles of 24 h; for our experiments, sampling done in 3 h intervals allowed us to obtain well-defined daily behavioural and experimental data. In agreement with other 24 h rhythmic protocols, our experiments were conducted using four animals (control and experimental) in each sampling time( Reference Cohen 25 , Reference Poland, Rubin and Morton 26 ).
All experimental procedures followed the criteria described in the guidelines. In addition, they were approved and conducted according to the institutional guide for the care and use of animals under biomedical experimentation (Universidad Nacional Autónoma de México), and conformed to previously recommended international ethical standards( Reference Portaluppi, Touitou and Smolensky 27 ). The experiments were performed in accordance with the Mexican Laws for Animal Care (Norma Oficial Mexicana SAGARPA; Secretaría de Agricultura, Ganadería, Desarrollo Rural, Pesca y Alimentación) and the relevant rules set forth by the Mexican Ministry of Health. Adult male Wistar rats, weighing 180 (sem 20) g at the beginning of the experiment, were maintained in a 12 h light–12 h dark cycle (lights on at 08.00 hours) at constant temperature (22±1°C). The light intensity at the surface of the cages averaged 350 luxes. Animals were kept in groups of four in transparent acrylic cages (40×50×20 cm) with free access to water and food unless stated otherwise.
Experimental design
Control and experimental groups were as previously reported( Reference Pérez-Mendoza, Rivera-Zavala and Díaz-Muñoz 14 ). In brief, rats were randomly assigned to one of the following feeding conditions for 3 weeks: (1) the control rats had ad libitum (AL), free access to food and water throughout the 24-h period; and (2) in the DRF rats food access was limited to 2-h daily, from 12.00 to 14.00 hours. At the end of the feeding protocol, different subgroups of animals were beheaded with a guillotine-like device at 3-h intervals over a 24-h period, starting at 08.00 hours. In addition, two more acute feeding control groups were included. (3) In the first group, animals were fed AL for 3 weeks; on the last day, food was removed at 14.00 hours, and the rats were killed at 11.00 hours the next day (after a 21 h fasting (Fa) period); (4) the second group of rats was similarly acutely deprived of food for 21 h, then refed for 2 h (Re) (from 12.00 to 14.00 hours), and killed at 14.00 hours. The experiments were performed following a transverse design to satisfy chronobiological standards. Our protocol used four animals chosen randomly at each sampling time; hence, the total number of experimental animals was sixty-four, including AL-fed and DRF groups. In addition, eight more rats were considered in our protocol for control of feeding condition (acute Fa and Re groups).
Blood and liver sampling
Blood samples were collected in vacutainer tubes and then centrifuged at 5000 rpm for 5 min to obtain serum. The liver was processed for subcellular fractionation (nucleus, mitochondria and cytosol). The liver (approximately 5 g) was homogenised 1:10, w/v in 225 mm sucrose, 0·3 mm ethylene glycol-bis (EGTA), 1 mm 1,4-dithiothreitol and TRIS-HCl (pH 7·4), and it was supplemented with proteases and phosphatase inhibitors at 1500 g for 15 min; the supernatant was centrifuged at 10 000 g for 20 min to sediment the mitochondrial fraction. The new supernatant was ultracentrifuged at 100 000 g for 60 min, yielding the cytosolic fraction (supernatant). The nuclear fraction was prepared from the first pellet using the citric acid method( Reference Aguilar-Delfín, López-Barrera and Hernández-Muñoz 28 ).
Metabolite parameters
The KB and lipid profiles (TAG, cholesterol and lipoproteins) were quantified using a commercial kit (SPINREACT; Lab Center de México S.A. de C.V.), and malonyl-CoA was quantified using a commercial kit (MyBioSource) with an ELISA reader (Bio-Rad Laboratories); all procedures followed the manufacturer’s instructions.
Western blot
Total protein was measured using the Bradford reagent. Equal amounts of proteins (50 μg) were mixed with 2× Laemmli sample buffer (Bio-Rad Laboratories) and incubated at 80°C for 1 min. The proteins were separated on a 10 % polyacrylamide gel, electroblotted onto a nitrocellulose membrane, and then incubated overnight with primary antibody Anti-PGC1α (Abcam) at 1:1000 dilution, Anti-AMPK α1 (2B7) (Abcam) at 1:500 dilution, pAMPKα (Thr172) (40H9) (Cell Signaling Technology) at 1:1000 dilution, Anti-SIRT1 (Abcam) at 1:1000 dilution, Anti-CPT1α, (Cell Signaling Technology) at 1:1000 dilution and Anti-LIPC (Abcam) at 1:1000 dilution. The loading controls were Anti-VDAC1/Porin (Abcam) at 1:1000 dilution, β-actin (13E5) (Cell Signaling Technology) at 1:2000 dilution for cytosol, and Anti-Lamin B1 (Abcam) at 1:1000 dilution. The membranes were washed and incubated for 2 h with alkaline phosphatase (AP)-conjugated (goat anti-rabbit; Abcam) secondary antibody at 1:5000 dilution, and the bands were visualised using the AP conjugate substrate kit (Bio-Rad Laboratories) according to the manufacturer’s instructions.
Phosphorylated AMP-activated protein kinase α hepatic zonation
Liver tissue was fixed for 5 d in 10 % formalin at 4°C, with regular formalin changes. After fixation, the tissue was embedded in paraffin and sectioned into 7–8 μm slices. Samples were deparaffinised overnight at 60°C in a dry‐heat oven. Sections were rehydrated in xylol 100 % (10 min), ethanol 100 % (5 min), ethanol 96 % (5 min), ethanol 80 % (5 min) and deionised water (10 min). Antigen retrieval was performed in saline-sodium citrate Buffer Concentrate 1× (Sigma-Aldrich) in a water bath at 80°C for 25 min, followed by blocking with 1 % non‐fat milk for 1 h. The sections were washed 3×5 min with 0·05 % TRIS-buffered saline plus Tween (TBST) and then incubated overnight at room temperature with the primary antibody against pAMPKα (Thr172) (40H9) at 1:100 dilution. The next day, sections were washed 3×5 min with 0·05 % TBST and incubated for 2 h with the secondary antibody Alexa Fluor® 488 donkey anti‐rabbit IgG (H+L) (Thermo Scientific) at 1:400 dilution. The photos were taken at 40× magnification. The quantification considered the area and optical density (OD) of the negative and positive signals. For the analysis, ten photos (negative and positive signal) were taken per rat, and ten different hepatocytes were selected from the PV and PP zones. The OD of the nucleus in the PV and PP zones was measured in the first five cell rows. The ratio PP:PV was used to assess the zonation. The criteria were: PP (ratio >1·2), PV (ratio <0·8) and without zonation (ratio 0·8–1·2). The OD was measured using an ImagePro Plus Program version 6.1.
14CO2 production
A quantity of 1 g of liver was washed in saline solution and homogenised in 2 ml of mannitol buffer: 300 mm mannitol, 10 mm HEPES and 1 mm EDTA (pH 7·2). The homogenate was centrifuged at 1800 g for 10 min in a Sorvall RC-5B Plus to obtain the supernatant. A total of 2 mg of homogenate was added to give a volume of incubation solution containing 13 mm mannitol, 40 mm NaCl, 5 mm MgCl2, 78 mm TRIS-HCl, 10 mm K2HPO4, 2 mm KCl and 1 mm EDTA, followed by a cold solution of 1 mm l-carnitine, 5 mm ATP, 1 mm NAD, 5 mm ADP, 0·06 mm FAD and 100 μm CoA (pH 7·2) in a 25 ml flask. Finally, 50 μl of stock solution of 2 mm palmitic acid and U-14C-palmitic acid were added, and the flask was capped with a rubber stopper into the middle of which was inserted a clip that held a 600 μl Eppendorf Tube containing 100 μl of 10 % KOH. The flasks were placed in a water bath at 37°C for 90 min. The reaction was terminated by addition of 0·5 ml of 70 % perchloric acid, and the flasks were immediately placed on ice for 60 min. The contents of the Eppendorf Tube were placed in a vial containing 10 ml of Tritosol, and the radioactivity was determined in a cintillation counter; each sample was counted for 2 min. The results are expressed as pmol/g per min.
Data analysis
Power analysis estimated that seventy-two rats (four rats per sampling time) were required to obtain a power of 0·080, when the effect size was moderate (0·030) and a significance level of 0·05 was used( Reference Cohen 25 , Reference Poland, Rubin and Morton 26 ). Data were grouped by experimental condition and time, and are presented as mean values with their standard errors. They were compared by a two-way ANOVA for independent measures with a factor for group (two levels) and a factor for time (eight levels). In order to determine significant time effects for each curve, a one-way ANOVA was performed to detect putative rhythmicity for each group. The one- and two-way ANOVA tests were followed by a Bonferroni post hoc test with the threshold for significance set at P<0·05. The Student’s t test was applied for feeding condition controls, with the threshold for significance also set at P<0·05. Statistical analysis was performed with the Graph Pad Prism program (version 5.0 for Windows; GraphPad Software). All graphs were drawn using the Sigmaplot curve-fitting program (Jandel Scientific).
Results
To address the adaptive response of hepatic lipid metabolism to DRF, parameters corresponding to the FAO process were evaluated. Indeed, KB and CO2 from β-oxidation are products of mitochondrial FAO in the liver. Fig. 1(a) depicts the 24-h variations in circulating KB. The AL group showed constant values for serum KB. Certainly, the fasting associated with the resting-sleep period was not enough to promote measurable ketogenesis. In contrast, the DRF group showed a significant increase of approximately 50 % before (at 11.00 hours) and approximately 30 % after (at 14.00 hours) mealtime over the AL group. This elevation represents active ketogenesis in the rats under food restriction. During the light period, KB increased by approximately 23 % in the DRF group. This represents an unexpected metabolic response as the DRF group finishes mealtime at 14.00 hours, and ketogenic activity is usually associated with a fasting condition. The acute feeding control of 21-h fasting (Fa group) showed a 55 % increase in serum KB over the DRF group (at 11.00 hours). In contrast to the DRF group, KB in the acute refed rats (Re group) were reduced to the level of the AL group after feeding. Fig. 1(b) shows the daily profile of in vitro 14C-palmitic acid oxidation measured as yield of 14CO2. Both the groups, AL and DRF, showed a significant rhythmic profile with a major peak at 20.00 hours (approximately 49 %) and 17.00 hours (approximately 80 %), respectively. DRF rats showed a second, smaller peak at 02.00 hours. In addition, the DRF group showed an average 14CO2 production increase of approximately 32 % during the light period in comparison with the AL group. Meanwhile, the Fa group showed a significant increase of approximately 50 % in comparison with both the AL and DRF groups (at 11.00 hours). This increase was abolished in the Re group. Complementarily, CPT-1α (limiting enzyme for mitochondrial uptake of acyl-fatty acids) as well as malonyl-CoA (main metabolite inhibitor of CPT-1α in response to nutrient uptake) was measured.
Effect of restricted feeding on daily variations of the fatty acid oxidation (FAO) pathway. (a) Ketone bodies (serum), (b) 14CO2 released by FAO, (c) malonyl-CoA (serum) and (d) carnitine palmitoyl transferase-1α (CPT-1α) protein. Control group fed ad libitum (AL, ![]() ), group with daytime restricted feeding (DRF,
), group with daytime restricted feeding (DRF, ![]() ), 21 h fasting group (Fa,
), 21 h fasting group (Fa, ![]() ) and group refed after a 21-h fast (Re,
) and group refed after a 21-h fast (Re, ![]() ). Values are means (n 4 rats), with their standard errors.
). Values are means (n 4 rats), with their standard errors. ![]() and
and ![]() , 12 h light–12 h dark periods, respectively;
, 12 h light–12 h dark periods, respectively; ![]() , time of food access (from 12.00 to 14.00 hours); CPT-1α, carnitine palmitoyltransferase 1α. * Time points with a significant difference between the AL and DRF groups (two-way ANOVA, P<0·05, Bonferroni post hoc test). †‡ Significant intra-group differences within AL and DRF groups, respectively (one-way ANOVA, P<0·05, Bonferroni post hoc test). §|| Significant differences of the Fa and Re groups compared with the DRF group (at 11.00 and 14.00 hours), respectively. ¶ Significant differences between the Fa and Re groups (Student’s t test, P<0·05).
, time of food access (from 12.00 to 14.00 hours); CPT-1α, carnitine palmitoyltransferase 1α. * Time points with a significant difference between the AL and DRF groups (two-way ANOVA, P<0·05, Bonferroni post hoc test). †‡ Significant intra-group differences within AL and DRF groups, respectively (one-way ANOVA, P<0·05, Bonferroni post hoc test). §|| Significant differences of the Fa and Re groups compared with the DRF group (at 11.00 and 14.00 hours), respectively. ¶ Significant differences between the Fa and Re groups (Student’s t test, P<0·05).

Fig. 1(c) and (d) indicate that the levels of malonyl-CoA and CPT-1α in the liver remained constant in the AL and DRF groups along the day–night cycle. However, the 24-h mean value for CPT-1α in the DRF rats showed a clear tendency to decrease with respect to the AL group. The acute fasting and refed conditions did not change the malonyl-CoA levels; in contrast, the Fa group showed a significant increase (approximately 38 %) in the presence of CPT-1α in comparison with DRF rats (at 11.00 hours), and the Re group showed an increase of approximately 50 % in CPT-1α at 14.00 hours. Taken together, these results indicate that in spite of the DRF group having undergone a 22 h fast, the parameters related to FAO did not show the expected profile of a fasting response.
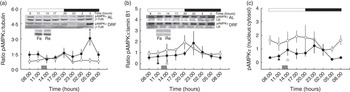
In order to maintain energetic homoeostasis, the liver uses metabolic sensors such as the AMPK complex. AMPK contains a catalytic subunit (α) and two regulatory subunits (β and γ). AMP or ADP can bind to the γ subunit under reduced intracellular ATP levels. The full activation of AMPK is accomplished by the serine/threonine kinase LKB1 phosphorylation in Thr172( Reference Hardie and Alessi 29 ). Fig. 2(a) depicts the daily profile of the concentration of pAMPKα in cytosol: the AL group showed constant values, whereas the DRF group showed an increase of approximately 50 % at the end of the dark phase (at 05.00 hours). The acute feeding control Fa and Re groups did not show differences against the DRF group (at 11.00 and 14.00 hours, respectively); however, both groups showed lower values than the DRF group (at 05.00 hours). The pAMPKα within the nucleus (Fig. 2(b)) showed constant values in the AL and DRF groups, with a subtle increase during the day–night transition in both groups. The Fa and Re groups showed a decrease of 93 and 96 % with respect to the DRF groups (at 11.00 and 14.00 hours, respectively). The Fa and Re groups showed reduced values in comparison with the AL group average. The nucleus:cytosol ratio of pAMPKα showed constant daily values in the AL and DRF groups. The DRF group showed a subtle increase of pAMPKα during the day–night transition, with a decrease at the end of the dark phase (at 05.00 hours) that reflected the increase in the cytosolic fraction (at 05.00 hours) (Fig. 2(c)). These data suggest that the DRF group could exhibit pronounced changes in energetic status adaptation throughout the 24 h cycle compared with the AL group.
Effect of restricted feeding on daily variations of phosphorylated AMP kinase α (pAMPKα) protein in cytosol, nucleus and the ratio of pAMPKα (nucleus:cytosol). (a) AMP-activated protein kinase (AMPKα) (cytosol), (b) AMPKα (nucleus) and (c) AMPKα (nucleus:cytosol). Control group fed ad libitum (AL, ![]() ), group with daytime restricted feeding (DRF,
), group with daytime restricted feeding (DRF, ![]() ), 21 h fasting group (Fa,
), 21 h fasting group (Fa, ![]() ) and group refed after a 21-h fast (Re,
) and group refed after a 21-h fast (Re, ![]() ). Values are means (n 4 rats), with their standard errors.
). Values are means (n 4 rats), with their standard errors. ![]() and
and ![]() , 12 h light–12 h dark periods, respectively;
, 12 h light–12 h dark periods, respectively; ![]() , time of food access (from 12.00 to 14.00 hours); β-TUB, β-tubulin; LB, laminin B. * Time points with a significant difference between the AL and DRF groups (two-way ANOVA, P<0·05, Bonferroni post hoc test). §|| Significant differences of the Fa and Re groups compared with the DRF group (11.00 and 14.00 hours), respectively (Student’s t test, P<0·05).
, time of food access (from 12.00 to 14.00 hours); β-TUB, β-tubulin; LB, laminin B. * Time points with a significant difference between the AL and DRF groups (two-way ANOVA, P<0·05, Bonferroni post hoc test). §|| Significant differences of the Fa and Re groups compared with the DRF group (11.00 and 14.00 hours), respectively (Student’s t test, P<0·05).
Heterogeneous distribution of biochemical pathways through the hepatic acini is known as liver zonation. PP and PV regions exhibit distinct responses to dietary conditions. Liver zonation of the pAMPKα is shown in Fig. 3. In the AL group, this enzyme is present in the PV zone at 11.00 hours, but the zonation is lost at 14.00 and 05.00 hours. In contrast, there was no preferential zonation of pAMPKα in the DRF group at 11.00 hours, but it became PP at 14.00 and 05.00 hours. No zonation was observed in the pAMPKα within the Fa or Re feeding condition controls. The differential compartmentalisation observed in the DRF group responds to an adaptive process distinct to the acute feeding groups.
Zonal distribution of phosphorylated AMP kinase α (pAMPKα) in the perivenous (PV) and periportal (PP) hepatic nucleus. (a) Immunohistochemical signal for pAMPKα in ad libitum (AL) and daytime restricted feeding (DRF) groups (11.00, 14.00 and 05.00 hours), 21 h fasting group (Fa) and refed after a 21-h fast (Re) groups in the portal and central zone. ![]() , Magnifications, 40× scales. Insets included in images of PV and PP hepatocytes are representative of control slices without primary antibody. (b) Histogram showing quantification (optical density (OD)) of the pAMPKα signal in PP (
, Magnifications, 40× scales. Insets included in images of PV and PP hepatocytes are representative of control slices without primary antibody. (b) Histogram showing quantification (optical density (OD)) of the pAMPKα signal in PP (![]() ) and PV (
) and PV (![]() ) hepatocytes. The ratio between the OD measured in PV and PP hepatocytes is depicted at the top of each column. Hence, distribution can be PP (>1·2), PV (<0·8) or without zonation ( 0·8–1·2). Values are means of at least 200 independent observations of individual hepatocyte nuclei.
) hepatocytes. The ratio between the OD measured in PV and PP hepatocytes is depicted at the top of each column. Hence, distribution can be PP (>1·2), PV (<0·8) or without zonation ( 0·8–1·2). Values are means of at least 200 independent observations of individual hepatocyte nuclei.

On the other hand, SIRT1 is another key metabolic sensor of energy status; it regulates glucose and lipid metabolism in the liver, and it promotes gluconeogenesis and FAO( Reference Tanner, Landry and Sternglanz 30 ). Fig. 4(a) depicts the daily profile of SIRT1. The AL and DRF groups showed constant values of SIRT1 in the nucleus. However, the Fa group showed a marked increase in SIRT1 (approximately 58 %) over the DRF group (at 11.00 hours) and approximately 39 % over the Re group. The acute Re group showed a subtle increase of approximately 15 % over the DRF group (at 14.00 hours). The nuclear:cytosolic ratio of SIRT1 presence was also calculated (Fig. 4(b)) on the basis of previously reported data that used the same experimental DRF protocol( Reference Luna-Moreno, García-Ayala and Díaz-Muñoz 15 ). This ratio showed a non-rhythmic pattern in the AL group and a clear elevation (approximately 53 %) in the dark period (02.00 and 05.00 hours) in the DRF group. Indeed, this increase was due to a reduction in the cytosolic SIRT1 of DRF rats at those times. The feeding condition controls, the Fa and Re groups (at 11.00 and 14.00 hours), showed values similar to the AL groups, but they showed significant increases of approximately 55 and 35 %, respectively, in comparison with the DRF group. Once more, the DRF condition showed a distinct pattern not observed in the acute fasting and refed groups, highlighting a different energetic regulation.
Effect of restricted feeding on daily variations of silent mating type information regulation homolog 1 (SIRT1) protein in the nucleus and the ratio of SIRT1 (nucleus:cytosol). (a) SIRT1 (nucleus) and (b) SIRT1 (nucleus:cytosol). Control group fed ad libitum (AL, ![]() ), group with daytime restricted feeding (DRF,
), group with daytime restricted feeding (DRF, ![]() ), 21 h fasting group (Fa,
), 21 h fasting group (Fa, ![]() ) and group refed after a 21-h fast (Re,
) and group refed after a 21-h fast (Re, ![]() ). Values are means (n 4 rats) with their standard errors.
). Values are means (n 4 rats) with their standard errors. ![]() and
and ![]() , 12 h light–12 h dark periods, respectively;
, 12 h light–12 h dark periods, respectively; ![]() , time of food access (from 12.00 to 14.00 hours); LB, Laminin B. * Time points with a significant difference between the AL and DRF groups (two-way ANOVA, P<0·05, Bonferroni post hoc test). † Significant intra-group differences within DRF groups (one-way ANOVA, P<0·05, Bonferroni post hoc test). ‡§ Significant differences of the Fa and Re groups compared with the DRF group (11.00 and 14.00 hours), respectively. || Significant differences between the Fa and Re groups (Student’s t test, P<0·05).
, time of food access (from 12.00 to 14.00 hours); LB, Laminin B. * Time points with a significant difference between the AL and DRF groups (two-way ANOVA, P<0·05, Bonferroni post hoc test). † Significant intra-group differences within DRF groups (one-way ANOVA, P<0·05, Bonferroni post hoc test). ‡§ Significant differences of the Fa and Re groups compared with the DRF group (11.00 and 14.00 hours), respectively. || Significant differences between the Fa and Re groups (Student’s t test, P<0·05).

PGC-1α, another molecule responsible for energetic and lipid metabolism homoeostasis was evaluated. Fig. 5(a) shows the daily profile of PGC-1α in the cytosolic fraction of the AL and DRF groups. The data indicated no differences between the two groups except a tendency for higher values at the light–dark transition (at 20.00 hours). Again, from data previously reported using the same experimental protocol of DRF( Reference Pérez-Mendoza, Rivera-Zavala and Díaz-Muñoz 14 ), the nuclear:cytosolic ratio for the distribution of PGC-1α was also calculated (Fig. 5(b)). Both the AL and DRF groups showed an increase at 23.00 hours that was statistically significant in the DRF rats, but the main difference was a significant reduction (approximately 68 %) in the DRF rats throughout the entire day–night cycle. This diminution in the nuclear:cytosolic ratio of PGC-1α is explained by the striking elevation of this factor in the cytosolic fraction of the DRF rats. The differential distribution of PGC-1α suggests that the DRF protocol promotes a distinct regulation of energetic status along the 24 h cycle, accompanied by a reduction of the transcriptional activity associated with PGC-1α.
Effect of restricted feeding on daily variations of PPARγ-1α coactivator (PGC-1α) protein in the nucleus and the distribution of PGC-1α (nucleus:cytosol). (a) PGC-1α (nucleus) and (b) PGC-1α (nucleus:cytosol). Control group fed ad libitum (AL, ![]() ), group with daytime restricted feeding (DRF,
), group with daytime restricted feeding (DRF, ![]() ), 21 h fasting group (Fa,
), 21 h fasting group (Fa, ![]() ) and group refed after a 21-h fast (Re,
) and group refed after a 21-h fast (Re, ![]() ).
). ![]() and
and ![]() , 12 h light–12 h dark periods, respectively;
, 12 h light–12 h dark periods, respectively; ![]() , time of food access (from 12.00 to 14.00 hours); LB, laminin B. Values are means (n 4 rats) with their standard errors. *† Significant intra-group differences within AL and DRF groups, respectively (one-way ANOVA, P<0·05, Bonferroni post hoc test). ‡§ Significant differences of the Fa and Re groups compared with the DRF group (11.00 and 14.00 hours), respectively (Student’s t test, P<0·05).
, time of food access (from 12.00 to 14.00 hours); LB, laminin B. Values are means (n 4 rats) with their standard errors. *† Significant intra-group differences within AL and DRF groups, respectively (one-way ANOVA, P<0·05, Bonferroni post hoc test). ‡§ Significant differences of the Fa and Re groups compared with the DRF group (11.00 and 14.00 hours), respectively (Student’s t test, P<0·05).

The 24-h variation of the serum lipid profile is shown in Fig. 6. Total cholesterol levels are depicted in Fig. 6(a): the AL group showed no rhythmicity, whereas the DRF rats exhibited two peaks at 17.00 and 02.00 hours. In addition, the total cholesterol was higher (approximately 20 %) over the 24-h cycle in the DRF group. This parameter in the Fa and Re groups showed values similar to those of the AL group. In Fig. 6(b), the 24-h profile of serum TAG is shown. The AL and DRF groups showed rhythmic variations; AL rats displayed peaks at 11.00 and 02.00 hours, whereas the DRF group showed a valley at 11.00 h, just before food access. TAG levels in the Fa and Re groups showed no differences and their values were similar to the DRF group. In Fig. 6(c), the levels of HDL are shown. No rhythmicity was detected in AL rats, whereas DRF rats showed higher values at 17.00 and 20.00 hours. Acute fasting and refeeding promoted a significant reduction (approximately 50 %) in circulating HDL. The 24-h profile of serum LDL (Fig. 6(d)) was similar to the one observed with cholesterol (Fig. 6(a)). The DRF group showed a significant increase (approximately 50 %) in LDL relative to the AL group throughout the 24-h cycle. Values of LDL in the Fa and Re groups were similar to those shown by the DRF rats. Fig. 6(e) shows the index log (TAG/HDL). The 24-h profile of the AL group showed an approximately 24 % increase over DRF rats, with a peak at 11.00 hours. The DRF group showed a valley at 11.00 hours before food access with a tendency towards lower values in the dark period. The Fa group showed a tendency to increase compared with the Re group and DRF rats. Finally, LIPC in the AL group showed a 24-h rhythm with a significant peak during the dark phase of the feeding period (23.00 hours). The daily pattern of the DRF group showed a phase shift with a similar increase during the light phase, coincident with the time of food access. Acute feeding control conditions showed an elevation (approximately 20 %) in the refed rats in comparison with the DRF rats (at 14.00 hours) and fasting rats (at 11.00 hours) (Fig. 6(f)). Hence, the DRF condition impacts lipid metabolism and their daily patterns.
Effect of restricted feeding on daily variations of the lipid profile in serum and hepatic lipase (LIPC) protein. (a) Cholesterol, (b) TAG, (c) HDL, (d) LDL, (e) atherogenic index (AI) and (f) lipase C. Control group fed ad libitum (AL, ![]() ), group with daytime restricted feeding (DRF,
), group with daytime restricted feeding (DRF, ![]() ), 21 h fasting group (Fa,
), 21 h fasting group (Fa, ![]() ) and group refed after a 21-h fast (Re,
) and group refed after a 21-h fast (Re, ![]() ). Values are means (n 4 rats), with their standard errors.
). Values are means (n 4 rats), with their standard errors. ![]() and
and ![]() , 12 h light–12 h dark periods, respectively;
, 12 h light–12 h dark periods, respectively; ![]() , time of food access (from 12.00 to 14.00 hours); β-TUB, β-tubulin. * Time points with a significant difference between the AL and DRF groups (two-way ANOVA, P<0·05, Bonferroni post hoc test). †‡ Significant intra-group differences within AL and DRF groups, respectively (one-way ANOVA, P<0·05, Bonferroni post hoc test). || Significant difference of the Re group compared with the DRF group (14.00 hours) (Student’s t test, P<0·05). ¶ Significant differences between Fa and Re groups (Student’s t test, P<0·05).
, time of food access (from 12.00 to 14.00 hours); β-TUB, β-tubulin. * Time points with a significant difference between the AL and DRF groups (two-way ANOVA, P<0·05, Bonferroni post hoc test). †‡ Significant intra-group differences within AL and DRF groups, respectively (one-way ANOVA, P<0·05, Bonferroni post hoc test). || Significant difference of the Re group compared with the DRF group (14.00 hours) (Student’s t test, P<0·05). ¶ Significant differences between Fa and Re groups (Student’s t test, P<0·05).

Table 1 shows the average parameters of lipid metabolism for the AL and DRF groups. In the AL group, increases in CPT-1α, pAMPKα (nucleus:cytosol), PGC-1α (nucleus:cytosol) and atherogenic index (AI) are observed, whereas in the DRF group KB, SIRT1 (nucleus:cytosol), cholesterol and LDL are elevated.
Comparison between groups fed ad libitum (AL) and under daytime restricted feeding (DRF) of 24-h average valuesFootnote * (Mean values with their standard errors)
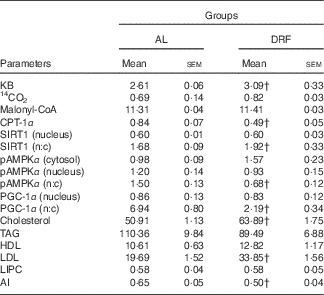
KB, ketone bodies; CPT-1α, carnitine palmitoyltransferase 1α; SIRT1, silent mating type information regulation homolog 1; n:c, ratio of nucleus:cytosol; pAMPKα, phosphorylated AMP-activated protein kinase α; LIPC, hepatic lipase; AI, atherogenic index.
† Mean value was significantly different from that of the AL group (P<0·05; Student’s t test); four independent experimental observations.
Discussion
DRF involves a hypoenergetic food intake and a daily synchronisation to food access( Reference Luna-Moreno, Aguilar-Roblero and Díaz-Muñoz 2 , Reference Arellanes-Licea, Báez-Ruiz and Carranza 3 ). This combination underlies emergent metabolic regulations that influences lipid metabolism in the liver and adipose tissue. The metabolic parameters regulated under the FEO expression showed a rheostatic adaptation in contrast to the conventional acute fasting and refeeding( Reference Aguilar-Roblero and Díaz-Muñoz 1 , Reference Escobar, Díaz-Muñoz and Encinas 8 ). This condition was suggestive of an up-regulation of the lipolytic activity in adipose tissue as well as of a temporal regulation of β-oxidation in the liver( Reference Arellanes-Licea, Báez-Ruiz and Carranza 3 , Reference Rivera-Zavala, Báez-Ruiz and Díaz-Muñoz 9 ).
Metabolic implications
Upon the arrival of NEFA, hepatic FAO produces high levels of acetyl-CoA, which is converted into KB within mitochondria( Reference Balasse and Féry 31 ). Our results showed an increase in circulating KB in the DRF group before food access (Fig. 1(a)). KB generation is regulated by the glucagon:insulin ratio under fasting or energy-restricted conditions( Reference Reed, Baab and Hawkins 32 ); glucagon increases KB production, whereas insulin decreases it. The DRF protocol involves high levels of glucagon and reduced circulating insulin before mealtime( Reference Díaz-Muñoz, Vázquez-Martínez and Aguilar-Roblero 7 , Reference Pérez-Mendoza, Rivera-Zavala and Díaz-Muñoz 14 ). In acute fasting, greater production of KB starts when glycaemia drops several hours after food ingestion( Reference Balasse and Féry 31 ) (Fig. 1(a)). However, in the DRF rats, serum KB showed a more discreet elevation. This result suggests that after twenty-one cycles of DRF, the fasting response is different, perhaps due to the hyperphagia associated with the slow emptying of the gastric chamber, as well as to the elevated content of hepatic glycogen and the reduction of visceral adipose tissue( Reference Arellanes-Licea, Báez-Ruiz and Carranza 3 , Reference Díaz-Muñoz, Vázquez-Martínez and Báez-Ruiz 10 ).
In the liver, NEFA are taken up and activated to form acyl-derivatives with CoA. Acyl-CoA and their metabolites can act as ligands of the PPAR as well as substrates for peroxisomal and mitochondrial FAO( Reference Yu, Rao and Reddy 33 ). Complete mitochondrial FAO produces CO2 ( Reference Lodish, Berk and Zipursky 34 , Reference Ontko 35 ). The AL rats showed the highest levels of 14CO2 from FAO during the light–dark transition before mealtime, when the lipolytic activity is expected; in contrast, the DRF group showed two peaks of 14CO2 from FAO (at 17.00 and 02.00 hours) (Fig. 1(b)). The production of 14CO2 (at 17.00 hours) could be the result of a sudden reduction in insulin levels already reported in the DRF group( Reference Díaz-Muñoz, Vázquez-Martínez and Aguilar-Roblero 7 , Reference Pérez-Mendoza, Rivera-Zavala and Díaz-Muñoz 14 ). This pattern could be interpreted as an ‘out-of-time’ fasting response as it is coincident with an elevation of liver PEPCK activity in DRF rats( Reference Pérez-Mendoza, Rivera-Zavala and Díaz-Muñoz 14 ). The peak at 02.00 hours is smaller and does not coincide with elevated KB. FAO promotes the production of acetyl-CoA that can enter into the Krebs cycle or be used for ketogenesis. This result could be explained by an enhanced entry of acetyl-CoA into the Krebs cycle instead of KB production( Reference Balasse and Féry 31 , Reference Lodish, Berk and Zipursky 34 ).
PPARα regulates the FAO pathway via CPT-1α. The presence of PPARα in the liver showed a peak before food intake in DRF rats; this peak is coincident with the peak of acyl-CoA oxidase, which is the limiting step in the peroxisomal FAO( Reference Rivera-Zavala, Báez-Ruiz and Díaz-Muñoz 9 , Reference Reddy and Hashimoto 36 ). FAO is also controlled by malonyl-CoA, an allosteric inhibitor of CPT-1α ( Reference McGarry, Mannaerts and Foster 22 ). CPT-1α and malonyl-CoA levels were not significantly different between the AL and DRF groups (Fig. 1(c) and (d)). In contrast, the acute fasting control showed an evident increase in CPT-1α expression (Fig. 1(d)), indicating the correct sensitivity of our assay. Despite being lower in DRF rats, the CPT-1α concentration would be enough to activate NEFA and carry out their oxidation (Fig. 1(d)). At the same time, our results showed higher levels of 14CO2 production from 14C-palmitoyl CoA over a 24-h period in DRF rats (Table 1), which could mean that CPT-1α could be regulated by covalent modifications or by the mitochondrial membrane microenvironment to favor Krebs cycle( Reference Zammit 21 , Reference Lodish, Berk and Zipursky 34 ). The physicochemical properties of the membrane and the effects of pH on malonyl-CoA promote conformational changes in CPT-1α in response to hormonal and nutritional states that determine the kinetic characteristics of the protein( Reference Zammit 21 , Reference Stephens, Cook and Harris 37 ).
Metabolic regulators (phosphorylated AMP-activated protein kinase, silent mating type information regulation homolog 1 and PPARγ-1α coactivator)
The liver shows metabolic plasticity that is necessary for energy homoeostasis( Reference Owen, Reichard and Patel 38 ). Part of this plasticity is the metabolic zonation observed in PV and PP hepatocytes; gluconeogenesis, ureagenesis, ketogenesis and β-oxidation are predominant in the PP zone, whereas glycolysis and lipogenesis are more active in the PV zone. In the fasting state, both mitochondrial FAO and ketogenesis predominate in PP hepatocytes( Reference Guzman, Bijleveld and Geelen 39 ). In addition, glucagon promotes the activation of AMPK and elevates FAO during fasting( Reference Heimberg, Weinstein and Kohout 40 ). AMPK is an energy sensor that is activated by exercise, starvation and energy restriction; it is located mainly in the PP zone, which is coincident with the presence of glucagon receptors( Reference Witters, Gao and Kemp 41 ). Overall, the changes in liver zonation of pAMPK detected in this project, as well as the changes reported for PEPCK( Reference Pérez-Mendoza, Rivera-Zavala and Díaz-Muñoz 14 ), are indicative of adaptation in cellular plasticity that takes place in the liver during the expression of the FEO.
pAMPKα was present in the nucleus within the PV zone in the AL rats at 11.00 hours (Fig. 2(b)); its presence in hepatic nuclei showed an enhanced PP zonation in the DRF group (14.00 and 05.00 hours). pAMPKα also leads to inhibition of lipogenesis and glucose production( Reference Viollet, Foretz and Guigas 42 ). It is known that AMPKα is phosphorylated and activated by LKB1 in response to stress( Reference Hardie and Alessi 29 ). The DRF protocol could involve some stress; for example, the hyperphagia that results in gastric distention after feeding and the increase in NF-κB within the hepatocyte nuclei after mealtime( Reference Luna-Moreno, Aguilar-Roblero and Díaz-Muñoz 2 ) might cause an activation of AMPK independent of energy and nutritional status. That possibility remains to be tested. The acute fasting group showed a higher presence of pAMPKα compared with the DRF group at 11.00 hours, but without zonation, indicating that DRF rats adapt differently to the processing of nutrients by the liver. The hepatic zonation of pAMPKα in the AL and DRF groups is temporary; this implies distinctive dynamic regulation and metabolic actions of pAMPKα in both groups.
Deacetylase SIRT1 responds to the NAD+:NADH ratio when the energy status is low, usually during fasting and energy restriction. Nuclear SIRT1 acts on a variety of transcription factors and coactivators such as forkhead box (FoxO) and PGC-1α, promoting the up-regulation of genes involved in gluconeogenesis and FAO (GPase, PEPCK and CPT-1α)( Reference Hayashida, Arimoto and Kuramoto 20 , Reference Kwon and Ott 43 , Reference Rodgers and Puigserver 44 ). The presence of cytosolic SIRT1( Reference Pérez-Mendoza, Rivera-Zavala and Díaz-Muñoz 14 ) showed an increase before and after mealtime in DRF; this event is coincident with the increase of PEPCK activity( Reference Pérez-Mendoza, Rivera-Zavala and Díaz-Muñoz 14 ). Despite the fact that nuclear SIRT1 did not show differences between the AL and DRF groups, the nucleus:cytosol ratio of SIRT1 distribution showed a significant increase at 05.00 hours. This result could be explained by the SIRT1 transit into and out of the nucleus, which varies in response to the energy status (NAD+ availability)( Reference Tanno, Sakamoto and Miura 45 ). The increase of nuclear SIRT1 at the end of the dark phase (Fig. 4(a)) could be associated with the deacetylation of PGC-1α and FoxO during the activation of gluconeogenesis and FAO, resulting in the increase of circulating KB (Fig. 1(a)) as well as PEPCK activation in DRF rats( Reference Pérez-Mendoza, Rivera-Zavala and Díaz-Muñoz 14 , Reference Rodgers, Lerin and Haas 17 ).
PGC-1α regulates the transcriptional activation of PPARα as part of a global control of the fasting response( Reference Vega, Huss and Kelly 46 ). In this condition, the expression of PGC-1α is synergistically induced by glucagon and glucocorticoids( Reference Yoon, Puigserver and Chen 47 ). The DRF protocol promotes the increase of circulating glucagon and glucocorticoids, especially before the time of food access. Some of the principal effects of glucagon and glucocorticoids are the hydrolysis of TAG in the adipose tissue and the regulation of FAO and gluconeogenesis in the liver( Reference Rui 13 , Reference Ahmadian, Duncan and Jaworski 48 ). The effects of glucagon and glucocorticoids could be associated with the increase of cytosolic PGC-1α (approximately 40 %) in the 24-h profile under the DRF condition( Reference Pérez-Mendoza, Rivera-Zavala and Díaz-Muñoz 14 ). However, its concentration in nuclear fractions showed no changes, an effect similar to that observed with SIRT1. The AL rats showed a 78 % increase in the nucleus:cytosol ratio of SIRT1 distribution (at 05.00 hours); however, the effect of PGC-1α on the regulation of the gluconeogenic enzymes, PEPCK and GP6ase, as well as on FAO can be observed under the DRF condition (Fig. 1(b))( Reference Pérez-Mendoza, Rivera-Zavala and Díaz-Muñoz 14 ).
Lipoprotein metabolism
Lipoprotein metabolism responds to fasting and feeding cycles. After food intake, the formation and assembly of VLDL is regulated by Apo B100 availability as well as by the formation of TAG within the liver( Reference Beisiegel 23 , Reference Fisher and Ginsberg 49 ). Circulating VLDL are captured and hydrolysed to LDL in extrahepatic tissues. In the fasting state, TAG are hydrolysed in the adipose tissue to release NEFA and glycerol in response to catabolic hormones (e.g. glucagon, adrenaline and glucocorticoids); eventually, NEFA are oxidised in the liver and in skeletal and cardiac muscles( Reference Rui 13 ).
The liver is the major organ that controls LDL transformation; approximately 50 % of LDL molecules are degraded by the liver in a process mediated by Apo B and hepatic LDL receptors( Reference Fisher and Ginsberg 49 ). Changes in the expression of LDL receptors can modify the levels of circulating LDL( Reference Goldstein, Basu and Brown 50 ) and the cholesterol requirements of different organs. Apo E plays a role in the clearance of remnant lipoproteins by the liver; it is necessary to keep cholesterol levels low in plasma and participates in the uptake system for LDL( Reference Kuipers, Jong and Lin 51 ). Unpublished microarray results from our group indicate a significant decrease of Apo E mRNA (at 08.00 and 14.00 hours) in livers of the DRF group (Table 2). Thus, the potential decrease of Apo E, and the reduction of serum VLDL could be related to the higher levels of LDL (approximately 50 %) and cholesterol (approximately 20 %) observed in the DRF condition. An injection of methylprednisolone in male Wistar rats promotes the increase of LDL in serum( Reference Hazra, Pyszczynski and DuBois 52 ); data previously reported showed an increase (approximately 20 %) in the 24-h profile of serum corticosteroids in DRF rats( Reference Luna-Moreno, Aguilar-Roblero and Díaz-Muñoz 2 ).
The paraoxonase enzyme that prevents the formation of atherogenic oxidised-LDL( Reference Cao, Girard-Globa and Berthezene 53 ) showed an increase (Table 2) at 11.00 hours (unpublished microarray results). This suggests that the lipoprotein profile changes in a coordinated response during the DRF protocol/FEO expression. The physiological implications remain to be explored, but it is interesting that the atherogenic index was lower in the DRF rats (Fig. 6(f)).
Earlier studies showed a reduction of circulating and hepatic TAG before food access in the DRF group( Reference Escobar, Díaz-Muñoz and Encinas 8 , Reference Díaz-Muñoz, Vázquez-Martínez and Báez-Ruiz 10 ). The LIPC hydrolyses TAG and phospholipids, promoting the uptake of HDL by liver, and converts intermediate-density lipoprotein into LDL( Reference Landin, Nilsson and Twu 54 ). In the DRF group, the increase of LIPC before mealtime coincides with a reduction of TAG in liver( Reference Díaz-Muñoz, Vázquez-Martínez and Báez-Ruiz 10 ). Another enzyme, lipoprotein lipase (LPL), hydrolyses circulating chylomicrons and VLDL( Reference Murdoch and Breckenridge 55 ). Processing of VLDL by LPL results in the formation and cholesterol and apoE( Reference Mead, Irvine and Ramji 56 ). Unpublished microarray results showed an increase of hepatic LPL (Table 2), before food intake that could be associated with the reduction of serum TAG and VLDL. HDL did not show significant differences but the daily profile was modified by the DRF condition.
Unpublished microarray results from our group indicate a significant decrease in Apo E mRNA (at 08.00 and 14.00 hours) in livers of the DRF group (Table 2). Thus, the potential decrease of Apo E, and the reduction of serum VLDL, could be related to higher levels of LDL (approximately 50 %) and cholesterol (approximately 20 %) observed in the DRF condition. An injection of methylprednisolone in male Wistar rats promotes the increase of LDL in the serum( Reference Kuipers, Jong and Lin 51 ); data previously reported showed an increase (approximately 20 %) in the 24-h profile of serum corticosteroids in DRF rats( Reference Luna-Moreno, Aguilar-Roblero and Díaz-Muñoz 2 ).
An atherogenic profile is an important risk factor for coronary diseases( Reference Dobiásová and Frohlich 57 , Reference Mertz 58 ). However, changes in serum lipoproteins cannot always be associated with dyslipidaemias; for example, pregnant women show increased serum lipid content but a low cardiac risk factor( Reference Neboh, Emeh and Aniebue 59 ); the AI is higher in postmenopausal women( Reference Nwagha, Ikekpeazu and Ejezie 60 ); the lipid profile is atherogenic during pregnancy and lactation in Sprague–Dawley rats( Reference Smith, Lear and Forte 61 ); high-sucrose and high-fat diets increase TAG in the serum and liver, as well as circulating cholesterol and LDL( Reference Ryu and Cha 62 ). According to our results, the DRF group showed a decrease in AI in spite of high LDL levels; this can be explained by the low TAG concentrations in the DRF group (Table 2).
Analysis of the expression of genes involved in lipid management in liver of rats with food restriction by micro-arrangements
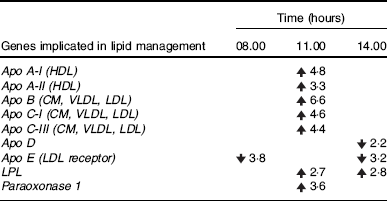
CM, chylomicrons; LPL, lipoprotein lipase; ![]() , increase and
, increase and ![]() , decrease in the gene expression at 08.00 hours (before food anticipatory behaviour), 11.00 hours (food anticipatory behaviour) and 14.00 hours (after food intake) in the daytime restricted feeding group compared with the ad libitum group; six independent experimental observations.
, decrease in the gene expression at 08.00 hours (before food anticipatory behaviour), 11.00 hours (food anticipatory behaviour) and 14.00 hours (after food intake) in the daytime restricted feeding group compared with the ad libitum group; six independent experimental observations.
Circadian aspects
The feeding and fasting states are regulated by the SCN in response to day–night cycles. DRF involves daily cycles that consist of 22 h of fasting and 2 h of mealtime for 3 weeks. The circadian clock is regulated through feedback loops; in the positive loop, the proteins circadian locomotor output cycles kaput (CLOCK) and brain and muscle Arnt-like protein 1 (BMAL1) heterodimerise and initiate transcription of the target genes period (Per) and cryptochrome (Cry). In the negative loop, PER and CRY heterodimerise and translocate to the nucleus to repress their own transcription( Reference Ko and Takahashi 63 ).
Nutritional sensors can act as modulators of the circadian molecular clock: NAD+ inhibits CLOCK-BMAL1 heterodimer activity and indirectly regulates the expression of genes (Bmal1, Per2 and Cry) by binding to deacetylase SIRT1 and promoting the degradation of PER2( Reference Asher, Gatfield and Stratmann 64 , Reference Nakahata, Sahar and Astarita 65 ). In addition, CLOCK-BMAL1 regulates the expression of nicotinamide phosphoribosyltransferase (NAMPT), the enzyme that catalyses the rate-limiting step in NAD+ synthesis( Reference Nakahata, Kaluzova and Grimaldi 66 ). PGC-1α also acts as an intermediary between metabolism and the circadian clock; down-regulation of PGC-1α iRNA in the liver disrupts rhythmic transcription of BMAL1, CRY1 and CRY2, and modifies the daily PEPCK cycle( Reference Liu, Dinu and Adewale 67 ). DRF promotes a phase shift in BMAL1 and PER1( Reference Luna-Moreno, Aguilar-Roblero and Díaz-Muñoz 2 , Reference Arellanes-Licea, Báez-Ruiz and Carranza 3 ), an oxidised redox state in the mitochondria and cytosol( Reference Díaz-Muñoz, Vázquez-Martínez and Aguilar-Roblero 7 ), higher levels of SIRT1 in hepatic cytosol before mealtime, and an elevated presence of cytosolic PGC-1α in the 24-h profile( Reference Pérez-Mendoza, Rivera-Zavala and Díaz-Muñoz 14 ). All these changes are associated with an enhanced ‘fasting’ response in DRF rats at times before food access( Reference Luna-Moreno, Aguilar-Roblero and Díaz-Muñoz 2 , Reference Arellanes-Licea, Báez-Ruiz and Carranza 3 , Reference Díaz-Muñoz, Vázquez-Martínez and Aguilar-Roblero 7 , Reference Pérez-Mendoza, Rivera-Zavala and Díaz-Muñoz 14 ). In our results, the nucleus:cytosol ratio of SIRT1 exhibits a peak at the end of the dark phase (Fig. 4(b)); this increase could be associated with chromatin remodelling-mediated clock proteins for gluconeogenesis circadian control( Reference Pérez-Mendoza, Rivera-Zavala and Díaz-Muñoz 14 , Reference Nakahata, Sahar and Astarita 65 ), and in the FAO-mediated increase of PGC-1α in the DRF rats; moreover, the 24-h average of the nucleus:cytosol ratio of PGC-1α is also modified (Fig. 5(b)). AMPK acts in the bidirectional regulation between metabolism and clockwork through the phosphorylation and degradation of CRY1 and the activation of NAMPT( Reference Lamia, Sachdeva and DiTacchio 68 ). It has been observed that energy restriction and exercise promote the increase of SIRT1 and AMPK, both being key parts of the PGC-1α-activating process that promotes catabolic metabolism and mitochondrial biogenesis in many tissues by regulating the expression of BMAL1( Reference Sahar and Sassone-Corsi 69 ). Under the DRF protocol, the levels of AMP and ATP decreased and increased, respectively, before food access (at 11.00 hours), which could explain the highest levels of pAMPKα (at 05.00 hours) in the cytosolic fraction (Fig. 2(a))( Reference Díaz-Muñoz, Vázquez-Martínez and Aguilar-Roblero 7 ).
DRF is characterised by the presence of food anticipatory behaviour (FAB) before mealtime, when the metabolic fasting response is more active in the liver( Reference Luna-Moreno, Aguilar-Roblero and Díaz-Muñoz 2 , Reference Díaz-Muñoz, Vázquez-Martínez and Aguilar-Roblero 7 – Reference Rivera-Zavala, Báez-Ruiz and Díaz-Muñoz 9 , Reference Pérez-Mendoza, Rivera-Zavala and Díaz-Muñoz 14 ). The metabolic products of lipid catabolism, KB (Fig. 1(a)) and NEFA( Reference Escobar, Díaz-Muñoz and Encinas 8 , Reference Rivera-Zavala, Báez-Ruiz and Díaz-Muñoz 9 ), showed higher levels during FAB. It was recently demonstrated that KB are necessary for FAB, and that the liver-specific deletion of PER2 in mice abolished FAB, but the viral overexpression of PER2 restored it by regulating the production of KB to induce FAB in restricted feeding( Reference Chavan, Feillet and Costa 70 ).
In conclusion, the results provide evidence that DRF leads to differential regulation in the handling of lipids. The bidirectional relation between clockwork and metabolism, which is associated with FEO, highlights the relevance of lipid metabolism (FAO) and its regulatory mechanisms, as well as the lipid profile (cholesterol and LDL) in the liver and extrahepatic tissues under FEO. Further studies are needed to understand the physiological consequences of lipid metabolism in the rheostatic adaptations involved in restricted feeding schedules and the expression of FEO.
Acknowledgements
The authors are grateful to Dorothy Pless and Jessica M. González-Norris for their assistance with the English version of this manuscript, Leonor Casanova and Lourdes Lara for their academic support, and PhD Olivia Vázquez-Martínez for technical assistance.
This work was supported by Dirección General de Asuntos del Personal Académico, Programa de Apoyo a Proyectos de Investigación e Innovación Tecnológica (IN200815) to M. D.-M. J. B. R.-Z. is a PhD student from the Programa de Doctorado en Ciencias Biomédicas, Universidad Nacional Autónoma de México and received fellowship 215711 from CONACYT.
J. B. R.-Z. performed experiments; J. B. R.-Z., R. H.-M. and G. A. B.-R. analysed data; J. B. R.-Z. and M. D.-M. wrote the paper; C. M.-A., M. P.-M., and M. O.-M. performed and interpreted experiments; R. H.-M. and G. A. B.-R. were technical advisers; M. D.-M. designed the study.
The authors declare that there are no conflicts of interest.


