

Introduction
Compared to the last glacial stage (LGS) and the subsequent deglaciation, the Holocene has been a period of relative climatic calm during which human populations and civilizations have flourished and expanded over the Earth. However, it has not been completely free of the kind of climatic disruptions that have had detrimental effects on even powerful societies. One such event, which was apparently a far-reaching period of aridity, occurred 4000–4500 years ago (4.0–4.5 kyr BP), and left its mark on a variety of archeological and geological records, including those from excavations in Syria (Reference WeissWeiss and others, 1993), lake levels in North Africa (Reference GasseGasse, 1977; Reference Servant, Servant-Vildary, Williams and FaureServant and Servant-Vildary, 1980; Reference Gillespie, Street-Perrott and SwitsurGillespie and others, 1983) and western China (Reference GasseGasse and others, 1991), speoleothems in Israel (Reference Bar-Matthews, Ayalon, Kaufman and WasserburgBar-Matthews and others, 1999) and eastern China (Reference WangWang and others, 2005), marine cores from the Gulf of Oman (Reference Cullen, deMenocal, Hemming and HemmingCullen and others, 2000) and the Indus delta region (Reference Staubwasser, Sirocko, Grootes and SeglStaubwasser and others, 2003), peat deposits in Mongolia (Reference Xiao, Xu, Nakamura, Yang, Liang and InouchiXiao and others, 2004), and an ice core from eastern equatorial Africa (Reference ThompsonThompson and others, 2002). According to many of these records, the onset of the drought was abrupt (possibly within a decade), lasted for up to several centuries, then ended abruptly.
Although the majority of the documentation for this dry period comes from the Eastern Hemisphere, evidence for a similar abrupt climatic episode has been found in tropical South America. For example, deposits from Lake Titicaca on the border between Peru and Bolivia (Reference BakerBaker and others, 2001; Reference Tapia, Fritz, Baker, Seltzer and DunbarTapia and others, 2003) and from the Amazon fan (Reference Maslin and BurnsMaslin and Burns, 2000) show a Middle Holocene period of desiccation. Finally, an ice core from a high-altitude Andean tropical glacier contains a prominent dust event within the Holocene, with particle concentrations that are several orders of magnitude higher than all other levels since the end of the LGS (Reference ThompsonThompson, 2000; Reference Thompson, Mosley-Thompson and HendersonThompson and others, 2000). The timing and nature of the dust peak in this ice core, its possible linkages with the Asian/African climate, and the possible Middle Holocene climate forcings for such an event are discussed in this paper.
Ice-Core Analysis
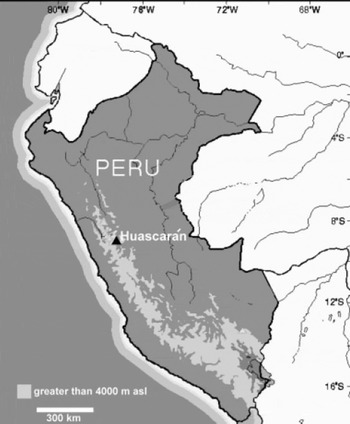
In the austral winter of 1993 (June-August) a team from the Byrd Polar Research Center’s (BPRC) Ice Core Paleoclimatology Research Group drilled two ice cores to bedrock on the col of Nevado Huascaran (9˚06’S, 77˚36’W; 6050ma.s.l.) in the Cordillera Blanca of northern Peru (Fig. 1). The first core (core 1, 160.4 m long) was cut into samples that were melted and bottled in the field, but the second (core 2, 166.1 m long) was returned frozen to BPRC for high-resolution analyses. This core was cut into three equivalent sets, each with 4476 samples, and analyzed for the ratios of 18O to 1 6O (δ18O), mineral dust concentration and size distribution, and anion concentrations (chloride, nitrate and sulfate) analyses. Core 1, on the other hand, was analyzed only for δ18O.
Map of Peru depicting the Andes Mountains (areas above 4000ma.s.l.) and the location of Nevado Huascarán.
Above the firn/ice transition (∼33.5 m below surface (mbs)) the three sets of samples were cut from the center of the core inside a class 100 clean bench in a laboratory freezer maintained at −10˚C. The firn was handled using several pairs of pre-cleaned latex gloves, and the cut samples were placed in pre-cleaned polystyrene containers which were transported to a class 100 clean room where they were allowed to melt before analysis. Below the firn/ice transition the dust and anion samples were rinsed with Millipore reagent-grade deionized water to remove contaminants from the surface. The core was cut such that the sample lengths decreased from 17 to 6 cm in the top 55 m, then from 5 to 3 cm in the interval 55−113 mbs, and finally to ∼ 2 cm at 113 mbs, which was the size at which they remained to the bottom of the core.
Dust concentrations and size distributions were measured using two Coulter Counters (Model TAII), one equipped with a 30 μm aperture tube to count particles with diameters between 0.63 and 16μm in 14 size ranges, and the second equipped with a 100 mm aperture tube to count particles with diameters between 2.0 and 40 μm, also in 14 size ranges. The two datasets were integrated and the total concentrations between 0.63 and 40 μm were normalized to 1 mL of melted ice. A Finnigan MAT Delta E mass spectrometer was used for the analyses of δ18O. The anion concentrations, which were analyzed with a Dionex Model 2010 ion chromatograph, were presented initially in Reference ThompsonThompson and others (1995), but will not be discussed further here.
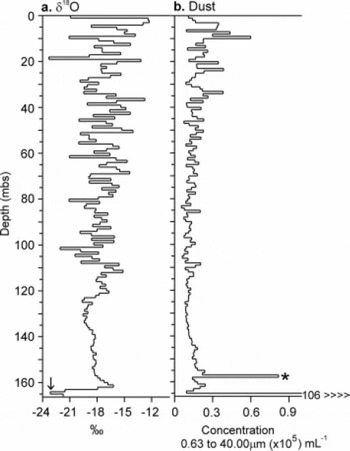
The δ18O and dust concentration data are plotted by depth (1 m averages) in Figure 2a and b, respectively. One obvious feature in the δ18O profile is the 6.3% increase from ∼165.3 mbs to ∼163 mbs, which is consistent with the Last Glacial Maximum to Early Holocene isotopic difference found in other ice cores of similar age (Reference ThompsonThompson and others, 1998, table 2). The dust record shows that above 165 mbs this core is relatively clean, with an average concentration of ∼15 000 particles per mL. The exception is a large peak around 157.7 mbs (marked with an asterisk in Fig. 2b) with an average concentration of ∼82 000 particles per mL.
One-meter averages of (a) δ18O (%) and (b) dust concentrations (0.63–40.0μm diameters) (x105mL−1) from Huascaran core 2. The arrow in (a) and the asterisk in (b) indicate features discussed in the text.
Timescale Reconstruction
Since the 1 year snow accumulation between 1992 and 1993 was 3.30 m (1.74 m ice equivalent), and the 20th-century net accumulation rate, or net balance, averaged 1.4 m ice equivalent (Reference HendersonHenderson, 1996), the upper portion of the core could be sampled at sub-annual resolution. The dating for this section was determined by counting the peaks in dust, nitrate and δ18O that formed every dry season during the austral winter from June to September (Reference ThompsonThompson and others, 1995). Thus the annual averages of the measured parameters were calculated based on thermal years (dry season to dry season). However, below AD 1817 (119.26 mbs) the thinning of the annual layers from vertical flow was such that seasonal resolution of the parameters was difficult to maintain. However, annual dating was still possible down to 125.2 mbs (corresponding to the 1719/20 thermal year).
The original Holocene timescale for the Huascarán ice core (Reference ThompsonThompson and others, 1995) was constructed using an empirical two-parameter model (Reference BolzanBolzan, 1985; Reference ReehReeh, 1988), as shown in Figure 3a. The rate of thinning with depth (p in the model equation in Fig. 3a) was first calculated for the top of the core where the timescale was annually resolvable, using the dates of 1915 (78 years before 1993) at 86.47 mbs and 1817 (176 years before 1993) at 119.26 mbs as pinning points, and assuming steady-state conditions with a constant accumulation of 1.74 m ice equivalent (b in the equation). The lower 47 m of the core (119.26–166.07 mbs) were dated by constraining the 18O depletion at 164.1 mbs (marked by an arrow in Fig. 2a) as the Younger Dryas (YD) event. This was ascertained by matching the lowest 3 m of the ice core with the calibrated 14C dated record of δ18O of G. bulloides from the deep-sea marine core SU81-18, which was drilled in the tropical North Atlantic off the coast of Portugal (Reference Bard, Arnold, Maurice, Duprat, Moyes and DuplessyBard and others, 1987; Reference FairbanksFairbanks, 1989). The midpoint of the YD event in the Huascarán record was assigned an age of 12.25 kyr BP, consistent with the YD age in the layer-counted GRIP and GISP2 (Greenland) ice-core records (Reference JohnsenJohnsen and others, 1992; Reference TaylorTaylor and others, 1993). With this lower chronological horizon established, the Holocene part of the Huascaran record was calculated with the two-parameter model using the thinning rate (p = 1.253) that was determined for the upper 119m of the core (Fig. 3a). In this chronology, the large Holocene dust event at 157.7 mbs (shown by the asterisk in Fig. 2b) was calculated at ∼ 2 kyr BP.
(a) Timescale development for Huascarán core 2. The earlier timescale, which was developed for Reference ThompsonThompson and others (1995) and is depicted by the dashed line, was calculated using the two-parameter model formula, with h (total length of the core in ice equivalent) = 136.40 m, b (modern accumulation in ice equivalent) = 1.74 m, p (thinning parameter calculated from this model for the top of the core where layer counting was possible) = 1.253. In addition, z is depth in the core, and T is its corresponding age in years BP. The revised timescale is depicted by the solid line, and is discussed in the text. The SU81-18 match points were derived from matching the δ18O from the lowest 3 m of the Huascarán core (i.e. the LGS) with the δ18O from a tropical North Atlantic marine core. (b) Matching between δ18Oatm in the GISP2 ice core and the Huascarán ice core. GISP2 data can be downloaded from ftp:// ftp.ncdc.noaa.gov/pub/data/paleo/icecore/greenland/summit/gisp2/ gases/gas.txt.
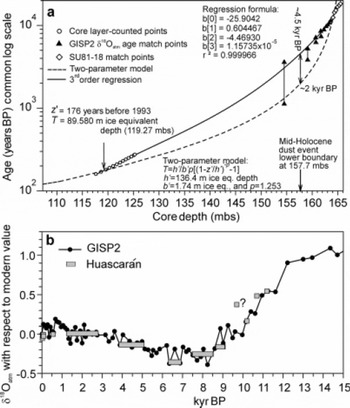
Since the LGS portion of the Huascaran record was matched with an absolutely dated marine core, the confidence in the chronology of that part of the record was reasonable. However, the confidence in the Holocene dating was lower because of the lack of chronological calibration between AD 1817 and 12.25 kyr BP. Several years later, the Holocene timescale was revised using the analyses of the isotopic composition of O2 in the air trapped in glacier ice bubbles (δ18Oa i r), which were measured by T. Sowers at Pennsylvania State University. Reference Sowers, Bender and RaynaudSowers and others (1989) demonstrated that δ18Oair reflects changes in the global atmosphere. Since the inter-hemispheric mixing time is only ∼1 year, the δ18Oai r is constant throughout the atmosphere at any time, even though the turnover period is ∼1200years (Reference Bender, Sowers and LabeyrieBender and others, 1994b). The glacial/interglacial transition (∼8.0−15.0 kyr BP) is characterized by large, virtually simultaneous changes in δ18Oai r in Greenland and Antarctic cores that are dated by independent methods (Reference Sowers and BenderSowers and Bender, 1995), with an estimated error of ∼600years in the age-depth relationships. When the ages derived from these δ18Oair measurements (Reference BenderBender and others, 1994a) were correlated with the δ18Oai r data from samples from the Huascaran ice core (Fig. 3b), the range of error for the tropical core was construed as being similar to the polar records over this transition. The measurements of the Huascaran δ18Oair provided several time horizons for the Early Holocene that allowed for the development of a new age-depth relationship for the entire Holocene by passing a third-order regression curve through the chronological horizons from the layer-counted points at the top to the δ18Oa tm match points towards the bottom (Fig 3a). The match points above 9kyr BP were not used to calculate the regression because they covered too large a range of possible corresponding dates in the Greenland record (Fig. 3b), but they are plotted on the regression curve as a confirmation of the accuracy of the age-depth relationship. An error of ∼5 years was estimated around the upper pinning point of the model (AD 1720), and the range increased to ∼600years at ∼8kyr BP, as determined by the transfer of the δ18Oair-based timescale over the glacial/ interglacial transition as discussed above. The original and the revised age-depth relationships are compared in Figure 3a. The new chronology for the Huascaran record moved the lower (earlier) boundary of the large Holocene dust peak (hereafter referred to as the MHDE, or the Middle Holocene dust event) from its originally reconstructed date at 2 kyr BP to 4.5 kyr BP.
The Middle Holocene Dust Event
The dust and δ18O data for the entire 19 kyr Huascaran ice-core record, which are recalculated according to the revised timescale, are illustrated in Figure 4a and b, respectively, as 100 year averages. Other than the very high dust concentration levels of the LGS (prior to 17 kyr BP), the MHDE is the most prominent feature of the dust record. During this time, the δ18O was decreasing from its high postglacial levels at ∼10kyr BP. The moisture source for the eastern Peruvian Andes and for the northern Amazon Basin ultimately is the tropical North Atlantic, from where the water vapor is carried by northeasterly trade winds over the ocean, then recycled over the Amazon forest (Reference Grootes, Stuiver, Thompson and Mosley-ThompsonGrootes and others, 1989; Reference ThompsonThompson and others, 1995). The δ18O curve over the last 10 kyr resembles the tropical Northern Hemisphere insolation curve through the Holocene (Reference Berger and LoutreBerger and Loutre, 1991), and both the δ18O and the sea surface temperatures (SSTs) of the source region may be reflections of the insolation variations.
(a, b) Huascaran core 2 δ18O (a) and dust concentration (b) records for the last 19 kyr, shown as 100year averages. The MHDE is prominent and in (c-h) the data are shown as actual samples (average length ∼2 cm). (c) Total dust concentrations from 0.63 to 40 μm; (d) the concentration of submicron dust; (e) the per cent of submicron dust with respect to total dust; (f-h) concentrations of large (5−16 μm) (f) and giant (>16 to 40 μm) particles (g) through the MDHE, and the per cent of large particles with respect to total dust (h).
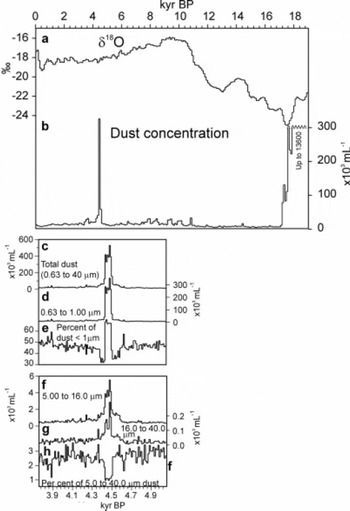
The MHDE is prominent in Figure 4b, and detailed (i.e. every sample) views of the dust concentrations and size distributions between 3.7 and 5.0 kyr BP are shown in Figure 4c-h. In addition to the high concentration (Fig. 4c), the sizes of the mineral dust in the MHDE also demonstrate that this is a unique feature in the Huascaran Holocene record. Submicron particles (Fig. 4d) constitute up to 70% of the total concentration between 0.63 and 40 μm in diameter, which is 30−40% higher than pre- and post-MHDE levels (Fig. 4e). However, the size fraction >5 μm also increases during this event (Fig. 4f), and even the concentration of giant particles (>16μm) ranges over an order of magnitude higher (Fig. 4g), although the per cent of this size range is reduced from 3% of the total concentration in the pre- and post-event levels to 1% within the peak (Fig. 4h). The concentrations of the particles >5.0μm actually increase ∼100years before the increase in submicron dust, and remain high for several decades after the fine-dust levels abruptly drop.
Climatic and Environmental Conditions During the Middle Holocene
There is a large collection of Holocene proxy climate records from the Andes, the Altiplano and the Amazon Basin that demonstrate that an arid period occurred during the time of the MHDE in the Huascaran ice-core record. Stable-isotope analyses of planktonic foraminifera from the Amazon fan show that one of highest 18O values in the Holocene (inferring reduced Amazon River flow) occurred ∼4.5 kyr BP (Reference Maslin and BurnsMaslin and Burns, 2000), almost contemporaneously with a depletion of 18O in the isotopic record from Lake Junín, Peru (Reference Seltzer, Rodbell and BurnsSeltzer and others, 2000). Evidence for Middle Holocene aridity on the Altiplano comes from Lake Titicaca on the border between Peru and Bolivia, where the per cent of fresh-water plankton reached its lowest levels between ∼5 and 2 kyrBP, and the per cent saline diatoms increased at ∼6 kyr BP (14C age) and reached a maximum at ∼3.6–4.0 kyr BP (14C age) (Reference BakerBaker and others, 2001). Reference Tapia, Fritz, Baker, Seltzer and DunbarTapia and others (2003) offer a more refined timeline for climate variation in this interval using the Lake Titicaca record of per cent saline planktonic taxa, which confirms that although water levels were low between 3 and 6kyr BP, the lowest levels were achieved at ∼4.5 kyr BP.
The significant increase in very large dust particles in the MHDE in the Huascaran core is suggestive of aridity in the Cordillera Blanca. A drier climate may have resulted in decreasing snowfall which could not keep pace with sublimation during the dry season, leading to ice recession on the peaks. There is no evidence in the Huascaran climate record (in the stable isotopes or in the visible stratigraphy), nor in any nearby climate record, that an anomalous warming occurred during this time.
The MHDE is noteworthy not only because it is a unique feature in the Huascaran Holocene record, but also because it appeared during a time when a global-scale climatic disruption affected a large region from North Africa through the Mediterranean area, to as far east as China. The paleoclimatic, archeological and historical records previously listed indicate that during the third millennium BCE (before the Common Era) a sudden and severe event, which was probably a protracted drought, occurred in many regions that had been under the expanded influence of the Asian/Indian/African monsoon during the first half of the Holocene. This drought was contemporaneous with the decline of the Akkadian Empire in Mesopotamia (Reference WeissWeiss and others, 1993), the failure of Nile River floods that were coincident with the decline of North African civilizations (Reference Hassan, Dalfes, Kukla and WeissHassan, 1997) and the end of the Harappan civilization in the Indus valley (Reference Staubwasser, Sirocko, Grootes and SeglStaubwasser and others, 2003). Whether the drought was actually instrumental in the collapse of these societies is a controversial point among archeologists (e.g. Reference Butzer, Dalfes, Kukla and WeissButzer, 1997), but the evidence is very strong that this climatic anomaly occurred at or near the same point in time as these historical events.
Figure 5 shows some of the geological records that document this Middle Holocene aridity, in addition to the Huascaran dust profile. A marine core from the Gulf of Oman (Reference Cullen, deMenocal, Hemming and HemmingCullen and others, 2000) contains an abrupt spike in carbonates (Fig. 5a) which have been chemically traced to an archeological site (Tell Leilan) in Syria, the home of the Akkadian culture (Reference WeissWeiss and others, 1993). The shape of this profile is similar to that from Huascaran (Fig. 5b), which shows a sudden onset and then a more gradual decline followed by a secondary peak. An ice-core record from Kilimanjaro, Tanzania, (Reference ThompsonThompson and others, 2002) contains an unusually thick, black dust band that is dated around 4.0 kyr BP (Fig. 5c), and is indicative of a period that may have lasted several decades to centuries during which the Northern Ice Field, presently the largest on the mountain, had dramatically reduced in size. Lake records from equatorial and North Africa (Reference GasseGasse, 2000) (Fig. 5d-f) indicate that water levels had decreased greatly, as did lake levels from western Tibet (Reference GasseGasse and others, 1991, Reference Gasse, Fontes, van Campo and Wei1996), which are not shown.
Comparisons of (a) the Gulf of Oman Middle Holocene carbonate record on a calibrated 14C timescale (modified from Reference Cullen, deMenocal, Hemming and HemmingCullen and others, 2000); (b) the Huascaran Holocene dust record; (c) the dust from the Kilimanjaro ice core (modified from Reference ThompsonThompson and others, 2002); and (d–f) tropical African Holocene lake level records (modified from Reference GasseGasse, 2000) from Lake Abhe (Reference GasseGasse, 1977) (d), Ziway–Shala system (Reference Gillespie, Street-Perrott and SwitsurGillespie and others, 1983) (e) and Bahr-el-Ghazal (Reference Servant, Servant-Vildary, Williams and FaureServant and Servant-Vildary, 1980) (f). The grey bar marks the Middle Holocene arid period in the records.
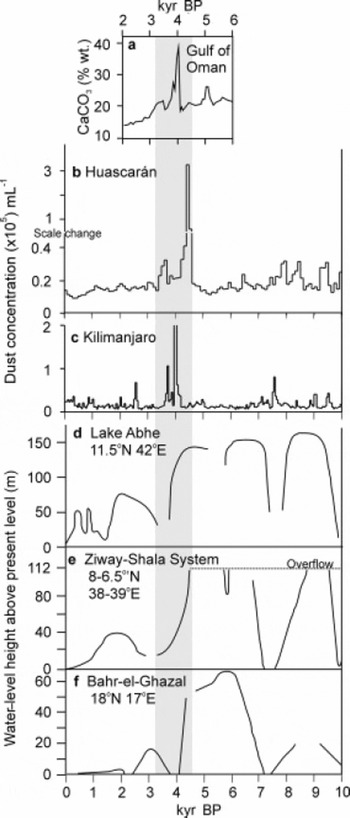
Other records not shown in Figure 5 also contain evidence of a sudden and marked arid-climate episode at this time. A speleothem from the Soreq cave in Israel (Reference Bar-Matthews, Ayalon, Kaufman and WasserburgBar-Matthews and others, 1999) shows an abrupt drop in δ13C, implying that lower precipitation occurred within the 4.2–4.5 kyr BP window. Palynological data from north-central China suggest a cold, dry period from 3.95 to 4.45 kyr BP, which is inferred from a sudden decrease in tree pollen concentration (Reference Xiao, Xu, Nakamura, Yang, Liang and InouchiXiao and others, 2004). Reference Morrill, Overpeck and ColeMorrill and others (2003) compiled paleoclimatic data from monsoon Asia, particularly China, to produce a pattern of abrupt mid-Holocene monsoon failure in this region.
The discrepancy in timing between the onset of the MHDE in Huascarán and the carbonate peak in the Gulf of Oman core (4.5 kyr BP vs 4.2 kyr BP, respectively) may be the result of the different techniques used to develop the timescales for the two records. The marine record was dated with the aid of 14C dates from carbonates, whereas the Holocene timescale for the ice core was based on flow modeling and curve matching, using δ18Oair match points with well-dated polar cores as previously described. This allowed for the revised age of the MHDE, but with a range of uncertainty between 5 years and 600 years. In fact, of all the records shown in Figure 5, Huascarán is the only one with a timescale that was not developed using calibrated 14C dates. Despite timing differences, the dust event has the same general shape in the high-resolution records from Huascarán, the Gulf of Oman and Kilimanjaro, i.e. a large, abrupt dust increase, then a more gradual decrease, followed by a smaller, secondary peak. It is interesting that the character of a climatic event should be so similar in records that come from sites located in different environments on opposite sides of the Earth. If these records are recording the same event, by what physical processes are they linked?
The Modern Links between the MHDE in Huascarán and Drought in the Tropical Eastern Hemisphere
During the austral summer (December-March), which is the wet season in the Southern Hemisphere tropics, the InterTropical Convergence Zone is at its southernmost position and the northeasterly trade winds move across the equatorial Atlantic from west Africa to northeastern South America. The dust that is entrained off the west coast of Africa by frequent windstorms is caught up by the trade winds, which are connected to the southern limb of the subtropical Azores high-pressure system, which in turn is the southern dipole of the North Atlantic Oscillation (NAO). Reference Moulin, Lambert, Dulac and DayanMoulin and others (1997) statistically linked the transport of dust from the west African coast to the strength of the NAO. Much of the dust is blown back towards the northeast by the clockwise motion of the subtropical high, but a smaller amount is carried with the moisture across the tropical North Atlantic, and in fact Saharan dust which has been transported during the austral summer has been found in the Amazon Basin (Reference Swap, Garstang, Greco, Talbot and KållbergSwap and others, 1992).
Since the source of Huascaran’s precipitation is likely the tropical Atlantic, it is probable that some of the dust that originates in North Africa is carried by the moist air masses across the Amazon Basin to the Cordillera Blanca and wet-deposited on glaciers there (Reference DavisDavis, 2002). The recent atmospheric processes that facilitate the movement of dust between the desert regions of North Africa and tropical South America are illustrated in Figure 6, which shows correlation fields between the wet-season dust concentrations in the Huascaran core and 5° x 5° grids of US National Centers for Environmental Prediction/US National Center for Atmospheric Research (NCEP/NCAR) re-analysis data (Reference KalnayKalnay and others, 1996) from December to March of global mean sea-level pressure (SLP; Fig. 6a) and global 850 mbar zonal winds (Fig. 6b) from 1949 to 1992, the last full year of the ice-core record. High SLP is associated with dry conditions, so the significant two-tailed Pearson correlations (R>0.3, significant at the 0.05 level) between SLP in the Sahara, the Sahel, the Bodélé region of north-central Africa (Fig. 6a) and ice-core dust concentration suggest that aridity here may provide a potent potential source region for the dust that eventually finds its way to the Cordillera Blanca. Furthermore, the significant negative correlations (R < −0.3, significant at the 0.05 level) between the dust and lower-level easterly winds from North Africa to the eastern coast of South America (Fig. 6b) indicate that zonal wind velocities from the potential source tend to be higher during high-dust years. The correlation field is negative because easterly winds are recorded in the NCEP/ NCAR database as negative values (Fig. 6c). This relationship ends just inside the northeast coast of Brazil, perhaps because the relatively ‘linear’ trade-wind circulation over the ocean is disrupted by moisture recycling and convective activity over the Amazon rainforest.
Significant correlation fields (–0.3 > R > +0.3, significant at the 0.05 level) between Huascarán wet-season (austral summer) dust concentration and NCEP/NCAR re-analysis data (December–March) for (a) SLP and (b) zonal wind velocity from 1949 to 1992. Dark/light shading depicts fields of significant positive/negative correlations. The correlation grids are 5˚ by 5˚. (c) A comparison between the wet-season dust concentrations from 1949 to 1992 and the easterly wind velocities in the region of highest correlation in north-central Africa illustrates why R is negative in the latitudes dominated by easterlies.
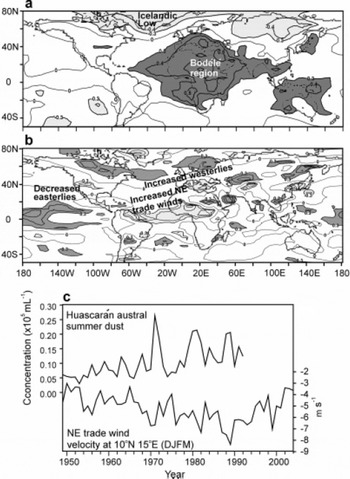
Other regions of significant correlation are also observed in Figure 6a, such as the negative relationship between Huascarán dust and SLP in the far North Atlantic (in the region of the Icelandic low). When this is viewed in conjunction with the significant +R field over North Africa, the Mediterranean and the tropical Atlantic, it contributes to the evidence that austral summers of high dust concentration are coincident with boreal winters with positive NAO indices. In addition, the SLP grid in the tropical western Pacific shows positive significant correlations with the dust concentrations, indicating negative Southern Oscillation Indices (SOI), which are symptomatic of El Niño conditions.
Thus, the easterly circulation across the tropical Atlantic that is influenced by the subtropical node of the NAO appears to be the link between the mineral dust in the Huascarán glacier and the climate in North Africa and the Middle East. However, the interplay between the strength and phase of the NAO and the circulation of the African/ Asian monsoon is connected with the climate of this potential source region for Huascarán dust. Today during winters of high NAO indices, the Icelandic low and the Azores high intensify and move northward, causing the westerly storm tracks to shift from the Mediterranean region and North Africa to northern Europe (Fig. 6b). For example, low winter discharge from the Tigris and Euphrates Rivers is significantly correlated with the positive phase of the NAO (Reference Cullen and deMenocalCullen and deMenocal, 2000). Not only does this result in a drier climate in southern Eurasia and southwest Asia, but the vigorous northeasterly trade-wind circulation from the Azores high transports more available dust across the Atlantic to South America. Positive NAO is also associated with a more intense Middle Eastern Jet Stream (MEJS) (Reference Yang, Lau, Yoo, Kinter, Miyakoda and HoYang and others, 2004), which is an antecedent signal for a weaker Asian monsoon. When the MEJS is strong in the winter, an ENSO-type warming appears in the equatorial eastern Pacific (NINO3). Historically, increases in the NINO3 SSTs have been significantly correlated with Asian/ Indian monsoon failure, although the correlation has weakened in recent decades (Reference Kumar, Rajagopalan and CaneKumar and others, 1999). The development of ENSO conditions during years of positive NAO is also indicated in Figure 6, which shows atmospheric circulation patterns indicative of negative SOI. These observations are qualitative, since currently there is no statistically significant year-to-year link that has been noted between ENSO and NAO, although over decadal timescales there does appear to be a relationship between NAO and the ENSO-linked Pacific Decadal Oscillation (PDO) (Reference ReadingerReadinger, 2003).
Possible teleconnections have been proposed between the North Atlantic and the African/Asian monsoons during the last glacial (Reference Overpeck, Anderson, Trumbore and PrellOverpeck and others, 1996; Reference Schulz, Rad and ErlenkeuserSchulz and others, 1998), during the glacial/Holocene transition (Reference Sirocko, Garbe-Schönberg, McIntyre and MolfinoSirocko and others, 1996) and during the Holocene (Reference Gupta, Anderson and OverpeckGupta and others, 2003; Reference WangWang and others, 2005). Stated simply, monsoon failures were contemporaneous with North Atlantic cooling (associated with arctic ice discharge), which in turn contributed to strengthened westerlies across Eurasia. Comparisons between marine records from the Arabian Sea and the North Atlantic show that these conditions existed several times during the Holocene, and one of the later episodes occurred between 4.0 and 4.5 kyr BP (Reference Gupta, Anderson and OverpeckGupta and others, 2003).
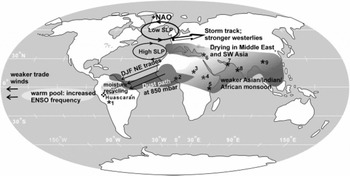
The MHDE therefore may have been connected to a protracted interval of ENSO-linked African/Asian monsoon weakening, which was coupled with strengthening of the Icelandic low and Azores high. Cooling of the North Atlantic accompanied an ice discharge event, and contributed to more intense westerlies across northern Eurasia. Currently, ENSO events are also linked to aridity in the Cordillera Blanca, and if this was the case in the Middle Holocene, ice recession on the Huascarán peaks (which resulted in the influx of large particles onto the col) may also have been controlled by these conditions. Because the concentrations of large dust particles in the MHDE increased before the influx of the submicron particles, the ENSO conditions responsible for aridity in the northeast Andes may have preceded the monsoon weakening. In fact, the timing of the interval of lake desiccation in tropical South America suggests that it may have predated and postdated the Eastern Hemisphere drought. The major elements of this near-global-scale mechanism are illustrated in Figure 7, along with the locations of some of the sites from where records of this abrupt and prolonged aridity have been obtained.
Schematic illustrating global-scale mechanisms mentioned in the text that may have been influential in the Middle Holocene aridity and its appearance in the Huascarán ice core. Other sites where the event is documented in climate records are numbered: 1. Lake Titicaca (Reference Tapia, Fritz, Baker, Seltzer and DunbarTapia and others, 2003); 2. Bahr-el-Ghazal (Reference Servant, Servant-Vildary, Williams and FaureServant and Servant-Vildary, 1980); 3. Lake Abhe (Reference GasseGasse, 1977); 4. Ziway–Shala system (Reference Gillespie, Street-Perrott and SwitsurGillespie and others, 1983); 5. Kilimanjaro (Reference ThompsonThompson and others, 2002); 6. Soreq cave (Reference Bar-Matthews, Ayalon, Kaufman and WasserburgBar-Matthews and others, 1999); 7. Gulf of Oman (Reference Cullen, deMenocal, Hemming and HemmingCullen and others, 2000); 8. Indus delta (Reference Staubwasser, Sirocko, Grootes and SeglStaubwasser and others, 2003); and 9. Dongge cave (Reference WangWang and others, 2005). DJF: December–February.
Conclusions
The MHDE may have been the product of a protracted series of ENSO events that possibly were associated with widespread monsoon failures, which in turn may have been linked with North Atlantic regional cooling and strengthened westerlies over Eurasia. The appearance of abrupt climatic disruptions in such distant locations as the tropical Andes, North Africa, the Middle East, southwest to east Asia and the North Atlantic suggests strong linkages between high- and low-latitude atmospheric processes. The questions that remain to be addressed concern: (1) the underlying cause for this near-global-scale episode, and (2) which processes, i.e. those in the tropics (ENSO, monsoon circulation) or those in the North Atlantic (ice rafting, ocean cooling), might have been the triggers. The ultimate forcing for abrupt climate change on orbital timescales is thought to be non-linear responses (through oceanic, vegetative and possibly cryospheric feedbacks) to linear insolation changes (Reference Ganopolski, Kubatzki, Claussen, Brovkin and PetoukhovGanopolski and others, 1998; Reference deMenocaldeMenocal and others, 2000). In fact, a series of feedbacks between the low latitudes and the arctic region may have sustained the Middle Holocene drought in the tropics over several hundred years.
Acknowledgements
We gratefully acknowledge the participants in the 1993 Huascarán drilling expedition, B. Koci, V. Mikhalenko, G. Seltzer, P. Kinder and Pin-Nan Lin, and the Peruvian mountaineers F. Vicencio Maguina, M. Camones Gonzales and M. Henostroga Zambrano. We also thank Pin-Nan Lin for the δ18O analysis, and K. Henderson whose efforts to reconstruct the Huascarán timescale were invaluable. The Huascarán program was funded by the US National Oceanic and Atmospheric Administration. The comments of U. Ruth and an anonymous reviewer greatly helped to improve this paper and are very much appreciated. This is Byrd Polar Research Center contribution No. 1322.


