Dietary fibres are components of different physicochemical and rheological properties. Consequently, the various kinds of fibres differently affect the intestinal physiology and microbiota(Reference Bach Knudsen, Lærke and Hedemann1). The health benefits of resistant starch (RS), one type of dietary fibre, have been linked to improved glycaemia, insulinaemia and lipidaemia and by acting as a prebiotic, thereby improving satiety and bowel health(Reference Topping and Clifton2, Reference Birt, Boylston and Hendrich3). The benefits of RS can be related to a lower glucose release in the small intestine(Reference Birt, Boylston and Hendrich3) and its stimulating effect on intestinal SCFA produced during the fermentation of RS(Reference Topping and Clifton2, Reference McKenzie, Tan and Macia4). The SCFA enhance the secretion of incretins, which modulate the postprandial insulin response and inhibit proinflammatory signalling cascades via G-protein receptor activation and signalling(Reference Topping and Clifton2, Reference McKenzie, Tan and Macia4).
Dietary fibres that produce intraluminal viscosity can delay gastric emptying, as well as inhibit the rate of digestion and absorption of nutrients(Reference Birt, Boylston and Hendrich3, Reference Wilfart, Montagne and Simmins5). For this reason, the effect of RS to increase the bulk of digesta has been often investigated in regard to the satiety feeling after a meal(Reference Souza da Silva, Haenen and Koopmans6). Besides, delayed stomach emptying and slower transit may enhance microbial activity in the upper digestive tract. Although RS effects on postprandial changes in digestion, metabolic and hormonal profiles, and intestinal SCFA production have been repeatedly characterised(Reference Souza da Silva, Haenen and Koopmans6, Reference Ingerslev, Mutt and Lærke7), little quantitative information is available on the effects of RS-related alterations in the kinetics of digestion and transit on the microbial community in the gastrointestinal tract.
Aside from RS2 (high-amylose starch) and RS3 (retrograded starch), the interest in RS4 has risen(Reference Birt, Boylston and Hendrich3). RS4 are chemically modified starches and, as such, may replace rapidly digestible modified starches in processed foods. In that way, RS4 may fulfil dual functionality by improving texture and rheological properties of the food product and increasing the daily consumption of dietary fibre. In general, starches can be chemically modified in different ways, including transglycosylation, esterification or crosslinking(Reference Birt, Boylston and Hendrich3). The physiological effects will depend on the respective RS4 and differ from other types of RS, such as high-amylose starch (RS2) or retrograded starch (RS3)(Reference Birt, Boylston and Hendrich3), necessitating to investigate the potential health benefits of each RS4 individually. While decreasing the postprandial insulin response and altering the serum lipid metabolome profiles(Reference Newman, Zebeli and Eberspächer8), transglycosylated starch (TGS) altered the gastric, ileal, caecal and colonic bacterial microbiomes in growing pigs(Reference Newman, Petri and Grüll9). Notably, the qualitative bacterial changes were almost identical in the various gastrointestinal segments, whereas the TGS effects on SCFA were the greatest in the proximal and mid-colon(Reference Newman, Petri and Grüll9). In order to understand the effect of TGS on nutrient flows and microbial substrate availability, we investigated the effect of TGS consumption on the rate of passage of digesta in the upper digestive tract and quantified ileal flow and hindgut disappearance of nutrients using the pig model. In determining ileal and faecal bacterial microbiome and SCFA, we further assessed the dependencies between nutrient availability and alterations in bacterial composition and fermentation metabolite profiles in ileal digesta and faeces. We hypothesised that, due to an increased digesta bulk caused by the largely reduced small intestinal starch digestion, TGS would slow down the transit in the upper digestive tract, leading to an enhanced and prolonged nutrient flow to the large intestine. We further assumed that we could identify bacterial taxa having an association with the intestinal transit and nutrient flow. We used the pig model due to the high similarity in digestive physiology and metabolic responses to humans(Reference Guilloteau, Zabielski and Hammon10, Reference Nielsen, Hartvigsen and Hedemann11). Nevertheless, pigs and humans differ in their microbial colonisation, and pigs have a shorter retention of digesta in the various segments of the gastrointestinal tract compared with humans(Reference Patterson, Lei and Miller12). The advantage of using the ileal-cannulated pig is that this animal model allows the collection of ileal digesta samples from healthy individuals, which is hardly possible from healthy human volunteers.
Materials and methods
Ethical approval
All procedures involving animal handling and treatment were approved by the institutional ethics committee of the University of Veterinary Medicine Vienna and the national authority according to paragraph 26 of Law for Animal Experiments, Tierversuchsgesetz – TVG (GZ BMWF-68.205/0051-II/3b/2013).
Animals
Seven castrated male pigs (Large White; initial body weight 54·8 (sd 3·4) kg; age 3–4 months) were obtained from the university research pig farm (University of Veterinary Medicine Vienna) 1 week prior to ileal cannulation. Pigs were housed in individual metabolism pens (1·0 × 1·2 m) with Plexiglass walls for visual contact in an environmentally controlled room (21 ± 1°C)(Reference Newman, Zebeli and Velde13). Each pen was equipped with a single-space feeder and a nipple drinker for ad libitum access to demineralised water. Pens were cleaned daily with water and faeces were removed several times daily. Health status of pigs was monitored daily throughout the experiment. Pigs were surgically fitted with a simple T-cannula (tubus 9 cm, foot 9 cm, inner diameter 2·0 cm, outer diameter 2·3 cm; LKT – Laboratorium für Kunststofftechnik GmbH), inserted at the distal ileum to allow for the collection of ileal digesta(Reference Newman, Zebeli and Velde13). Post-surgery, the skin around the cannula was cleaned with lukewarm water at least twice daily, treated with a skin-protecting paste (Stomahesive Paste, Convatec), and foam material was placed between the retaining ring and the skin to absorb any leaking digesta to prevent erythema(Reference Metzler, Mosenthin and Baumgärtel14). Post-surgery, pigs were allowed a 9-d recovery period, where feed amounts were gradually increased until reaching pre-surgery levels. Upon completion of the experiment, pigs were sedated (Narketan, 10 ml/kg body weight (Ketamine HCl; Vétoquinol AG) and Stresnil, 3 ml/kg body weight (Azaperone; Biokema SA)) and euthanised by intracardiac injection of T61 (10 ml/kg; Embutramide; MSD Animal Health).
Experimental design, diets and feeding
Prior to the start of the experiment, pigs were fed a commercial cereal-based grower diet (metabolisable energy 13·4 MJ/kg; crude protein 16·8 % as-fed basis)(Reference Newman, Petri and Grüll9). Following recovery, pigs were randomly allotted to one of two dietary treatments according to a complete crossover design with two 16-d replicate periods (online Supplementary Fig. S1). This provided a total of seven observations per dietary treatment. Each replicate period consisted of 10-d adaptation to diets, followed by 3-d collection of faeces and 3-d collection of ileal digesta. The advantage of using a crossover design is that it requires a smaller sample size than a parallel design, without compromising the level of statistical power and precision, which is helpful when using an ileal cannulation model. Nevertheless, it may be advisable to include a washout period in order to avoid carryover effects from one to the other experimental period, especially as the effect of short-term feeding of TGS on the intestinal passage rate, nutrient flow and microbiota composition was investigated in the present study. We did not include a washout period due to the increasing risk of growth-related losses of cannulae with progressing time from the surgery, and maturational changes in the intestinal microbiota with increasing age of the pig. In order to balance for simple first-order carryover effects of one treatment into the following treatment period, the diets were randomised among pigs in both replicate batches.
The two experimental diets were formulated to meet or exceed current recommendations for nutrient requirements of growing pigs(15) and only differed in the starch component (Table 1). The starch component of the control (CON) diet was a rapidly digestible waxy maize starch (Agrana Research and Innovation Center GmbH), whereas in the TGS diet, 50 % of the native waxy maize starch was replaced by TGS (Agrana Research and Innovation Center GmbH)(Reference Newman, Petri and Grüll9, Reference Metzler-Zebeli, Newman and Grüll16). As described before(Reference Newman, Petri and Grüll9, Reference Metzler-Zebeli, Newman and Grüll16), acid-catalysed transglycosylation of the native waxy maize starch was used to produce TGS. This process rearranged the glycosidic bonds in the native waxy maize starch, resulting in eight types of glycosydic bonds: α(1,2), α(1,3), α(1,4), α(1,6), β(1,2), β(1,3), β(1,4), and β(1,6)-glycosidic bonds and a total dietary fibre content of 50 % in the final TGS product (method 2009.01)(17). Daily feed allowances were estimated to correspond to approximately three times the estimated energy required for maintenance(15), which were divided into two equal meals that were fed at 08.00 and 16.00 hours as a mash and mixed with water at a ratio of about 2:1. Potential feed spillage and leftovers in feeding bowls were collected after feeding.
Ingredients and chemical composition of the control (CON) diet and transglycosylated starch (TGS) diet
* Agrana Research and Innovation Center GmbH.
† FibreCell (Agromed Austria GmbH).
‡ Provided per kg of complete diet (GARANT GmbH): 4800 µg of vitamin A, 50 µg of vitamin D3, 125 mg of vitamin E, 2·0 mg of vitamin B1, 6·0 mg of vitamin B2, 3·0 mg of vitamin B6, 0·03 mg of vitamin B12, 3·0 mg of vitamin K3, 30 mg of niacin, 15·0 mg of pantothenic acid, 900 mg of choline chloride, 0·15 mg of biotin, 1·5 mg of folic acid, 200 mg of vitamin C, 4·6 g of Ca, 2·3 g as digestible P, 2·4 g as Na, 2·0 g of Cl, 3·2 g K, 1·0 g Mg, 50 mg of Mn (as MnO), 100 mg of Zn (as ZnSO4), 120 mg of Fe (as FeSO4), 15·6 mg of Cu (as CuSO4), 0·5 mg of Se (as Na2SeO3), 1·9 mg of iodine (as Ca(IO3)2).
§ Total starch in the CON diet determined by enzymatic spectrophotometric assay (R-Biopharm), and in the TGS diet by perchloric acid treatment of samples and measurement of resulting glucose using HPLC(15).
Sample collection and digesta flow marker application
In each of the two experimental periods, fresh faecal samples were collected from slatted flooring and tray beneath the cage on experimental days 11–13 (online Supplementary Fig. S1) via grab sampling(Reference Newman, Zebeli and Velde13). Subsamples of freshly defecated faeces were immediately frozen at −80°C for the analysis of faecal microbiota and at −20°C for SCFA. The remaining faecal samples were stored at −20°C for proximate nutrient analysis. Ileal digesta samples were collected on days 14 and 15 between 08.00 and 18.00 hours into 10 × 4 cm plastic bags that were attached to the barrel of each cannula using rubber bands. Each bag contained 4 ml of 2·5 m formic acid to minimise bacterial fermentation. Full bags were removed, or at least every 30 min. Ileal digesta samples were collected without formic acid for bacterial microbiota, SCFA and lactate analyses at 11.00 and 14.00 hours. Subsamples for bacterial microbiota were immediately frozen at −80°C, and subsamples for SCFA and lactate were stored at 4°C until digesta samples from both time-points were obtained. Then, digesta was pooled by pig, homogenised and frozen at −20°C for later analysis. On day 16 of each experimental run, 40 ml of liquid marker (chromium-ethylenediaminetetraacetic acid, Cr-EDTA) and 1 g of solid marker (Yb2O3) were mixed into the morning meal(Reference Newman, Zebeli and Velde13). Ileal digesta samples were collected postprandially at 0, 30, 90, 120, 180, 240, 300, 360, 420 and 480 min. As ileal digesta flow can be irregular, the actual collection times were recorded.
Chemical analysis
Prior to chemical analyses, ileal and faecal subsamples for proximate nutrient analysis were lyophilised (Gamma 2–20; Martin Christ Gefriertrocknungsanlagen GmbH). Ileal, faecal and diet samples were homogenised and ground through a 0·5-mm screen (GRINDOMIX GM200; Retsch GmbH). Diets and freeze-dried ileal digesta and faeces were analysed for DM, crude ash, crude protein (N × 6·25 by the Kjeldahl method), Ca and P(Reference Naumann and Basler18). Gross energy of diets, digesta and faeces was measured using an isoperibolic bomb calorimeter (C200; IKA-Werke GmbH and Co. KG), with benzoic acid as calibration standard(Reference Naumann and Basler18). The total starch content of the CON diet was determined via the UV method (Enzymatic BioAnalysis; R-Biopharm) using a spectrophotometer (DR 2800; Hach Lange GmbH), whereas to measure total starch content of the TGS diet, soluble TGS was leached out of the samples and treated with perchloric acid(Reference Newman, Zebeli and Eberspächer8). Thereafter, the resulting glucose was measured using HPLC (Ultimate 3000; Thermo Fisher Scientific) equipped with an Aminex HPX-87H separation column and a Refratomax 520 detector. The starch content in ileal digesta and faeces was measured accordingly. Titanium dioxide was measured spectrophotometrically (Hitachi U-3000; Metrohm INULA GmbH) at 405 nm in feed, faeces and ileal digesta after Kjeldahl extraction(Reference Khol-Parisini, Humer and Sizmaz19), whereas commercially available kits (Megazyme K-DLATE) were used to determine d- and l-lactate concentrations in fresh ileal digesta and faecal samples. Concentrations of SCFA in fresh ileal digesta and faecal samples were analysed using gas chromatography(Reference Newman, Zebeli and Velde13). The pH in fresh ileal digesta and faeces was determined using a Beckman ϕ63 pH meter (Beckman Coulter).
Passage rate marker analysis
Inductively coupled plasma mass spectrometry was applied to determine Cr and Yb as previously described(Reference Newman, Zebeli and Velde13). The measurements were performed on a double-focusing sector field instrument (Finnigan ELEMENT2; Thermo Electron Corporation) equipped with a CETAC ASX-520 autosampler (CETAC Technologies) using 50 mg of lyophilised ileal digesta. The digesta were weighed into 10 ml glass tubes and digested with 2 ml 65 % nitric acid (60 min at 95°C). Thereafter, the solutions were transferred into clean and pre-weighted 50 ml tubes of polypropylene, filled up to 50 g on a laboratory balance and shaken. After sedimentation, the solutions were diluted 1:100 with 0·5 % (v/v) nitric acid, and 20 µg/l Sc, 10 µg/l In and 10 µg/l Tl were added as internal standards. The following nuclides were measured in medium-resolution mode, Rs = 4000, 10 % valley definition 31P, 44Ca, 45Sc, 52Cr, 173Yb and 205Tl. Quantitative analysis of the samples was performed by external calibration.
The excretion curves of ileal markers, including Yb2O3 as a solid marker and Cr-EDTA as a liquid marker, were fitted to a two-compartment kinetics model, implemented in the NLIN procedure (iterative Marquardt method) of SAS (version 9.4, SAS Institute. Inc.) as described before(Reference Newman, Zebeli and Velde13, Reference Zebeli, Tafaj and Weber20). These models estimate the fractional passage rates from two compartments (slow (kS) and fast (kF), where kS represents passage out of the stomach; and kF, passage out of the small intestine), including a time delay. The time delay indicates the time lapse between pulse dosing and the first appearance of markers in ileal digesta (or transit time due to displacement flow of digesta, in minutes). The time lapse between pulse dosing and the reach of peak ileal marker excretion was considered as the time of peak flow (minutes). Maximum total mean retention time (TMRT) was calculated as the sum of maximum mean retention times in the stomach (GMRT = 1/kS) and small intestine (SMRT = 1/kF), including the time delay.
DNA isolation, Illumina MiSeq sequencing and bioinformatics analysis
The PowerSoil DNA isolation kit (MoBio Laboratories) was used to extract total DNA from 250 mg of the homogenised ileal digesta and faecal samples. Modifications included an additional heating step (70°C for 10 min) between mixing the digesta samples with C1 buffer and bead beating for proper lysis of bacteria(Reference Metzler-Zebeli, Lawlor and Magowan21). DNA concentration was measured using the Qubit double-stranded DNA HS assay kit (Life Technologies) on the Qubit 2.0 fluorometer (Life Technologies). The 16S rRNA gene PCRs, library preparation and sequencing on an Illumina MiSeq sequencing v2 platform (Illumina Inc.) were performed with Microsynth as described previously(Reference Newman, Petri and Grüll9). The V3–V5 hypervariable regions of bacterial 16S rRNA genes were amplified using the primers 357F-HMP (5′-CCTACGGGAGGCAGCAG-3′) and 926R-HMP (5′-CCGTCAATTCMTTTRAGT-3′) to produce an amplicon size of approximately 523 bp (Peterson et al., 2009). Libraries were constructed by ligating sequencing adapters and indices onto purified PCR products using the Nextera XT sample preparation kit (Illumina Inc.). Equimolar quantities of each library were pooled and sequenced using a 300-bp read length paired-end protocol. After sequencing, the overlapping paired-end reads were de-multiplexed, trimmed of Illumina adaptor residuals using cutadapt (https://cutadapt.readthedocs.io/en/stable/) and stitched using USEARCH (drive5/com) with Microsynth.
The merged FASTQ sequences were analysed using QIIME (Quantitative Insights Into Microbial Ecology) software package, version 1.9.1(Reference Caporaso, Kuczynski and Stombaugh22). After quality trimming of stitched reads using a quality threshold of q > 20, the UCHIME method using the 64-bit version of USEARCH (drive5.com)(Reference Edgar23, Reference Edgar, Haas and Clemente24) and the GOLD database (drive5.com) were used to screen for and exclude chimeric sequences. Open-reference operational taxonomic unit (OTU) picking was performed at 97 % similarity level using UCLUST(Reference Edgar23), and taxonomy was assigned against the Greengenes database (gg_13_8; http://qiime.org/home_static/dataFiles.html). Rare OTUs with less than ten sequences were removed. The raw sequence reads were uploaded to the NCBI Bioproject databank (PRJNA514964).
Differences in hit count abundances of bacterial genera were assessed using the R package ‘DESeq2’ (version 1.14.1)(Reference Love, Huber and Anders25, Reference Huber, Carey and Gentleman26). The ‘DESeq’ function within the DESeq2 package was used to test for differentially abundant taxa by dietary starch. In using this function, data were normalised to the size factors of the libraries and dispersion estimation. Specifically, this function models raw counts using a negative binomial distribution and adjusts internally for ‘size factors’ that normalise for differences in sequencing depth between sample libraries. We also pre-filtered the dataset to keep only features that have at least ten reads total using the R command in DESeq2 ‘rowSums(counts(deseq_data)) ≥ 10’ to remove low-count taxa. DESeq2 default settings were used to replace and filter for count outliers. Differential taxa abundance between treatments was identified using the ‘Wald’ test(Reference Love, Huber and Anders25). Data were listed as normalised read counts per feature. The correction of P values relating to the taxonomic profiles was performed using the Benjamini–Hochberg false discovery rate (FDR)(Reference Benjamini and Hochberg27).To account for multiple comparisons, we considered a type I error rate of ≤0·05 and a FDR-adjusted P value (q value) ≤0·10 as significant. Mean counts for each dietary starch were computed using the DESeq function within the DESeq2 package. Statistical assessment of dissimilarity matrices (Bray–Curtis) derived from ileal and faecal OTU data was performed using the ‘adonis2’ function (PERMANOVA) and visualised in two-dimensional non-metric multidimensional scaling (NMDS) ordination plots obtained with the ‘metaMDS’ function in the vegan R package (version 2.5.2)(Reference Oksanen, Blanchet and Friendly28). Alpha diversity measurements were also performed by means of the vegan R package.
In addition, sparse partial least squares (sPLS) and relevance network analysis were performed using the package ‘mixOmics’ in R(Reference Lê Cao, Costello and Lakis29, Reference Rohart, Gautier and Singh30) to integrate data of genera (0·01 % of all reads) and fermentation metabolites, including digesta DM content and pH with nutrient flow and digesta retention parameters in ileal and faecal samples, in order to identify dependencies among the data. The ‘network’ function calculated a similarity measure between X and Y variables in a pairwise manner. In the graphs, each X and Y variable corresponds to a node, whereas the edges display the associations between the nodes. The size of the nodes is arbitrary, depending on the name of the variable.
In order to further understand ileal and faecal networking, multi-group supervised DIABLO N-integration was performed to identify the key features and their relations among each other, also by means of the package ‘mixOmics’ (version 6.3)(Reference Rohart, Gautier and Singh30) in R studio (version 1.1.456). Supervised multi-group sPLS-discriminant analysis (sPLS-DA) was used to integrate the datasets of relative abundances of genera, fermentation metabolites including digesta DM content and pH, and nutrient flow in order to classify and select key features from each dataset. Tuning of sPLS-DA parameters was performed using the ‘tune’ function to identify the most influential genera, fermentation metabolites and nutrients in digesta or faeces with the lowest possible error rate – finally selecting ten genera, five fermentation metabolites and four nutrient genes each for components 1 and 2, respectively. In doing so, the ‘tune’ function returns a set of ‘keepX’ values for each dataset that shows the best predictive performance for all the components in the model, while simultaneously performing repeated leave-one-out cross-validation using the function ‘nrepeat’(Reference Rohart, Gautier and Singh30). The assessment of the performance of the final model by cross-validation showed the lowest possible error rate of, on average, 35 and 27 % for components 1 and 2, respectively, for ileal datasets. For ileal datasets, cross-validation of the final model revealed the lowest possible error rate of, on average, 5·4 and 3·1 % for components 1 and 2, respectively.
Calculations and statistical analysis
The amounts of DM protein, ash, starch (g/kg DM intake) and gross energy (MJ/kg DM intake) remaining at the distal ileum and excreted in faeces and post-ileal disappearance were calculated as previously reported(Reference Newman, Zebeli and Velde13):
Amount remaining at the terminal ileum or faeces (g or MJ/kg DM intake) = (concentration of dietary constituent in digesta/faeces × (TiO2 in diet/TiO2 in digesta/faeces))
Post-ileal disappearance (g or MJ/kg DM intake) = amount remaining at terminal ileum – amount excreted in faeces
A power test analysis estimated according to Kononoff & Hanford(Reference Kononoff and Hanford31) and based on previous data for similar variables, such as intestinal microbiota composition and digestibility(Reference Newman, Zebeli and Velde13, Reference Regmi, Metzler-Zebeli and Gänzle32), using the SAS software was performed to identify the minimum number of observations (n 6) required for the present pig experiment to reject the null hypothesis if this was false. Due to the missing washout period, all parameters, including ileal and faecal bacterial taxa and microbial metabolites, ileal digesta and faecal characteristics, passage rate, as well as ileal flow, hindgut disappearance and faecal excretion of nutrients, were analysed for potential carryover effects using a linear model and the MIXED procedure in SAS. This mixed model included the fixed effects of the sequence of feeding the diets, diet and replicate batch. The estimates showed that CON/TGS v. TGS/CON sequences had no significant impact on the data. Moreover, data of passage rate, ileal flow, hindgut disappearance and faecal excretion of nutrients, pH, SCFA and lactate were analysed for normality using the Shapiro–Wilk test and outlier in SAS. ANOVA was performed using the MIXED procedure of SAS to compare the effects of TGS and CON diets with pig as the experimental unit. The model included the fixed effect of diet and the random effect of block. Degrees of freedom were approximated using the Kenward–Rogers method (ddfm = kr). Pairwise comparisons among least square means were performed using the Tukey–Kramer test. Results are expressed as least square means with their standard error of the mean, and P < 0·05 and 0·05 < P ≤ 0·10 were defined as significance and trend, respectively.
Results
Based on pig’s behaviour and appetite, all pigs remained clinically healthy throughout the experiment.
Digesta retention time in the stomach and small intestine
Both liquid (Cr-EDTA) and solid (Yb2O3) phase markers were added to the morning meal on experimental day 16 to assess the transit through the stomach and small intestine. The average time delay until both liquid- and solid-phase markers appeared in ileal digesta was approximately 170 min after marker ingestion (Table 2), whereby the range of time delay was between 92 and 266 min for Cr-EDTA and between 85 and 299 min for Yb2O3 between both diets. Feeding of the TGS diet reduced time delay until the liquid fraction marker Cr-EDTA appeared in ileal digesta by 54 min compared with the CON diet (P = 0·004). With regard to the solid fraction, the fractional rate of passage of Yb2O3 in the small intestine (faster compartment) as a percentage per h was 6·9-fold greater with TGS but not different in the stomach compared with CON. Overall, the TGS diet caused a 5- and 0.2-h shorter GMRT (P = 0·064) and SMRT of digesta (P = 0·039), respectively, and subsequently tended (P = 0·055) to reduce TMRT compared with the CON diet.
Retention of digesta in the stomach and small intestine of pigs fed either the control (CON) diet (n 7) or transglycosylated starch (TGS) diet (n 6) (Mean values with their standard errors)
GMRT, maximum gastric mean retention time; SMRT, maximum mean retention time in the small intestine; TMRT, maximum total mean retention time over the two compartments.
* P < 0·05, **P < 0·01.
Intestinal flow and hindgut disappearance of proximate nutrients
Pigs consumed the offered amount of feed, resulting in similar daily intake of DM, ash, starch, protein and energy between diets. Consumption of TGS increased the flow of DM, gross energy and starch (P < 0·001) and protein (P = 0·076) per kg of DM intake at the distal ileum by 2·0-, 2·0-, 6·3- and 1·2-fold, respectively, compared with CON (Table 3). Although ileal flow of ash was similar between diets, the TGS diet increased the flow of Ca and P by 1·4- and 1·5-fold per kg of DM intake, respectively, compared with the CON diet. The disappearance of DM, starch and gross energy in the hindgut, in turn, was correspondingly higher in TGS- compared with CON-fed pigs, whereas TGS decreased hindgut disappearance of protein by 0·5-fold (P < 0·05). This resulted in a 1·6-, 2·0- and 1·75-fold higher faecal excretion of DM, protein and gross energy in TGS- compared with CON-fed pigs (P < 0·001). Starch residuals could only be detected in faeces of TGS-fed pigs, which excreted 8 % of the ingested starch, but not in faeces of CON-fed pigs (P < 0·001). Due to the unchanged large intestinal uptake, also 1·3- and 1·5-fold more Ca and P were excreted in faeces of TGS- compared with CON-fed pigs (P < 0·01).
Ileal flow, hindgut disappearance and faecal excretion of nutrients in pigs fed either the control (CON) diet (n 7) or transglycosylated starch (TGS) diet (n 6) (Mean values with their standard errors)
* P < 0·05, **P < 0·01, ***P < 0·001.
Dry matter, pH and fermentation metabolites in ileal digesta and faeces
Ileal digesta of TGS-fed pigs contained more DM compared with CON-fed pigs (online Supplementary Table S1), whereas in faeces the opposite relationship was found (P < 0·05; online Supplementary Table S2). Moreover, the TGS diet decreased ileal and faecal pH by 0·4 and 2·2 log-units, respectively, compared with the CON diet (online Supplementary Tables S1 and S2). With respect to fermentation metabolites, the TGS diet enhanced total SCFA concentrations and SCFA output per kg of DM intake by two- to fivefold in ileal digesta and faeces (P < 0·05). This increase in total SCFA was mainly due to a largely enhanced acetate concentration at both intestinal sites with TGS compared with CON. Although the branched-chain fatty acids increased with the TGS diet in ileal digesta, the molar proportion of isobutyrate and isovalerate, similar to valerate, decreased with TGS compared with CON. Aside from the acetate concentration in faeces, faecal concentrations of butyrate and valerate increased by 5·4- and 3·9-fold, respectively, as well as to a smaller extent those of the branched-chain fatty acids in TGS- compared with CON-fed pigs (P < 0·05). When comparing faecal SCFA profiles as molar proportions of total SCFA, the TGS diet increased the proportions of acetate, butyrate and caproate but decreased the proportions of propionate and branched-chain fatty acids (P < 0·05). Moreover, the TGS diet tended to enhance faecal total lactate, which was due to the tendency of a higher faecal l-lactate compared with the CON diet (P < 0·10). In ileal digesta, the lesser abundant d-lactate was enhanced (P < 0·05) with TGS compared with CON.
Composition of bacterial community
A total of 3 003 839 high-quality sequences with a mean Phred score of 30–35 and a minimum of 25 666 sequences per sample (mean, 75 096; mean length of stitched reads, 520 bp) were obtained for ileal and faecal samples when pigs were fed the TGS and CON diets. In total, 15 phyla were represented (data not shown). Read counts for the most abundant genera in ileal digesta and faeces can be found in online Supplementary Tables S3 and S4.
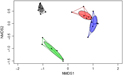
A significant separation of bacterial communities was detected in the Bray–Curtis-derived dissimilarity matrices (PERMANOVA) for ileal digesta and faeces (P = 0·002) and CON v. TGS diets (P = 0·001). However, as indicated by the intestinal site × diet interaction (P = 0·001) in PERMANOVA, different clustering of bacterial communities in relation to pig’s diet was mainly observed in faeces, which was visualised in the NMDS plots (Fig. 1). Likewise, ileal OTU richness and diversity were not affected by the dietary starch, whereas the diversity (Shannon and Simpson) of bacterial community in faeces of TGS-fed pigs was decreased (P < 0·01) compared with CON-fed pigs (online Supplementary Table S5).
Two-dimensional non-parametric multidimensional scaling (NMDS) ordination plots of ileal and faecal samples of pigs fed either the control (CON) or transglycosylated starch (TGS) diet (n 7 CON diet; n 6 TGS diet). NMDS plots were generated using the Bray–Curtis distance metric between intestinal sites and diets. Each dot represents an individual sample; circles indicate the standard deviation. Red indicates ileal samples of CON-fed pigs; blue, ileal samples of TGS-fed pigs; grey, faecal samples of CON-fed pigs; and green, faecal samples of TGS-fed pigs.
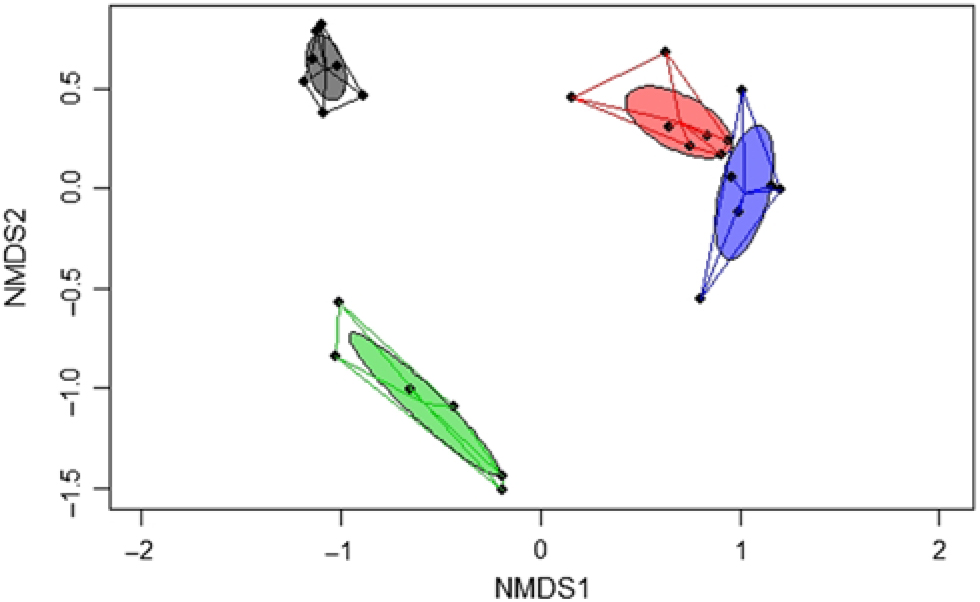
Of the predominant bacterial genera (Table 4), the TGS diet enriched the ileal community with Anaerovibrio, an unclassified Veillonellaceae genus, Megasphaera, Klebsiella, Lactobacillus, Mitsuokella, an unclassified Coriobacteriaceae genus (P < 0·01; q < 0·05) and Selenomonas (P < 0·05; q < 0·1) compared with the CON diet. By contrast, TGS-fed pigs comprised less reads of an unclassified Clostridiaceae genus, Ruminococcus and unclassified genera belonging to Clostridiales, Ruminococcaceae and Christensenellaceae (P < 0·01; q < 0·05) as well as of Sutterella (P < 0·05; q < 0·1) in their ileal digesta compared with CON-fed pigs (P < 0·05; q < 0·1). Due to the divergence of the faecal bacterial community from ileal community (Fig. 1), the effects of TGS on faecal bacterial community were partly different between the two sites. In faeces (Table 4), the TGS diet enriched (P < 0·001; q < 0·05) the community especially with reads from unclassified Coriobacteriaceae (+7·19 log2-fold changes), Megasphaera (+8·09 log2-fold changes) and Mitsuokella (+6·73 log2-fold changes) and, to a lesser extent, with Ruminococcus, Desulfovibrio, an unclassified Veillonellaceae genus and Collinsella (P < 0·05; q < 0·1). Dominant bacterial genera that decreased with the TGS diet were, like in ileal digesta, unclassified genera belonging to Clostridiales, Ruminococcaceae, Christensenellaceae and Enterobacteriaceae (P < 0·01; q < 0·05).
Selected bacterial genera (hit counts) in ileal digesta and faeces of pigs fed either the control diet (n 7) or transglycosylated starch diet (n 6) (Mean values with their standard errors)
* P < 0·05, **P < 0·01, ***P < 0·001.
† Normalised reads (hit counts).
‡ Standard error of the log2-fold change.
§ False discovery rate (Benjamini–Hochberg)-corrected P value.
Relevance networks and sparse partial least squares-discriminant analysis data integration between bacterial genera, SCFA and nutrient flow
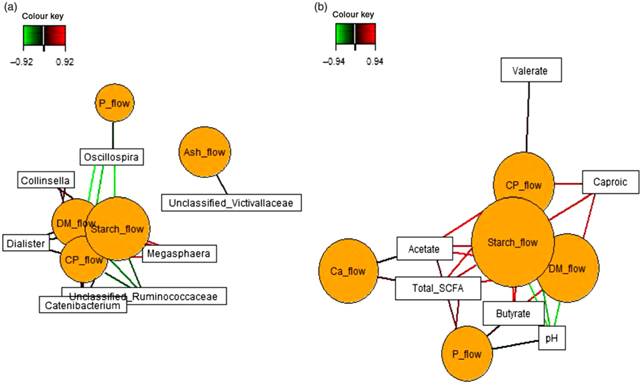
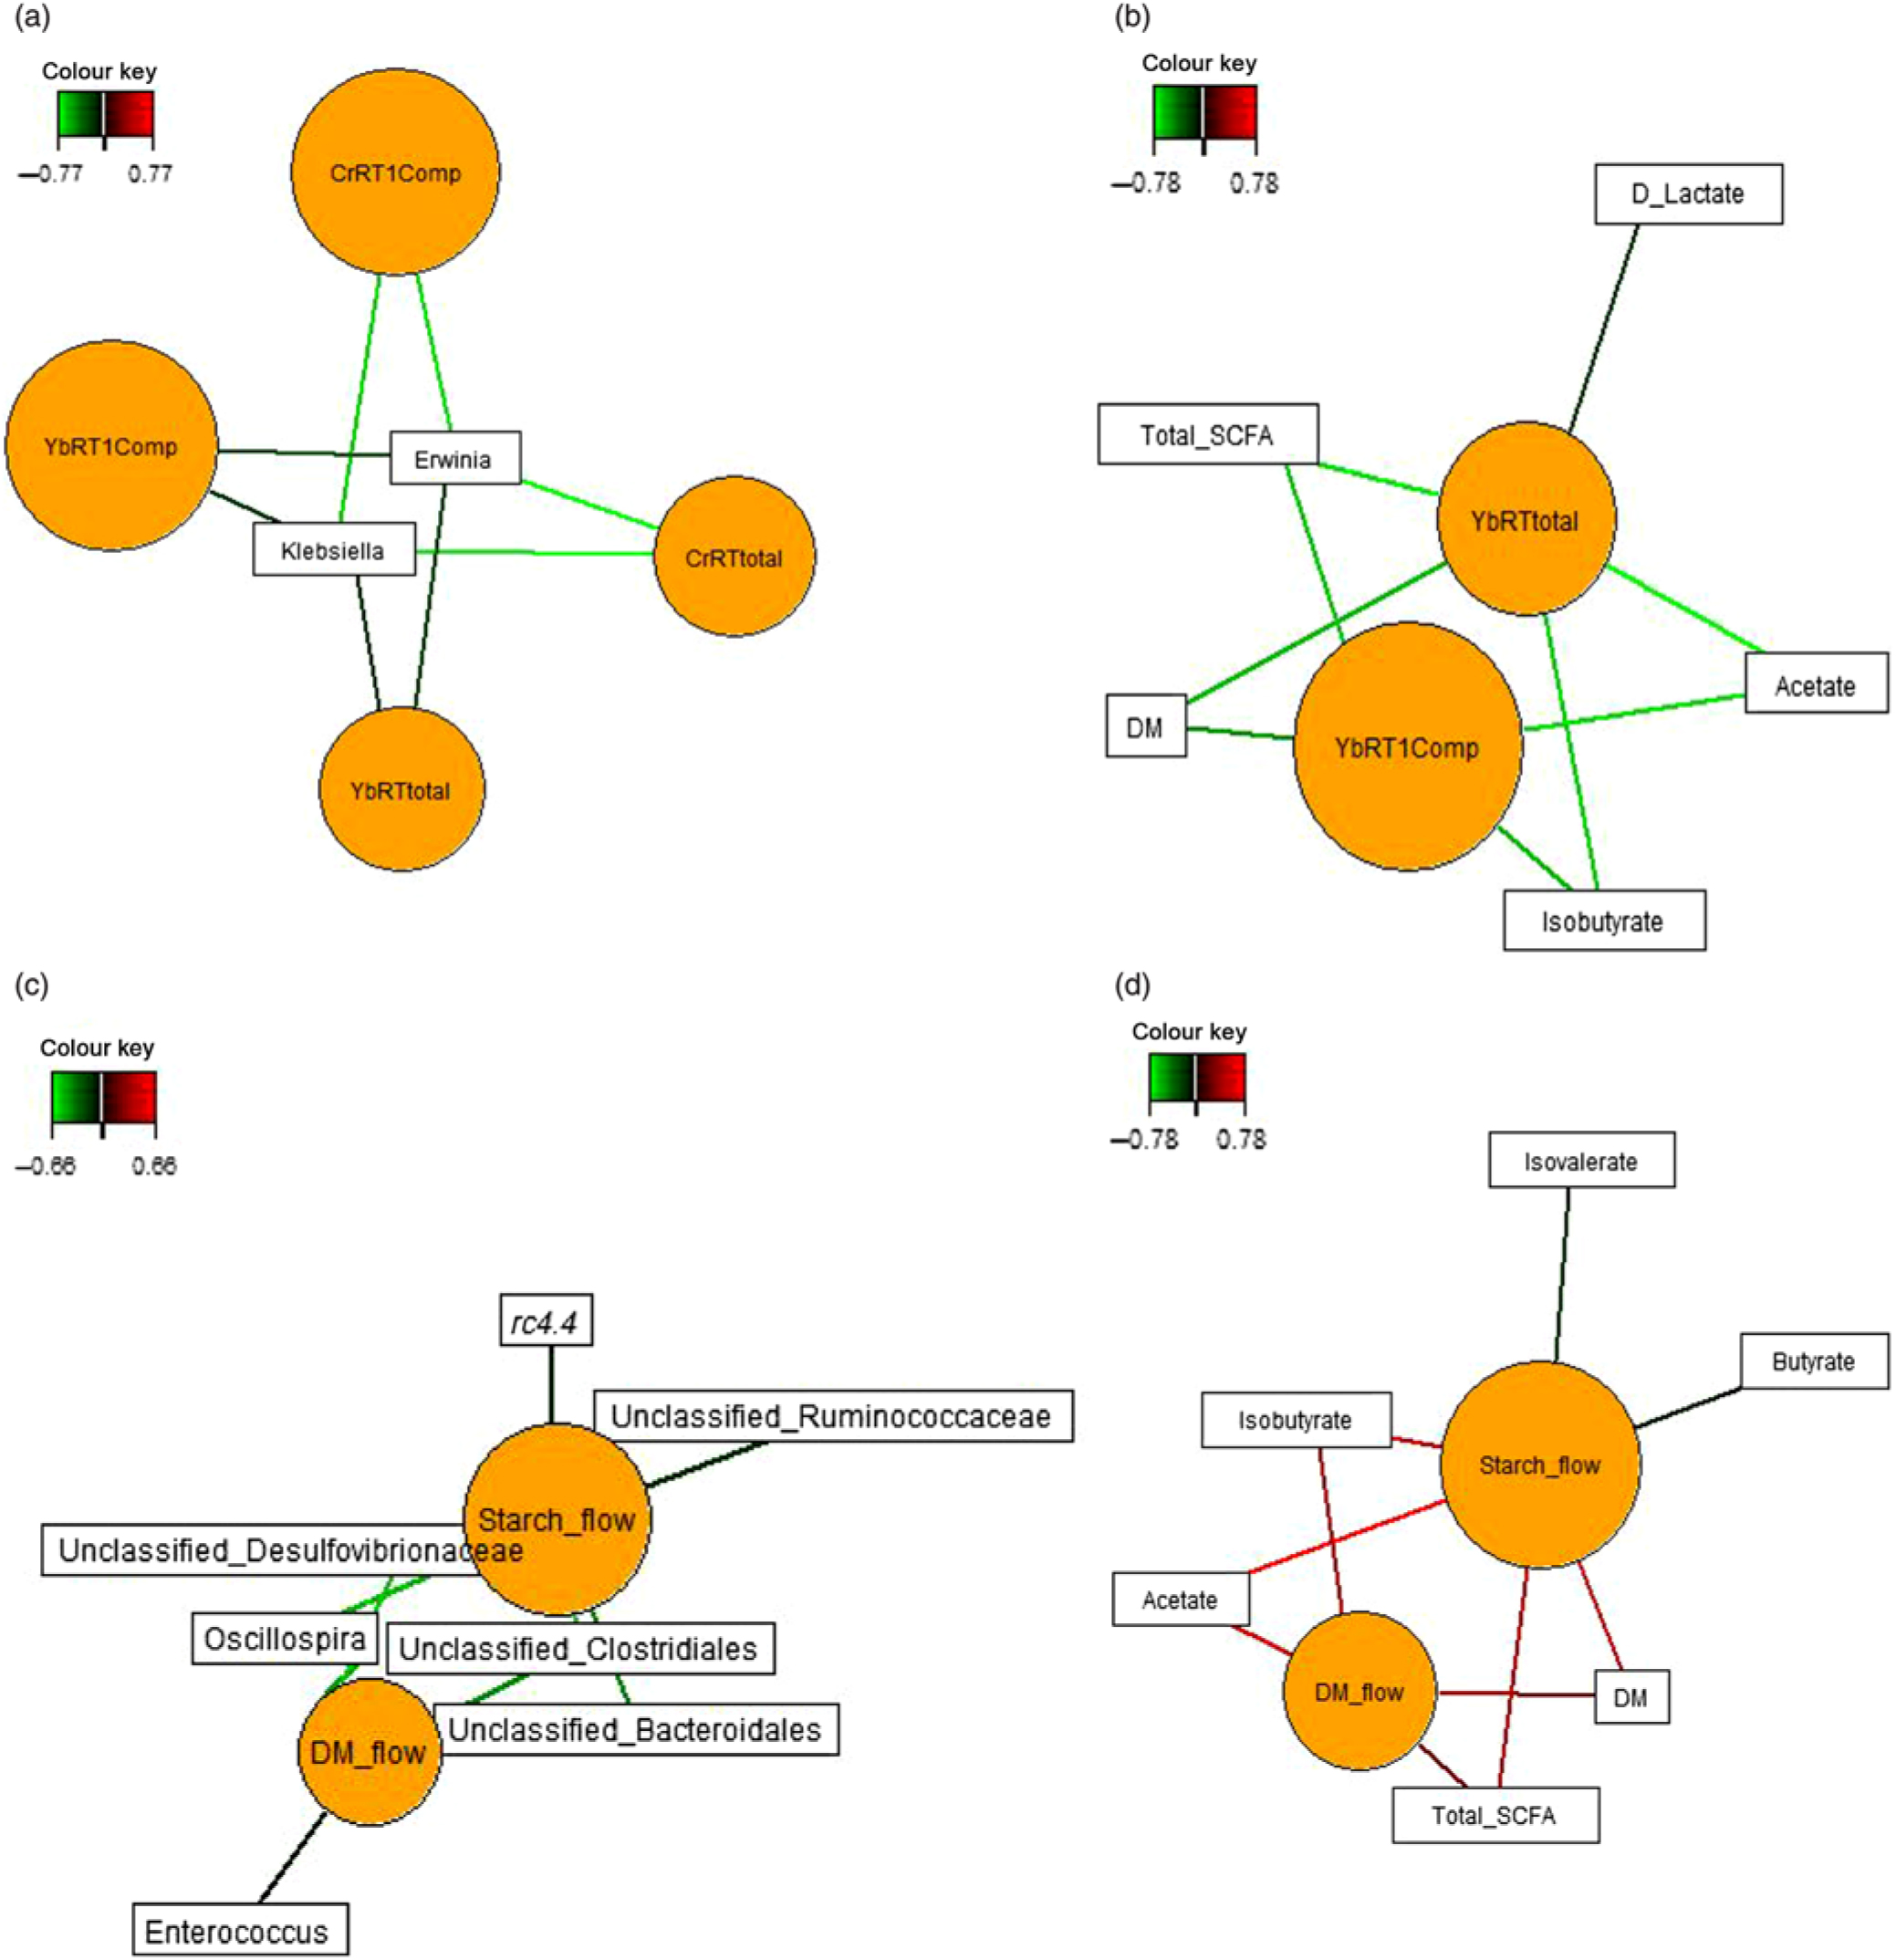
Sparse partial least squares regression and relevance networking were used to identify bacterial genera and SCFA that were most influenced by ileal retention time and ileal (Fig. 2) and faecal nutrient flow (Fig. 3). The exact covariation scores for these associations can be found in online Supplementary Tables S6 and S7. Networks showed that Klebsiella and Erwinia were negatively associated with the retention time of the solid- and liquid-phase markers in digesta, with the retention of digesta in compartment 1 (stomach) being the most influential (|r| > 0·6; Fig. 2(a)). The retention of the solid-phase marker, again especially the retention in the stomach, also negatively correlated with ileal concentrations of total SCFA, acetate and isobutyrate and ileal DM content, whereas d-lactate was negatively associated with the retention of the solid phase in both compartments (|r| > 0·6; Fig. 2(b)). Ileal abundances of five genera (Oscillospira, Enterococcus and unclassified genera within Desulfovibrionaceae, Clostridiales and Bacteroidales) were negatively associated with ileal DM flow, which together with unclassified Ruminococcaceae genus and rc4.4 (except Enterococcus) also negatively correlated with ileal starch flow (|r| > 0·6; Fig. 2(c)). Positive dependencies with ileal DM and starch flow existed for total SCFA, acetate, isobutyrate and ileal DM content, whereas negative relationships existed between ileal starch flow and ileal butyrate and isovalerate concentrations (|r| > 0·6; Fig. 2(d)). In faecal samples, Megasphaera, Dialister and Catenibacterium were positively, and Oscillospira and an unclassified Ruminococcaceae genus negatively, associated with faecal DM, starch and protein flow (excretion) (|r| > 0·6; Fig. 3(a)). Oscillospira was additionally negatively linked with faecal P excretion, and an unclassified Victivallaceae genus with faecal ash flow (excretion) (|r| > 0·6). Total SCFA, acetate, butyrate and caproate were positively associated with DM, starch and protein flow (excretion) in faeces, whereby total SCFA and acetate were also positively associated with Ca and P excretion, and butyrate with faecal P excretion (|r| > 0·6; Fig. 3(b)). Valerate was mainly positively associated with faecal protein excretion (|r| > 0·6). Oppositely, faecal pH was negatively associated with DM, starch, protein and P excretion in faeces (|r| > 0·6).
Dependencies of bacterial genera and fermentation metabolites from digesta retention time and nutrient flow in ileal digesta (a–d). Covariations between the retention time in the stomach and small intestine, ileal nutrient flow, relative abundances of bacterial genera (relative abundance >0·01 % of all reads) and fermentation metabolites including digesta pH and DM content were established separately using sparse partial least squares regression and relevance networking. The networks are displayed graphically as nodes (parameters) and edges (biological relationship between nodes). The edge colour intensity indicates the level of association: red = positive, green = negative. Only the strongest pairwise associations were projected (|r| > 0·6). CrRT1Comp, liquid marker fractional passage rate for compartment 1 (stomach); CrRTtotal, liquid marker fractional passage rate for both compartments; YbRT1Comp, solid marker fractional passage rate for compartment 1 (stomach); YbRTtotal, solid marker fractional passage rate for both compartments.
Dependencies of bacterial genera (a) and fermentation metabolites (b) from nutrient flow (excretion) in faeces. Covariations between faecal nutrient flow (excretion), relative abundances of bacterial genera (relative abundance >0·01 % of all reads) and fermentation metabolites including faecal pH and DM content were established separately using sparse partial least squares regression and relevance networking. The networks are displayed graphically as nodes (parameters) and edges (biological relationship between nodes). The edge colour intensity indicates the level of association: red = positive, green = negative. Only the strongest pairwise associations were projected (|r| > 0·8). CP, crude protein.

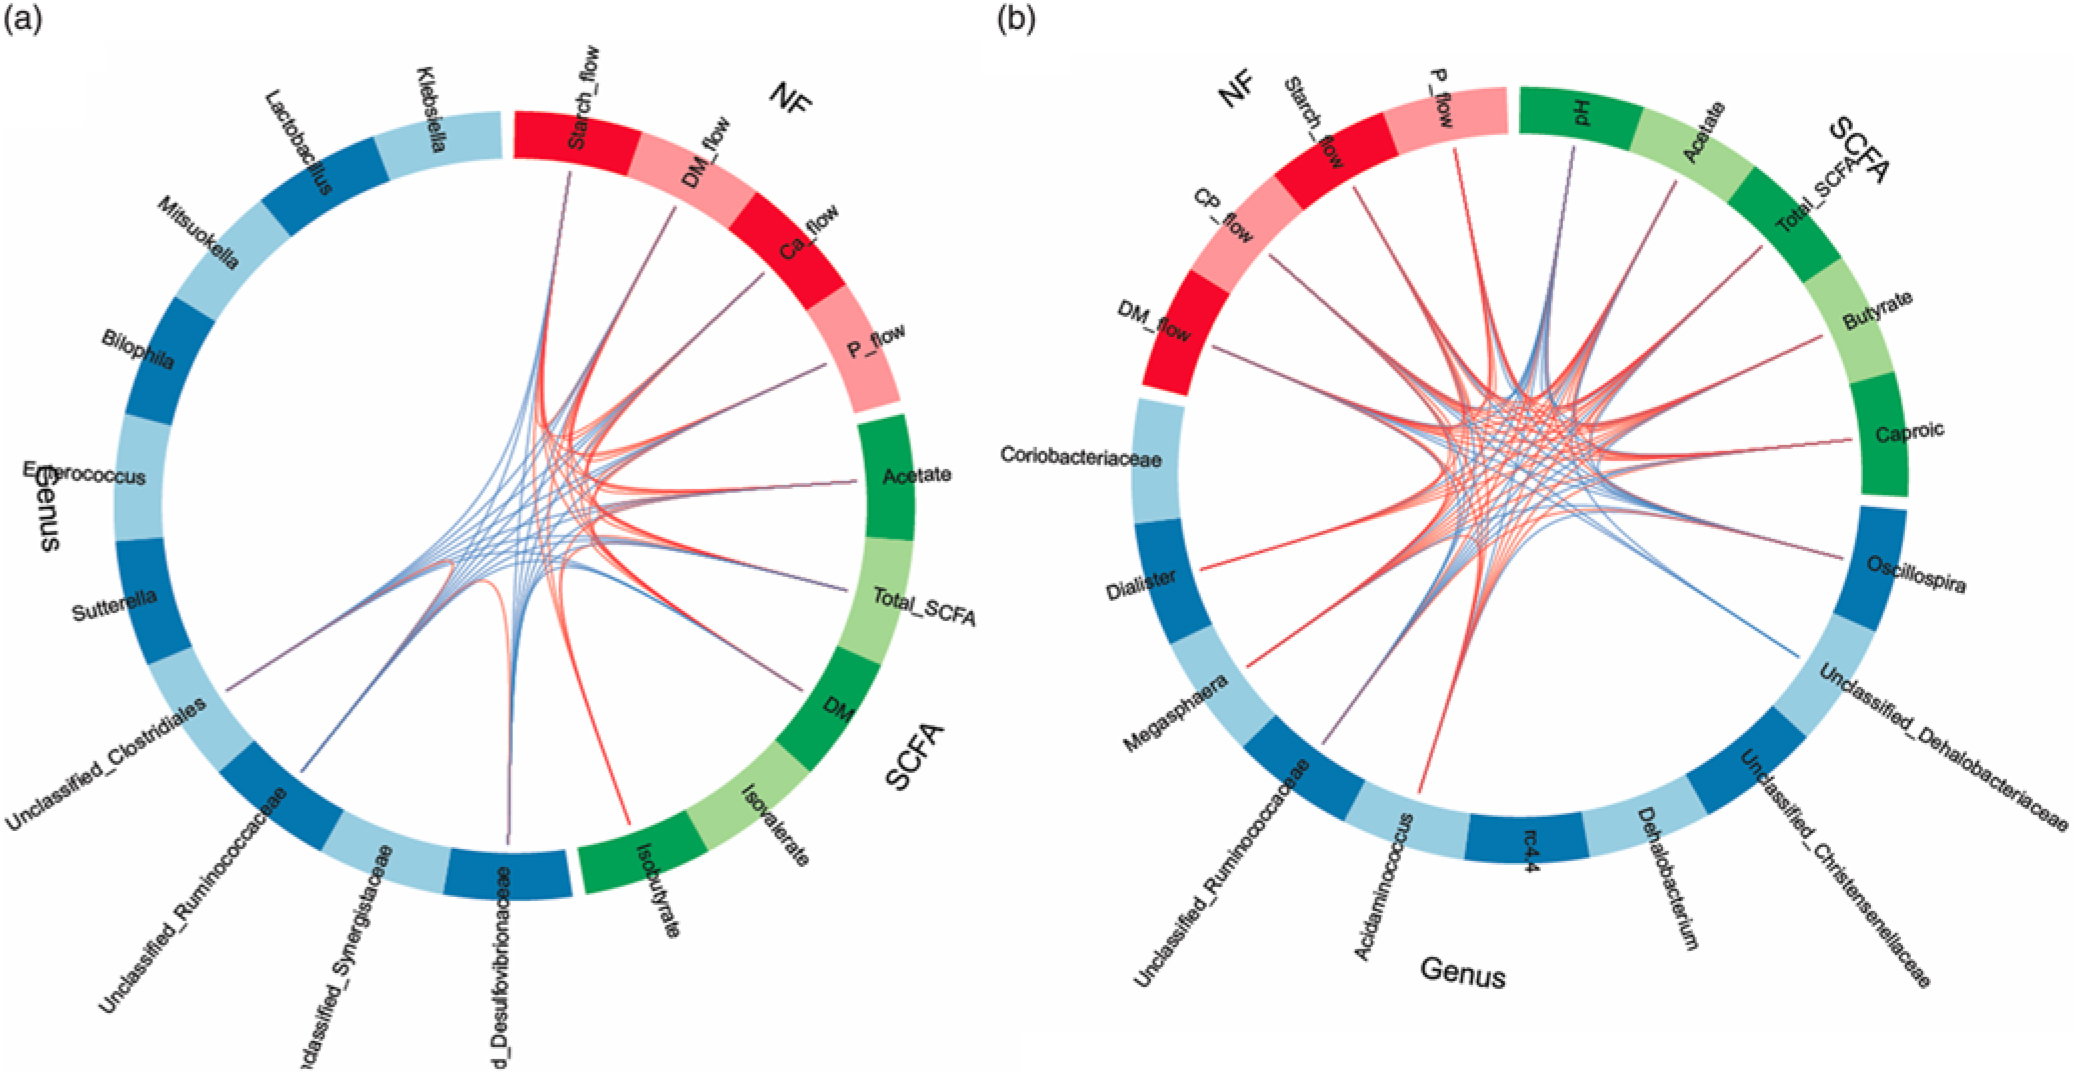
In order to obtain a better understanding of the dependencies among nutrient flow in the digesta and bacterial activity, we integrated the various datasets using the ‘tune’ function in sPLS-DA to model relationships between the different data that achieved the best predictive performance(Reference Lê Cao, Costello and Lakis29). Dietary starch-associated separation of the most discriminant genera (block: genus), fermentation metabolites (block: SCFA) and nutrient flow (block: NF) were visualised in sample plots per dataset; loading plots and relationships among the identified, most discriminant features were illustrated in circos plots for component 1. Sample plots indicated that, despite a clear separation between diets for the nutrient flow, diet-related clusters for genera and SCFA still overlapped in ileal digesta and only were clearly separated in faeces (online Supplementary Fig. S2). Loading plots showed that unclassified genera of Synergistaceae and Desulfovibrionaceae, acetate and starch flow were the most influential features in ileal digesta, whereas Oscillospira, Megasphaera, pH and DM excretion were the most discriminant variables in faeces for component 1 (online Supplementary Fig. S3). More relationships between the most influential parameters were detected in faeces than in ileal digesta, supporting the relationships between nutrient flow with SCFA concentrations and the best discriminant genera (Fig. 4).
Circos plots of horizontal sparse partial least squares-discriminant analysis displaying correlations between the identified best discriminant genera (n 10), SCFA (n 5) and nutrient flow (NF) (n 4) for component 1 in ileal digesta (a) and faeces (b). Positive and negative correlations (|r| > 0·6 for ileum and |r| > 0·8 for faeces) are displayed by red and blue links, respectively. Relative abundance of bacterial genera >0·01 % of all reads. CP, crude protein.
Discussion
Dietary fibres, including RS, often alter the nutrient flow and bulk of intestinal digesta, thereby changing the substrate availability to the microbiota along the gastrointestinal tract(Reference Newman, Zebeli and Velde13, Reference Fouhse, Gänzle and Beattie33). By greatly increasing ileal starch flow and substrate availability for fermentation in the hindgut, the present data demonstrated low intestinal digestibility and the RS properties of TGS. Taxonomic shifts related to TGS consumption occurred mostly within the Firmicutes and Proteobacteria phyla at both intestinal sites. We could associate several bacterial genera with ileal and faecal nutrient flow, showing that the intestinal bacteria adapt rapidly to the dietary starch source. Our results further emphasise the importance of the retention time of digesta for ileal bacterial composition and metabolic activity. In contrast to our hypothesis, TGS did not slow down transit in the stomach and small intestine but accelerated passage in the upper digestive tract, leaving less time for bacterial action on TGS. Relevance networking suggested that especially Proteobacteria genera, as the predominant Klebsiella, benefitted from the faster transit of digesta in the stomach. A shorter retention in the upper digestive tract may explain the small Bray–Curtis-derived distances between the bacterial communities in ileal digesta compared with faeces between CON- and TGS-fed pigs. Nevertheless, the lower pH and elevated SCFA concentrations in ileal digesta provide evidence for the microbial use of TGS in the upper digestive tract. Overall, when interpreting the present results, it should be kept in mind that, despite randomising the pigs to dietary treatments in both replicate batches and the absence of carryover effects, it cannot be completely ruled out that a certain residual effect may have existed, thereby biasing the direct treatment effect.
TGS mainly reduced the retention of solid digesta with little impact on the liquid fraction in the upper digestive tract. Due to the sevenfold faster transit of the solid fraction, it is reasonable to assume that, besides starch, other dietary components may have been less completely digested and absorbed in the upper digestive tract of TGS-fed pigs, as well. Results for ileal nutrient flow showed that mainly the digestion of starch, Ca and P was impaired by TGS, whereas the reduced retention of digesta in the stomach and small intestine did not alter protein digestion. The enhanced ileal flow of starch increased the DM content of digesta as indicated by the present correlations. Although some residual starch may have originated from the waxy maize starch, the digestibility coefficients led us to assume that most starch entering the large intestine were TGS residuals. We did not measure the viscosity of ileal digesta and can only speculate whether increased digesta viscosity contributed to a higher ileal DM content with TGS. Oppositely, the DM content of faeces was lower, indicating certain bulking properties of TGS as, in total, more DM was excreted by TGS- compared with CON-fed pigs. Since fermentation acids have osmotic properties, the greater water content in faeces of TGS-fed pigs may have been partly caused by their threefold higher faecal SCFA and lactate concentrations. Faecal bulking properties may be attractive for using TGS as a functional food in human nutrition(Reference Topping and Clifton2, Reference Birt, Boylston and Hendrich3). For this, its efficacy at lower dosages as a supplement or food ingredient needs to be established first.
According to ileal networks, the retention of digesta in the stomach was more important for bacterial action than the retention in the small intestine. The networks indicated that Klebsiella and less abundant Erwinia benefitted from the altered conditions (i.e. fermentable substrate and time for fermentation) in the upper digestive tract of TGS-fed pigs. Klebsiella produces starch-hydrolysing and debranching pullulanase enzymes and can utilise starch as the sole carbon and energy source(Reference Rashid, Wilson and Ebringer34). This may have given this genus a growth advantage. Nevertheless, TGS had a stronger effect on faecal bacterial community than on ileal community as indicated by similar OTU richness and diversity in the ileum but reduced evenness of the bacterial community in faeces. The drastic shifts in the predominant bacterial genera in ileal digesta and faeces clearly emphasised that different enzymatic capabilities were needed for the degradation of TGS compared with the waxy maize starch. A recent functional analysis by our group using whole-genome shotgun metagenomics indicated steps in the breakdown of TGS by the action of α- and β-galactosidases, which replaced genes coding for enzymes within the starch and sucrose metabolism(Reference Metzler-Zebeli, Newman and Zebeli35).
Although similar TGS effects were identifiable for ileal digesta and faeces, intestinal site-specific shifts were clearly detectable, which can be related to the retention time and changes in substrate flow with continuous digestion and fermentation along the gastrointestinal tract. The present results for TGS-related shifts in ileal and faecal bacterial communities were per se comparable to our previous study using a slaughter pig model(Reference Newman, Petri and Grüll9). Nevertheless, taxonomic differences between both studies existed, which may be related to the pig model and inter-individual microbiome composition among pigs. Aside from Klebsiella, mainly saccharolytic and amylolytic genera, such as Anaerovibrio, Selenomonas, Lactobacillus and Coriobacteriaceae, benefitted from TGS in ileal digesta. These taxa produce lactate, acetate and succinate as fermentation end-products(Reference Prins36–Reference Clavel, Lepage, Charrier, Rosenberg, DeLong, Lory, Stackebrandt and Thompson38), which would correspond to the present results for fermentation acids in the ileum. A TGS-related increase in Klebsiella and Coriobacteriaceae, however, needs to be critically monitored in human studies as both taxa may act pro-inflammatory and have been linked to inflammatory bowel disease and other autoimmune diseases(Reference Edgar, Haas and Clemente24, Reference Walter, Martínez and Rose39). A TGS-related rise in the Actinobacteria genus Collinsella, identified as another discriminant genus in ileal digesta and probably able to degrade glycosidic bonds in TGS, in turn, may be beneficial for intestinal health through its production of SCFA and hippurate(Reference Carlson, Erickson and Hess40). sPLS-DA also emphasised the Veillonellaceae genus Dialister as important taxa for TGS degradation in faeces. Previously, Dialister has been related to the anti-inflammatory effect of whole-grain diets as increased numbers of this genus have been associated with lower IL-6 levels in the plasma of humans(Reference Martínez, Lattimer and Hubach41). Similarly, we recently reported the anti-inflammatory properties of TGS and could link an enhanced Dialister abundance with lower toll-like receptor-4 expression in the colon of TGS-fed pigs(Reference Metzler-Zebeli, Newman and Grüll16). Moreover, due to progressing digestion and fermentation, it can be assumed that various stages of degradation products from TGS reached the distal colon, thereby stimulating the activity of other amylolytic and saccharolytic species that were otherwise not able to use TGS. This may explain the opposite findings for a decline in Ruminococcus in ileal digesta and their enrichment in faeces of TGS-fed pigs.
Aside from starch and TGS degradation products, complex interactions among the bacteria such as primary metabolite cross-feeding, for example, of lactate and succinate(Reference Flint, Duncan and Scott42), may explain the increased hit counts for Veillonellaceae, Mitsuokella and Megasphaera in ileal digesta and faeces. Their increase likely contributed to the elevated faecal concentrations of acetate, butyrate, valerate and caproate(Reference Shetty, Marathe and Lanjekar43) with TGS feeding, thereby compensating the lower contribution of taxa that thrived less well on TGS to the ileal and faecal SCFA concentrations, such as genera within Ruminococcaceae and Clostridiaceae, according to the present correlations. In faeces, butyrate-producing Oscillospira within the Ruminococcaceae family(Reference Gophna, Konikoff and Nielsen44) was the most discriminating genus, but decreased by TGS. This is interesting as this genus has been reported to increase during fasting and on lower-starch diets by feeding mostly on host glycans(Reference Gophna, Konikoff and Nielsen44). Therefore, an indirect effect via the modification of the host glycan expression may explain the TGS-related decline in Oscillospira abundance, which would be in line with our previous observation for a 61 % lower mucin 2 expression at the caecal mucosa in TGS- compared to CON-fed pig(Reference Metzler-Zebeli, Newman and Grüll16). A similar dependency may explain the reduced abundance of Christensenellaceae in ileal digesta and faeces of TGS- compared with CON-fed pigs. As a consequence of increased fermentation of residual starch, TGS lowered ileal and faecal pH, which may have also modified bacterial abundances and their metabolic activity(Reference Flint, Duncan and Scott42).
Although acetate was the best discriminant fermentation acid at both intestinal sites, a clear relationship with the most discriminant bacteria in ileal digesta was missing. From the intestinal networks, it can be perceived that Megasphaera is a major taxa contributing to faecal butyrate and caproate levels, whereas Collinsella and the Lachnospiraceae genus Blautia appear to be important contributors to faecal acetate. While butyrate constitutes the primary energy source for enterocytes, acetate is transported via the portal vein to the liver where it can be directly used or is transported to adipocytes for de novo lipogenesis(Reference O’Hea and Leveille45, Reference Morrison and Preston46). Before being absorbed, SCFA (e.g. acetate, propionate and butyrate) activate G-protein receptors, which regulate immune and gene transcription pathways(Reference McKenzie, Tan and Macia4). Consequently, the attenuation of intestinal inflammation by SCFA may be one mechanism how the consumption of TGS may benefit host physiology. Another advantage of TGS may be its slow fermentation along the hindgut as indicated by the residual starch excreted in faeces, nourishing the epithelium in the distal colon–rectum region with straight-chain fatty acids(Reference McKenzie, Tan and Macia4). Concurrently, the negative impact of protein fermentation (e.g. via ammonia, amines, phenols and sulphides) on the functioning and integrity of colonic epithelium(Reference Windey, De Preter and Verbeke47, Reference Yao, Muir and Gibson48) may have been reduced in TGS- v. CON-fed pigs as indicated by the lower molar proportions of branched-chain fatty acids and hindgut disappearance of protein with the TGS diet.
Several scenarios may explain the increased flow of Ca and P into the large intestine with the TGS diet. It is probable that TGS has greater mineral-chelating abilities than the waxy maize starch used as control, or that a higher digesta viscosity with TGS reduced the absorption of Ca and P until the ileum. A shorter retention in the stomach of TGS-fed pigs together with a high buffering capacity of the diet (casein and minerals) may have impaired a proper dissociation into Ca2+ and PO43- ions in the gastric content, thereby lowering their absorption in the small intestine. It may be also speculated whether bacterial incorporation(Reference Metzler, Mosenthin and Baumgärtel14) contributed to a greater flow of Ca and P in ileal digesta and faeces of TGS-fed pigs as these minerals are essential co-factors and constituents in bacterial cells. In line with that, relevance networks indicated the importance of faecal Ca for acetate and that of P for acetate and butyrate, possibly indicating bacterial mineral needs for fermentation(Reference Metzler and Mosenthin49). If similar effects on intestinal mineral absorption are observed with lower and more reasonable dietary inclusion levels of TGS (e.g. 5 %), this may require extra supplementation of diets with Ca and P. In this line, it would be also valuable to evaluate whether TGS impacts the dietary availability of other macro- and trace elements.
In conclusion, the present results showed that the consumption of TGS caused distinct bacterial composition and metabolite profiles in ileal digesta and faeces, which were modulated by the type of starch, intestinal starch flow and faster transit of digesta in the stomach and small intestine. Relevance networks indicated that Klebsiella in ileal digesta may have benefitted from the reduced retention of digesta in the stomach. Data integration analysis further suggested dependencies between faecal nutrient (starch) availability, promotion of Coriobacteriaceae, Collinsella, Blautia and Megasphaera and increase in SCFA, especially acetate and butyrate. Taken together, the consumption of TGS showed certain benefits for the host health, such as increased faecal bulk and carbohydrate fermentation in the distal hindgut. However, its stimulation of certain bacterial taxa that were previously linked to inflammatory diseases (e.g. Klebsiella and Coriobactericeae) needs to be meticulously tested using lower dietary inclusion levels in animal models and human volunteers.
Acknowledgements
We thank Arife Sener, Suchitra Sharma, Anita Dockner and Melanie Wild (Institute of Animal Nutrition and Functional Plant Compounds) for their technical assistance. Christian Knecht and Elena Sassu (University Clinic for Swine) are thanked for their assistance during surgery. Timea Molnar-Wegerth is thanked for assistance with starch provision and analysis (Agrana Research & Innovation Center GmbH). We further thank Agromed Austria GmbH for providing the cellulose (FibroCell® M1) to be incorporated into the diets.
This work was supported by the Austrian Research Promotion Agency (FFG) (BRIDGE project no. 836447 – ‘Healthy Carbohydrates’).
B. U. M.-Z., D. G. and Q. Z. designed the research; B. U. M.-Z. and M. A. N. conducted the research; W. K. performed passage rate marker analysis; B. U. M.-Z. and M. A. N. performed bioinformatics with QIIME; B. U. M.-Z. performed data analysis in R and SAS; B. U. M.-Z. wrote the paper; and B. U. M.-Z. had primary responsibility for the final content. All authors read and approved the final manuscript.
Agrana Research & Innovation Center GmbH provided support in the form of salary to author D.G., but did not have any additional role in the study design, data collection and analysis, decision to publish or preparation of the manuscript.
Supplementary material
To view supplementary material for this article, please visit https://doi.org/10.1017/S0007114519000849