
INTRODUCTION
There are long held assumptions in both archaeology and history surrounding elite diets in early medieval England, namely that higher status individuals had a more meat-heavy and therefore protein-rich diet than the lower classes, and that this was especially true for males over females.Footnote 1 So closely held are these assumptions that it is commonplace for bioarchaeological studies to actively seek out social differences in diet, comparing variables like numbers and kinds of grave goods with dietary signatures from skeletal remains. These studies have never found biologically meaningful correlations at a cemetery or regional level,Footnote 2 yet the assumptions remain pervasive.Footnote 3 To the extent that they are underpinned by evidence, it is not archaeological but textual.
This textual evidence takes the form of a series of lists of foodstuffs written between the late seventh and tenth centuries. Most of these have traditionally been interpreted as part of a system of ‘food rents’ or ‘food renders’ (also sometimes known by the Old English term feorm), and understood to detail the payments in kind that peasants owed first to kings and later also to non-royal landlords. Since the nineteenth century it has been assumed that these renders were collected regularly by royal households and comprised most of their meals, and that they contributed substantially to the diets of other members of the elite who had been endowed with the right to receive local royal revenues. Ann Hagen summarises the arrangement as follows:
The holder of large estates could expect to receive a quantity of food, including prestigious items, without working on its production himself. The only food-getting activities the lord was likely to engage in were recreational pursuits … Food was an important component, if not the most important, of the king’s revenue. All lands in the realm unless specifically exempted had to contribute food to the king. The unit was the farm of one night, that is the food and drink necessary to support the king and his court for one day … The king, or landowner, went round to his estates in turn with his retinue eating up the provisions gathered for him. He would stay in the main dwelling to which corn, provisions, cattle, and dairy produce were sent from the collecting centres …Footnote 4
As we argue in the companion piece to this article, these assumptions must be questioned. We contend that our food lists and documentary allusions to feorm do not refer to renders of general-purpose food supplies used to sustain elite households. The quantities and proportions of different foodstuffs in these texts, and often their contexts, suggest that they are lists of supplies for large and symbolically significant communal feasts.Footnote 5 This conclusion is reinforced in this article, where we demonstrate that these food lists cannot be representative of elite diets because their exceptionally high proportion of animal products is inconsistent with the bioarchaeological evidence, primarily isotopic data. It instead shows that diets were more similar (isotopically) across social groups than previously thought. Most people in pre-Viking Age England ate only low to moderate amounts of animal protein, and there is nothing to suggest that those who consumed more were of higher status. Such dietary variations should be understood to result from differences in environment and agriculture between regions and larger scale chronological changes to foodways.
Assumptions around wealth and social status, and the number and kinds of grave goods are readily made in archaeology; and certain styles of female dress accessories are often taken to be ethnic signifiers.Footnote 6 Chris Scull highlights that one of the clearest forms of archaeological evidence for social structure in the fifth to seventh centuries is mortuary ritual, and that the graves of early medieval individuals clearly show socioeconomic hierarchy and inequality.Footnote 7 There are of course complexities in drawing social inferences from funerary archaeology, the largest of which is ‘the dead don’t bury themselves’ followed closely by the incompleteness of the archaeological record; however, funerary deposits were clearly socially governed and are a useful tool in investigating how living communities operated, more so than settlement archaeology for this period.Footnote 8 The early documentary evidence (principally law codes from seventh-century Kent and Wessex and narrative works from eighth-century Northumbria) suggests a ranked society with slaves at the bottom, a free peasant muiajority, and an increasingly entrenched noble class associated with service to the king.Footnote 9 This picture is broadly consistent with that of funerary archaeology until the late sixth and seventh centuries, when furnished burial declines and clear status identifiers are lost.Footnote 10
In the post-Roman period furnished burial was the norm from the fifth to seventh centuries, not just in England, but generally across much of Western Europe.Footnote 11 Ignoring here fifth-century cremation burials due to the challenges they pose for osteology and isotopic analyses,Footnote 12 generally, both furnished and unfurnished burials were common in England up to the late seventh and early eighth centuries. Inhumations of this period are highly varied in practice with numbers and kinds of grave goods, orientation, grave furniture, body position and other variables all part of a mutable and dynamic process of death.Footnote 13 Grave goods, when present, are often highly gendered, and suggest levels of social stratification, which fluctuate in meaning through time.Footnote 14 However, this seems to peter out in the seventh and eighth centuries and in England, at least, this coincides with the shift towards churchyard burials which are more tightly regulated, and most importantly, unfurnished and difficult to date.Footnote 15 This means that beyond the mid-to-late-seventh and early eighth centuries determining social status through the funerary record is exceedingly difficult. Therefore, we refrain here from examining closely diet or social status beyond the use of furnished burial aside from broader chronological comparisons. However, dating issues with some sites mean that some later unfurnished individuals are likely to be present in the sample here and are discussed in more detail in analyses below.
As mentioned above, Banham, Franzten, Gautier and Hagen’s work (amongst others) on early medieval agriculture and food has suggested that types and quality of food and drink varied with social status and gender roles; most notably that women and younger children were more likely to be hardest hit by food shortages, and there seems to be social precedence for being served at feasts and special occasions, but the assumption of a meat- and alcohol-heavy elite diet is still pervasive.Footnote 16 As Alban Gautier puts it ‘… there were those who had access to the “permanent feast” and those who did not … So, the poor did not eat like the rich, the weak did not drink like the powerful’.Footnote 17
Hence here we analyse the data both in terms of sex and funerary treatment to attempt to tease these variables apart and test these assumptions. We largely remove children from the equation due to issues over the osteological paradox and isotopic complications introduced by studying deceased juveniles.Footnote 18
Previous isotopic studies of diet for the period have primarily been site or region specific.Footnote 19 Whilst some studies actively hunt for variation in the isotopic evidence and find social differentiation in diet,Footnote 20 larger multi-site studies have noted a distinct lack of social differentiation in diet from the fifth to the eighth centuries.Footnote 21 Certainly there is a high degree of regional variation in diets and isotopic baselines,Footnote 22 and we should not assume isotopic homogeneity across ‘England’ during a highly dynamic period. However, nor should we actively hunt for variation which may be biologically or socially meaningless as it is a ‘statistical sin’.Footnote 23 This study will redress that balance by using an Exploratory Data Analysis approach, and analysing the data at various scales, constraining assumptions within the historical evidence analysed above.Footnote 24
What is even more elusive are isotopic studies on definitively ‘royal’ or ‘noble’ individuals from this period. Whilst ‘princely’ graves like those at Sutton Hoo, Prittlewell and Benty Grange are likely candidates for such individuals, no skeletal remains survive to analyse.Footnote 25 The phenomena of bed burials may be marking out high status women in a special and short-lived way in the seventh century, and whilst these burials are rarely richly furnished in the number of grave goods, their burial on a bed often with select, highly valuable items (like the gold and garnet cross with Grave 1 at Trumpington Meadows) may denote their royal and Christian connections.Footnote 26 More skeletons survive from bed burials than they do from ‘princely’ graves (seven of the fourteen confirmed bed burials have some bone surviving), and four of them have been analysed isotopically, with their data included here.Footnote 27 They do not stand out in our dietary analyses, but more work on these fascinating graves is forthcoming. There has also been recent radiocarbon dating and ancient DNA work (and presumably accompanying isotopic analyses) on the funerary chests in Winchester Cathedral, believed to be the remains of late-Saxon and Anglo-Norman royalty, including: Cynegils of Wessex, Bishop Wini, Cynewulf of Wessex, Egbert of Wessex, Æthelwulf of Wessex, Eadred of Wessex, Emma of Normandy, Edmund Ironside, Cnut the Great, Bishop Ælfwyn and William (II) Rufus, and additional unexpected individuals thought to be other members of the royal family of Wessex.Footnote 28 Sadly these results are yet to be fully published, but could give definite answers about what English rulers were eating and drinking, and if their diet changed much between the seventh and twelfth centuries.
This article will first tackle dietary evidence and social status from across early medieval England as a whole and then look specifically at cemeteries from Wessex to minimise the impact of regional variation on the data.
BACKGROUND
‘Food renders’ and elite consumption
We point readers to the companion article to this one for a more in-depth discussion on our assessment of the food list texts and their context;Footnote 29 however, it is useful here to discuss the calculations and assumptions carried through into the analysis of the isotopic data below. This is clause 70.1 of the laws of King Ine of Wessex (r. 688 –726): ‘From ten hides as fostre: ten fata of honey, 300 loaves, twelve ambra of Welsh ale, thirty of clear ale, two full-grown cattle or ten wethers, ten geese, twenty hens, ten cheeses, an amber full of butter, five salmon, twenty pundwæge of fodder and 100 eels’.Footnote 30 We estimated the volume, weight, and calorie content of each of the food stuffs listed here, and in the handful of broadly comparable lists, using a range of historical and zooarchaeological evidence in conjunction with information on modern livestock and the nutritional composition of foods. Our calculations suggest that the foods listed by Ine were disproportionately skewed towards animal products. A ‘loaf’ in this context is likely to mean a small round bun, an individual portion at most and highly unlikely to weigh more than the 300 grams we have assumed. For each such loaf, Ine’s list includes 1.2 kg of meat, fish, and cheese, as well as approximately 2.1 litres of ale. A remarkable fifty-five per cent of the list’s total calories derive from animal products, and if (as is likely) each loaf represents a single imagined diner, an individual meal was 4,140 kcal. None of these figures can be relied on precisely, of course, but the estimates underlying them have robust bases for the bread and livestock, where it matters most. The impression they provide of the scale and proportions of the foods demanded can be trusted.Footnote 31 Moreover, as we show, the scale and proportions of Ine’s list is broadly consistent with those of the food lists contained in a range of other texts, dating from the late eighth to the late tenth centuries, from Gloucestershire, Kent, and Hertfordshire, which hail from royal and ecclesiastical contexts.Footnote 32 These similarities have long been noted and have sometimes been assumed to reflect a degree of institutional continuity, with ecclesiastical food renders representing privatised versions of the king’s ‘farm of one night’.Footnote 33 Our contention is that this is a misunderstanding and that these food lists have similar proportions because they are all lists of provisions for a specific sort of meal, a lavish feast typically involving several hundred guests. These were not the lists of general-purpose food supplies that the literature has widely assumed them to be. Rather, they constituted feasting food for special occasions with implications for community building and politics. This is not to downplay the key economic role of food and animals, especially cattle, in early medieval England – far from it. However, as we demonstrate below, the easy assumption that these texts provide evidence for what day-to-day meals looked like for elite households must be rejected, as the direct evidence from skeletons shows.
Stable isotope background
Light stable isotope analysis has become a regularly used technique in archaeological science to help answer questions surrounding diet and mobility in the past. Carbon and nitrogen stable isotope analysis for dietary reconstruction in archaeological contexts is a well-established methodology which is based on the principle that different foods differ in their isotopic compositions and that these can be quantified in the foods themselves and in the tissues of consumers. The core premise is ‘you are what you eat (and drink)’ plus or minus a few permille (‰).Footnote 34 The foods and beverages you consume are incorporated into your bodily tissues and thus a chemical signature of diet for the period that tissue was formed is preserved. Different tissues remodel at different rates, giving archaeologists different windows into diet across an individual’s life if samples are chosen wisely. Bones preserve a much longer isotopic average of the food consumed for an individual, with long bones such as femurs estimated to have a turnover rate of several decades, whilst ribs represent approximately up to one decade before death. Dentine from tooth roots has tighter constraints, with dentine not remodelling once formed; so for third molars (wisdom teeth) for instance the roots start forming at approximately twelve to sixteen years old and finish between eighteen to twenty-five years, and so represent consumption during adolescence and early adulthood, whereas a permanent (adult) first molar crown begins forming at birth, with roots capturing dietary signatures from two-and-a-half to ten years old.Footnote 35
Isotopic composition in the biosphere is highly variable and is affected by a variety of different processes depending on the element in question.Footnote 36 Isotope fractionation is the term that describes these processes which cause the relative abundance of difference in isotopes between substances, or the partitioning of the heavier and lighter isotopes.Footnote 37 The ratios of 13C/12C and 15N/14N in the environment and the food chain are therefore changeable and depend on many different variables. These natural variations in isotope ratios in the ecosystem form the basis of isotope analysis in archaeology and ecology, as measurable differences can be associated with human/animal behaviours.
Plants are the base of most terrestrial food chains and the isotopic variation in them will be passed on to consumers, be they herbivores or humans.Footnote 38
Carbon in plant tissues is a product of photosynthesis where atmospheric carbon dioxide is turned into oxygen (expelled) and glucose (stored for the plant to use), and isotopic fractionation occurs during this process.Footnote 39
There are three photosynthetic pathways – C3, C4 and CAM – each fixes carbon in a different way which results in 13C value differences between plant types.Footnote 40
As this study focuses on early medieval England, only C3 (most cereals and vegetables) and C4 plants are of interest here (CAM plants being desert species such as cacti and succulents). Millet, sago and amaranth are the only known C4 plants to be consumed in Continental Europe in the early Middle Ages, but were not known in Britain until the later Middle Ages.Footnote 41
C3 plants have a possible $ \delta $
13C range of between –38 to –22‰, and C4 plants between –21 to –9‰, when analysed as a whole plant, with some variation between species and plant tissues.Footnote 42
Therefore when we find relatively elevated
$ \delta $
13C range of between –38 to –22‰, and C4 plants between –21 to –9‰, when analysed as a whole plant, with some variation between species and plant tissues.Footnote 42
Therefore when we find relatively elevated $ \delta $
13Ccoll values in early medieval England, a possible interpretation could be that these individuals were migrants from regions where C4 plants were consumed (e.g. Croatia or Italy).Footnote 43
However, a more plausible explanation in this context, as we explain below, is marine resource consumption.
$ \delta $
13Ccoll values in early medieval England, a possible interpretation could be that these individuals were migrants from regions where C4 plants were consumed (e.g. Croatia or Italy).Footnote 43
However, a more plausible explanation in this context, as we explain below, is marine resource consumption.
Diversity in aquatic plants and extended food webs in both freshwater and marine ecosystems means that isotopic signatures of plants and animals in these environments are highly variable with large intra- and inter-species variations observed, particularly in freshwater fish.Footnote 44
Carbon isotopic signatures in these ecosystems are particularly complex. This complexity is highlighted by the high degree of overlap between freshwater fish bone collagen $ \delta $
13C and
$ \delta $
13C and $ \delta $
15N values and those of terrestrial and marine species.Footnote 45
$ \delta $
15N values and those of terrestrial and marine species.Footnote 45
Marine $ \delta $
13C values are higher in comparison with terrestrial environments due to their long and complex food chains and carbon reservoir effect. This means they are easily isotopically distinguished in the tissues of producers and consumers.Footnote 46
However, there is an interpretational problem due to the overlap between
$ \delta $
13C values are higher in comparison with terrestrial environments due to their long and complex food chains and carbon reservoir effect. This means they are easily isotopically distinguished in the tissues of producers and consumers.Footnote 46
However, there is an interpretational problem due to the overlap between $ \delta $
13C values of C4 consumers, marine consumers, and consumers of mixed plant or terrestrial/marine diets.Footnote 47
Therefore isotopically separating these consumption patterns is extremely difficult without good baseline evidence or other contextual dietary information (archaeological or historical) to constrain interpretations.
$ \delta $
13C values of C4 consumers, marine consumers, and consumers of mixed plant or terrestrial/marine diets.Footnote 47
Therefore isotopically separating these consumption patterns is extremely difficult without good baseline evidence or other contextual dietary information (archaeological or historical) to constrain interpretations.
Many of the causes of $ \delta $
15N variation in nature are the same as
$ \delta $
15N variation in nature are the same as $ \delta $
13C described above – water availability, heat, the canopy effect etc. Differences in ecosystems are as apparent in
$ \delta $
13C described above – water availability, heat, the canopy effect etc. Differences in ecosystems are as apparent in $ \delta $
15N values as they are in
$ \delta $
15N values as they are in $ \delta $
13C, aiding in the distinction between terrestrial and marine resource consumption. In animal tissues
$ \delta $
13C, aiding in the distinction between terrestrial and marine resource consumption. In animal tissues $ \delta $
15N increases stepwise up the food chain so that carnivores have higher values than omnivores and omnivores higher than herbivores, with each step called a ‘trophic level’, with
$ \delta $
15N increases stepwise up the food chain so that carnivores have higher values than omnivores and omnivores higher than herbivores, with each step called a ‘trophic level’, with $ \delta $
15N assumed to increase between 3–5‰ between each level.Footnote 48
$ \delta $
15N assumed to increase between 3–5‰ between each level.Footnote 48
Terrestrial plants assimilate nitrogen from decaying organic matter and the atmosphere via two pathways – direct nitrogen (N2) fixation, and assimilation with help from soil microbes or commensal microbes living in the plant’s roots (e.g. legumes).Footnote 49
The differences in these pathways causes fractionation giving direct nitrogen fixers $ \delta $
15N values similar to atmospheric values (0‰).Footnote 50
Whereas nitrogen assimilators (non-fixers), the majority of terrestrial plants, have
$ \delta $
15N values similar to atmospheric values (0‰).Footnote 50
Whereas nitrogen assimilators (non-fixers), the majority of terrestrial plants, have $ \delta $
15N values ranging from 2–10‰ due to variation in soil isotopic values which can be altered through processes such as manuring or water logging.Footnote 51
$ \delta $
15N values ranging from 2–10‰ due to variation in soil isotopic values which can be altered through processes such as manuring or water logging.Footnote 51
In marine ecosystems nitrogen is fixed by both algae and phytoplankton and can also enter food chains from decomposing organic matter in the oceans.Footnote 52
The main cause of denitrification in marine systems is from water evaporation, which favours the lighter isotope, leaving these ecosystems isotopically enriched in 15N. This evapo-concentration combined with the longer marine food chains described above, leads to marine organisms having higher $ \delta $
15N values compared to their terrestrial counterparts.Footnote 53
Long aquatic food chains are also the main driving factor for freshwater 15N enrichment, as mentioned above with carbon in these ecosystems.Footnote 54
$ \delta $
15N values compared to their terrestrial counterparts.Footnote 53
Long aquatic food chains are also the main driving factor for freshwater 15N enrichment, as mentioned above with carbon in these ecosystems.Footnote 54
Another important factor to consider with nitrogen, especially in humans, is nitrogen balance. It is the equilibrium in our bodies between protein intake (from diet) and loss (through metabolism and excretion). If this equilibrium is thrown out then the body might start to self-metabolise, breaking down its own tissues for fuel. This balance between energy intake and expenditure can be disturbed by illness or nutritional stress causing isotopic changes in bodily tissues. Research also suggests that in otherwise healthy individuals, lactation, pregnancy and growth during puberty where the energy demands of the body exceed dietary input, likely cause isotopic changes similar to periods of illness.Footnote 55
The impact of stress on $ \delta $
15N values is exemplified by work on Irish famine populations where a ‘stress bubble’ can be seen in incremental dentine slices of people who survived the famine.Footnote 56
Nutritional stress and breastfeeding are therefore also isotopically visible in tissues of mothers and infants, making early life health events traceable using this methodology.Footnote 57
$ \delta $
15N values is exemplified by work on Irish famine populations where a ‘stress bubble’ can be seen in incremental dentine slices of people who survived the famine.Footnote 56
Nutritional stress and breastfeeding are therefore also isotopically visible in tissues of mothers and infants, making early life health events traceable using this methodology.Footnote 57
When there is not sufficient protein in someone’s diet (either through starvation or by choice, e.g., veganism) the body routes carbon from whole diet (carbohydrates, lipids and any residual protein from plants) into collagen which is usually skewed towards protein intake. So, whilst no ‘stress bubble’ is seen in $ \delta $
13C values,
$ \delta $
13C values, $ \delta $
15N values will appear low, and this re-routing can impact interpretations of isotopic values. Conversely, the more protein there is in the diet, the more carbon will be sourced from that portion of the diet.Footnote 58
Therefore modern veganism is isotopically identifiable in
$ \delta $
15N values will appear low, and this re-routing can impact interpretations of isotopic values. Conversely, the more protein there is in the diet, the more carbon will be sourced from that portion of the diet.Footnote 58
Therefore modern veganism is isotopically identifiable in $ \delta $
15N values and looks like other herbivorous mammals. Controlled dietary studies show significant differences between people with no animal protein intake compared with those who have various levels of omnivory (whether it be secondary animal products like milk, cheese or eggs, or meat).Footnote 59
$ \delta $
15N values and looks like other herbivorous mammals. Controlled dietary studies show significant differences between people with no animal protein intake compared with those who have various levels of omnivory (whether it be secondary animal products like milk, cheese or eggs, or meat).Footnote 59
Other bioarchaeological evidence
For our purposes, the great benefit of stable isotope analysis is that, despite the range of possible confounding factors, it can yield insights into the relative significance of different foodstuffs within early medieval diets. There are of course other forms of bioarchaeological evidence for diet which can enrich our understanding of foodway economics in early medieval England by providing finer-grained detail on the types of food that were eaten, even if it is more difficult to bring them to bear on questions about their overall significance in ordinary diets. These include zooarchaeology, archaeobotany, biomolecular studies of residues in pottery (lipids and proteins) and dental calculus (calcified dental plaque/tartar which can be studied in a variety of ways to look at what food has been preserved within it – light microscopy to identify visibly distinctive food remnants, isotope analysis, lipids, proteomics, and DNA). Pottery residues and dental calculus work are rapidly evolving and as yet have limited usage in the early medieval period.
The majority of the zooarchaeological literature on our period is focused on East Anglia due to the extraordinary excavations at West Stow, however there are multitudes of site-specific studies on early medieval animal bones in site reports and grey literature from commercial archaeology with recent efforts attempting some synthesis.Footnote 60 Recent studies suggest that with Romanisation in Britain came animal ‘improvement’ (enlargement for meat) for major domesticates such as sheep, cattle and pigs, but with the collapse of control in the fringes of the Empire these larger meat-heavy animals and an emphasis on these kinds of animal surplus for meat seem to have disappeared in fifth-century Britain.Footnote 61 Kill patterns (age and sex of butchered animals), animal pathologies (e.g. foot bone disease from use as traction animals) and butchery marks on bones also give insight into animal husbandry practices, meat cuts and processing of animals for other secondary products.Footnote 62 Zooarchaeologists have suggested that in the post-Roman period domestic livestock were killed predominantly as either part of herd management (e.g. killing younger males earlier in life so as to keep females for dairy and breeding) or later in life after their utility for traction, breeding or secondary products like dairy or wool was at an end, rather than the meat-heavy emphasis of the Roman period.Footnote 63 Recent work from Zoe Knapp on the high-status site of Lyminge in Kent shows feasting layers rich in red meat which changes over time with Christianisation to a larger emphasis on chickens and fish, which she related back to the laws of Wihtred of Kent which imposes fines for those found to be eating meat during fasting periods.Footnote 64 Knapp’s identification of feasting deposits, distinct from other midden material, implies that consumption of pigs, sheep/goat and cattle, whilst consumed in higher quantities at Lyminge, may have been reserved for distinctive special feasting events rather than regular day-to-day consumption, and that what was acceptable or in fashion to consume at feasts changed throughout the early medieval period. This suggests that meat from livestock was not a regular occurrence, even at high-status sites.
The archaeobotany of early medieval England suggests that there were indeed shifts in agriculture from the Roman period into the fifth and sixth centuries; however, the major agricultural transitions occurred in the seventh and eighth centuries onwards.Footnote 65
The shifts are in the species and cultivars of cereal crops grown, and their relative proportions to one another, as well as changes in plough technology and therefore the kinds of soils cultivated. It appears some of these changes in how cereals were grown may have impacted the crop isotopic values, namely by enriching $ \delta $
15N values due to fertilisation and/or physiological stress from non-ideal soil conditions. Therefore, these agricultural transitions may have impacted
$ \delta $
15N values due to fertilisation and/or physiological stress from non-ideal soil conditions. Therefore, these agricultural transitions may have impacted $ \delta $
15N values up the food chain passing 15N enrichment onto human consumers making them look like they were eating more protein when in fact the whole food chain has been enriched.Footnote 66
A full exploration of this is forthcoming and outside the scope of this article but poses interesting questions about dietary shifts in the later part of the early medieval period in England.
$ \delta $
15N values up the food chain passing 15N enrichment onto human consumers making them look like they were eating more protein when in fact the whole food chain has been enriched.Footnote 66
A full exploration of this is forthcoming and outside the scope of this article but poses interesting questions about dietary shifts in the later part of the early medieval period in England.
Other biomolecular approaches such as genomics, proteomics, metabolomics, and lipid residue analyses can also shed light on early medieval diets, and these techniques are showing great promise but remain underutilised for our period, with specialists primarily focussing on prehistoric contexts. Genetics studies in particular are still very much intent on human population studies and hunting down pathogens rather than what plants and animals are left behind in peoples’ fossilised food.Footnote 67 There has been interesting work on medieval dental calculus in the past few years, but these studies are few and far between, and tend towards the exceptional rather than every day.Footnote 68 New work on dental calculus from early medieval cemeteries in Cambridgeshire may indicate social differentiation in diet through the species meat and dairy are sourced from but these results are not yet published, and more work needs to be done.Footnote 69
The handful of studies on early medieval pottery and other cooking residues have demonstrated that foodways may indeed shift across the first millennium AD, and certainly after the Norman Conquest, with a homogenising of dietary signatures related to marketisation.Footnote 70 Sherds from pre-Conquest Oxford pottery shows vessels were used for cooking beef, lamb and possibly also goat, with some limited dairy processing, but this shifted in the post-Conquest period away from dairy, as pork and chicken meat processing became predominant. In both periods these vessels also showed plant biomarkers, with leafy greens such as brassicas being particularly clear in the residues. Similarly, residue analyses from West Cotton Raunds (c. 950–1450 AD) show specialisation in pottery types for certain kinds of food processing and storage, with evidence for animal meat consumption in the forms of stews or pottages, dairy processing, some porcine fats, mixing of animal products and plants in cookery and even some honey/beeswax signatures.Footnote 71 However, the picture is largely of meat and carcass fats being cooked with dairy as an additional or supplemental protein depending on social status reflected in the type of site and pottery styles. These studies are several centuries later than our period of focus here, however they also rely on these long-held assumptions of a meat-focussed diet, particularly for elites, with the protein of choice changing in post-Conquest England (i.e. pork).
However, some exciting new work has very recently been done on c. fifth-to-seventh-century ‘roasting pits’ in Suffolk. Residue analysis on burnt stones from these pits implies they were used for cooking whole ruminant animals (cattle, sheep, or goats but not horses or pigs), and the archaeological evidence in and around these structures suggest they were used for periodic feasting events.Footnote 72 This in combination with the zooarchaeological evidence for feasting, and perhaps less regular daily consumption of meat adds further weight to our argument and supports the isotopic evidence explored below.
MATERIALS AND METHODS
The data used to explore social status and diet here are pulled from the datasets collated in the 2021 research article by Leggett et al, ‘Multi-Tissue and Multi-Isotope ( $ \delta $
13C,
$ \delta $
13C, $ \delta $
15N,
$ \delta $
15N, $ \delta $
18O and 87/86Sr) Data for Early Medieval Human and Animal Palaeoecology’.Footnote 73
Those databases consist of 8,910 isotopic data points for human and animal diet and mobility in the first millennium AD from across western Europe. Here we have used a subset of that data consisting of bone collagen data from early medieval England and the associated contextual information including osteological sex, grave goods and chronological designations for those burials which is also available within the datasets.Footnote 74
$ \delta $
18O and 87/86Sr) Data for Early Medieval Human and Animal Palaeoecology’.Footnote 73
Those databases consist of 8,910 isotopic data points for human and animal diet and mobility in the first millennium AD from across western Europe. Here we have used a subset of that data consisting of bone collagen data from early medieval England and the associated contextual information including osteological sex, grave goods and chronological designations for those burials which is also available within the datasets.Footnote 74
Statistical analyses and graphics were conducted using Free and Open-Source R version 4.0.4 and Rstudio version 1.4.1106.Footnote 75
The code is freely available as part of the supplementary material and data available as part of the article, ‘Multi-Tissue and Multi-Isotope ( $ \delta $
13C,
$ \delta $
13C, $ \delta $
15N,
$ \delta $
15N, $ \delta $
18O and 87/86Sr) Data’.Footnote 76
For DetectingDeviatingCells (DDC) analysis the data had to be re-organised for the package algorithm and the spreadsheet is available in the supplementary material. For further details on DDC analysis see below in the regional specific analysis for Wessex.
$ \delta $
18O and 87/86Sr) Data’.Footnote 76
For DetectingDeviatingCells (DDC) analysis the data had to be re-organised for the package algorithm and the spreadsheet is available in the supplementary material. For further details on DDC analysis see below in the regional specific analysis for Wessex.
We investigated links between diet, social status, and funerary practices by looking for correlations between several funerary variables with possible relevance to social status (number of grave goods, number of foreign grave goods, body position and grave orientation) and dietary signatures as measured from bone collagen $ \delta $
13Ccoll and
$ \delta $
13Ccoll and $ \delta $
15Ncoll values. Some funerary variables were not analyzed here but are included in the databases. For instance, interment style had too many variants that are not easily standardised for visualisation or statistical analyses. Number of grave goods is a rough measure of wealth and status, so too are the number of foreign grave goods as their rarity in graves and having the means to obtain items from overseas (or bring them with you) could be an additional signifier of status.Footnote 77
Grave orientation and body position become standardised over time with earlier variability linked to social status and religious practices, so differences in diet and cultural change are tentatively investigated through these variables.Footnote 78
$ \delta $
15Ncoll values. Some funerary variables were not analyzed here but are included in the databases. For instance, interment style had too many variants that are not easily standardised for visualisation or statistical analyses. Number of grave goods is a rough measure of wealth and status, so too are the number of foreign grave goods as their rarity in graves and having the means to obtain items from overseas (or bring them with you) could be an additional signifier of status.Footnote 77
Grave orientation and body position become standardised over time with earlier variability linked to social status and religious practices, so differences in diet and cultural change are tentatively investigated through these variables.Footnote 78
First this was done using bone at a whole England level from the Roman through to the Anglo-Norman period (n = 2023, fig. 1), with individuals coloured on plots by broad period to make broad chronological patterns in both diet and funerary treatment more readily discernible. Figs 1–4 highlight these larger chronological trends in both funerary and dietary change in England in the first millennium AD. We then focused more tightly on gender and number of grave goods for adult burials dating roughly from the fifth to the eighth century AD (n = 1463, fig. 5 and fig. 6), both because this is the period during which the prevalence of grave goods gives us the most information on the social status of individual burials and because it predates the shift towards greater use of marine resources associated with the arrival of Scandinavian migrants. To further reduce the noise in the data, we then analyse adult diet in Wessex (n = 321) to compare contemporary and regionally appropriate adult burials more directly with the royal food render specified in the Laws of Ine (figs 7 and 8), and end with DDC analysis of both adult and juvenile data from Wessex (n = 517) to look for overall outliers in the region (fig. 9).
Scatterplots of human bone $ \unicode{x03B4} $
13Ccoll and
$ \unicode{x03B4} $
13Ccoll and $ \unicode{x03B4} $
15Ncoll values from England by number of grave goods, coloured by period.
$ \unicode{x03B4} $
15Ncoll values from England by number of grave goods, coloured by period.

Scatterplots of human bone $ \unicode{x03B4} $
13Ccoll and
$ \unicode{x03B4} $
13Ccoll and $ \unicode{x03B4} $
15Ncoll values by number of ‘foreign’ grave goods, coloured by period.
$ \unicode{x03B4} $
15Ncoll values by number of ‘foreign’ grave goods, coloured by period.

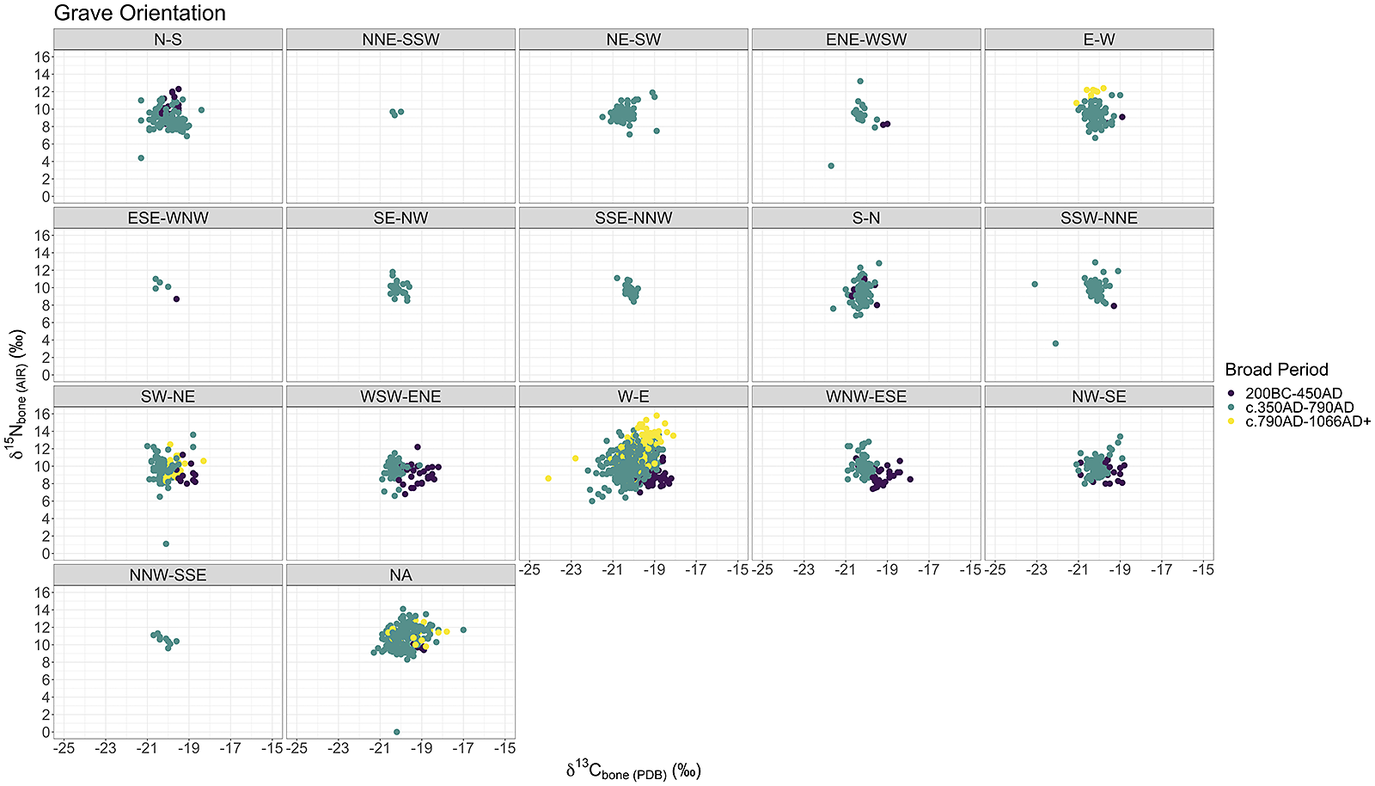
Scatterplots of human bone $ \unicode{x03B4} $
13Ccoll and
$ \unicode{x03B4} $
13Ccoll and $ \unicode{x03B4} $
15Ncoll values by grave orientation, coloured by period.
$ \unicode{x03B4} $
15Ncoll values by grave orientation, coloured by period.
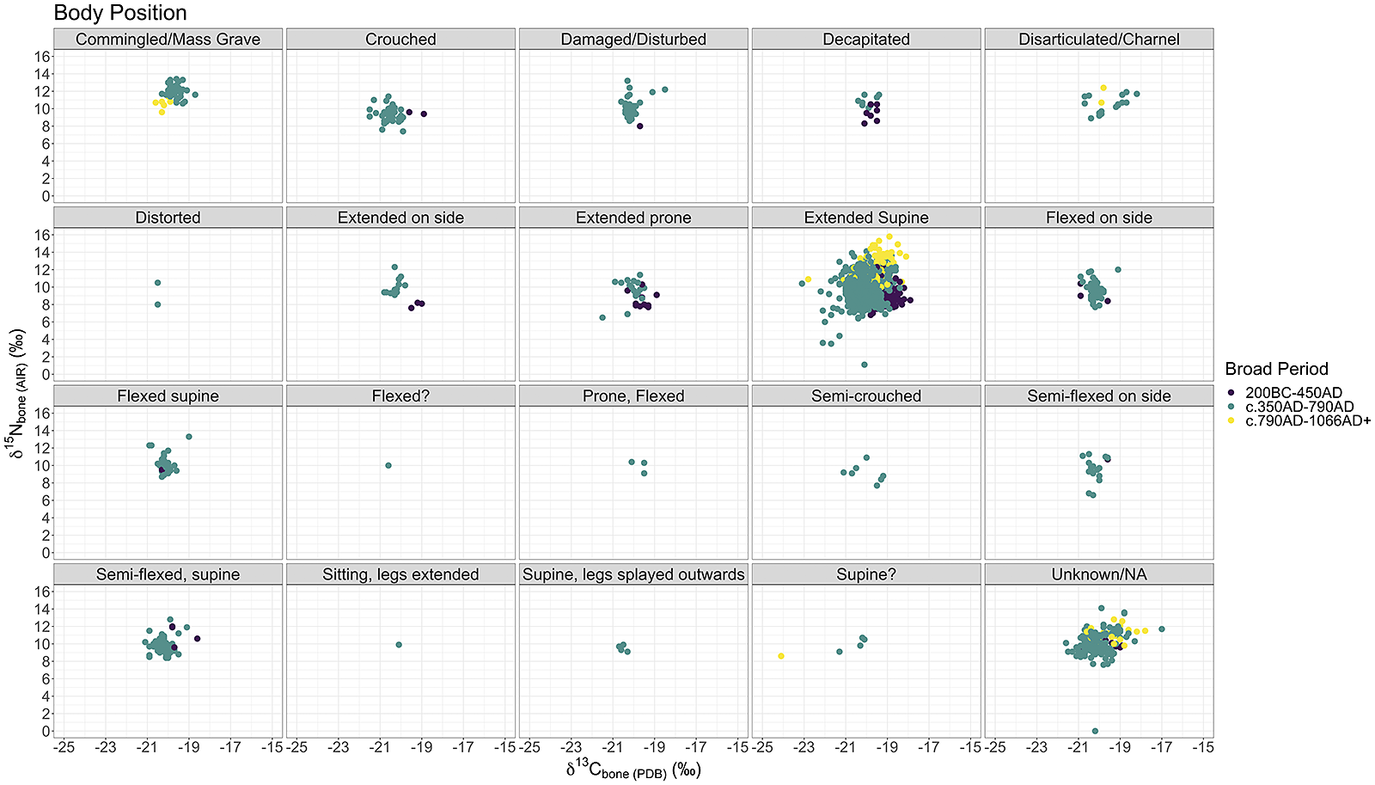
Scatterplots of human bone $ \unicode{x03B4} $
13Ccoll and
$ \unicode{x03B4} $
13Ccoll and $ \unicode{x03B4} $
15Ncoll values by body position, coloured by period.
$ \unicode{x03B4} $
15Ncoll values by body position, coloured by period.
Scatterplot with marginal boxplots of bone $ \unicode{x03B4} $
13Ccoll and
$ \unicode{x03B4} $
13Ccoll and $ \unicode{x03B4} $
15Ncoll values of c. fifth-to-eighth century individuals in England with animal base lines as labelled horizontal lines.
$ \unicode{x03B4} $
15Ncoll values of c. fifth-to-eighth century individuals in England with animal base lines as labelled horizontal lines.

Violin plot of bone $ \unicode{x03B4} $
15Ncoll values of c. fifth-to-eighth century individuals in England, animal base lines top-bottom: marine fish, freshwater fish, domestic cats and dogs, domestic fowl, domestic pigs, domestic herbivores (cattle, sheep/goats), and wild herbivores as per Figure 5 above.
$ \unicode{x03B4} $
15Ncoll values of c. fifth-to-eighth century individuals in England, animal base lines top-bottom: marine fish, freshwater fish, domestic cats and dogs, domestic fowl, domestic pigs, domestic herbivores (cattle, sheep/goats), and wild herbivores as per Figure 5 above.

Scatterplot of bone $ \unicode{x03B4} $
13Ccoll and
$ \unicode{x03B4} $
13Ccoll and $ \unicode{x03B4} $
15Ncoll of c. fifth-to-eighth century individuals in the region of Wessex with animal base lines as labelled horizontal lines.
$ \unicode{x03B4} $
15Ncoll of c. fifth-to-eighth century individuals in the region of Wessex with animal base lines as labelled horizontal lines.

Violin plot of bone $ \unicode{x03B4} $
15Ncoll values of c. fifth-to-eighth century individuals in the region of Wessex, animal base lines top-bottom: marine fish, freshwater fish, cats and dogs, domestic fowl, pigs, domestic herbivores (cattle, sheep/goats), and wild herbivores as per Figures 5-7 above.
$ \unicode{x03B4} $
15Ncoll values of c. fifth-to-eighth century individuals in the region of Wessex, animal base lines top-bottom: marine fish, freshwater fish, cats and dogs, domestic fowl, pigs, domestic herbivores (cattle, sheep/goats), and wild herbivores as per Figures 5-7 above.

Detecting deviating cells cellmap for Wessex. Cells which are red have higher values than expected, blue are lower than expected, yellow are ‘normal’ and white are missing values for that variable.

Since isotopic analyses are used here to infer dietary intake, especially of animal protein, and therefore trophic position (how high you sit up the food chain), we need to consider the isotopic variability of the animals theoretically being consumed. This can differ greatly due to environmental factors and animal husbandry practices, despite sitting at the same trophic level, and can cause problems when we then try to make interpretations of human consumption without comparison with said animals. This is usually referred to as constructing an isotopic baseline, and allows for less erroneous estimations of dietary protein intake and trophic level relative to appropriate food sources.Footnote 79
Animal isotopic baselines were obtained by averaging species group bone $ \delta $
13Ccoll and
$ \delta $
13Ccoll and $ \delta $
15Ncoll values from England from the faunal data in the article ‘Multi-Tissue and Multi-Isotope (
$ \delta $
15Ncoll values from England from the faunal data in the article ‘Multi-Tissue and Multi-Isotope ( $ \delta $
13C,
$ \delta $
13C, $ \delta $
15N,
$ \delta $
15N, $ \delta $
18O and 87/86Sr) Data’.Footnote 80
Not all species were available for all regions analysed, so England-wide averages were used as broad proxies for trophic level. The values for the groups are summarised in Table 1.
$ \delta $
18O and 87/86Sr) Data’.Footnote 80
Not all species were available for all regions analysed, so England-wide averages were used as broad proxies for trophic level. The values for the groups are summarised in Table 1.
Isotopic averages of major faunal species groups in Early Medieval England, calculated from data in Leggett et al., ‘Multi-Tissue and Multi-Isotope ( $ \unicode{x03B4} $
13C,
$ \unicode{x03B4} $
13C, $ \unicode{x03B4} $
15N,
$ \unicode{x03B4} $
15N, $ \unicode{x03B4} $
18O and 87/86Sr) Data’.
$ \unicode{x03B4} $
18O and 87/86Sr) Data’.

Another helpful benchmark is isotopic data from modern hair samples with defined diets (see Table 2).Footnote 81 These values should be used with some caution, as comparing across tissues (i.e. here from hair keratin to bone collagen) and across time and space comes with many caveats.Footnote 82 From the background information given about the samples, the individuals in these studies do not appear to be on a diet comparable to what has been imagined for early medieval elites but are nonetheless a useful guide for where these early medieval individuals may sit within the nutritional literature.
Modern human hair sample $ \unicode{x03B4} $
13C and
$ \unicode{x03B4} $
13C and $ \unicode{x03B4} $
15N values for vegan, ovo-lacto vegetarian and omnivore diets and frequency of animal protein intake. Daily is defined as once or more per day, frequent as more than twice a week and intermediate consumption as once or twice weekly.Footnote 83
$ \unicode{x03B4} $
15N values for vegan, ovo-lacto vegetarian and omnivore diets and frequency of animal protein intake. Daily is defined as once or more per day, frequent as more than twice a week and intermediate consumption as once or twice weekly.Footnote 83

As our reference point for a possible ‘elite’ diet, we took the food list given in clause 70.1 of the laws of King Ine of Wessex. In our companion article, we estimate that fifty-five per cent of the calories contained in Ine’s list derived from animal protein, and if we assume a single loaf represents a single meal (which is probable) an individual portion would have been 4,140kcal. As noted above, the scale and proportions of these food lists lead us to believe that these texts should be understood as lists of provisions for occasional grand feasts, and not as the general food supplies that sustained itinerant royal households. But if they were what royal households routinely ate – and what was consumed in the many other elite households endowed with rights to royal ‘food renders’ – then we might expect to see more nutritionally related pathologies in high status individuals. We would also expect $ \delta $
15Ncoll values from collagenous tissues well in excess of 11‰ if these foods were eaten more than once a day, or even once daily alongside more simplistic plant-based meals for the majority of these individuals’ lives given modern and Late Medieval dietary data.Footnote 84
$ \delta $
15Ncoll values from collagenous tissues well in excess of 11‰ if these foods were eaten more than once a day, or even once daily alongside more simplistic plant-based meals for the majority of these individuals’ lives given modern and Late Medieval dietary data.Footnote 84
THE ISOTOPIC EVIDENCE FOR DIET AND SOCIAL STATUS IN C. FIFTH-TO-ELEVENTH CENTURY ENGLAND
We start here with total number of grave goods per grave from across England from the late Roman to Anglo-Norman period in fig. 1, and what is apparent is that not only are graves with over ten grave goods relatively rare among those that have been studied isotopically, but also that the trends in diet are more chronological than wealth based. There are shifts from the Roman to Early Medieval period, and from the late eighth century onwards, but this seems to have nothing to do with grave provisioning, and therefore possible wealth during life.
Fig. 2 shows the number of ‘foreign’ grave goods as designated by the original site reports. As mentioned above such items are relatively rare and could therefore be an additional indicator of status through the ability to obtain luxury items from overseas, or by having the means to travel distances with said items. Fig. 2 shows a very similar, but reduced, pattern to fig. 1 – mostly chronological shifts in diet, and nothing to suggest people with more grave goods or more exotic artefacts had higher $ \delta $
15Ncoll values, and therefore ate more animal protein.
$ \delta $
15Ncoll values, and therefore ate more animal protein.
The individuals that do have higher $ \delta $
15Ncoll values, and potentially also indicate some marine resource consumption, are generally those coloured yellow in fig. 1 and fig. 2. These individuals either have no grave goods or are part of the ‘unknown/NA individuals’ group who are mostly from the commingled and mass grave contexts of St John’s College Oxford and Ridgeway Hill, Weymouth; these individuals have been identified by the original investigators as of probable Scandinavian origin.Footnote 85
This suggests that diets in England were not dictated by social status or changed by the Fish Event Horizon in the Early Middle Ages,Footnote 86
but the high trophic level and marine dietary signatures evident above are the result of incoming people. Further work on re-investigating the Fish Event Horizon using human isotopic evidence is forthcoming and outside the scope of this work here.
$ \delta $
15Ncoll values, and potentially also indicate some marine resource consumption, are generally those coloured yellow in fig. 1 and fig. 2. These individuals either have no grave goods or are part of the ‘unknown/NA individuals’ group who are mostly from the commingled and mass grave contexts of St John’s College Oxford and Ridgeway Hill, Weymouth; these individuals have been identified by the original investigators as of probable Scandinavian origin.Footnote 85
This suggests that diets in England were not dictated by social status or changed by the Fish Event Horizon in the Early Middle Ages,Footnote 86
but the high trophic level and marine dietary signatures evident above are the result of incoming people. Further work on re-investigating the Fish Event Horizon using human isotopic evidence is forthcoming and outside the scope of this work here.
As with grave goods above, fig. 3 and fig. 4 demonstrate the same trends but with grave orientation and body position as well. The trends appear to be, once again, chronological, and not easily linked to any one aspect of burial practice. Other aspects of burial practices are too nuanced and variable to easily compare with the isotopic evidence as it currently stands and were therefore outside the scope of this current work (e.g. burial plot within a cemetery, or how close a burial is to the altar, internment type – stone-lined, ash-halo, in-the-green, various types of wooden structures, coffins, barrows etc.). This approach does not include some high-status graves such as bed burials as separate categories, which are marked out as exceptional by the quality rather than quantity of grave goods. However, as mentioned above, the isotopic evidence we have for these four burials does not indicate they had higher proportional intake of animal protein than other contemporary burials.Footnote 87 These are a rare phenomenon, and in the absence of definitively royal data, these proxies are our best starting point for furnished cemeteries.
Health and diet
If members of England’s early medieval elite ordinarily consumed the rich diet implied by food lists such as the one in Ine’s laws, we would perhaps expect to find evidence of associated health complications. People eating red-meat and animal-fat heavy diets, accompanied by regular alcohol consumption, are prone to develop conditions such as gout, type 2 diabetes, cardio-vascular disease, and cancer, generally decreasing their overall life expectancy.Footnote 88 Some of these health implications would only affect soft-tissue and are thus archaeologically invisible, however gout and excess protein should show up osteologically and isotopically respectively. Gout in particular is associated with purine-rich diets and excessive alcohol consumption and has been found to be associated with ‘rich’ diets in later medieval individuals.Footnote 89 Certainly early medieval people knew of gout and had remedies for it, with Gregory the Great and other early medieval ‘celebrities’ suffering from the condition, although diet was not always seen as a contributing factor in antiquity.Footnote 90 Constipation and other gut related issues might also be attributed to unbalanced diets, and as with gout, there are remedies for these in the leech books and other medical texts, however linking them to the diets described in the food renders is difficult as the causes for the ailments are rarely given.Footnote 91
We checked the dataset for correlations between pathological data, age at death, number of grave goods and 15N enrichment and could not find any clear links between these variables as the data stands. Of the 561 adults in England with bone $ \delta $
15Ncoll values above 10.3‰, 286 had pathological data recorded. The one individual with a possible gout diagnosis has a
$ \delta $
15Ncoll values above 10.3‰, 286 had pathological data recorded. The one individual with a possible gout diagnosis has a $ \delta $
15Ncoll value of 10.8‰ which is slightly above the 5‰ upper limit of trophic enrichment from faunal baselines (see below), but this is not sufficiently high to suggest an excess of protein compared to their contemporaries.Footnote 92
Since this case is medically inconclusive it is therefore hard to extrapolate from. Similarly, there were fifteen cases of osteomas (bone cancer) and they averaged
$ \delta $
15Ncoll value of 10.8‰ which is slightly above the 5‰ upper limit of trophic enrichment from faunal baselines (see below), but this is not sufficiently high to suggest an excess of protein compared to their contemporaries.Footnote 92
Since this case is medically inconclusive it is therefore hard to extrapolate from. Similarly, there were fifteen cases of osteomas (bone cancer) and they averaged $ \delta $
15Ncoll values of 9.5‰ (range of 7.5–13.5‰), again with no discernible link between social status (most individuals with osteomas had no grave goods), although twice as many women suffered from osteomas than men (ten females, five males). This is not to say that those with protein-heavy diets did not suffer from other forms of cancer, but unless it reached their skeleton it is invisible to this study. As diet is linked to oral health, we also searched for oral pathologies and links with
$ \delta $
15Ncoll values of 9.5‰ (range of 7.5–13.5‰), again with no discernible link between social status (most individuals with osteomas had no grave goods), although twice as many women suffered from osteomas than men (ten females, five males). This is not to say that those with protein-heavy diets did not suffer from other forms of cancer, but unless it reached their skeleton it is invisible to this study. As diet is linked to oral health, we also searched for oral pathologies and links with $ \delta $
15Ncoll values.Footnote 93
Out of the full adult dataset for England (n = 1793) there are 209 individuals with caries recorded and 232 individuals with dental calculus (often on the same individual). 54 of the 209 individuals with caries (25.84%) showed some 15N enrichment; similarly, 62 of the 232 individuals (26.72%) with dental calculus had
$ \delta $
15Ncoll values.Footnote 93
Out of the full adult dataset for England (n = 1793) there are 209 individuals with caries recorded and 232 individuals with dental calculus (often on the same individual). 54 of the 209 individuals with caries (25.84%) showed some 15N enrichment; similarly, 62 of the 232 individuals (26.72%) with dental calculus had $ \delta $
15Ncoll values above 10.3‰. This suggests these oral pathologies cannot strictly be linked to 15N enrichment.
$ \delta $
15Ncoll values above 10.3‰. This suggests these oral pathologies cannot strictly be linked to 15N enrichment.
Sulphur or amino acid specific isotopic studies would help to distinguish between different causes for 15N enrichment (e.g. stress, excess protein and different protein sources) more effectively but these kinds of analyses are less common than carbon and nitrogen studies, however in coming years more light may be shed on this.Footnote 94 As the data currently stands there is no palaeopathological evidence for many individuals suffering from diseases associated with rich diets as those described in the food render texts, as were experienced by other early and later Medieval individuals eating excessively rich diets;Footnote 95 nor can we link any such pathologies with isotopic enrichment or funerary status.
Diet and Social Status in c. fifth-to-eighth century England: the isotopic evidence
Removing the Roman and definitively Viking Age and Anglo-Scandinavia/Norman individuals produces fig. 5. This demonstrates that for the whole of England between the fifth and eighth centuries AD there is a tighter range in bone $ \delta $
13C and
$ \delta $
13C and $ \delta $
15N values relative to the figures above, as evidenced by the marginal box plots, with tails of individuals for both elements in higher and lower values beyond the interquartile ranges. There is a spread of over 14‰ in
$ \delta $
15N values relative to the figures above, as evidenced by the marginal box plots, with tails of individuals for both elements in higher and lower values beyond the interquartile ranges. There is a spread of over 14‰ in $ \delta $
15N values, which is much larger than we would expect if everyone was consuming at roughly the same trophic level. As this dataset spans several hundred years and from the southwest of England up to the northeast, variation could be due to any number of factors such as regional variation in isotopic baselines (different geologies or grazing grasses, sea spray etc.), regional variation in foodways, and diachronic changes to diets and farming techniques altering baselines (e.g. manuring). We try to filter out some of these effects at the end of this section by focusing on just Wessex, but this larger dataset remains valuable for its size (n = 1463). It just requires careful interpretation.
$ \delta $
15N values, which is much larger than we would expect if everyone was consuming at roughly the same trophic level. As this dataset spans several hundred years and from the southwest of England up to the northeast, variation could be due to any number of factors such as regional variation in isotopic baselines (different geologies or grazing grasses, sea spray etc.), regional variation in foodways, and diachronic changes to diets and farming techniques altering baselines (e.g. manuring). We try to filter out some of these effects at the end of this section by focusing on just Wessex, but this larger dataset remains valuable for its size (n = 1463). It just requires careful interpretation.
Given our assumptions about elite diets drawn from the literature and food render texts themselves, we should consider not only animal baselines but also as a point of comparison animal protein variation in modern diets as outlined in Table 1 and Table 2 above. Figs 5–8 have the faunal nitrogen averages from England from Table 1 overlaid, and there are several key observations we can draw from this.
This suggests that domestic fowl, cats, and dogs during the period are being fed broadly similar diets to humans, with possibly some supplementary scavenging/hunting due to the similarity in their isotopic signatures which is supported by other studies.Footnote 96
This means that these animals are poor indicators of higher trophic levels but useful for understanding aspects of companion animals and farming practices. Comparing the human values to the herbivore baselines and given the 14.1‰ spread in $ \delta $
15Ncoll values, it appears that there is a wide variety of diets being consumed across England in this period, with significant differences in animal protein consumption.
$ \delta $
15Ncoll values, it appears that there is a wide variety of diets being consumed across England in this period, with significant differences in animal protein consumption.
We took the assumed 5‰ upper limit of trophic level enrichment (the maximum increase you might expect to see when you step up the food chain, see above) for $ \delta $
15Ncoll
Footnote 97
and applied it to the combined herbivore average here (5.34‰) we get a rough benchmark of 10.34‰ above which we can be satisfied people are eating moderate to high levels of animal protein in their diets. For the overall adult dataset this gives us 418 individuals (28.6% of the total). Conversely this means over seventy per cent of individuals are eating negligible to moderate animal protein. The temptation at this point might be to assume that the 418 individuals with high
$ \delta $
15Ncoll
Footnote 97
and applied it to the combined herbivore average here (5.34‰) we get a rough benchmark of 10.34‰ above which we can be satisfied people are eating moderate to high levels of animal protein in their diets. For the overall adult dataset this gives us 418 individuals (28.6% of the total). Conversely this means over seventy per cent of individuals are eating negligible to moderate animal protein. The temptation at this point might be to assume that the 418 individuals with high $ \delta $
15Ncoll values represent a social elite, defined in part by their privileged access to animal-based foodstuffs.
$ \delta $
15Ncoll values represent a social elite, defined in part by their privileged access to animal-based foodstuffs.
However, when we look more closely it becomes apparent that this interpretation is not viable. Of these 418 individuals 191 are from East Anglia, which is known to have 15N enrichment compared with the rest of the country, presumably due to a mixture of the wetter Fenland environments causing isotopic enrichment at the base of the food chain and a regional preference for freshwater fish given said environs (e.g. Westfield Farm ElyFootnote 98
), amongst other factors.Footnote 99
This regional 15N enrichment seems to have been what skewed Hull and O’Connell’s original conclusions of early medieval diet in England consisting of moderate to high protein intake,Footnote 100
since the majority of Hull’s data was from East Anglia with little comparative data to draw on at the time.Footnote 101
It is probable that many of the other burials with $ \delta $
15Ncoll values over this threshold are actually from after this period, appearing in this dataset because of issues with dating. Ninety-nine burials are either definite or probable Scandinavians or individuals who likely date to the eighth-to-eleventh centuries but were included here due to the ambiguity of dates (either there are none, they have very broad radiocarbon estimations or there is a very broad chronological designation for the site). These include thirty-eight skeletons from St John’s College Oxford (Scandinavian origins),Footnote 102
ten burials from Repton (predominantly war dead from the Viking Great Army but some possible earlier monastic skeletons),Footnote 103
twenty-nine skeletons from the cemetery at Black Gate Newcastle (presumed to date to the eleventh-to-thirteenth centuries but some burials date to the seventh-to-ninth),Footnote 104
and twenty-two individuals from Priory Orchard Godalming which has a similar date range and lack of chronological resolution to Black Gate.Footnote 105
Five interesting burials in this group are from Bishopstone in East Sussex.Footnote 106
Bishopstone, whilst within our chronological range, is definitively Christian (it is an early churchyard cemetery) and the burials lack grave goods, but they are assumed to be elites or their retainers based in and around the manor. Zooarchaeological evidence from Bishopstone and its contemporary in Kent (Lyminge) suggests that fish became a larger part of these elite sites after Christianisation, around the same time burial started in the churchyard, and the manor moved location.Footnote 107
So it is therefore hard to attribute the 15N enrichment at Bishopstone purely to status, although undoubtedly that played a role, when there is a clear shift in all aspects of life there in the late-seventh to early-eighth century linked to Christianisation. The other burials above this trophic boundary are scattered across wide ranging sites with no particular patterns in their chronology or gender (ignoring the Viking or monastic sites with majority males) and most of these individuals have no or very few grave goods which is clear in fig. 5 and fig. 6.
$ \delta $
15Ncoll values over this threshold are actually from after this period, appearing in this dataset because of issues with dating. Ninety-nine burials are either definite or probable Scandinavians or individuals who likely date to the eighth-to-eleventh centuries but were included here due to the ambiguity of dates (either there are none, they have very broad radiocarbon estimations or there is a very broad chronological designation for the site). These include thirty-eight skeletons from St John’s College Oxford (Scandinavian origins),Footnote 102
ten burials from Repton (predominantly war dead from the Viking Great Army but some possible earlier monastic skeletons),Footnote 103
twenty-nine skeletons from the cemetery at Black Gate Newcastle (presumed to date to the eleventh-to-thirteenth centuries but some burials date to the seventh-to-ninth),Footnote 104
and twenty-two individuals from Priory Orchard Godalming which has a similar date range and lack of chronological resolution to Black Gate.Footnote 105
Five interesting burials in this group are from Bishopstone in East Sussex.Footnote 106
Bishopstone, whilst within our chronological range, is definitively Christian (it is an early churchyard cemetery) and the burials lack grave goods, but they are assumed to be elites or their retainers based in and around the manor. Zooarchaeological evidence from Bishopstone and its contemporary in Kent (Lyminge) suggests that fish became a larger part of these elite sites after Christianisation, around the same time burial started in the churchyard, and the manor moved location.Footnote 107
So it is therefore hard to attribute the 15N enrichment at Bishopstone purely to status, although undoubtedly that played a role, when there is a clear shift in all aspects of life there in the late-seventh to early-eighth century linked to Christianisation. The other burials above this trophic boundary are scattered across wide ranging sites with no particular patterns in their chronology or gender (ignoring the Viking or monastic sites with majority males) and most of these individuals have no or very few grave goods which is clear in fig. 5 and fig. 6.
Those individuals at the very top of the tight splurge in fig. 5 above the freshwater fish line at 11.38‰ account for 9.8% (n = 143/1463) of the total adult data for England dated to roughly the fifth-to-eighth centuries. Many of these individuals have already been accounted for above with the major cemeteries contributing to this group being Westfield Farm Ely (n = 19), St John’s College Oxford (n = 32), Caister-by-Yarmouth (n = 16) and Black Gate Newcastle (n = 11). Westfield Farm, being on the isle of Ely, is presumed to have such high $ \delta $
15Ncoll values due to high freshwater fish (eels included) consumption;Footnote 108
Caister-by-Yarmouth is assumed to be an early monastic centre with adherents consuming more aquatic resources than the laity;Footnote 109
and Black Gate and St John’s Oxford were mentioned in more detail above. The other burials which are probable or definite incoming Scandinavians with ‘fishy’ diets in this group are five individuals from Repton, one from Coppergate in York and one burial from Masham in Yorkshire.Footnote 110
Like Caister-by-Yarmouth the interred people at South Acre (n = 7) and Burgh Castle (n = 8) are also assumed to be early Christian monastic adherents.Footnote 111
For the rest of the individuals with
$ \delta $
15Ncoll values due to high freshwater fish (eels included) consumption;Footnote 108
Caister-by-Yarmouth is assumed to be an early monastic centre with adherents consuming more aquatic resources than the laity;Footnote 109
and Black Gate and St John’s Oxford were mentioned in more detail above. The other burials which are probable or definite incoming Scandinavians with ‘fishy’ diets in this group are five individuals from Repton, one from Coppergate in York and one burial from Masham in Yorkshire.Footnote 110
Like Caister-by-Yarmouth the interred people at South Acre (n = 7) and Burgh Castle (n = 8) are also assumed to be early Christian monastic adherents.Footnote 111
For the rest of the individuals with $ \delta $
15Ncoll values above 11.38‰ we could find no common attributes in their demography or funerary treatment to suggest a link between social status and diet as seen through stable isotope analysis. If anything, regionality and chronology play more of a role with 15N enrichment in Early Medieval England.
$ \delta $
15Ncoll values above 11.38‰ we could find no common attributes in their demography or funerary treatment to suggest a link between social status and diet as seen through stable isotope analysis. If anything, regionality and chronology play more of a role with 15N enrichment in Early Medieval England.
Fig. 6 demonstrates more clearly the lack of relationship between 15N enrichment and wealth/social status as defined through grave good provisioning. The mean $ \delta $
15Ncoll values for the grave good groups are within 1‰ of each other (less than one trophic level which is generally assumed to be 3–5‰) with the highest being 10.3‰ and the lowest at 9.3‰. What is even more apparent here is that the individuals with the highest
$ \delta $
15Ncoll values for the grave good groups are within 1‰ of each other (less than one trophic level which is generally assumed to be 3–5‰) with the highest being 10.3‰ and the lowest at 9.3‰. What is even more apparent here is that the individuals with the highest $ \delta $
15Ncoll values have at most 4 grave goods.
$ \delta $
15Ncoll values have at most 4 grave goods.
These averages are similar to the daily protein consumption data for both ovo-lacto vegetarians and omnivores in Table 2. As mentioned above, it is therefore likely that most individuals, regardless of social status, ate some form of animal protein daily but this does not equate to one or more meals a day at over fifty per cent animal protein of the kind suggested by Ine’s laws and similar texts.
Case Study: Early Medieval Wessex
We then focused on one region to eliminate some of the noise in the data (such as regional variation) and chose Wessex both because it is the origin of our earliest food list in Ine’s laws and because it saw fewer Scandinavian settlers in the ninth and tenth centuries, reducing the risk of our sample including misdated later burials that reflect imported foodways. Wessex is defined here as early medieval cemeteries clustering in the modern counties of Dorset, Hampshire, Somerset, Surrey, West Sussex, and Wiltshire. Fig. 7 shows a more constrained cluster than the whole of England in Fig. 5. Diets in Wessex show less 15N enrichment than the larger dataset with most individuals having $ \delta $
15Ncoll values between the herbivore baselines and the fowl/cat/dog base lines, indicating negligible to moderate animal protein consumption. There are thirty-five individuals with
$ \delta $
15Ncoll values between the herbivore baselines and the fowl/cat/dog base lines, indicating negligible to moderate animal protein consumption. There are thirty-five individuals with $ \delta $
15Ncoll values above the trophic benchmark of 10.34‰, twenty-two of which are buried at Priory Orchard Godalming, three at Beckery Chapel, three at Worthy Park Kingsworthy, three at Winnall II (Winchester), two at Alton, and one each at Droxford and Portway Andover. Only one of these burials, grave 50 at Worthy Park, has more than four grave goods (five to be exact). One of these items is a spear, and he is the only weapons burial in this higher
$ \delta $
15Ncoll values above the trophic benchmark of 10.34‰, twenty-two of which are buried at Priory Orchard Godalming, three at Beckery Chapel, three at Worthy Park Kingsworthy, three at Winnall II (Winchester), two at Alton, and one each at Droxford and Portway Andover. Only one of these burials, grave 50 at Worthy Park, has more than four grave goods (five to be exact). One of these items is a spear, and he is the only weapons burial in this higher $ \delta $
15Ncoll range.
$ \delta $
15Ncoll range.
Palaeopathological data was not available for all individuals but aside from caries and other oral pathologies which are relatively common in this period, there is nothing particularly unusual or striking to link these thirty-five individuals in their pathologies. What is striking is that in Wessex most of these individuals are men, with little to suggest that they are incomers importing more protein rich diets with them as for some of the sites mentioned above. However, Beckery Chapel and Priory Orchard Godalming are both Christian burial grounds associated with churches. Therefore, they might be reflecting Christianised diets with fish consumption (probably freshwater given their $ \delta $
13Ccoll values) causing 15N enrichment. Furthermore, these men with 15N enrichment could be ecclesiastics, or perhaps this suggests some social differentiation in diet in Wessex based on gender. Of these thirty-five individuals only two have
$ \delta $
13Ccoll values) causing 15N enrichment. Furthermore, these men with 15N enrichment could be ecclesiastics, or perhaps this suggests some social differentiation in diet in Wessex based on gender. Of these thirty-five individuals only two have $ \delta $
15Ncoll values above the freshwater fish line (11.38‰) – grave 17B from Worthy Park and skeleton 1023 from Priory Orchard Godalming. Both are osteologically male and the Priory Orchard individual has no grave goods, whereas the Worthy Park individual has three (knife, key/girdle hanger and a Roman coin); this with the chronological distance between the two (500–570AD for Worthy Park and 770–1150AD for Priory Orchard) suggests their isotopic enrichment is due to different factors and not a straightforward interpretation of status.
$ \delta $
15Ncoll values above the freshwater fish line (11.38‰) – grave 17B from Worthy Park and skeleton 1023 from Priory Orchard Godalming. Both are osteologically male and the Priory Orchard individual has no grave goods, whereas the Worthy Park individual has three (knife, key/girdle hanger and a Roman coin); this with the chronological distance between the two (500–570AD for Worthy Park and 770–1150AD for Priory Orchard) suggests their isotopic enrichment is due to different factors and not a straightforward interpretation of status.
Fig. 8 shows a clear drop in $ \delta $
15Ncoll values with increasing numbers of grave goods which adds further weight to our hypothesis that the driving factor for 15N enrichment in early medieval England is not (purely) social status as viewed through funerary treatment. Changes through time to do with Christianisation and other socio-economic factors are instead probable driving factors.
$ \delta $
15Ncoll values with increasing numbers of grave goods which adds further weight to our hypothesis that the driving factor for 15N enrichment in early medieval England is not (purely) social status as viewed through funerary treatment. Changes through time to do with Christianisation and other socio-economic factors are instead probable driving factors.
Finally, we sifted the Wessex burials dataset for outliers. Rather than doing this subjectively, risking unconsciously introducing selection biases, we used the DetectingDeviatingCells (DDC) algorithm to detect outlying cells in the numeric data available (e.g. isotopic values or number of grave goods) not excluding children and infants here as we did above to avoid selection bias in the algorithm. DDC was run using the R package cellWise.Footnote 112 DDC as run by cellWise can only be used on numeric data, and it excludes individuals from analysis who have over fifty per cent missing data as well as any variables which do not have much variation. It uses the whole of the data matrix to establish what cells have higher or lower values than expected given all the other data for an observation (here an individual burial). It produces a graphic called a cell map (see Fig. 9) with red cells indicating higher than predicted values, blue cells lower than predicted, yellow cells are as predicted, and orange and purple cells are scales between the extremes. White cells indicate missing values. If individuals are flagged with black or grey dots this signals them as an outlier for the whole matrix due to having a high number of flagged cells. Therefore, DDC can tell us which burials stand out for one or more variables given the data for, in this case, their region.
The DDC cellmap presented in fig. 9 further demonstrates the lack of correlation between number of grave goods and diet (and stature) for Wessex. Rarely are individuals flagged by the algorithm with unexpected values for more than one variable. The two individuals who have higher than expected numbers of grave goods for their contexts and unexpected dietary values are LH023 (grave 1640) and LH031 (grave 118) – burials from the Late Roman cemetery at Lankhills, Winchester.Footnote 113
Grave goods are uncommon in this cemetery, and more generally in Late Roman graves, so these two individuals having four objects each is noteworthy. LH023 is an older female with significant pathologies throughout her skeleton, who was buried in a coffin with four different Roman coins of fourth-century date. Her bone $ \delta $
13Ccoll value (but not
$ \delta $
13Ccoll value (but not $ \delta $
15Ncoll) is flagged as being higher than expected at –18.4‰ and might suggest she consumed marine and/or C4 resources during life which stands out amongst the rest of the region with predominantly C3 signals. LH031 is an infant who was buried in a coffin with two bone bracelets, a copper alloy bracelet and a necklace of glass and amber beads. This infant’s
$ \delta $
15Ncoll) is flagged as being higher than expected at –18.4‰ and might suggest she consumed marine and/or C4 resources during life which stands out amongst the rest of the region with predominantly C3 signals. LH031 is an infant who was buried in a coffin with two bone bracelets, a copper alloy bracelet and a necklace of glass and amber beads. This infant’s $ \delta $
15Ncoll values are flagged as being higher than expected at 12.2‰. Due to the age of the individual (c. 1–1.5 years old) 15N enrichment is likely due to one or more factors including breastfeeding (i.e. trophic enrichment as well as 15N enrichment of breast milk), physiological differences in infant metabolism, and physiological stress (nutritional or otherwise) which is linked to the osteological paradox of a dead infant – they were clearly not a healthy baby to be deceased in infancy.Footnote 114
Therefore despite their relatively rich funerary treatment we cannot take their 15N enrichment at face value due to these complicating biological factors.
$ \delta $
15Ncoll values are flagged as being higher than expected at 12.2‰. Due to the age of the individual (c. 1–1.5 years old) 15N enrichment is likely due to one or more factors including breastfeeding (i.e. trophic enrichment as well as 15N enrichment of breast milk), physiological differences in infant metabolism, and physiological stress (nutritional or otherwise) which is linked to the osteological paradox of a dead infant – they were clearly not a healthy baby to be deceased in infancy.Footnote 114
Therefore despite their relatively rich funerary treatment we cannot take their 15N enrichment at face value due to these complicating biological factors.
Other individuals flagged by DDC with unexpected isotopic signatures are listed in Table 3. None of these individuals were flagged for other variables, and most are late Roman individuals with similar suggestions of marine and/or C4 resource consumption as for LH023. Worthy Park grave 17B and Priory Orchard skeleton 1023 have been discussed above. Worthy Park grave 68 is interesting due to her lower $ \delta $
13Ccoll value combined with a relatively low
$ \delta $
13Ccoll value combined with a relatively low $ \delta $
15Ncoll value which is similar to the pig, vegan and some of the ovo-lacto vegetarian values in Table 1 and Table 2 above, suggesting she had a diet more reliant on plant-based protein.
$ \delta $
15Ncoll value which is similar to the pig, vegan and some of the ovo-lacto vegetarian values in Table 1 and Table 2 above, suggesting she had a diet more reliant on plant-based protein.
Individuals from fig. 9 flagged by the DDC algorithm for only dietary results.

The upshot of this is that no post-Roman burials (highly furnished or otherwise) from the Wessex region were flagged for both number of grave goods and nitrogen isotope values, and the majority of dietary deviation flagged was C4/marine consumption signals from the Roman period. DDC flagged many burials with higher-than-expected grave goods but there was no statistical association between rich grave provisioning and diet in these data.
CONCLUSIONS
What we have demonstrated here is a general lack of elite isotopic differentiation in $ \delta $
13Ccoll and
$ \delta $
13Ccoll and $ \delta $
15Ncoll values. From the data available it is implausible that the individuals with the highest
$ \delta $
15Ncoll values. From the data available it is implausible that the individuals with the highest $ \delta $
15Ncoll values represent early medieval elites. No matter how this was investigated (gender, grave goods, body position etc.) there was a lack of correlation between social status in death and isotopic signals for diet. There is some suggestion that, regionally, gender differences might be more pronounced, as we have found with Wessex; however, excavation and sampling biases cannot be ruled out due to uneven numbers of females and males with available isotopic data.
$ \delta $
15Ncoll values represent early medieval elites. No matter how this was investigated (gender, grave goods, body position etc.) there was a lack of correlation between social status in death and isotopic signals for diet. There is some suggestion that, regionally, gender differences might be more pronounced, as we have found with Wessex; however, excavation and sampling biases cannot be ruled out due to uneven numbers of females and males with available isotopic data.
There are certainly many caveats to be aware of here: sampling issues, problems with chronology, difficulties with identifying elites archaeologically, to name a few. But despite these caveats none of the analyses showed any clear relationships between funerary practices, social status and diet. Some chronological differences are, however, visible where more than one time period is present for a funerary variable. This suggests that social status and wealth as judged by funerary practice does not correlate with significantly higher protein consumption or eating different resources (e.g. marine fish), in the periods where furnished burial was still the norm. The well-known changes in burial practice from the end of the Roman period to churchyard burials in the eighth/ninth centuries are clearly shown in this smaller subset of burials with stable isotope data.Footnote 115 It supports and expands the findings of Hannah and Hull that there is no link between social identity/status and dietary isotopes for this period but contradicts the smaller scale correlations seen at sites such as Berinsfield, which reflect researchers actively hunting for variation in samples too small to sustain their conclusions.Footnote 116 We suggest that the social hierarchy seen in early medieval cemeteries and the foodways of these communities may be biochemically ephemeral, played out through politics, material culture and specific kinds of food (e.g. special cuts or types of animal, fruits etc.) rather than an increased amount of protein or environmentally different resources (e.g. marine foods) that would show up in isotopic data. There is some zooarchaeological evidence from high status sites of marine fish (Bishopstone and Lyminge), which it is believed are linked to the Christianisation of these sites, as well as their higher social status (in the case of Lyminge moving from great hall complex to a minster).Footnote 117 The fact that decline in furnished burial, the increase in fish consumption, calendarisation of Christian feast days all coincide makes it nearly impossible to link burial practice, social status and diet for these sites – especially when we often cannot associate a cemetery with any given settlement.Footnote 118 It is a case of correlation does not equal causation.
The isotopic evidence as it stands gives a picture of fifth-to-eighth-century diets which are more homogeneous than has commonly been supposed, where what people ate was more dictated by regional trends (environmental differences as well as regionally different foodways) and seasonality than purely by social status. This is perhaps unsurprising in many ways, yet narratives of social stratification causing drastically different diets have been persistent in the literature.
Across these two companion articles, we have demonstrated both the power of a multi-disciplinary approach and the potential for further bioarchaeological research which will only add to our knowledge of the interaction between foodways and social status, and the broader socio-economic implications thereof. With improvements in methodology, technology, statistics and physiological research, reassessments of the isotopic data on a broader scale with more nuanced interpretations are possible.
Palaeoproteomics is now coming of age, and alongside aDNA and lipids, these emerging data are beginning to fill the gaps in our archaeological knowledge of agriculture, food, cookery, cuisine, and diet in this period. It is now possible to look at the cookery contexts and food crusts themselves to add more dimensions to the story.Footnote 119 As these datasets grow, our understanding of the social and economic implications of food will only deepen.
The cautious conclusion we draw here is that we need to rethink the idea that the food lists we find in the laws of Ine and associated texts represent the institutionalised ‘expropriation of the poor to feed the powerful’.Footnote 120
The assumption that the food supplies listed constitute blueprints for everyday elite diets is not consistent with the bioarchaeological evidence as it currently stands. People were eating animal protein to varying degrees, but those with the highest $ \delta $
15Ncoll values seem to be eating more fish because they were Scandinavian incomers or observing religious dietary restrictions, and not because they were routinely eating the remarkably meat-heavy diets those texts imply.Footnote 121
$ \delta $
15Ncoll values seem to be eating more fish because they were Scandinavian incomers or observing religious dietary restrictions, and not because they were routinely eating the remarkably meat-heavy diets those texts imply.Footnote 121
SUPPLEMENTARY MATERIALS
To view supplementary material for this article, please visit http://doi.org/10.1017/S0263675122000072.


 Open access